. 2023 Dec 11;12:e89822. doi: 10.7554/eLife.89822

Figure 5. Systemic administration of Activin A antibody delays mouse fracture healing.

(A) Representative Safranin O/Fast green staining images of fracture calluses at days 5, 7, 10, and 14 post fracture. Mice received subcutaneous injections of control IgG2b isotype or neutralizing monoclonal antibody against Activin A (nActA.AB, 10 mg/kg) twice a week after fracture. Scale bar, 1 mm. (B) Callus area, cartilage area, and bone area were quantified at indicated time points. n = 4–7 mice/time point. (C) Measurement of fracture healing scores at 6 weeks post fracture. n = 10 mice/group. (D) Mechanical testing was performed on bones at 6 weeks post fracture. n = 10 mice/group. (E) Immunofluorescence images of pSMAD2 and αSMA in fracture calluses of control (isotype) and nActA.AB-treated mice at day 7 post fracture. White arrows point to pSMAD2+αSMA+ cells and yellow arrows point to pSMAD2+αSMA− cells. Scale bar, 500 μm (low mag), 50 μm (high mag). (F) Percentages of pSMAD2+ and αSMA+ cells in fracture calluses and pSMAD2+ cells within the αSMA+/− populations were quantified. n = 3 mice/group. (G) qRT-PCR analyses of Acta2 and Inhba expression in day 7 callus from 2-month-old mice treated with nActA.AB versus isotype control. n = 4 mice/group. Data are expressed as means ± SD and analyzed by unpaired two-tailed t-test.

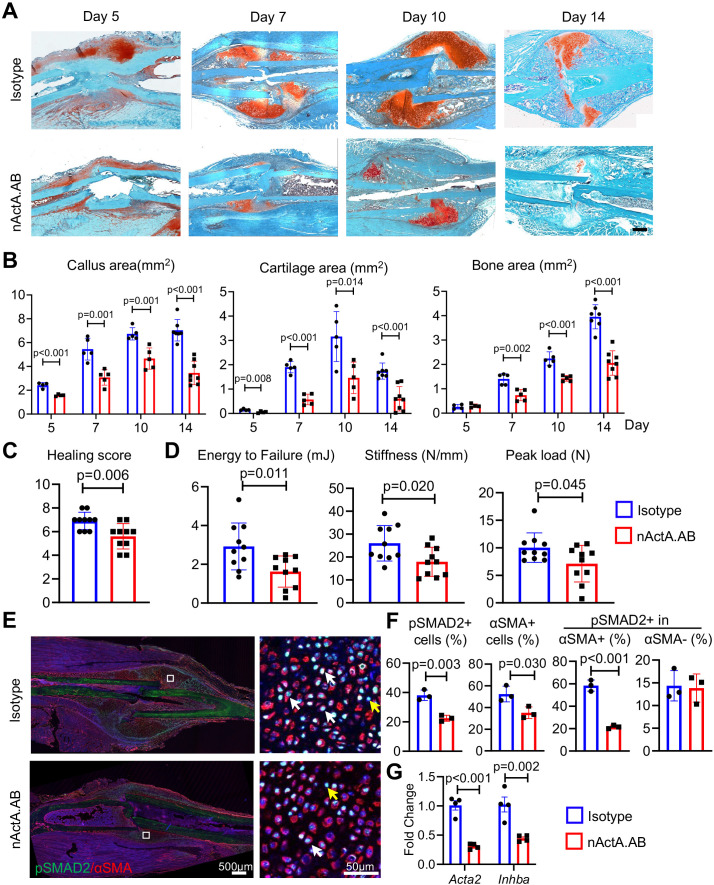
Figure 5—source data 1. Source data for Figure 5B.
Figure 5—source data 2. Source data for Figure 5C.
Figure 5—source data 3. Source data for Figure 5D.
Figure 5—source data 4. Source data for Figure 5F.
Figure 5—source data 5. Source data for Figure 5G.

Figure 5.

Figure 5—figure supplement 1. Immunological inhibition of Activin A impedes fracture healing.

Figure 5—figure supplement 1.

(A) Representative micro-computed tomography (μCT) images of fracture calluses on days 7, 10, 14, and 42 post fracture. Mice received injections of control IgG2b isotype antibody or neutralizing monoclonal antibody against Activin A (nActA.AB, 10 mg/kg) twice a week after fracture. Scale bar, 1 mm. (B) Callus volume, bone volume and bone volume fraction were measured. n = 4–10 mice/time point/group. Data are expressed as means ± SD and analyzed by unpaired two-tailed t-test.
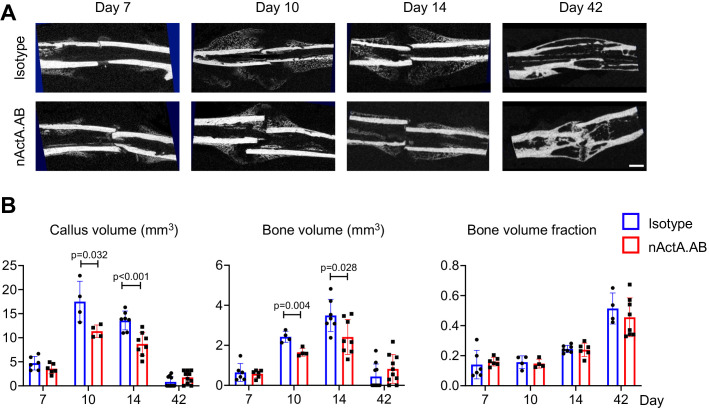
Figure 5—figure supplement 1—source data 1. Source data for Figure 5—figure supplement 1B.
Figure 5—figure supplement 2. Immunological inhibition of Activin A does not affect normal bone homeostasis.

Figure 5—figure supplement 2.

(A) Representative 3D micro-computed tomography (μCT) images of trabecular bone of contralateral uninjured femur at 6 weeks post fracture. Mice received injections of control IgG2b isotype antibody or neutralizing monoclonal antibody against Activin A (nActA.AB, 10 mg/kg) twice a week after fracture. Scale bar, 100 μm. (B) μCT measurement of femoral trabecular bone structural parameters: bone volume fraction (BV/TV), trabecular number (Tb.N), trabecular thickness (Tb.Th), and trabecular separation (Tb.Sp). n = 8 mice/group. (C) Representative 3D μCT images of cortical bone of contralateral uninjured femur at 6 weeks post fracture. Scale bar, 100 μm. (D) μCT measurement of femoral cortical bone structural parameters: periosteal perimeter (Ps.Pm), endosteal perimeter (Ec.Pm), cortical bone thickness (Ct.Th), and cortical bone area (Ct.Ar). n = 8 mice/group. Data are expressed as means ± SD and analyzed by unpaired two-tailed t-test.
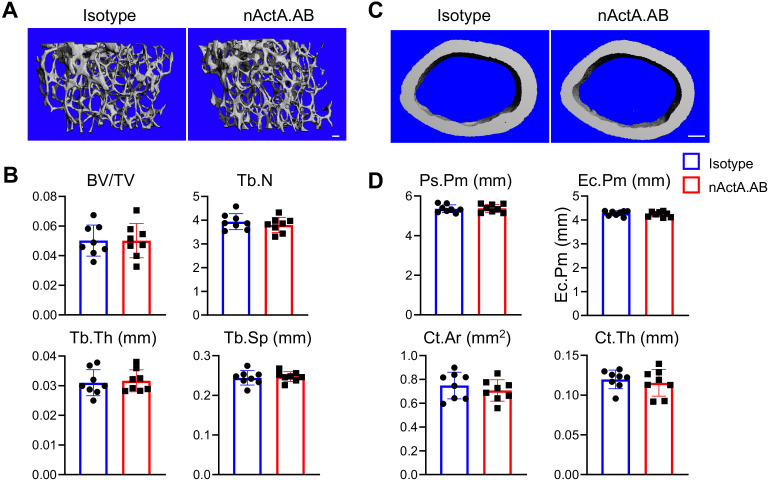
Figure 5—figure supplement 2—source data 1. Source data for Figure 5—figure supplement 2B.
Figure 5—figure supplement 2—source data 2. Source data for Figure 5—figure supplement 2D.