

Abstract
INTRODUCTION:
Whether APOE’s involvement in lipid metabolism contributes to Alzheimer’s disease (AD) risk remains unknown.
METHODS:
Incident probable dementia and cognitive impairment (probable dementia+mild cognitive impairment) were analyzed in relation to baseline serum lipids (total, LDL, HDL, and non-HDL cholesterol, total-to-HDL, LDL-to-HDL, remnant cholesterol, and triglycerides) using Mendelian randomization in 5,358 postmenopausal women from the Women’s Health Initiative Memory Study. We also examined associations of baseline dietary cholesterol and fat with lipids based on APOE status.
RESULTS:
After an average of 11.13 years, less favorable lipid levels related to greater dementia and cognitive impairment risk. Dementia (odds ratio[OR]=3.13; 95% confidence interval[CI]:2.31–4.24) and cognitive impairment (OR=2.38; 95% CI:1.85–3.06) risk were greatest in relation to higher remnant cholesterol levels. Greater cholesterol consumption related to poorer lipids in APOE4+ compared to APOE3 carriers.
DISCUSSION:
APOE4+ carriers consuming more cholesterol had less favorable lipids, which were associated with greater dementia and cognitive impairment risk.
Keywords: Alzheimer’s disease, mild cognitive impairment, dementia, cholesterol, Apolipoprotein E, diet, Mendelian randomization, Women’s Health Initiative Memory Study
1 |. Background
The Apolipoprotein E (APOE) gene is the strongest genetic risk factor for Alzheimer’s disease (AD),1,2 which accounts for 60–80% of all dementia cases.3 The APOE ε4 (APOE4) allele confers increased risk compared to ε3 (APOE3) homozygotes, while ε2 (APOE2) is protective.1,2 However, specific mechanisms and neuropathological processes underlying APOE4-associated dementia risk remain elusive.2 The increasing prevalence of dementia poses a substantial burden to the healthcare system, underscoring the need for preventive efforts.3,4 Clarifying APOE’s role in dementia risk and its interactions with modifiable lifestyle factors may provide important insights into prevention strategies.
APOE plays a major role in lipid transport and metabolism,2,5 accounting for an estimated 7% of phenotypic variance and 14% of polygenic variance in total serum cholesterol.6 APOE also contributes an estimated 1–8.3% of phenotypic variance and 16% of genetic variance in LDL cholesterol.5,6 APOE4 carriers tend to have higher total and LDL cholesterol and lower HDL cholesterol levels compared to non-carriers.2,5,7,8 APOE4 carriers consuming diets high in saturated fat, total fat, and cholesterol have the least favorable lipid profiles, and conversely greatest lipid improvements when they decrease intake of the same compared to non-carriers.5,9,10 Higher total cholesterol levels are associated with an increased risk of developing AD.11,12 AD patients also tend to have higher total and LDL and lower HDL cholesterol levels compared to controls.13–16 Additionally, higher total and LDL cholesterol levels are associated with greater deposition of AD neuropathological hallmarks in the brain.16,17 Given that APOE4 carriers’ lipids are most responsive to diet,5,9,10 these findings suggest that lipid management through dietary modification could potentially reduce AD risk.
The literature, however, does not consistently report greater dementia risk in relation to poorer blood lipid levels.18,19 Few studies have assessed for causality between unfavorable lipid profiles and dementia risk. Additionally, associations between diet and APOE genotype in relation to blood lipids have been studied primarily in relatively small clinical samples. To address these shortcomings in the literature, we investigated relationships between dietary cholesterol and fat intake, blood lipids, APOE status, and dementia incidence in the Women’s Health Initiative (WHI) Memory Study (WHIMS).20,21 WHIMS, a randomized controlled clinical trial of hormone therapy, offers a well-screened sample of postmenopausal women with documented dementia incidence which is larger than those used in many published studies examining the aforementioned relationships. We first aimed to determine whether APOE moderates relationships between dietary cholesterol and fat consumption and blood lipid levels, and second, whether lipid levels are associated with dementia risk. Lastly, we performed Mendelian randomization to evaluate potential causality between blood lipids and dementia incidence, with APOE as a genetic instrument for lipid levels. Given APOE’s largely established associations with blood lipids and dementia, using APOE as a genetic instrument in Mendelian randomization minimizes issues of confounding and reverse causation. This analysis is therefore uniquely positioned to indicate whether blood lipids may have a causal influence on dementia risk.
2 |. Methods
2.1 |. Participants
WHIMS,20,21 an ancillary study to the WHI hormone therapy clinical trial,22 was designed to investigate effects of hormone therapy on incident cognitive impairment in women 65 years of age or older.20,21 The present sample consisted of WHIMS participants who provided baseline dietary information and serum lipid profiles, were genotyped for APOE, and had follow-up adjudicated diagnosis of probable dementia, mild cognitive impairment (MCI), or no impairment (N=5,358). All women were initially free of cognitive impairment based on Modified Mini Mental State Exam (3MS) scores at baseline.20,21 Written informed consent was provided by all participants, and approval was obtained from the Institutional Review Board at each clinic site.
2.2 |. Measures
Dietary information was obtained from a validated, self-administered, 145-item Food Frequency Questionnaire (FFQ) at baseline.23 Average consumption of cholesterol (milligrams/day), saturated fat (grams/day), trans fat (grams/day), polyunsaturated fat (grams/day), monounsaturated fat (grams/day), protein (grams/day), carbohydrates (grams/day), and total calories (kcal/day) was estimated from participants’ responses by the Fred Hutchinson Cancer Research Center Nutrition Assessment Shared Resource (NASR). Dietary estimates were conducted using the Nutrition Data System for Research (NDSR) software developed by the Nutrition Coordinating Center (NCC), University of Minnesota, Minneapolis, MN. Validation information of dietary estimates has previously been published for all dietary variables included in this study, with the exception of trans fat.23 Energy-adjusted correlation coefficients of dietary cholesterol (0.49), saturated fat (0.56), polyunsaturated fat (0.44), monounsaturated fat (0.57), protein (0.41), and carbohydrate (0.63) estimates from the FFQ in relation to average intake from four 24-hour recalls and a four-day food record were very similar to coefficients from the Willett 18, Willett 19, and Block/NCI FFQs.23
Serum lipids (total, low-density lipoprotein [LDL], and high-density lipoprotein [HDL] cholesterol [mg/dL] and triglycerides [mg/dL]) were measured from fasting blood samples obtained at baseline. Analysis of lipid levels was performed at the University of Minnesota Medical Center Advanced Research and Diagnostics Lab. Total cholesterol levels were determined using the Roche Modular P Chemistry analyzer (Roche Diagnostics Corporation, Indianapolis, IN 46250). Standardization was performed using a serum standard prepared in the laboratory and frozen at −70°C. Inter-assay coefficients of variation (CVs) of total cholesterol were 3.8% at 205.5 mg/dL and 5.1% at 252.0 mg/dL. HDL cholesterol levels were determined using the HDL-C plus third generation direct method on the Roche Modular P Chemistry analyzer. Inter-assay CVs of HDL cholesterol were 3.4% at 29.2 mg/dL and 2.3% at 57.6 mg/dL. LDL cholesterol levels were calculated using the Friedewald formula.24 Triglyceride levels were measured on the Roche Modular P Chemistry analyzer, which was calibrated with a serum standard frozen at −70°C. Inter-assay CVs of triglycerides were 2.0% at 85 mg/dL and 1.8% at 183 mg/dL. APOE genotyping was also performed using baseline blood draw. SNPs rs429358 and rs7412 were used to classify participants into APOE genotypes (ε2/ε2, ε2/ε3, ε2/ε4, ε3/ε3, ε3/ε4, ε4/ε4).
Demographic information and possible confounders were recorded at WHI enrollment, including participants’ age, highest level of education, smoking status, weekly alcohol consumption, body mass index (BMI), medical history (including hypertension, cardiovascular disease, type 2 diabetes, and stroke), use of cholesterol-lowering medication, and assignment in WHI hormone replacement therapy and dietary modification clinical trials.22 Cholesterol-lowering medications comprised all antihyperlipidemic drugs, including bile sequestrants, fibric acid derivatives, intestinal cholesterol absorption inhibitors, HMG COA reductase inhibitors, nicotinic acid derivatives, and miscellaneous antihyperlipidemics.22
2.3 |. Cognitive Assessment
The 3MS was administered annually to assess participants’ global cognitive function.20,21 Additional cognitive testing was administered to women who scored below pre-determined cut points based on age and education level.20,21 Testing included the Consortium to Establish a Registry for Alzheimer’s Disease (CERAD) neuropsychological battery,25 clinical evaluation, and proxy interviews.20,21 Annual face-to-face assessment was performed between 1995 and 2007.20,21 From 2008 through 2020, a validated, telephone-administered cognitive battery was administered as part of the WHIMS Epidemiology of Cognitive Health Outcomes (WHIMS-ECHO) study.26 All collected information was submitted to a centralized panel of experts for adjudication of no cognitive impairment, MCI, or probable dementia following standardized diagnostic criteria (Diagnostic and Statistical Manual of Mental Disorders, Fourth Edition; MCI criteria defined by Peterson et al.).20,21,27 For those who were classified as MCI before progressing to probable dementia, their first classification of probable dementia was used as the outcome.
2.4 |. Statistical Analysis
We calculated total-to-HDL and LDL-to-HDL cholesterol ratios, non-HDL cholesterol (total cholesterol minus HDL cholesterol) and remnant cholesterol (total cholesterol minus LDL and HDL cholesterol; a measure of very low-density lipoprotein [VLDL] and intermediate-density lipoprotein [IDL] in the fasting state28). Participants were categorized into three groups based on APOE genotype: APOE2+ (ε2/ε2, ε2/ε3), APOE3 (ε3/ε3), or APOE4+ (ε4/ε4, ε3/ε4) carriers. Those with ε2/ε4 genotype (N=129) were excluded given that ε2 and ε4 exert opposing effects on lipid metabolism and dementia risk, making it unclear to which group they best belong.2,5
Interactions between APOE status and dietary components (dietary cholesterol, saturated fat, trans fat, polyunsaturated fat, and monounsaturated fat) were examined in relation to blood lipids (LDL, HDL, non-HDL, and total cholesterol, LDL-to-HDL and total-to-HDL ratios, remnant cholesterol, and triglycerides) using multiple linear regression. APOE3 carriers were treated as the reference group. Each model was adjusted for all dietary components of interest as well as total protein, carbohydrate, and calorie intake, WHI hormone therapy trial assignment (estrogen intervention, estrogen plus progestin intervention, estrogen control, or estrogen plus progestin control), WHI dietary modification trial assignment (low-fat intervention or control), use of lipid-lowering medication (HMG CoA reductase inhibitor, bile sequestrant, fibric acid derivative, unspecified antihyperlipidemic, combination of antihyperlipidemic medication, or none), smoking status (never, former, or current), alcohol consumption (servings per week), BMI, and age at baseline. Least squares means of lipids by APOE status were calculated from these regression models. A sensitivity analysis examining these same relationships was performed excluding those who reported <600 or >5,000 kcal/day (N=157; among those excluded, 23 were APOE2+, 88 were APOE3, and 43 were APOE4+). Supplementary analyses were additionally performed investigating blood lipid differences and diet-APOE-lipid associations across all 6 genotypes, using ε3/ε3 genotype as reference and excluding those reporting <600 or >5,000 kcal/day (N=160; among those excluded, 23 were ε2/ε3, 3 were ε2/ε4, 88 were ε3/ε3, 43 were ε3/ε4 and 3 were ε4/ε4).
Relationships between blood lipids and cognitive outcomes were examined using multiple logistic regression and Mendelian randomization. Logistic regression was used instead of Cox regression due to violation of the proportional hazards assumption by lipid levels. Lipids in those with incident probable dementia were compared to those without impairment, and the analyses were repeated for cognitive impairment (probable dementia+MCI). Lipid levels were defined using tertiles in logistic regression models (Table S1 in Supplement). The models were initially adjusted for age, hormone therapy trial assignment, education, use of lipid-lowering medication, and year of diagnosis. Secondary analyses were performed with additional adjustment for factors related to blood lipids or cognitive impairment (smoking status, alcohol consumption, hypertension, BMI, cardiovascular disease, stroke, and diabetes). These models were also performed separately for each APOE group as a supplementary analysis.
APOE was used as a genetic instrument in Mendelian randomization analysis given its role in lipid metabolism2,5–7 and AD risk.1,2 Mendelian randomization provides an alternative to randomized controlled trials for causal inference through the use of a genetic instrumental variable which is reliably associated with both the exposure variable and disease outcome.29 A two-stage least squares (2SLS) method was used to estimate the causal effect of lipids (LDL, HDL, non-HDL, total, and remnant cholesterol and triglycerides) on the risk of probable dementia and cognitive impairment. Linear regression of each lipid on APOE status was first performed, followed by logistic regression of probable dementia or cognitive impairment on lipid levels from the first-stage regression. Adjustments were made for age given that among those who remained cognitively normal, APOE4+ carriers were significantly younger than both APOE2+ and APOE3 carriers (p’s<0.05). To test the robustness of the Mendelian randomization results, we performed an additional 2SLS analysis using the APOE4 risk allele on the rs429358 and rs7412 SNPs as the genetic instrument. A risk allele score was assigned to each APOE genotype group in the first-stage regression of this analysis (ε2/ε2=1, ε2/ε3=2, ε3/ε3=3, ε3/ε4=4, ε4/ε4=5). All participants were white, which minimized issues related to population stratification.
Additional supplementary analyses were conducted to examine relationships between tertiles of dietary cholesterol and fat intake and cognitive outcomes within each APOE group, excluding those who reported <600 or >5,000 kcal/day. These models were initially adjusted for all dietary components of interest (dietary cholesterol, saturated fat, trans fat, monounsaturated fat, and polyunsaturated fat) as well as total protein, total carbohydrate, total energy intake, year of diagnosis, age at baseline, assignment in hormone therapy and dietary modification trials, education, and lipid-lowering medication. Further adjustment was also made for smoking, alcohol, BMI, hypertension, cardiovascular disease, stroke, and diabetes.
SAS University Edition 2.8.1 in SAS Studio, version 3.8, ©2012–2018, SAS Institute Inc. was used to perform multiple linear regression and multiple logistic regression analyses. Mendelian randomization analysis was performed in R, version 4.0.3, ©2020, The R Foundation for Statistical Computing. Given the a priori hypotheses, significance was reported at p<0.05.
3 |. Results
3.1 |. Sample Characteristics
Baseline sample characteristics are presented in Table 1. Participants (N=5,358) were followed for a median of 10 years (SD=6.34) between 1995 and 2020 until classification of MCI or probable dementia or until the final assessment for those who remained cognitively normal. In total, 588 (11%) participants received a classification of probable dementia, 347 (6%) were classified as MCI, and 4,423 (83%) remained cognitively normal. The mean age at WHI enrollment was 70.15 years (SD=3.84). Based on APOE status, 746 (14%) were classified as APOE2+, 3,379 (63%) as APOE3, and 1,233 (23%) as APOE4+. APOE4+ carriers had higher levels of LDL, non-HDL, LDL-to-HDL, and total-to-HDL cholesterol compared to APOE3 carriers, while APOE2+ had lower levels of LDL, non-HDL, total, LDL-to-HDL, and total-to-HDL cholesterol compared to APOE3 carriers (p’s<0.05; Table S2 in Supplement). Most participants had no history of cardiovascular disease (83%) or stroke (99%) and were not using lipid-lowering medications at baseline (88%). Cholesterol-lowering medication use was higher among APOE4+ (15%) compared to APOE2+ (8%) and APOE3 (12%) carriers.
Table 1.
Sample Characteristics by APOE Status
| APOE2+ | APOE3 | APOE4+ | P-value | |
|---|---|---|---|---|
| N | 746 | 3,379 | 1,233 | |
| Age, M (SD) | 70.33 (4.03) | 70.17 (3.84) | 69.98 (3.72) | 0.12 |
| Body Mass Index (kg/m2), M (SD) | 28.42 (5.69) | 28.37 (5.43) | 28.25 (6.10) | 0.78 |
| Education, N (%) | 0.76 | |||
| <High school | 36 (4.8) | 201 (5.9) | 66 (5.4) | |
| High school | 265 (35.5) | 1,132 (33.5) | 434 (35.2) | |
| College | 282 (37.8) | 1,266 (37.5) | 454 (36.8) | |
| Postgraduate | 163 (21.8) | 780 (23.1) | 279 (22.6) | |
| Smoking, N (%) | 0.98 | |||
| Never | 403 (54.0) | 1,822 (53.9) | 654 (53.0) | |
| Former | 296 (39.7) | 1,336 (39.5) | 496 (40.2) | |
| Current | 47 (6.3) | 221 (6.5) | 83 (6.7) | |
| Alcohol servings per week, M (SD) | 2.43 (5.20) | 2.65 (5.50) | 2.69 (5.40) | 0.54 |
| Serum blood lipids (mg/dL), M (SD) | ||||
| LDL cholesterol | 134.34 (32.45) | 154.31 (34.95) | 159.74 (35.78) | <0.001 |
| HDL cholesterol | 55.25 (12.71) | 53.67 (12.25) | 52.30 (12.43) | <0.001 |
| Non-HDL cholesterol | 162.20 (37.95) | 182.16 (39.07) | 188.55 (38.83) | <0.001 |
| Total cholesterol | 217.45 (36.17) | 235.83 (39.01) | 240.86 (38.55) | <0.001 |
| Remnant cholesterol | 27.86 (12.63) | 27.85 (13.39) | 28.82 (13.36) | 0.08 |
| Triglycerides | 139.71 (63.13) | 139.79 (66.92) | 144.59 (66.84) | 0.08 |
| LDL/HDL ratio | 2.57 (0.93) | 3.01 (0.92) | 3.21 (1.00) | <0.001 |
| Total/HDL ratio | 4.14 (1.18) | 4.59 (1.18) | 4.83 (1.26) | <0.001 |
| Total energy intake (kcal/day), M (SD) | 1,611.09 (677.73) | 1,582.89 (648.84) | 1,583.64 (658.81) | 0.56 |
| Dietary carbohydrate (g/day), M (SD) | 193.67 (79.18) | 192.89 (78.63) | 196.67 (81.84) | 0.36 |
| Dietary protein (g/day), M (SD) | 67.36 (30.68) | 66.37 (29.20) | 66.23 (30.41) | 0.67 |
| Dietary total fat (g/day), M (SD) | 62.27 (34.61) | 59.55 (32.93) | 58.12 (32.55) | 0.03 |
| Saturated fat | 21.38 (12.50) | 20.29 (12.00) | 19.78 (12.01) | 0.02 |
| Monounsaturated fat | 23.53 (13.36) | 22.49 (12.68) | 21.94 (12.40) | 0.03 |
| Polyunsaturated fat | 12.51 (7.44) | 12.12 (6.98) | 11.85 (6.82) | 0.13 |
| Trans fat | 4.47 (3.10) | 4.28 (3.02) | 4.26 (2.99) | 0.27 |
| Dietary cholesterol (g/day), M (SD) | 227.49 (145.02) | 214.49 (133.12) | 204.65 (128.00) | 0.001 |
| Probable Dementia, N (%) | 59 (7.9) | 321 (9.5) | 208 (16.9) | <0.001 |
| Mild Cognitive Impairment, N (%) | 49 (6.6) | 211 (6.2) | 87 (7.1) | 0.21 |
| Cholesterol-lowering medication, N (%) | 61 (8.2) | 418 (12.4) | 186 (15.1) | 0.003 |
| HMG CoA reductase inhibitor | 43 (5.8) | 365 (10.8) | 164 (13.3) | |
| Bile sequestrant | 3 (0.4) | 17 (0.5) | 9 (0.7) | |
| Fibric acid derivative | 14 (1.9) | 22 (0.7) | 12 (1.0) | |
| Unspecified antihyperlipidemic | 0 (0) | 1 (0.0) | 0 (0) | |
| Combination antihyperlipidemic | 1 (0.1) | 13 (0.4) | 1 (0.1) |
SI conversion factor: To convert cholesterol levels to mmol/L, multiply values by 0.0259. To convert triglyceride levels to mmol/L, multiply values by 0.0113.
Abbreviations: HDL = high-density lipoprotein; LDL = low-density lipoprotein.
3.2 |. Relationships between dietary cholesterol and fat consumption and blood lipids
3.2.1 |. Primary analysis.
Relationships between dietary cholesterol, trans fat, monounsaturated fat, and several blood lipids varied by APOE status (Table 2; Figure 1). Higher consumption of dietary cholesterol was associated with higher LDL (estimate=0.03 mg/dL, [95% CI (CI):0.002, 0.06], p=0.04), non-HDL (estimate=0.04 mg/dL, [CI:0.01, 0.07], p=0.02), LDL-to-HDL (estimate=0.001 mg/dL, [CI:0.0001, 0.002], p=0.03), and total-to-HDL (estimate=0.001 mg/dL, [CI:0.0001, 0.002], p=0.03) cholesterol levels in APOE4+ compared to APOE3 carriers. Higher monounsaturated fat intake was associated with higher levels of HDL cholesterol (estimate=0.50 mg/dL, [CI:0.17, 0.84], p=0.003) in APOE2+ compared to APOE3 carriers. A stronger negative association between trans fat intake and HDL cholesterol was observed in APOE2+ (estimate=−0.63 mg/dL, [CI:−1.20, −0.06], p=0.03) compared to APOE3 carriers, although APOE3 carriers had lower HDL cholesterol levels overall in relation to higher trans fat consumption. (To convert LDL, HDL, and non-HDL cholesterol levels to mmol/L, multiply values by 0.0259). Relationships between blood lipids and saturated fat, monounsaturated fat, and polyunsaturated fat did not vary significantly by APOE status (p’s>0.05).
Table 2.
Interactions of Dietary Cholesterol and Fat with APOE Status in Relation to Blood Lipids
|
Blood Lipid |
APOE Group (ref=APOE3) |
C x APOE Estimate (95% CI) |
SF x APOE Estimate (95% CI) |
TF x APOE Estimate (95% CI) |
MF x APOE Estimate (95% CI) |
PF x APOE Estimate (95% CI) |
|---|---|---|---|---|---|---|
| LDL Cholesterol | APOE2+ | 0.01 (−0.02, 0.04) | 0.29 (−0.37, 0.95) | 0.33 (−1.42, 2.09) | −0.33 (−1.35, 0.69) | −0.30 (−1.26, 0.66) |
| APOE4+ | 0.03 (0.002, 0.06)* | 0.23 (−0.40, 0.85) | −0.23 (−1.81, 1.34) | −0.55 (−1.53, 0.43) | 0.25 (−0.63, 1.12) | |
| HDL Cholesterol | APOE2+ | −0.01 (−0.02, 0.002) | −0.20 (−0.41, 0.02) | −0.63 (−1.20, −0.06)* | 0.50 (0.17, 0.84)† | −0.19 (−0.50, 0.12) |
| APOE4+ | −0.01 (−0.02, 0.0001) | −0.05 (−0.26, 0.15) | 0.09 (−0.42, 0.60) | 0.13 (−0.19, 0.45) | −0.01 (−0.29, 0.28) | |
| Non−HDL Cholesterol | APOE2+ | 0.02 (−0.02, 0.05) | 0.39 (−0.34, 1.13) | 0.71 (−1.25, 2.67) | −0.62 (−1.76, 0.52) | −0.24 (−1.32, 0.84) |
| APOE4+ | 0.04 (0.01, 0.07)* | 0.33 (−0.37, 1.03) | −0.43 (−2.19, 1.33) | −0.72 (−1.81, 0.38) | 0.27 (−0.71, 1.25) | |
| Total Cholesterol | APOE2+ | 0.01 (−0.03, 0.04) | 0.20 (−0.53, 0.93) | 0.07 (−1.87, 2.02) | −0.12 (−1.24, 1.01) | −0.43 (−1.50, 0.64) |
| APOE4+ | 0.03 (−0.003, 0.06) | 0.28 (−0.42, 0.97) | −0.34 (−2.09, 1.41) | −0.59 (−1.68, 0.50) | 0.27 (−0.71, 1.24) | |
| LDL/HDL Ratio | APOE2+ | 0.0004 (−0.0004, 0.001) | 0.01 (−0.004, 0.03) | 0.02 (−0.02, 0.07) | −0.02 (−0.05, 0.004) | −0.004 (−0.03, 0.02) |
| APOE4+ | 0.001 (0.0001, 0.002)* | 0.01 (−0.01, 0.03) | −0.02 (−0.06, 0.03) | −0.01 (−0.04, 0.01) | 0.001 (−0.02, 0.02) | |
| Total/HDL Ratio | APOE2+ | 0.001 (−0.001, 0.002) | 0.02 (−0.004, 0.04) | 0.04 (−0.02, 0.10) | −0.03 (−0.07, 0.002) | −0.003 (−0.04, 0.03) |
| APOE4+ | 0.001 (0.0001, 0.002)* | 0.01 (−0.01, 0.03) | −0.02 (−0.07, 0.03) | −0.02 (−0.05, 0.01) | −0.001 (−0.03, 0.03) | |
| Remnant Cholesterol | APOE2+ | 0.01 (−0.005, 0.02) | 0.11 (−0.13, 0.35) | 0.37 (−0.27, 1.01) | −0.29 (−0.66, 0.08) | 0.06 (−0.29, 0.41) |
| APOE4+ | 0.01 (−0.003, 0.02) | 0.10 (−0.13, 0.33) | −0.20 (−0.77, 0.37) | −0.17 (−0.53, 0.19) | 0.02 (−0.30, 0.34) | |
| Triglycerides | APOE2+ | 0.03 (−0.03, 0.09) | 0.52 (−0.68, 1.71) | 1.83 (−1.37, 5.02) | −1.37 (−3.23, 0.48) | 0.24 (−1.51, 2.00) |
| APOE4+ | 0.04 (−0.01, 0.09) | 0.49 (−0.65, 1.63) | −0.95 (−3.82, 1.92) | −0.82 (−2.61, 0.97) | 0.10 (−1.50, 1.70) |
p<0.05,
p<0.01.
SI conversion factor: To convert cholesterol levels to mmol/L, multiply values by 0.0259. To convert triglyceride levels to mmol/L, multiply values by 0.0113.
Abbreviations: C = dietary cholesterol; CI = confidence interval; HDL = high-density lipoprotein; LDL = low-density lipoprotein; MF = dietary monounsaturated fat; PF = dietary polyunsaturated fat; ref = reference group; SF = dietary saturated fat; TF = dietary trans fat; x = interaction between dietary variable and APOE.
Figure 1. APOE Significantly Modifies the Relationships Between Diet and Lipids.
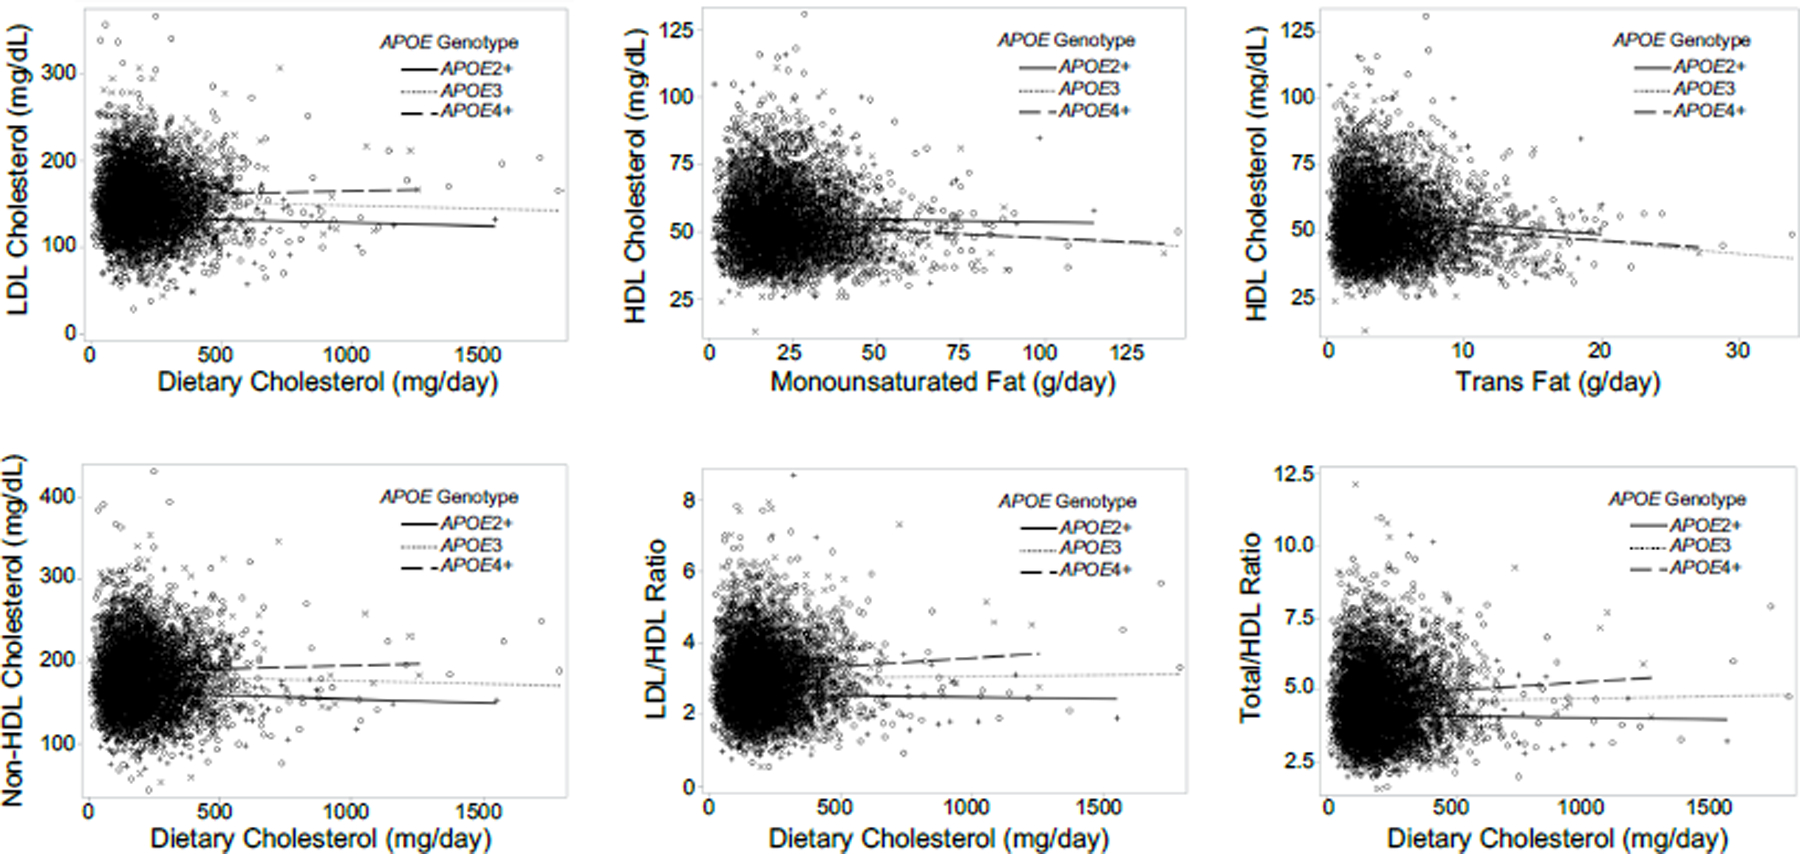
Greater consumption of dietary cholesterol was associated with greater higher LDL, non-HDL, LDL-to-HDL, and total-to-HDL cholesterol levels in APOE4+ compared to APOE3 carriers. Greater consumption of monounsaturated fat and trans fat were associated with higher and lower HDL cholesterol levels, respectively, in APOE2+ compared to APOE3 carriers.
SI conversion factor: To convert cholesterol levels to mmol/L, multiply values by 0.0259. To convert triglyceride levels to mmol/L, multiply values by 0.0113.
Abbreviations: HDL = high-density lipoprotein; LDL = low-density lipoprotein.
3.2.2 |. Sensitivity analysis.
Sensitivity analysis excluding 157 participants with energy intake <600 or >5,000 kcal/day revealed similar results, though some associations were slightly attenuated (Table S3 in Supplement). Higher dietary cholesterol consumption among APOE4+ carriers remained associated with higher non-HDL cholesterol levels (estimate=0.03, [CI:0.001, 0.07], p=0.04) compared to APOE3 carriers. APOE2+ consuming more monounsaturated fat also still had higher levels of HDL cholesterol (estimate=0.49, [CI:0.16, 0.83], p=0.004) compared to APOE3 carriers. However, associations between dietary cholesterol and LDL (estimate=0.03, [CI:−0.003, 0.06], p=0.07), LDL-to-HDL (estimate=0.001, [CI:−0.0001, 0.002], p=0.07), and total-to-HDL (estimate=0.001, [CI:−0.0001, 0.002], p=0.07) cholesterol levels in APOE4+ compared to APOE3 carriers were no longer statistically significant. The association between trans fat and HDL cholesterol in APOE2+ compared to APOE3 carriers was also weakened (estimate=−0.57, [CI:−1.15, 0.003], p=0.05).
3.2.3 |. Supplementary analysis.
Supplementary analysis using all 6 APOE genotypes revealed significant blood lipid differences in ε2/ε3 and ε3/ε4 compared to ε3/ε3 carriers (Table S4 in Supplement), as well as several interactions between dietary components and APOE genotype in relation to lipids (Table S5 in Supplement). Higher dietary cholesterol intake in APOE ε3/ε4 was associated with higher non-HDL (estimate=0.03 mg/dL, [CI:0.001, 0.07], p=0.04) and lower HDL (estimate=−0.01, [CI:−0.02, −0.0003], p=0.04) cholesterol levels compared to ε3/ε3 carriers. Higher trans fat consumption in APOE ε2/ε4 was associated with lower LDL (estimate=−5.80, [CI:−10.20, −1.40], p=0.0098) and LDL-to-HDL (estimate=−0.15, [CI:−0.27, −0.04], p=0.009) cholesterol levels compared to ε3/ε3 carriers. Higher saturated fat consumption in ε2/ε4 was associated with higher triglyceride (estimate=4.32, [CI:1.74, 6.90], p=0.001) and remnant cholesterol (estimate=0.88, [CI:0.36, 1.39], p=0.0008) levels compared to ε3/ε3 carriers. Higher monounsaturated fat consumption in ε2/ε4 was associated with higher LDL (estimate=2.85, [CI:0.55, 5.16], p=0.02) and LDL-to-HDL (estimate=0.06, [CI:0.0002, 0.12], p=0.049) cholesterol levels, and lower triglyceride levels (estimate=−4.26, [CI:−8.48, −0.05], p=0.048) compared to ε3/ε3 carriers. Higher polyunsaturated fat consumption in ε2/ε4 was associated with lower LDL cholesterol levels (estimate=−2.38, [CI:−4.66, −0.11], p=0.04) compared to ε3/ε3 carriers. Higher trans fat intake in ε2/ε3 was associated with lower HDL cholesterol (estimate=−0.65, [CI:−1.23, −0.06], p=0.03) compared to ε3/ε3, while higher monounsaturated fat intake in ε2/ε3 was associated with higher HDL cholesterol levels (estimate=0.51, [CI:0.17, 0.85], p=0.003) compared to ε3/ε3 carriers. However, the considerable imbalance in sample sizes across APOE genotypes (i.e. 3,291 ε3/ε3 compared to 35 ε2/ε2 and 90 ε4/ε4 carriers) warrants caution when interpreting results from this supplementary analysis.
3.3 |. Relationships between blood lipids and dementia risk
3.3.1 |. Logistic regression.
Results from logistic regression examining probable dementia and cognitive impairment in relation to blood lipid tertiles are shown in Table 3. Higher total blood cholesterol levels were associated with greater risk for probable dementia (odds ratio [OR]=1.14, [CI:1.02, 1.28], p for trend=0.02), with ORs of 1.19 (CI:0.95, 1.50) and 1.31 (CI:1.05, 1.65) for the top second and third tertiles, respectively, compared to the bottom first tertile after full covariate adjustment. Higher total cholesterol levels were not significantly associated with risk for cognitive impairment (OR=1.09, [CI:0.99, 1.20], p for trend=0.06), with ORs of 1.08 (CI:0.90, 1.30) and 1.19 (CI:0.99, 1.43) for the top second and third tertiles, respectively. LDL, HDL, non-HDL, LDL-to-HDL, total-to-HDL, and remnant cholesterol and triglycerides were not significantly associated with risk for probable dementia or cognitive impairment (p’s>0.05).
Table 3.
Odds Ratios of Probable Dementia and Cognitive Impairment per Lipid Tertiles
| Covariate Adjustment | Blood Lipid | Probable Dementia | Cognitive Impairment | ||||||
|---|---|---|---|---|---|---|---|---|---|
| Lipid Tertile – OR (95% CI) | Lipid Tertile – OR (95% CI) | ||||||||
| 1 | 2 | 3 | P for trend | 1 | 2 | 3 | P for trend | ||
| Limited Adjustment | LDL Cholesterol | 1.00 | 1.10 (0.88, 1.37) | 1.20 (0.96, 1.50) | 0.10 | 1.00 | 1.04 (0.87, 1.24) | 1.10 (0.92, 1.32) | 0.28 |
| HDL Cholesterol | 1.00 | 1.04 (0.83, 1.31) | 1.14 (0.91, 1.43) | 0.26 | 1.00 | 0.97 (0.81, 1.17) | 1.02 (0.85, 1.23) | 0.79 | |
| Non-HDL Cholesterol | 1.00 | 1.17 (0.94, 1.46) | 1.17 (0.93, 1.46) | 0.18 | 1.00 | 1.12 (0.93, 1.34) | 1.10 (0.92, 1.32) | 0.31 | |
| Total Cholesterol | 1.00 | 1.18 (0.94, 1.47) | 1.28 (1.03, 1.60) | 0.03 | 1.00 | 1.08 (0.90, 1.29) | 1.17 (0.98, 1.40) | 0.08 | |
| LDL/HDL Ratio | 1.00 | 0.94 (0.76, 1.17) | 1.08 (0.87, 1.34) | 0.52 | 1.00 | 0.98 (0.82, 1.18) | 1.08 (0.90, 1.29) | 0.40 | |
| Total/HDL Ratio | 1.00 | 0.83 (0.67, 1.03) | 0.99 (0.80, 1.23) | 0.92 | 1.00 | 0.90 (0.75, 1.07) | 1.03 (0.86, 1.23) | 0.79 | |
| Remnant Cholesterol | 1.00 | 0.90 (0.72, 1.12) | 1.05 (0.84, 1.31) | 0.65 | 1.00 | 0.89 (0.74, 1.07) | 1.02 (0.85, 1.23) | 0.76 | |
| Triglycerides | 1.00 | 0.91 (0.73, 1.13) | 1.03 (0.83, 1.29) | 0.80 | 1.00 | 0.92 (0.77, 1.10) | 1.03 (0.86, 1.23) | 0.79 | |
| Full Adjustment | LDL Cholesterol | 1.00 | 1.11 (0.88, 1.39) | 1.22 (0.97, 1.52) | 0.09 | 1.00 | 1.06 (0.88, 1.27) | 1.12 (0.93, 1.35) | 0.23 |
| HDL Cholesterol | 1.00 | 1.04 (0.82, 1.32) | 1.14 (0.89, 1.46) | 0.29 | 1.00 | 0.97 (0.80, 1.17) | 1.02 (0.84, 1.25) | 0.80 | |
| Non-HDL Cholesterol | 1.00 | 1.19 (0.95, 1.49) | 1.19 (0.94, 1.49) | 0.15 | 1.00 | 1.13 (0.94, 1.36) | 1.12 (0.92, 1.35) | 0.26 | |
| Total Cholesterol | 1.00 | 1.19 (0.95, 1.50) | 1.31 (1.05, 1.65) | 0.02 | 1.00 | 1.08 (0.90, 1.30) | 1.19 (0.99, 1.43) | 0.06 | |
| LDL/HDL Ratio | 1.00 | 0.95 (0.76, 1.19) | 1.09 (0.87, 1.38) | 0.44 | 1.00 | 0.99 (0.82, 1.20) | 1.09 (0.91, 1.32) | 0.35 | |
| Total/HDL Ratio | 1.00 | 0.84 (0.67, 1.05) | 1.00 (0.79, 1.26) | 0.99 | 1.00 | 0.90 (0.75, 1.09) | 1.03 (0.85, 1.24) | 0.78 | |
| Remnant Cholesterol | 1.00 | 0.91 (0.72, 1.15) | 1.09 (0.86, 1.38) | 0.44 | 1.00 | 0.91 (0.75, 1.10) | 1.04 (0.86, 1.27) | 0.63 | |
| Triglycerides | 1.00 | 0.91 (0.72, 1.14) | 1.06 (0.84, 1.34) | 0.63 | 1.00 | 0.92 (0.77, 1.12) | 1.04 (0.86, 1.26) | 0.68 | |
Abbreviations: CI = confident interval; HDL = high-density lipoprotein; LDL = low-density lipoprotein; OR = odds ratio.
3.3.2 |. Mendelian randomization.
Mendelian randomization comparing APOE groups revealed significantly greater risk for probable dementia per mg/dL increase in LDL cholesterol (OR=1.43, [CI:1.28, 1.59]), non-HDL cholesterol (OR=1.27, [CI:1.18, 1.37]), total cholesterol (OR=1.47, [CI:1.31, 1.65]), remnant cholesterol (OR=2.08, [CI:1.66, 2.59]), and triglycerides (OR=1.16, [CI:1.11, 1.21]) and per mg/dL decrease in HDL cholesterol (OR=0.53, [CI:0.43, 0.64]) (p’s<0.001; Table 4). Cognitive impairment risk was also higher with each increasing mg/dL of LDL cholesterol (OR=1.32, [CI:1.21, 1.45]), non-HDL cholesterol (OR=1.21, [CI:1.14, 1.28]), total cholesterol (OR=1.35, [CI:1.23, 1.49]), remnant cholesterol (OR=1.78; [CI:1.47, 2.14]), and triglycerides (OR=1.12; [CI:1.08, 1.17]), and per mg/dL decrease in HDL cholesterol (OR=0.60, [CI:0.51, 0.71]) (p’s<0.001).
Table 4.
Odds Ratios for Dementia per Unit (mg/dL) Increase in APOE Status-Predicted Levels of Blood Lipids
| Probable Dementia | Cognitive Impairment | |||
|---|---|---|---|---|
| Blood Lipid | OR (95% CI) | P-value | OR (95% CI) | P-value |
| LDL Cholesterol | 1.43 (1.28, 1.59) | <0.001 | 1.32 (1.21, 1.45) | <0.001 |
| HDL Cholesterol | 0.53 (0.43, 0.64) | <0.001 | 0.60 (0.51, 0.71) | <0.001 |
| Non-HDL Cholesterol | 1.27 (1.18, 1.37) | <0.001 | 1.21 (1.14, 1.28) | <0.001 |
| Total Cholesterol | 1.47 (1.31, 1.65) | <0.001 | 1.35 (1.23, 1.49) | <0.001 |
| Remnant Cholesterol | 2.08 (1.66, 2.59) | <0.001 | 1.78 (1.47, 2.14) | <0.001 |
| Triglycerides | 1.16 (1.11, 1.21) | <0.001 | 1.12 (1.08, 1.17) | <0.001 |
Abbreviations: CI = confidence interval; HDL = high-density lipoprotein; LDL = low-density lipoprotein; OR = odds ratio.
Mendelian randomization using the APOE4 risk allele as the genetic instrument revealed similar results (Table 5). Probable dementia risk was greater per mg/dL increase in LDL cholesterol (OR=1.05, [CI:1.04, 1.06]), non-HDL cholesterol (OR=1.05, [CI:1.03, 1.06]), total cholesterol (OR=1.05, [CI:1.04, 1.07]), remnant cholesterol (OR=3.13, [2.31, 4.24]), and triglycerides (OR=1.25, [CI:1.18, 1.33]), and per mg/dL decrease in HDL cholesterol (OR=0.70, [CI:0.63, 0.77]) (p’s<0.001). Additionally, risk for cognitive impairment was greater per mg/dL increase in LDL cholesterol (OR=1.04, [CI:1.03, 1.05]), non-HDL cholesterol (OR=1.03, [CI:1.02, 1.05]), total cholesterol (OR=1.04, [ CI:1.03, 1.05]), remnant cholesterol (OR=2.38, [CI:1.85, 3.06]), and triglycerides (OR=1.19, [CI:1.13, 1.25]), and per mg/dL decrease in HDL cholesterol (OR=0.76, [CI:0.70, 0.82]) (p’s<0.001).
Table 5.
Odds Ratios for Dementia per Unit (mg/dL) Increase in Blood Lipids using APOE4 Risk Score-Predicted Levels of Blood Lipids
| Probable Dementia | Cognitive Impairment | |||
|---|---|---|---|---|
| Blood Lipid | OR (95% CI) | P-value | OR (95% CI) | P-value |
| LDL Cholesterol | 1.05 (1.04, 1.06) | <0.001 | 1.04 (1.03, 1.05) | <0.001 |
| HDL Cholesterol | 0.70 (0.63, 0.77) | <0.001 | 0.76 (0.70, 0.82) | <0.001 |
| Non-HDL Cholesterol | 1.05 (1.03, 1.06) | <0.001 | 1.03 (1.02, 1.05) | <0.001 |
| Total Cholesterol | 1.05 (1.04, 1.07) | <0.001 | 1.04 (1.03, 1.05) | <0.001 |
| Remnant Cholesterol | 3.13 (2.31, 4.24) | <0.001 | 2.38 (1.85, 3.06) | <0.001 |
| Triglycerides | 1.25 (1.18, 1.33) | <0.001 | 1.19 (1.13, 1.25) | <0.001 |
Abbreviations: CI = confidence interval; HDL = high-density lipoprotein; LDL = low-density lipoprotein; OR = odds ratio.
3.3.3 |. Supplementary analysis.
Supplementary logistic regression models examining cognitive outcomes in relation to blood lipid tertiles within APOE status groups are presented in Table S6 in Supplement. Moderately higher total cholesterol levels in the second tertile were associated with greater dementia risk in APOE3 carriers after full adjustment (OR=1.52, [CI:1.12, 2.06], p=0.01). The second tertile of total-to-HDL levels was also associated with lower dementia (OR=0.67, [CI:0.49, 0.91), p=0.01) and cognitive impairment (OR=0.77, [CI:0.60, 0.99], p=0.045) risk after full adjustment in APOE3 carriers. Higher total-to-HDL levels were associated with lower cognitive impairment risk in APOE4+ after full adjustment (OR=0.81, [CI:0.67, 0.97], p for trend=0.02), with ORs of 0.86 (CI:0.61,1.21) and 0.65 (CI:0.45, 0.93) for the top second and third tertiles, respectively. Higher HDL cholesterol levels were associated with greater cognitive impairment risk in APOE4+ carriers after full covariate adjustment (OR=1.28, [CI:1.06, 1.54], p for trend=0.01), with ORs of 1.56 (CI:1.09, 2.22) and 1.64 (CI:1.12, 2.40) for the second and third tertiles, respectively. However, it should be noted that these models are unlikely to appropriately reflect lipid-dementia relationships due to low statistical power from a small proportion of dementia and cognitive impairment cases and small sample sizes. The models for APOE2+ and APOE3 groups were unable to converge, presumably related to these reasons.
3.4 |. Supplementary analysis examining relationships between diet and dementia risk within APOE groups
Logistic regression models examining probable dementia and cognitive impairment risk in relation to dietary cholesterol and fat within each APOE group are presented in Table S7 in Supplement. Higher saturated fat intake was associated with lower cognitive impairment risk in APOE3 carriers after full adjustment (p for trend=0.04), with ORs of 0.75 (CI:0.52, 1.09) and 0.58 (CI:0.34, 0.98) for the second and third tertiles, respectively. However, APOE2+ and APOE3 models did not converge, likely due to low power related to small sample sizes and a low proportion of dementia and cognitive impairment cases.
4 |. Discussion
Our findings in this sample of older, postmenopausal women of: (1) less favorable blood lipid profiles in relation to higher dietary cholesterol intake in APOE4+ compared to APOE3 carriers, and (2) greater dementia and cognitive impairment risk in relation to unfavorable lipid levels are largely consistent with the existing literature.5,9,10–12
APOE4+ carriers consuming diets higher in cholesterol had higher LDL, non-HDL, LDL-to-HDL, and total-to-HDL cholesterol levels compared to APOE3 carriers. While the associations of dietary cholesterol with LDL, LDL-to-HDL, and total-to-HDL levels were attenuated in sensitivity analyses, non-significant trends in the same direction remained.
Analyses including all 6 genotypes indicated higher non-HDL and lower HDL levels in relation to greater dietary cholesterol intake in ε3/ε4 compared to ε3/ε3 carriers. There were no significant differences between ε4/ε4 and ε3/ε3 carriers, which is likely related to low statistical power due to a substantial difference in group size, with 3,291 ε3/ε3 but only 90 ε4/ε4 carriers.
The opposing effects of APOE ε2 and ε4 alleles on lipid metabolism seem to be reflected in our results. For instance, ε2/ε4 carriers had higher triglyceride and remnant cholesterol levels in relation to higher saturated fat intake, as well as lower LDL levels in relation to higher polyunsaturated fat intake compared to ε3/ε3 carriers, which appears consistent with previous reports of ε4 carriers’ lipids being more responsive to dietary components which may be harmful (saturated fat) or beneficial (polyunsaturated fat).9,10 APOE ε2/ε4 carriers also had lower LDL and LDL-to-HDL levels in relation to higher trans fat intake, which might reflect a protective effect of ε2 allele in the context of trans fat intake. Nevertheless, results from analyses including all 6 genotypes should be interpreted with caution, as they may be biased from low statistical power due to the comparison of small and unequal sample sizes. Overall, the interactions between diet, APOE, and blood lipids suggest that APOE may act as an effect modifier of lipid levels in response to cholesterol and fat consumption and support the possibility that APOE4+ carriers’ lipid profiles may benefit most from reduced dietary cholesterol intake.
Greater dementia risk in relation to unfavorable blood lipid levels in this cohort was confirmed by multiple logistic regression and Mendelian randomization, with the latter providing support for possible causality. Mendelian randomization additionally indicated greater cognitive impairment risk in relation to unfavorable blood lipids. Associations between all lipids with greater dementia and cognitive impairment risk may reflect one mechanism underlying APOE4-related AD risk. Interestingly, odds ratios for dementia and cognitive impairment were highest for remnant cholesterol from both Mendelian randomization analyses, suggesting that elevated remnant cholesterol levels have a potentially stronger role in APOE4-related dementia risk compared to more commonly investigated lipids, such as total and LDL cholesterol. It should be noted that WHIMS assessed for all-cause dementia, although AD accounts for most dementia cases3 and was the most common classification of dementia cases in WHIMS.20 Still, we cannot rule out that the current sample may include a few vascular dementia cases, for which hypercholesterolemia and APOE4 are also risk factors.30,31 These findings should also be considered within the unique context of the present study, namely the fact that this sample consists exclusively of postmenopausal women. Menopause in its own right is associated with less favorable lipid profiles compared to pre-menopause,32 particularly for APOE3 and APOE4 carriers.33 Additionally, APOE4-associated AD risk is stronger in women than men.34 If dyslipidemia is causally involved in dementia development, a notion that seems to be supported by our Mendelian randomization results, sex differences in dementia risk may relate to the additional influence of menopause on blood lipids in women in combination with APOE, dietary cholesterol and fat, and other contributing factors.
Based on statin literature, the possibility of dementia risk reduction via lipid-lowering therapy remains inconclusive.35,36 Given that the hallmark neuropathology begins decades prior to symptom presentation,3 statin use alone may be insufficient to substantially alter the course of the disease. Promoting healthy lipid profiles earlier in life prior to pathological onset could be a more effective strategy for reducing dementia risk. Population studies indicate the potential for diet to reduce dementia risk. For example, AD prevalence has historically been higher in Western countries,4,7,37 which have higher consumption of saturated fat, trans fat, and cholesterol from red and processed meat, high-fat dairy, and fried and processed foods compared to less-developed, non-Western regions.4,7,38 Dementia rates in non-Westernized regions are projected to rise along with increasing consumption of a Western diet.37,38 Evidence-based dietary approaches to promote healthy blood lipid profiles include Mediterranean, Dietary Approaches to Stop Hypertension (DASH), and plant-based diets.39–41 These dietary patterns, along with the Mediterranean-DASH Intervention for Neurodegenerative Delay (MIND) diet, may aid in reducing dementia risk – especially in APOE4 carriers – by emphasizing consumption of unprocessed plant foods and reducing intake of saturated fat, trans fat, and cholesterol.4,7,38,42–44
Research in mice further supports the possibility of AD risk reduction through dietary modification. For instance, mice fed a diet high in cholesterol subsequently developed higher levels of total cholesterol in plasma and β-amyloid (Aβ, a neuropathological hallmark of AD) in the brain compared to controls.45 Similarly, a high-fat diet resulted in greater Aβ deposition and neuroinflammation, impaired sensory-motor function and social interaction, and a nonsignificant trend of poorer short-term memory in APP/PS1 mice compared to those fed a control diet.46
Female mice with human APOE4 targeted replacement exhibited greater deficits in hippocampal-dependent learning and memory from insulin resistance induced from six months of a high-fat diet compared to APOE3 mice.47 The cognitive impairments in the APOE4 mice were accompanied by unique epigenetic and metabolomic changes in hippocampus compared to APOE3 mice.47 A subsample of APOE4 mice who were then fed a low-fat diet for one month showed a complete rescue of cognitive function along with a reversal of the changes in the hippocampal epigenome and metabolome which had been induced by the high-fat diet.47 These reports corroborate epidemiological observations linking diet with blood lipids, and APOE-related AD, further supporting the possibility that APOE4 AD risk may be modifiable through dietary intervention.
A plausible mechanism through which diet and blood lipids could contribute to dementia pathology is through altered levels of oxysterols, which are oxidized products of cholesterol.48 Dyslipidemia and dietary cholesterol intake may lead to imbalanced oxysterol levels, which appear to promote dementia pathology.48,49 While further research is needed, existing literature suggests that dietary and blood lipid management may help lower dementia risk through maintenance of optimal oxysterol levels.48,49
Our study is not without limitations. Analyses were adjusted for hormone use during WHIMS participation, but prior history of hormone use could have influenced blood lipid levels and dementia or MCI risk. Although generalizability is limited due to the entirely female sample, our results are largely consistent with previous reports of variation in diet-blood lipid associations by APOE and relations between lipids and AD risk in samples of both men and women.5,9–13 Dietary habits were assessed using a self-administered FFQ, hence possible inaccuracies related to self-reporting remain. Dietary estimates did not account for changes in food supply following national regulations of trans fats in 2018.50 The attenuation of some diet-APOE-lipid relationships in sensitivity analyses and the inconsistent results in supplementary analyses among all 6 APOE genotypes and within APOE groups are likely influenced by a loss of statistical power. These preliminary findings nonetheless provide a novel contribution to the literature and provide motivation for future research in larger samples. Finally, given the heterogeneity of dementia and MCI cases in WHIMS, our findings should be interpreted with caution. These limitations should not undermine the unique aspects of our study; these include a large, well-screened, prospectively followed sample, examination of a large lipid panel, and Mendelian randomization analysis to investigate causality.
Overall, we report that APOE4 carriers consuming higher amounts of dietary cholesterol and trans fat had less favorable blood lipid profiles, which were in turn associated with greater risk for dementia and cognitive impairment. Unfavorable lipid profiles might be important clinical indicators of risk for dementia and cognitive impairment in middle-aged and older individuals. Uncovering and correcting dyslipidemia early may therefore be a critical component of dementia risk management, especially for APOE4 carriers. Further investigations of dementia risk in relation to dietary or pharmacologic modifications of blood lipids are needed and could have important implications for the prevention and treatment of dementia.
Supplementary Material
Highlights.
Less favorable serum lipids were associated with higher dementia incidence.
Mendelian randomization findings suggest causality between lipids and dementia.
Lipid levels in older women may be clinical indicators of dementia risk.
APOE4 carriers had poorest lipid profiles in relation to cholesterol consumption.
APOE risk for dementia may be modifiable through lipid management.
Acknowledgments
The Women’s Health Initiative is funded by the National Heart, Lung, and Blood Institute of the National Institutes of Health, U.S. Department of Health and Human Services.
Funding Sources
The Women’s Health Initiative Memory Study was funded in part by Wyeth Pharmaceuticals, St. Davids, PA. WHIMS-ECHO is funded by the National Institute on Aging, Contract No. HHSN-271-2011-00004C. M.M.D. was partially supported by the Dr. Susan Lima Memorial Summer Fellowship from the University of Wisconsin – Milwaukee. A.H.S. received funding from the National Institute on Aging grants RF1AG079149 and RF1AG074345.
Footnotes
Conflicts of Interest
All authors have no disclosures to report related to this work.
Consent Statement
Written informed consent was provided by all participants prior to study participation, and approval was obtained from the Institutional Review Board at each participating site.
References
- 1.Chartier-Harlin M-C, Parfitt M, Legrain S, et al. Apolipoprotein E, ε4 allele as a major risk factor for sporadic early and late-onset forms of Alzheimer’s disease: Analysis of the 19q13.2 chromosomal region. Hum Mol Genet 1994;3(4):569–574. doi: 10.1093/hmg/3.4.569 [DOI] [PubMed] [Google Scholar]
- 2.Belloy ME, Napolioni V, Greicius MD. A quarter century of APOE and Alzheimer’s disease: Progress to date and the path forward. Neuron 2019;101(5):820–838. doi: 10.1016/j.neuron.2019.01.056 [DOI] [PMC free article] [PubMed] [Google Scholar]
- 3.Alzheimer’s Association. 2021 Alzheimer’s disease facts and figures. Alzheimers Dement 2021;17(3). doi: 10.1002/alz.12328 [DOI] [PubMed] [Google Scholar]
- 4.Sherzai D, Sherzai A. Preventing Alzheimer’s: Our most urgent health care priority. Am J Lifestyle Med 2019;13(5):451–461. doi: 10.1177/1559827619843465 [DOI] [PMC free article] [PubMed] [Google Scholar]
- 5.Eichner JE, Dunn ST, Perveen G, Thompson DM, Stewart KE, Stroehla BC. Apolipoprotein E polymorphism and cardiovascular disease: A HuGE review. Am J Epidemiol 2002;155(6):487–495. [DOI] [PubMed] [Google Scholar]
- 6.Sing CF, Davignon J. Role of the apolipoprotein E polymorphism in determining normal plasma lipid and lipoprotein variation. Am J Hum Genet 1985;37:268–285. [PMC free article] [PubMed] [Google Scholar]
- 7.Martins IJ, Hone E, Foster JK, et al. Apolipoprotein E, cholesterol metabolism, diabetes, and the convergence of risk factors for Alzheimer’s disease and cardiovascular disease. Mol Psychiatry 2006;11:721–736. [DOI] [PubMed] [Google Scholar]
- 8.Hayden KM, Gaussoin SA, Hunter JC, et al. Cognitive resilience among APOE ε4 carriers in the oldest old. Int J Geriatr Psychiatry 2019;34(12):1833–1844. doi: 10.1002/gps.5199 [DOI] [PMC free article] [PubMed] [Google Scholar]
- 9.Gylling H, Miettinen TA. Cholesterol absorption and synthesis related to low density lipoprotein metabolism during varying cholesterol intake in men with different apoE phenotypes. J Lipid Res 1992;33:1361–1371. [PubMed] [Google Scholar]
- 10.Lopez-Miranda J, Ordovas JM, Mata P, Lichtenstein AH, Clevidence B, Judd JT, Schaefer EJ. Effect of apolipoprotein E phenotype on diet-induced lowering of plasma low density lipoprotein cholesterol. J Lipid Res 1994;35:1965–1975. [PubMed] [Google Scholar]
- 11.Anstey KJ, Ashby-Mitchell K, Peters R. Updating the evidence on the association between serum cholesterol and risk of late-life dementia: Review and meta-analysis. J Alzheimers Dis 2017;56(2017):215–228. doi: 10.3233/JAD-160826 [DOI] [PMC free article] [PubMed] [Google Scholar]
- 12.Solomon A, Kivipelto M, Wolozin B, Zhou J, Whitmer RA. Midlife serum cholesterol and increased risk of Alzheimer’s and vascular dementia three decades later. Dement Geriatr Cogn Disord 2009;28:75–80. doi: 10.1159/000231980 [DOI] [PMC free article] [PubMed] [Google Scholar]
- 13.Tang Q, Wang F, Yang J, et al. Revealing a novel landscape of the association between blood lipid levels and Alzheimer’s disease: A meta-analysis of a case-control study. Front Aging Neurosci 2020;11:370. doi: 10.3389/fnagi.2019.00370 [DOI] [PMC free article] [PubMed] [Google Scholar]
- 14.Zhou Z, Liang Y, Zhang X, et al. Low-density lipoprotein cholesterol and Alzheimer’s disease: A systematic review and meta-analysis. Front Aging Neurosci 2020;12:5. doi: 10.3389/fnagi.2020.00005 [DOI] [PMC free article] [PubMed] [Google Scholar]
- 15.Dunk MM, Driscoll I; Alzheimer’s Disease Neuroimaging Initiative. Total cholesterol and APOE-related risk for Alzheimer’s disease in the Alzheimer’s Disease Neuroimaging Initiative. J Alzheimers Dis 2022;85(4):1519–1528. doi: 10.3233/JAD-215091 [DOI] [PMC free article] [PubMed] [Google Scholar]
- 16.Kuo Y-M, Emmerling MR, Bisgaier CL, et al. Elevated low-density lipoprotein in Alzheimer’s disease correlates with brain Aβ 1–42 levels. Biochem Biophys Res Commun 1998;252:711–715. [DOI] [PubMed] [Google Scholar]
- 17.Kobe T, Gonneaud J, Binette AP, et al. Association of vascular risk factors with β-amyloid peptide and tau burdens in cognitively unimpaired individuals and its interaction with vascular medication use. JAMA Netw Open 2020;3(2):e1920780. doi: 10.1001/jamanetworkopen.2019.20780 [DOI] [PubMed] [Google Scholar]
- 18.Reitz C, Tang M-X, Luchsinger J, Mayeux R. Relation of plasma lipids to Alzheimer disease and vascular dementia. Arch Neurol 2004;61:705–714. [DOI] [PMC free article] [PubMed] [Google Scholar]
- 19.Tan ZS, Seshadri S, Beiser A, et al. Plasma total cholesterol level as a risk factor for Alzheimer disease. Arch Intern Med 2003;163:1053–1057. [DOI] [PubMed] [Google Scholar]
- 20.Shumaker SA, Legault C, Rapp S, et al. Estrogen plus progestin and the incidence of dementia and mild cognitive impairment in postmenopausal women: The Women’s Health Initiative Memory Study: A randomized controlled trial. JAMA 2003;289(20):2651–2662. doi: 10.1001/jama.289.20.2651 [DOI] [PubMed] [Google Scholar]
- 21.Shumaker SA, Legault C, Kuller L, et al. Conjugated equine estrogensn and incidence of probable dementia and mild cognitive impairment in postmenopausal women: Women’s Health Initiative Memory Study. JAMA 2004;291: 2947–2958. doi: 10.1001/jama.291.24.2947 [DOI] [PubMed] [Google Scholar]
- 22.The Women's Health Initiative Study Group. Design of the Women's Health Initiative clinical trial and observational study. Control Clin Trials 1998;19(1):61–109. doi: 10.1016/s0197-2456(97)00078-0 [DOI] [PubMed] [Google Scholar]
- 23.Patterson RE, Kristal AR, Tinker LF, et al. Measurement characteristics of the Women’s Health Initiative food frequency questionnaire. Ann Epidemiol 1999;9:178–187. [DOI] [PubMed] [Google Scholar]
- 24.Friedewald WT, Levy RI, Fredrickson DS. Estimation of the concentration of low-density lipoprotein cholesterol in plasma, without use of the preparative ultracentrifuge. Clin Chem 1972;18(6):499–502. [PubMed] [Google Scholar]
- 25.Morris JC, Heyman A, Mohs RC, et al. The Consortium to Establish a Registry for Alzheimer’s Disease (CERAD): Part I. Clinical and neuropsychological assessment of Alzheimer’s disease. Neurology 1989;39(9):1159–1165. doi: 10.1212/wnl.39.9.1159 [DOI] [PubMed] [Google Scholar]
- 26.Rapp SR, Legault C, Espeland MA, et al. Validation of a cognitive assessment battery administered over the telephone. J Am Geriatr Soc 2012;60(9):1616–1623. doi: 10.1111/j.1532-5415.2012.04111.x [DOI] [PMC free article] [PubMed] [Google Scholar]
- 27.Peterson RC, Dody R, Kurz A, et al. Current concepts in mild cognitive impairment. Arch Neurol 2001;58:1985–1992. doi: 10.1001/archneur.58.12.1985 [DOI] [PubMed] [Google Scholar]
- 28.Castañer O, Pintó X, Subirana I, et al. Remnant cholesterol, not LDL cholesterol, is associated with incidence cardiovascular disease. J Am Coll Cardiol 2020;76(23):2712–2724. doi: 10.1016/j.jacc.2020.10.008 [DOI] [PubMed] [Google Scholar]
- 29.Davies NM, Holmes MV, Davey Smith G. Reading Mendelian randomization studies: A guide, glossary, and checklist for clinicians. BMJ 2018;362:k601. doi: 10.1136/bmj.k601 [DOI] [PMC free article] [PubMed] [Google Scholar]
- 30.Appleton JP, Scutt P, Sprigg N, Bath PM. Hypercholesterolemia and vascular dementia. Clin Sci 2017;131:1561–1678. doi: 10.1042/CS20160382 [DOI] [PubMed] [Google Scholar]
- 31.Chuang Y-F, Hayden KM, Norton MC, et al. Association between APOE ε4 allele and vascular dementia: The Cache County Study. Dement Geriatr Cogn Disord 2010;29:248–253. doi: 10.1159/000285166 [DOI] [PMC free article] [PubMed] [Google Scholar]
- 32.Ambikairajah A, Walsh E, Cherbuin N. Lipid profile differences during menopause: A review with meta-analysis. Menopause 2019;26(11):1327–1333. doi: 10.1097/GME.0000000000001403 [DOI] [PubMed] [Google Scholar]
- 33.Hak AE, Witteman JCM, Hugens W, et al. The increase in cholesterol with menopause is associated with the apolipoprotein E genotype. A population-based longitudinal study. Atherosclerosis 2004;175(1):169–176. doi: 10.1016/j.atherosclerosis.2004.04.001 [DOI] [PubMed] [Google Scholar]
- 34.Riedel BC, Thompson PM, Brinton RD. Age, APOE and sex: Triad of risk of Alzheimer’s disease. J Steroid Biochem Mol Biol 2016;160:134–147. doi: 10.1016/j.jsbmb.2016.03.012 [DOI] [PMC free article] [PubMed] [Google Scholar]
- 35.McGuinness B, Craig D, Bullock R, Passmore P. Statins for the prevention of dementia. Cochrane Database Syst Rev 2016;1:CD003160. doi: 10.1002/14651858.CD003160.pub3Zhou2021 [DOI] [PMC free article] [PubMed]
- 36.Poly TN, Islam MM, Walther BA, et al. Associations between use of statin and risk of dementia: A meta-analysis of observational studies. Neuroepidemiology 2020;54:214–226. doi: 10.1159/000503105 [DOI] [PubMed] [Google Scholar]
- 37.Rizzi L, Rosset I, Roriz-Curz M. Global epidemiology of dementia: Alzheimer’s and vascular types. Biomed Res Int 2014;2014:908915. doi: 10.1155/2014/908915 [DOI] [PMC free article] [PubMed] [Google Scholar]
- 38.Grant WB. Using multicountry ecological and observational studies to determine dietary risk factors for Alzheimer’s disease. J Am Coll Nutr 2016;35(5):476–489. doi: 10.1080/07315724.2016.1161566 [DOI] [PubMed] [Google Scholar]
- 39.Damasceno NR, Sala-Vila A, Cofán M, et al. Mediterranean diet supplemented with nuts reduces waist circumference and shifts lipoprotein subfractions to a less atherogenic pattern in subjects at high cardiovascular risk. Atherosclerosis 2013;230(2): 347–353. doi: 10.1016/j.atherosclerosis.2013.08.014 [DOI] [PubMed] [Google Scholar]
- 40.Siervo M, Lara J, Chowdhury C, Ashor A, Oggioni C, Mathers JC. Effects of the Dietary Approach to Stop Hypertension (DASH) diet on cardiovascular risk factors: A systematic review and meta-analysis. BJN 2015;113:1–15. doi: 10.1017/S0007114514003341 [DOI] [PubMed] [Google Scholar]
- 41.Kahleova H, Levin S, Barnard ND. Vegetarian dietary patterns and cardiovascular disease. Prog Cardiovasc Dis 2018;61:54–61. doi: 10.1016/j.pcad.2018.05.002 [DOI] [PubMed] [Google Scholar]
- 42.McGrattan AM, McGuinness B, McKinley MC, et al. Diet and inflammation in cognitive ageing and Alzheimer’s disease. Curr Nutr Rep 2019;8:53–65. doi: 10.1007/s13668-019-0271-4 [DOI] [PMC free article] [PubMed] [Google Scholar]
- 43.Morris MC, Tangney CC, Wang Y, Sacks FM, Bennett DA, Aggarwal NT. MIND diet associated with reduced incidence of Alzheimer’s disease. Alzheimers Dement 2015;11(9):1007–1014. doi: 10.1016/j.jalz.2014.11.009 [DOI] [PMC free article] [PubMed] [Google Scholar]
- 44.Freeman LR, Haley-Zitlin V, Rosenberger DS, Granholm A-C. Damaging effects of a high-fat diet to the brain and cognition: A review of proposed mechanisms. Nutr Neurosci 2014;17(6):241–251. doi: 10.1179/1476830513Y.0000000092 [DOI] [PMC free article] [PubMed] [Google Scholar]
- 45.Refolo LM, Pappolla MA, Malester B, et al. Hypercholesterolemia accelerates the Alzheimer’s amyloid pathology in a transgenic mouse model. Neurobiol Dis 2000;7:321–331. doi: 10.1006/nbdi.2000.0304 [DOI] [PubMed] [Google Scholar]
- 46.Bracko O, Vinarcsik LK, Cruz Hernández JC, et al. High fat diet worsens Alzheimer’s disease-related behavioral abnormalities and neuropathology in APP/PS1 mice, but not by synergistically decreasing cerebral blood flow. Sci Rep 2020;10(1):9884. doi: 10.1038/s41598-020-65908-y [DOI] [PMC free article] [PubMed] [Google Scholar]
- 47.Johnson LA, Torres ERS, Impey S, Stevens JF, Raber J. Apolipoprotein E4 and insulin resistance interact to impair cognition and later the epigenome and metabolome. Sci Rep 2017;7:43701. doi: 10.1038/srep43701 [DOI] [PMC free article] [PubMed] [Google Scholar]
- 48.Gamba P, Testa G, Gargiulo S, Staurenghi E, Poli G, Leonarduzzi G. Oxidized cholesterol as the driving force behind the development of Alzheimer’s disease. Front Aging Neurosci 2015;7:1–21. doi: 10.3389/fnagi.2015.00119 [DOI] [PMC free article] [PubMed] [Google Scholar]
- 49.Otaegui-Arrazola A, Menendez-Carreno M, Ansorena D, Astiasaran I. Oxysterols: A world to explore. Food and Chemical Toxicology 2010;48:3289–3303. doi: 10.1016/j.fct.2010.09.023 [DOI] [PubMed] [Google Scholar]
- 50.U.S. Food and Drug Administration. Trans fat. U.S. Food and Drug Administration May 18, 2018. Accessed October 17, 2022. https://www.fda.gov/food/food-additives-petitions/trans-fat
Associated Data
This section collects any data citations, data availability statements, or supplementary materials included in this article.