

Abstract
Background:
Fibroblast Growth Factor Receptor-3 (FGFR3) gain-of-function mutations are linked to achondroplasia. Infigratinib, a FGFR1-3 tyrosine kinase inhibitor, improves skeletal growth in an achondroplasia mouse model. FGFs and their receptors have critical roles in developing teeth, yet effects of infigratinib on tooth development have not been assessed. Dentoalveolar and craniofacial phenotype of Wistar rats dosed with low (0.1 mg/kg) and high (1.0 mg/kg) dose infigratinib were evaluated using micro-computed tomography, histology, and immunohistochemistry.
Results:
Mandibular third molars were reduced in size and exhibited aberrant crown and root morphology in 100% of female rats and 80% of male rats at high doses. FGFR3 and FGF18 immunolocalization and extracellular matrix protein expression were unaffected, but cathepsin K (CTSK) was altered by infigratinib. Cranial vault bones exhibited alterations in dimension, volume, and density that were more pronounced in females. In both sexes, interfrontal sutures were significantly more patent with high dose versus vehicle.
Conclusions:
High dose infigratinib administered to rats during early stages affects dental and craniofacial development. Changes in CTSK from infigratinib in female rats suggest FGFR roles in bone homeostasis. While dental and craniofacial disruptions are not expected at therapeutic doses, our findings confirm the importance of dental monitoring in clinical studies.
Keywords: Mineralized Tissue/Development, Tooth Development, Bone, fibroblast growth factor receptor
INTRODUCTION
Achondroplasia in humans, with an estimated prevalence of 0.36 to 0.60 per 10,000 live births and affecting approximately 250,000 people worldwide,1 is characterized by rhizomelic short stature, variable craniofacial abnormalities, as well as varying degrees of kyphosis and hyperlordosis 2,3. Proximal limb shortening contributes to short stature in achondroplasia and may ultimately impair functionality and activities of daily living 4.
Achondroplasia is linked to gain-of-function mutations in a receptor tyrosine kinase, fibroblast growth factor receptor 3 (FGFR3), most notably a G380R variant within the transmembrane domain 5–7. FGFR3 is expressed abundantly in proliferating chondrocytes 8. In the case of achondroplasia, activating FGFR3 mutations result in constitutive signaling and consequent inhibition of chondrocyte proliferation and differentiation, necessary processes for endochondral bone growth 9. As a result, growth plates in children with achondroplasia are disorganized and long bones fail to achieve normal lengths 10.
Achondroplasia is also associated with craniofacial abnormalities, most notably frontal bossing, midface retrusion, and macrocephaly 2,3. Rarely, patients may also present with craniosynostosis 11–13. FGF signaling in cranial morphogenesis has been well characterized. For example, Fgfr1-3 are expressed by pre-osteoblasts and osteoblasts within craniofacial bones and in vitro stimulation of primary calvarial bone cells with FGF2 and −9 induces the proliferation of mature osteoblasts 8,14. Furthermore, more recent data suggest that FGFR3 activation may impact intramembranous ossification, the process by which most craniofacial bones form 15,16.
Despite being first characterized in 1878 17, little is known about dental development in achondroplasia, in part due to highly variable clinical manifestations. Dental development appears to proceed normally in many individuals with achondroplasia, though Class III malocclusion and open or cross bites may be present in a subset of patients 18,19. Furthermore, there have been reports of severe periodontitis in one patient, as well as seemingly paradoxical presentations of supernumerary teeth and oligodontia in others 19–21. On the other hand, the critical role of FGF signaling in normal tooth development has been well documented. FGF ligands including FGF1, 2, 4, 8, and 9, with reported binding to FGFR3, have been identified to play a role in tooth development 22–24. FGF4, 8, and FGF9 have been detected in the dental epithelium and enamel organ 25–27. FGF2 is detected in differentiating osteoblasts and is believed to promote chondrocyte and osteoblast proliferation and is reported to regulate the mineralization process 28. FGF9 deletions do not appear to affect tooth formation; however, there may be compensatory effects and redundancy in function among members of the FGF family 23,24,29,30.
Some therapies, including infigratinib (a.k.a. BGJ398), a receptor tyrosine kinase inhibitor selective for FGFRs, aim to address stature and limb length by inhibiting FGFR3 constitutive signaling. At the molecular level, infigratinib competes for the widely conserved ATP-binding pocket on FGFRs, thus rendering infigratinib a pan-FGFR inhibitor, although biochemical and cell-free kinase assays suggest increased selectivity of FGFR3 versus FGFR1-2 31,32. In a mouse model of achondroplasia, inhibition of constitutive FGFR3 signaling via infigratinib has been shown to increase limb length and improve calvarial defects 33. However, while evidence of FGFR3 inhibition leading to physiological improvement in mice is promising, it is important to consider possible side effects of drugs on other organ systems with similar receptors.
To date, the effect of infigratinib on tooth development has not been assessed, despite previous studies of its effects on skeletal tissues in juvenile rodents 33. Additionally, studies in humans are further limited by the fact that the drug is currently only used as oncologic treatment in adults, i.e., when all teeth have completed development. Studies on the use of infigratinib in children with achondroplasia are currently in progress (NCT04265651; NCT05145010), thus understanding its potential effects on tooth development is critical. Given the widespread expression of FGFs and FGFRs in developing teeth, we hypothesize that infigratinib affects dentoalveolar development in a dose-dependent and spatiotemporal manner. To determine the dental effects of infigratinib and assist in elucidating FGFR3 roles during tooth development, we conducted a microscopic analysis of dentoalveolar tissues obtained from wild-type rats dosed with infigratinib.
RESULTS
Infigratinib exposures decline with age
Because infigratinib is metabolized mainly via CYP 3A4 in the liver34,35 , we expect higher exposure levels of infigratinib at younger ages when livers are immature. To evaluate the exposure of infigratinib on developing rats, infigratinib was administered by oral gavage to 105 male and 105 female juvenile rats once daily from PND 7 through 35. These rats were divided into three groups, which received either 0.1, 0.3, or 1.0 mg/kg/day. 15 males and 15 females received vehicle. Infigratinib plasma concentrations were measured each day (Table 1). There were no quantifiable infigratinib concentrations in any vehicle control group samples on any evaluation day, or in samples collected from infigratinib-assigned groups prior to dose administration on PND7. Following oral administration of 0.1, 0.3, or 1 mg/kg/day infigratinib, infigratinib plasma concentrations were quantifiable from 0.5 through 24 hours postdose on PND7, and from prior to dose administration through 24 hours postdose on PND12, 17, and 23, except for the low dose (0.1 mg/kg/day) males and females on PND23 (concentrations were below quantitation limit (BQL) prior to dose administration and at 24 hours postdose). On PND35, infigratinib plasma concentrations were quantifiable from predose (0.3 and 1.0 mg/kg/day females only) or 0.5 through 12 hours postdose at all dose levels, except for the low dose females (concentrations were BQL at 12 hours postdose). Peak plasma concentrations of infigratinib were observed at 1 or 3 hours postdose in all groups on all evaluation days, and plasma concentrations generally peaked earlier in younger animals. Overall, at most time points and doses, Cmax (maximum concentration) and AUC (area under curve) values were higher in females compared to males. When a comparison of AUC on the first dosing day to AUC on subsequent days was calculated (relative AUC or RAUC), females exhibited lower RAUC values compared to males, suggesting a higher infigratinib clearance rate in female rats.
Table 1. Infigratinib Exposure (AUC and Cmax) in Juvenile Rats (Males and Females Combined).
Rats were exposed to either vehicle or infigratinib (0.1mg/kg/day, 0.3mg/kg/day, or 1.0mg/kg/day) from PND7-35. Infigratinib exposure levels were higher in PND7-17 compared to PND23-35. Toxicokinetic Parameters for Infigratinib in Juvenile Wistar Hannover Rat Plasma on PND 7, 12, 17, 23, and 35 after Oral Administration of Infigratinib
| BGJ398 | Gender | Dose mg/kg/day | PND | AUC(0-t) (ng*h/mL) | AUC(0-t)/D | Cmax (ng/mL) | Cmax/D | Tmax (h) | Tlast (h) | T1/2 (h) | RAUC (ratio) |
|---|---|---|---|---|---|---|---|---|---|---|---|
| Male | 0.1 | 7 | 31.9 | 319 | 3.21 | 32.1 | 3 | 24 | 5.1 | NA | |
| 12 | 39.4 | 394 | 3.32 | 33.2 | 3 | 24 | 6.34 | 1.24 | |||
| 17 | 28.1 | 281 | 2.99 | 29.9 | 3 | 24 | 5.87 | 0.882 | |||
| 23 | 3.81 | 38.1 | 0.577 | 5.77 | 3 | 12 | NC | 0.12 | |||
| 35 | 1.95 | 19.5 | 0.307 | 3.07 | 1 | 12 | 2.2 | 0.0613 | |||
| 0.3 | 7 | 114 | 381 | 11.6 | 38.8 | 3 | 24 | 5.58 | NA | ||
| 12 | 149 | 498 | 14.1 | 47.1 | 3 | 24 | 3.75 | 1.3 | |||
| 17 | 103 | 342 | 8.12 | 27.1 | 3 | 24 | 4.59 | 0.898 | |||
| 23 | 21.5 | 71.5 | 2.13 | 7.1 | 3 | 24 | 4.37 | 0.187 | |||
| 35 | 6.0 | 20.0 | 0.924 | 3.08 | 3 | 12 | NC | 0.0524 | |||
| 1.0 | 7 | 375 | 375 | 37.3 | 37.3 | 7 | 24 | NC | NA | ||
| 12 | 596 | 596 | 68.8 | 68.8 | 3 | 24 | 3.33 | 1.59 | |||
| 17 | 354 | 354 | 34.1 | 34.1 | 3 | 24 | 3.67 | 0.944 | |||
| 23 | 87.2 | 87.2 | 11.2 | 11.2 | 3 | 24 | 3.64 | 0.233 | |||
| 35 | 24.3 | 24.3 | 2.98 | 2.98 | 3 | 12 | NC | 0.0648 | |||
|
| |||||||||||
| Female | 0.1 | 7 | 43 | 430 | 4.18 | 41.8 | 3 | 24 | 4.7 | NA | |
| 12 | 40.5 | 405 | 3.4 | 34.0 | 3 | 24 | 5.66 | 0.941 | |||
| 17 | 36.1 | 361 | 9.06 | 90.6 | 1 | 24 | 4.96 | 0.839 | |||
| 23 | 4.66 | 46.6 | 0.78 | 7.8 | 3 | 12 | NC | 0.108 | |||
| 35 | 1.4 | 14 | 0.3 | 3.0 | 1 | 7 | NC | 0.0325 | |||
| 0.3 | 7 | 183 | 609 | 19.4 | 64.7 | 3 | 24 | 4.26 | NA | ||
| 12 | 137 | 457 | 14.9 | 49.7 | 3 | 24 | 3.82 | 0.751 | |||
| 17 | 100 | 333 | 18.1 | 60.2 | 1 | 24 | 4.21 | 0.548 | |||
| 23 | 18.8 | 62.6 | 2.25 | 7.49 | 3 | 24 | 4.53 | 0.103 | |||
| 35 | 4.54 | 15.1 | 0.66 | 2.2 | 3 | 12 | NC | 0.0249 | |||
| 1.0 | 7 | 516 | 516 | 53.2 | 53.2 | 3 | 24 | 5.23 | NA | ||
| 12 | 593 | 593 | 56.6 | 56.6 | 1 | 24 | 3.97 | 1.15 | |||
| 17 | 503 | 503 | 41.2 | 41.2 | 3 | 24 | 3.41 | 0.974 | |||
| 23 | 73 | 73 | 10.4 | 10.4 | 1 | 24 | 3.25 | 0.141 | |||
| 35 | 29.2 | 29.2 | 4.04 | 4.04 | 1 | 12 | 2.51 | 0.0566 | |||
Units for dose-normalized AUC and Cmax are (ng*h/mL)/(mg/kg/day) and (ng/mL)/(mg/kg/day), respectively
PND = postnatal day NA = not applicable NC = not calculable
To assess whether potential effects correlated with reduced body weight, weights of rats at time of sacrifice were recorded (data not shown). Although non-significant at PND37, female rats receiving high dose infigratinib exhibited a trend toward lower body weight compared to vehicle and low dose groups. Males did not exhibit any measurable differences in weight between all groups (data not shown).
Effects of infigratinib on dentoalveolar development
We observed that high dose infigratinib (1mg/kg) causes changes in the formation of dentoalveolar tissues. Rats were first dosed at PND7, which features mandibular first, second, and third molars at different stages of tooth development, allowing us to examine the effects of infigratinib on multiple tooth developmental processes.
In PND14 female and male rats, unerupted mandibular first and second molar crowns were evident with distinct mineralized enamel and dentin layers. Significant changes in enamel, dentin, and alveolar bone volumes were not detected between groups (Figure 1; refer to Figure 7 for detailed microCT schematics). Enamel, dentin, and alveolar bone densities were comparable between groups, with the exception of decreased alveolar bone density in high dose females versus vehicle (Figure 1L).
Figure 1. Quantitative analysis of PND14 mandibular first and second molar enamel, dentin, and surrounding alveolar bone volumes and densities.
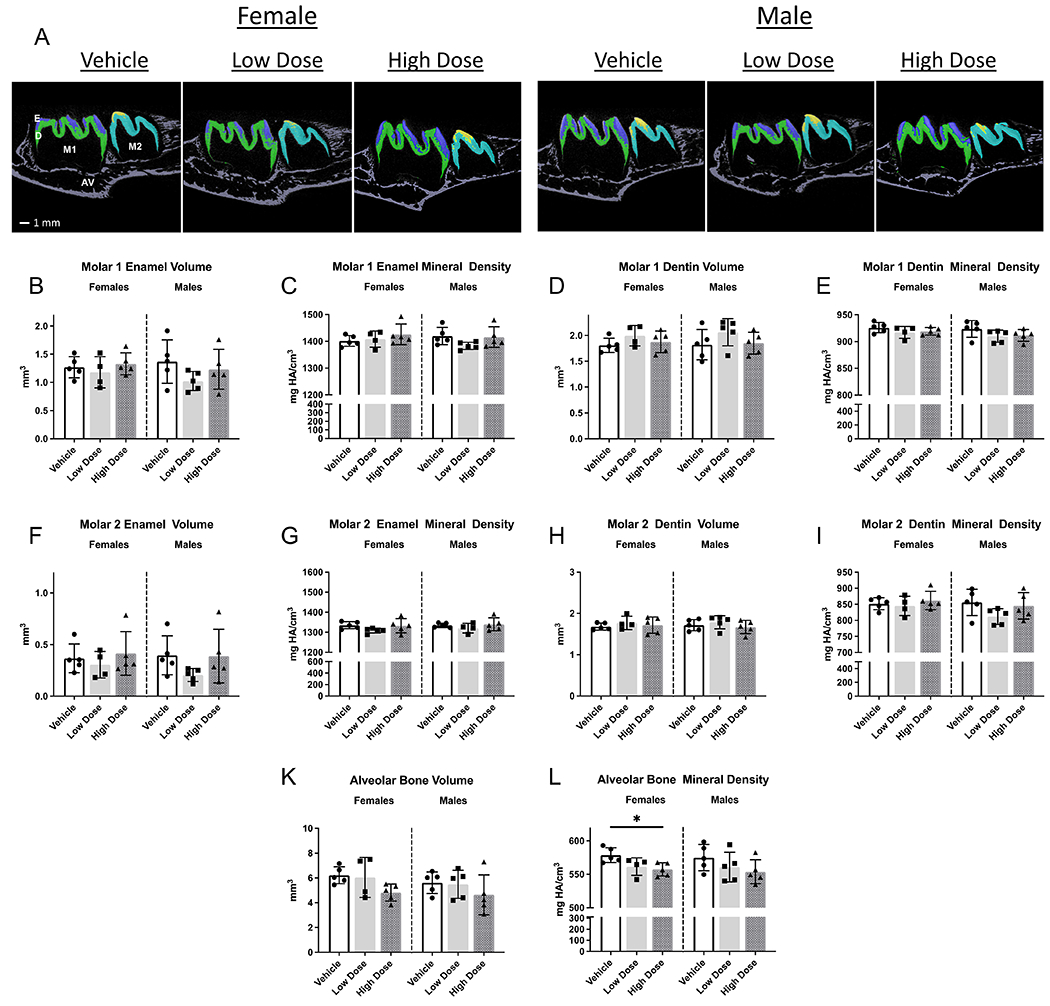
Alveolar bone mineral density was lower in female rats receiving high dose infigratinib compared to vehicle. In male rats, alveolar bone mineral density trended lower with high dose infigratinib compared to vehicle. One way ANOVA was performed, significance designated as p<0.05. * p<0.05. E=enamel, D=dentin, AV=alveolar bone, M1=mandibular first molar, M2=mandibular second molar.
Figure 7. Reconstructions of mandibles and third molars used for microCT analysis on AnalyzePro.
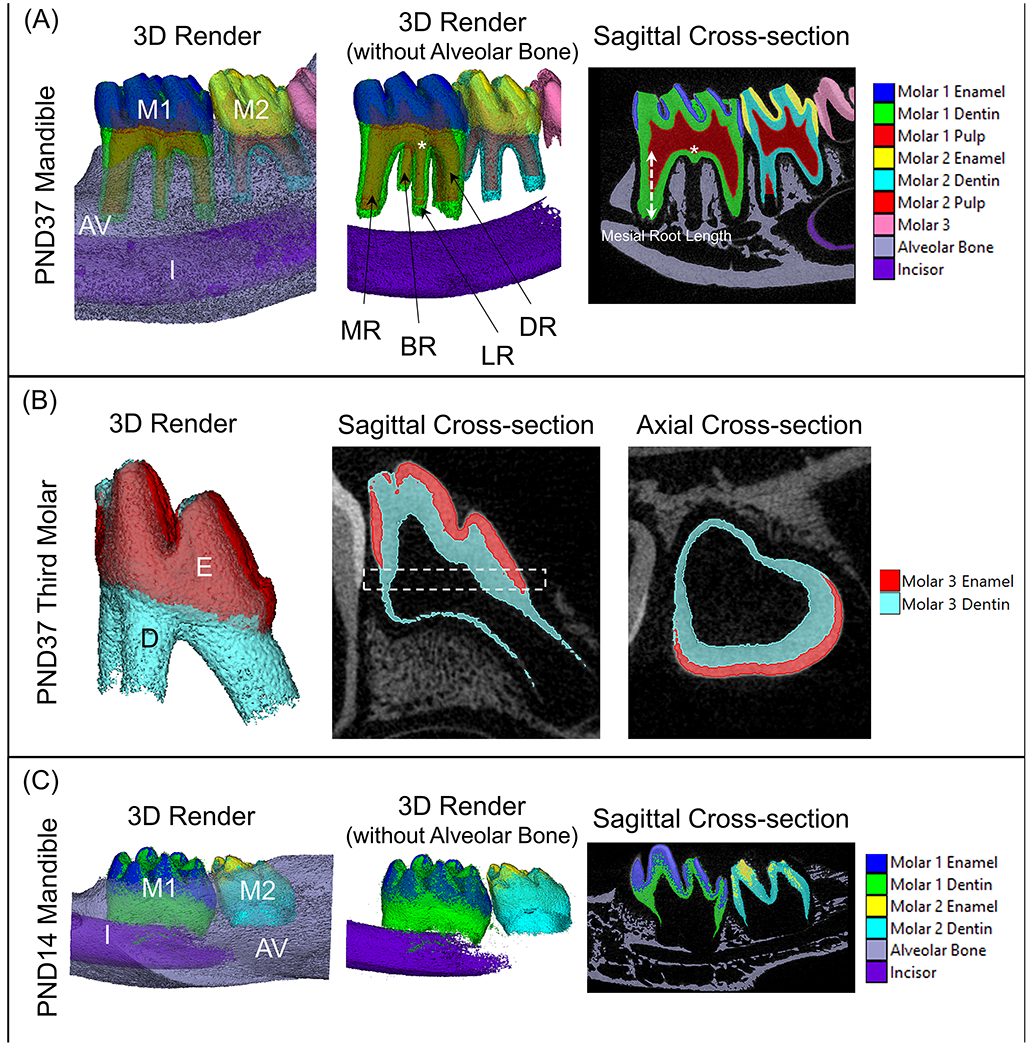
(A) The region of interest for PND37 mandibles consisted of the first and second molars, as well as the alveolar bone extending from 824 μm mesial to the first molar mesial height of contour and 824 um distal to the second molar distal height of contour. Enamel, dentin, and alveolar bone were segmented using density thresholds and the pulp was segmented using a combination of semiautomatic and manual methods. Volumes and densities of corresponding tissues were then obtained using the Measure tool with AnalyzePro. First molar root lengths were defined as the distance from the furcation to the apex of the root. (B) As PND37 third molars were not fully matured, the thickness of the developing enamel and dentin layers were analyzed. The region of interest was defined as mid-crown (dotted box), which was then run through the Bone Microarchitecture application on AnalyzePro to obtain the average thickness of the two layers. (C) First and second molars and alveolar bone of PND14 mandibles were analyzed in a similar fashion to PND37 mandibles, with lower density thresholds owing to the immaturity of the teeth. Root lengths were not able to be measured as root elongation had not yet begun. M1=mandibular first molar, M2=mandibular second molar, AV=alveolar bone, I=incisor, MR=mesial root, BR=buccal root, LR=lingual root, DR=distal root.
By PND37, all mandibular molars had erupted into the oral cavity, with root length essentially completed for mandibular first and second molars (Figure 2A). In comparison to the other groups, high-dose PND37 female rat first molars and surrounding bone exhibited statistically significant differences: reduced dentin volume (12%); reduced pulp volume (20%) and reduced alveolar bone volume (11%) (Figure 2F, J, L). No differences were detected in mandibular first molar enamel or dentin densities between all groups (Figure 2E; dentin density not shown). Second molars exhibited similar significant changes in dentin volume, dentin density, and pulp volume (Figure 3C, D, E). Furthermore, teeth in high-dose female rats exhibited a significant increase in pulp density of mandibular second molars, which was absent in first molars (Figure 3F). In PND37 male rats, only dentin mineral density of second molars was significantly higher in high dose vs vehicle (Figure 3D). Infigratinib did not significantly affect enamel volume, enamel density, or alveolar bone density with either infigratinib dose, as evaluated by microCT (Figure 2B, C, M; Figure 3A, B). To determine if there were infigratinib specific effects on root development, root lengths were obtained for mandibular first and second molars. Female high dose rats had significantly shorter mesial and lingual first molar roots, with decreases of 8% and 9%, respectively, compared to female vehicle rats (Figure 3G, H). No changes in first molar root lengths were observed in low or high dose male rats. Additionally, when dentin was segmented into crown and root regions, we found that crown dentin volumes did not differ between groups, but root dentin volume was significantly lower by 21% in high dose female and 16% in high dose male rats versus vehicle rats (Figure 2F, G).
Figure 2. Development of dentoalveolar tissues is affected by high dose infigratinib.
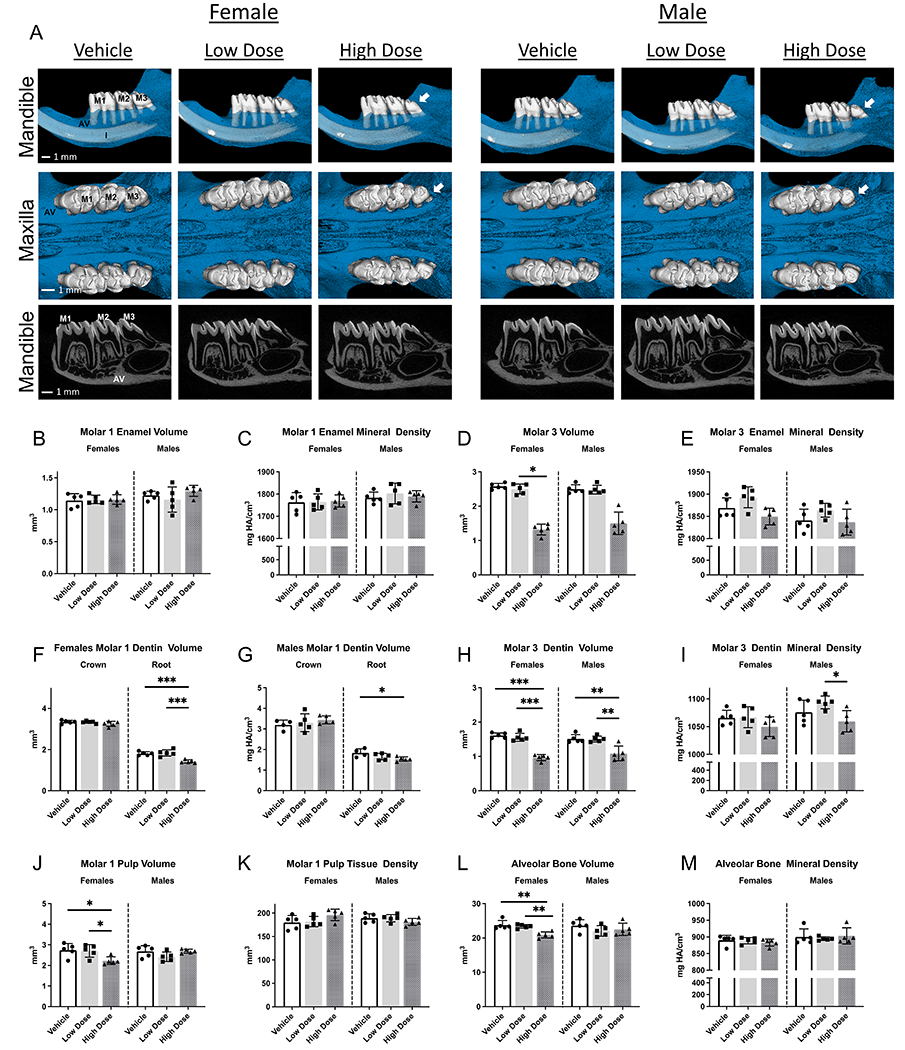
2D and 3D images of mandibles and maxillae from PND37 rats dosed with either vehicle, low dose infigratinib, or high dose infigratinib. Crown and root morphology altered in mandibular and maxillary third molars in high dose male and female rats, e.g., smaller crowns, loss of cusps, and peg shaped roots observed. Quantitative analysis was performed for mandibular first and third molars as well as surrounding alveolar bone. Statistical significance was designated as* p<0.05. ** p<0.01. ***P<0.001. ****p<0.0001. AV=alveolar bone, M1=mandibular first molar, M2=mandibular second molar, M3=mandibular third molar, I=incisor.
Figure 3. Further quantitative analysis of PND37 mandibular molars.
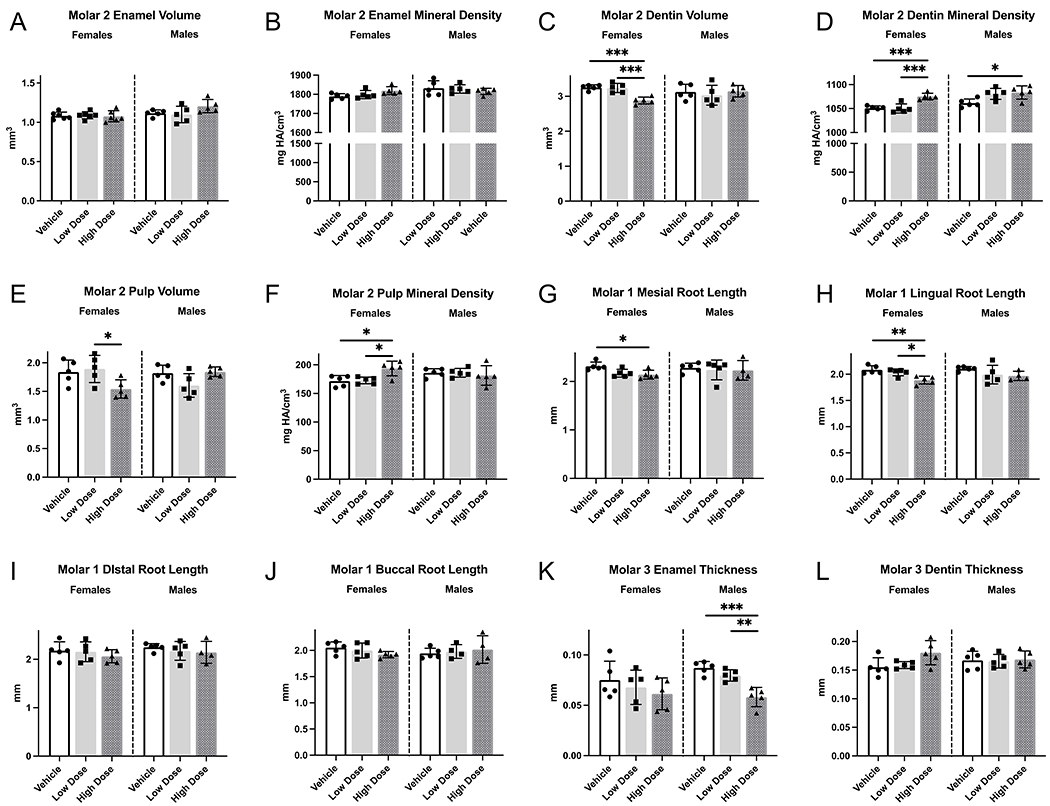
(A-F) Volumes and densities of second molar enamel, dentin, and pulp were obtained. Dentin volume was lower and dentin mineral density was higher in female rats receiving high dose infigratinib compared to vehicle and low dose infigratinib. (G-J) Mesial, distal, buccal, and lingual root lengths were obtained in PND37 mandibular first molars. Enamel and dentin thicknesses were obtained in PND37 mandibular third molars. Female rats exhibited shorter mesial and lingual roots with high dose infigratinib compared to vehicle. (K, L) Male rats exhibited reduced enamel thickness with high dose infigratinib vs vehicle. One way ANOVA was performed, significance designated as p<0.05. * p<0.05, ** p<0.01, *** p<0.001.
Mandibular third molars, which were at the earliest stage of tooth development (cap stage) when rats were first dosed at PND7, exhibited aberrant crown and root morphology in 100% of high dose female rats and in 80% of high dose male rats (Figure 2A, arrows). The changes included reduced numbers of cusps and roots. In rats that exhibited altered morphology, all maxillary and mandibular third molars were affected. In high dose female and male rats, mandibular third molars were significantly smaller. Female rats treated with high dose infigratinib had 64% lower enamel and 40% lower dentin volumes compared to vehicle, while high dose-treated male rats had 61% lower enamel and 28% lower dentin volumes (Figure 2D, H). Enamel thickness trended toward lower values in the female high dose group and was significantly lower by 33% in the male high dose group versus vehicle (Figure 3K). Low dose-treated male and female rats exhibited intermediate values between vehicle and high dose rats. Differences in dentin thickness were not detected between any group (Figure 3L). Enamel and dentin densities were unchanged by infigratinib in female rats, although high dose treated male rats exhibit significantly lower dentin densities in comparison to low dose treated male rats (but not vehicle) (Figure 2I).
In PND14 rats, when cusp morphology has been established, the developing dentin and enamel layers can be seen, and although shape is altered in molars exposed to high dose infigratinib, odontoblast and ameloblast polarization was not affected (Figure 4A–D, K–N). In mandibular third molars, FGFR3 was highly expressed in the enamel organ, specifically within the stratum intermedium and stellate reticulum (Figure 4E–G, O–Q). Neither the level nor localization of expression appeared to be affected by infigratinib at low or high dose, with equal expression across groups and sex. FGF18, a ligand with a unique role in chondrogenic signaling through FGFR336, was also found to be expressed in ameloblasts, odontoblasts, and throughout the pulp cavity (Figure 4H–J, R–T).
Figure 4. FGFR3 is expressed in the enamel organ and its ligand FGF18 is expressed in ameloblasts and odontoblasts of the developing third molar.
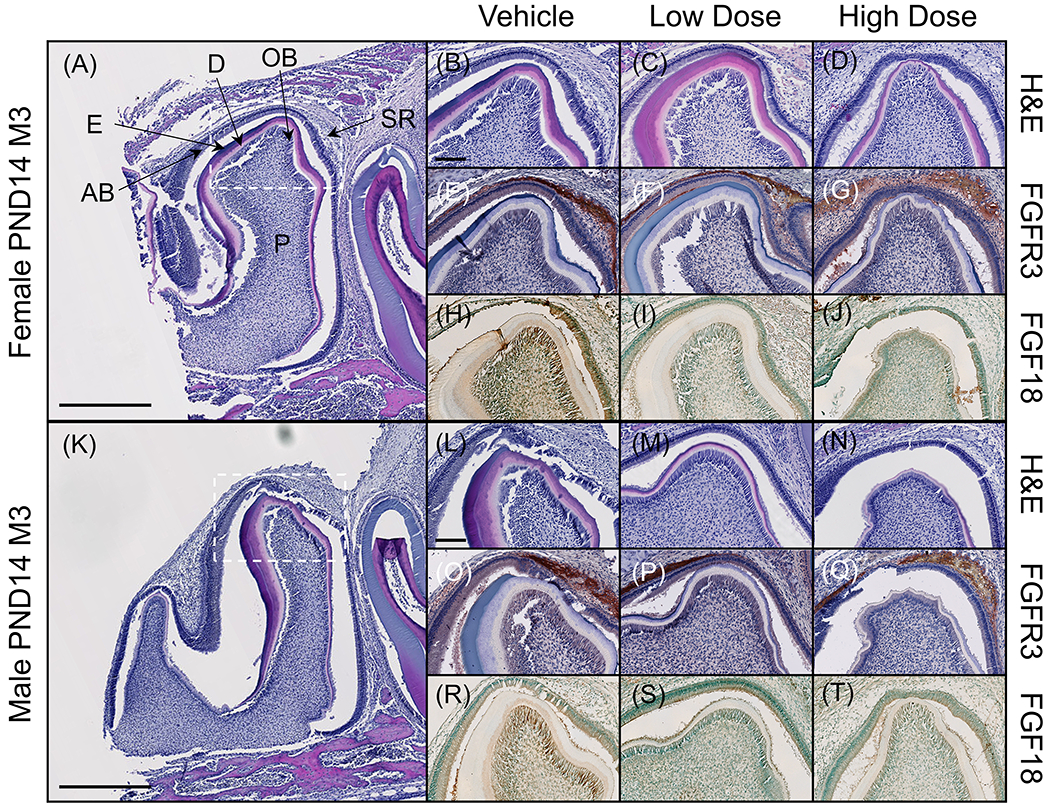
(A, K) Sectioned mandibles were stained for H&E to assess tissue morphology. Third molars of PND14 rats were determined to be in late bell stage and were chosen for further immunohistochemical analysis to investigate where in the developing tooth FGFR3 is expressed. Higher magnification micrographs correspond to the cusp of the third molar (dotted box). (B-D, L-N) At PND14, layers of enamel and dentin can be observed in the third molar and the enamel organ can be observed around the cusps. (E-G, O-Q) Immunostaining for FGFR3 revealed expression within the enamel organ, particularly within the stellate reticulum and stratum intermedium. Expression did not appear to be affected by infigratinib treatment. (H-J, R-T) FGF18, a ligand of FGFR3, was found to be expressed in ameloblasts and odontoblasts and, to a lesser extent, throughout the pulp chamber. Scale bars: 500 μm (A, K) and 100 μm (B-J, L-T). AB=ameloblasts D=dentin, E=enamel. OB=odontoblasts, P=pulp, SR=stellate reticulum.
By PND37, mandibular first and second molars root development had been completed, whereas the third molar had not achieved its final root length. Histological sections of the first molar showed comparable dentin and cementum development across groups, and the periodontal space was maintained regardless of treatment (Figure 5A–D, N–Q). Alveolar bone morphology was also comparable between groups. Given the alveolar bone volumetric changes previously observed on microCT, we stained for extracellular matrix proteins highly expressed in bone: bone sialoprotein (BSP) and osteopontin (OPN). Both extracellular proteins were detected in cementum and alveolar bone (Figure 5E–J, R–W). In alveolar bone, BSP and OPN expression was variable within and between groups for both sexes, resulting in no significant changes in expression (Figure 5AA, AB). No changes in expression were observed in acellular cementum. On histological examination, several samples exhibited root resorption (Figure 5K, X). Staining for cathepsin K labeled resorptive cells in resorption lacunae revealed that 25% of male rats treated with vehicle showed areas of root resorption, whereas no male rats in either low or high dose groups exhibited root resorption (Figure 5AC). On the other hand, 75% of female rats treated with vehicle were found to have root resorption, 50% in the low dose group, and 25% in the high dose group (Figure 5AC). While expression of cathepsin K along the root surface appeared to decrease in response to infigratinib, this trend was insignificant (Figure 5AD). Finally, cathepsin K expression was noted along alveolar bone surfaces in all groups in comparable amounts, except for high dose female rats who exhibited high expression compared to low dose female rats (Figure 5AE)
Figure 5. Infigratinib does not alter expression of extracellular matrix proteins but may alter osteoclast activity.
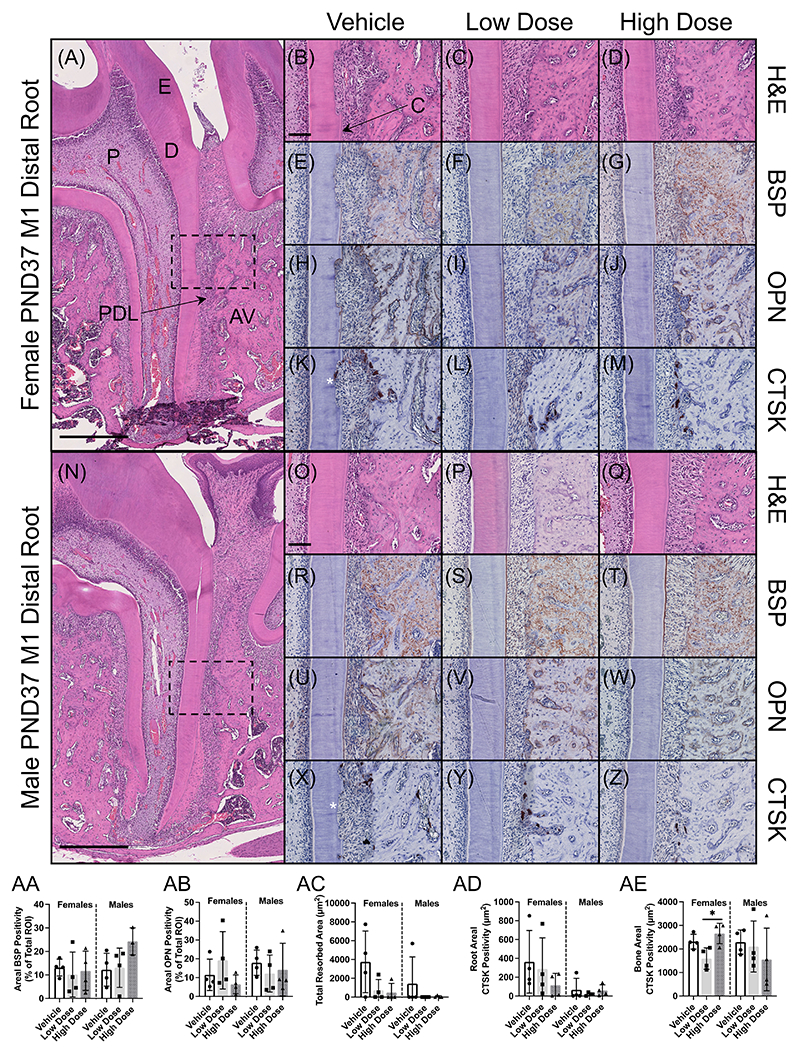
(A, N) Sectioned mandibles were stained for H&E to assess tissue morphology. Higher magnification micrographs correspond to the mid-distal root of the first molar and adjacent alveolar bone (dotted boxes). (E-J, R-W) Given the changes in alveolar bone volume and density measured on microCT, we stained for bone sialoprotein (BSP) and osteopontin (OPN), two extracellular matrix proteins critical for bone formation. (K-M, X-Z) Upon histological evaluation, it was observed that several rats were exhibiting root resorption (asterisks). Osteoclast activity was assessed by staining for cathepsin K (CTSK). (AA, AB) Quantitation of BSP and OPN expression using QuPath revealed that expression was highly variable within and between groups, with no significant changes associated with infigratinib treatment. (AC) The area of resorption pits was measured using QuPath, revealing an insignificant trend toward decreased resorption in response to infigratinib. (AD, AE) CTSK expression was quantified along the distal root surface and alveolar bone surface, demonstrating a similar trend along the root surface. Scale bars: 500 μm (A, N) and 100 μm (B-M, O-Z). AV=alveolar bone, C=acellular cementum, D=dentin, E=enamel, P=pulp, PDL=periodontal ligament.
Effects of infigratinib on craniofacial bone development
Because we observed alterations in alveolar bone development from high dose infigratinib, we conducted microCT analyses to further assess cranial bone development. Bone volume and mineral density were calculated for nasal, premaxilla, maxilla, frontal, parietal, and interparietal bones. To determine whether skull dimensions were affected, linear measurements were obtained using previously reported landmarks 37. Despite lower body weight, female rats treated with high dose versus low dose infigratinib or vehicle, showed no differences in skull length (Figure 6B). However, a trend toward increased parietal and decreased frontal bone length was noted in female rats treated at high dose treatment, which was not seen at low doses (Figure 6F, G). Male rats receiving high dose infigratinib exhibited a similar trend in frontal bone length (Figure 6F).
Figure 6. Examination of craniofacial skeletal phenotype of Wistar rats dosed with vehicle, low dose, or high dose infigratinib at PND14 and PND37.
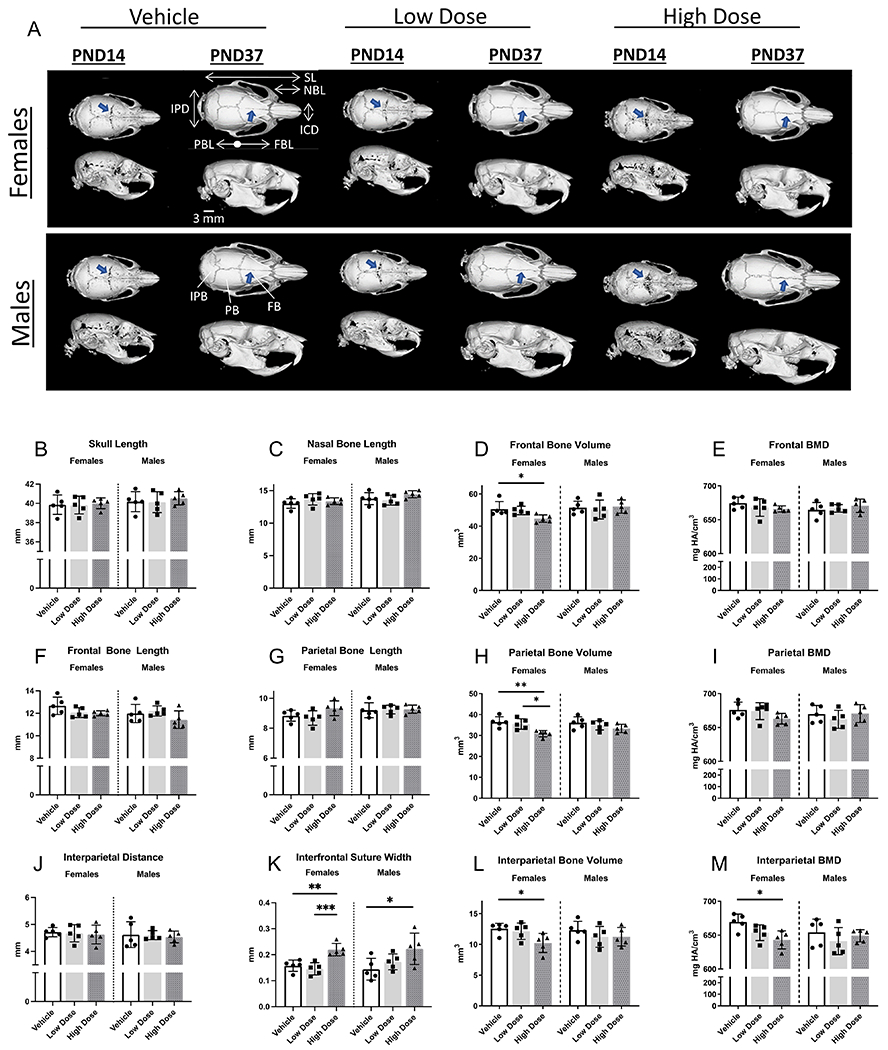
Initiation of dosing was at postnatal day 7 (PND7). Coronal sutures appeared more patent in male and female rats receiving high dose infigratinib compared to vehicle and low dose (arrows). Craniofacial measurements were obtained (2D and 3D), and craniofacial development appeared to be more sensitive to infigratinib in females vs males. IPD=interparietal distance, SL=skull length, NBL=nasal bone length, ICD=inner canthal distance, PBL=parietal bone length, FBL=frontal bone length. IPB=interparietal bone, PB=parietal bone, FB=frontal bone.
Parietal bone volumes of high dose-treated female rats were significantly lower (18%) compared to rats receiving either vehicle or low dose (15%) (Figure 6H). Compared to female rats that received vehicle, frontal and interparietal bone volumes were significantly lower in female rats that received high dose infigratinib (12% and 18% decrease, respectively; Figure 6D, L). Compared to vehicle treated animals, parietal bone mineral density in high dose females trended toward lower values (Figure 6I). In high dose females, interparietal bone mineral density exhibited a 4% decrease compared to vehicle (Figure 6M). In contrast, males did not exhibit the same effects from infigratinib compared to females. No differences in cranial vault bone volumes or mineral densities were detected between vehicle, low dose, and high dose male rats.
In addition to alterations demonstrated in the cranial vault bone dimensions, volumes, and densities, cranial vault sutures appeared more patent in rats receiving infigratinib versus vehicle (Figure 6A, blue arrows). In PND14 females and males, coronal sutures in low dose and high dose groups appeared more patent compared to vehicle groups. By PND37, coronal sutures were comparable between all groups; however, the interfrontal suture of high dose male and female rats remained patent compared to low dose and vehicle rats. In females, the interfrontal suture was significantly more patent in rats receiving high dose infigratinib compared to vehicle and low dose, whereas in males, the interfrontal suture width was significantly more patent in rats receiving high dose infigratinib compared to vehicle (Figure 6K).
DISCUSSION
FGFR1-4 consist of an extracellular ligand-binding domain with three immunoglobulin-like domains, a single-pass transmembrane domain, and a split intracellular tyrosine kinase domain. FGF-FGFR binding results in FGFR dimerization, tyrosine kinase activation, autophosphorylation, and subsequent activation of downstream pathways 38. Infigratinib is an orally bioavailable, potent, reversible, ATP-competitive inhibitor of FGFR1-3 32.
Infigratinib has been used effectively to treat cancers featuring abnormally high FGFR3 expression, and its usage has been explored to treat other disorders 39–42. To ameliorate skeletal developmental defects associated with achondroplasia, such as rhizomelia and short stature, infigratinib is being administered during childhood and adolescence in ongoing trials 44. Craniofacial abnormalities have been well documented in children and adolescents with achondroplasia, yet few case reports describe dental manifestations 19,45–48. To provide insights into the effects of infigratinib on craniofacial and dentoalveolar development, we conducted detailed micro-computed tomographic and histological analyses on juvenile rats treated with either vehicle or infigratinib at low (0.1 mg/kg) and high doses (1.0 mg/kg). The low dose is comparable to doses being tested in clinical trials of children with achondroplasia.
Our results demonstrated that high dose infigratinib altered formation of craniofacial and dentoalveolar tissues. Overall, females appeared to be more sensitive to infigratinib treatment compared to males. In high dose females, reduction of frontal, parietal, and interparietal bone volumes was observed, along with increased patency of the interfrontal suture. In females and males, third molars exhibited aberrant crown and root morphology with high-dose but not low-dose infigratinib. Reduced dentin volume, reduced pulp volume, increased pulp density, and reduced alveolar bone volume were also observed in females treated with high dose infigratinib. These effects were not noted in male rats at any doses. Histologically, dentin, bone, cementum, pulp, and the periodontal ligament exhibited comparable microarchitecture in all groups, indicating that formation of these tissues was not impaired in the presence of altered morphology. We also detected alterations in localization of FGFs and extracellular matrix proteins.
Roles of infigratinib in craniofacial bone development
The importance of FGFR3 in endochondral ossification is well established, and there is increasing evidence that FGFR3 overactivation leads to disturbances in intramembranous ossification 10,15,49,50. We observed lower alveolar bone volumes in PND37 high dose females and a decrease in alveolar bone mineral density in PND14 high dose females compared to vehicle, further suggesting that intramembranous as well as endochondral ossification is susceptible to FGFR3 disturbances. The absence of alveolar bone mineral density changes at later ages suggests that FGFR3 osteogenic functions are more pronounced in earlier developmental stages. Studies also indicate that FGFR3 overexpression had more pronounced effects on hypertrophic chondrocytes and immature osteoblasts compared to mature osteoblasts 51. To examine bones with different origins and ossification mechanisms, we conducted a gross assessment of cranial vault bones from rats receiving infigratinib versus vehicle 16,52. The cranial vault of rodents includes paired frontal and parietal bones as well as the interparietal bone 53,54. The frontal bones are derived from neural crest and form through intramembranous ossification, whereas the parietal bones, which also form through intramembranous ossification, are derived from mesoderm. The interparietal bone originates from neural crest and mesoderm and forms through endochondral ossification. In our studies, we observed decreased parietal, frontal, and interparietal bone volumes in female rats receiving high dose infigratinib versus vehicle, further supporting roles for FGFR3 in intramembranous as well as endochondral ossification.
Cranial vault development is also dependent on proper fusion of craniofacial sutures. Studies have reported that modulation of FGFRs and FGFs can alter suture patency. For example, in rodent models, injection of FGF2 into a patent suture promotes suture fusion, and injection of a dominant negative form of FGFR1 inhibits suture fusion 55–58. Additionally, in a zebrafish fgfr3 knock-out model, delayed closure of sutures among other craniofacial defects were observed59. We noted increased patency in coronal sutures of PND14 high dose males and females compared to vehicle, and delayed fusion of interfrontal sutures in PND37 high dose males and females. Fusion of the interfrontal suture occurs normally around PND12 to PND22 in rodents, and studies have indicated that a relationship exists between cranial shape, suture morphology, and fusion 60,61. Numerous variants in FGFR1-3 have been implicated in syndromic craniosynostosis and nonsyndromic coronal synostosis 62–66. Many of these reports included FGFR3 gain of function variants, and achondroplasia case reports include incidences of multiple-suture craniosynostosis 12,67. In our study, we observed that increased patency in sutures was accompanied by slight differences in frontal and parietal lengths, demonstrating possible effects from infigratinib in delayed suture fusion. However, studies were conducted on WT rats and do not take into account any pre-existing differences in craniofacial development that may occur in achondroplasia models, thus requiring additional studies on infigratinib and craniofacial development to address these issues..
Effects of infigratinib on dentoalveolar development
Tooth development is a complex and coordinated process in which fibroblast growth factors (FGFs) have critical roles. FGF ligands including FGF1, FGF2, FGF4, FGF8 and FGF9 with reported binding to FGFR1-3 have been identified to play a role in tooth development 22–24,68. FGF8 and FGF9 are typically expressed early in tooth formation during the bud stage (e.g. in dental epithelium) 25–27. Whereas, in later stages of tooth development, FGF4 and FGF9 have been detected in the enamel organ 26. For the first time, we present the effects of FGFR inhibition on multiple stages of tooth development.
We focused on FGFR3 because of its prominent role in the pathogenesis of achondroplasia, and the lack of knowledge regarding the potential of FGFR3 alterations to impact dentoalveolar development. FGFR3 has been detected in the dentoalveolar complex, most prominently in developing tooth germs 25. FGFR3 undergoes alternative mRNA splicing events, which results in IIIb and IIIc variants of the immunoglobulin like domain III 38. The IIIb variant is primarily detected in epithelial lineages, whereas the IIIc variant is predominantly in mesenchymal lineages. Compared to studies on FGFR1 and FGFR2, less is known about the roles of FGFR3 on tooth development. Studies of mouse mandibular molar tooth germs have detected Fgfr3 transcripts in the dental papilla mesenchyme under secreting odontoblasts, Meckel’s cartilage, and developing mandibular bone 25. In posteruptive mouse teeth, Fgfr3c transcripts were detected in odontoblasts and Hertwig’s Epithelial Root Sheath (HERS) 69.
We noted pronounced alterations in third molar crown and root morphology of rats treated with high dose infigratinib. Other than shorter roots with high dose infigratinib, first and second molar crown and root morphology were comparable between all groups. During initiation of infigratinib treatment at PND7, mandibular first, second, and third molars are at different stages of tooth development. The third molar of PND14 rats is in the bell stage, and FGFR3 expression was observed in the stratum epithelium, stellate reticulum, and ameloblasts. Neither the level nor localization of expression appeared to be affected by infigratinib, suggesting that although tyrosine kinase activity was inhibited, infigratinib seemingly does not alter the transcription or translation of FGFR3. Immunostaining of FGF18 revealed the ligand to be in odontoblasts and ameloblasts. Additionally, we were unable to detect distinct FGF4 and FGF9 staining patterns in our immunohistochemistry screen, demonstrating that absence of differences may also reflect limitations of the antibodies.
Despite alterations in crown and root morphology, histological analysis revealed that, other than changes in shape, development of enamel, dentin, and cementum was not significantly altered by high dose infigratinib. When infigratinib was first administered during the bell stages, i.e., mandibular first molars, we did not observe any developmental differences in dentin, bone, cementum at the histological level although root lengths were shorter. Furthermore, other than an increase in dentin mineral density at PND37 between high dose and low dose female rats, mandibular first molar enamel and dentin densities were comparable between rats dosed with infigratinib versus vehicle. In male rats treated with high dose infigratinib, we observed decreases in mandibular third molar enamel and dentin densities, suggesting subtle defects in enamel and dentin mineralization. Female rats exhibited trends toward lower enamel and dentin mineral densities, further indicating sexual dimorphism in FGFR regulation in tooth development. Sexual dimorphism has been reported in tooth development and FGF/FGFR regulation in rodents and in humans 70–72. Additionally, our toxicokinetic studies demonstrated differences in infigratinib exposure and clearance in male versus female rats, indicating another contributing factor to the differences in dentoalveolar phenotypes between male and female rats. Infigratinib exposure was also dependent on age; higher exposures corresponded with younger animals, i.e., when liver enzymes are less mature compared to adults. Delayed maturation in females compared to males may account for different effects on dentoalveolar development from infigratinib. Our results suggest that FGFR roles in teeth are primarily in early events, and these events appear to be epithelial mediated, e.g., epithelial invagination to determine cusp shape and HERS-mediated roles in root development.
Although the most pronounced infigratinib effects occurred when drug initiation is early in tooth development, our results suggest possible effects of infigratinib on mineralized tissues following completion of tooth development. Many FGFs have known roles in bone homeostasis as well as tooth development, notably FGF23 73,74. With increasing evidence that FGFR3 also has roles in intramembranous formation and our observation of FGFR3 along alveolar bone surfaces, high dose infigratinib may have effects on bone throughout life. Unlike enamel, dentin, and cementum, alveolar bone has a high turnover rate 75,76. In our rat model, we observed a high incidence of root resorption associated with mandibular molars, which appeared mitigated with low and high dose infigratinib. Using cathepsin K to identify osteoclasts, we also observed an insignificant trend of a reduction in the number of osteoclasts/odontoclasts along root surfaces of low and high dose rats, indicating that FGFRs may also have roles in osteoclast formation and recruitment in the dentoalveolar complex. Of the FGFs, FGF2, FGF8, and FGF11 have been implicated in osteoclast differentiation although their exact roles in the dentoalveolar complex remain largely unknown 77–79. FGFR3 has also been implicated in osteoclastogenesis 80. Using bone sialoprotein (BSP) and osteopontin (OPN), extracellular matrix proteins, as bone and cementum markers, we did not observe alterations in localization or intensity of BSP and OPN immunostaining with infigratinib, in part due to variable staining across samples, warranting additional investigation in future studies. BSP and OPN have known roles in bone homeostasis and the dentoalveolar complex 81–83. For example, in the absence of BSP, osteoclast differentiation is impaired, and murine models lacking OPN exhibit osteopetrosis 84,85. Additionally, BSP KO mice exhibit root resorption and FGF2 has been reported to increase BSP transcription 86,87. While speculative, infigratinib mediation of extracellular matrix proteins may be protective against root resorption by regulating osteoclastogenesis, further demonstrating the diversity of FGFR/FGF roles in mineralized tissue homeostasis.
Clinical implications of infigratinib on dental development
Changes in the FGF/FGFR signaling machinery are seen in a variety of human diseases - most often as a result of variants that lead to increased FGFR signaling 88. This includes inherited skeletal syndromes as well as benign and malignant neoplasms 89–97. Generally, gain-of-function FGFR3 variants manifest as two distinct phenotypes: chondrodysplasias (e.g. achondroplasia and hypochondroplasia) and syndromic craniosynostoses (e.g. Muenke syndrome and Crouzon syndrome with acanthosis nigricans). 10,15,49,57,89,90,94,98–103. Our findings of suture patency related to FGFR3 inhibition provide some evidence that treatment with infigratinib may also improve cranial vault development in the subset of patients with achondroplasia that develop craniosynostosis. The dental phenotype associated with achondroplasia is not well characterized, though limited case presentations report hypodontia, aberrant tooth shapes, malocclusion, and in one case, periodontal disease 19,45,46.
In WT rats, particularly in females, treatment with high dose infigratinib led to significant changes in molar development, including morphological changes in the crown and shorter, thinner roots. At PND7, when infigratinib administration began, the stage of the third molar in rats corresponds to tooth stages present in children aged 3-18 years old, dependent on the tooth type and position 70,104. In normal adolescents within this age range, dental complications that may arise due to compromised dentin/enamel, shorter roots, and altered crown morphology include periodontal disease, malocclusion, increased fragility of teeth, and increased susceptibility of caries. However, our toxicokinetic studies suggest that infigratinib related disturbances will occur primarily in ages where liver enzymes are not fully mature. Although immature tooth stages exist in children after age 3, the actual infigratinib exposure will be much lower relative to the dose administered as liver enzymes have sufficiently matured by this age. Thus, supratherapeutic doses of infigratinib would likely be required for increased susceptibility to dental complications in humans, and only before tooth development is complete. Following tooth development, our results suggest that infigratinib may be protective against root resorption. This may indicate FGFR roles in osteoclast activity or may be an independent, indirect effect of infigratinib treatment. Further investigation is needed to determine if infigratinib can be used to modulate bone modeling/remodeling into adulthood. We did not detect any alterations in dental tissues from low dose infigratinib, suggesting that a comparable dose can be used clinically without any detriment to dentoalveolar development. As our studies here did not use an animal model for achondroplasia, and as the dental phenotype in neither patients nor the mouse model for achondroplasia has been well studied, implications of these findings for patients with FGFR3-mediated achondroplasia warrant additional studies.
Studies using other pan-FGFR inhibitors have yielded more evidence that inhibition of FGFRs at early stages of tooth development can alter tooth morphology. For example, SU5402 (tivozanib) is another pan-FGFR inhibitor effective against VEGFR and has been used in animal studies examining tooth development 105,106. Although effects on later stages of tooth development were not reported, tivozanib was shown to result in shallower or narrower tooth buds. Comparatively, infigratinib is more specific toward FGFRs and has received FDA approval in treatment of cholangiocarcinomas featuring FGFR2 fusion proteins 39,107–109. Preclinical studies also suggest that infigratinib can also target FGFR1 and FGFR3 overexpression 33,110,111. The crystal structure of infigratinib-FGFR1 interactions has been resolved, also showing infigratinib specificity to FGFRs 32,112. Based on this model, infigratinib would have higher specificity to FGFRs1-3 and not FGFR4. Although we are unable to distinguish the individual effects of FGFR1, FGFR2, and FGFR3 on tooth development, there may be redundant and compensatory roles that would mitigate disturbances if one FGFR was ablated at a time. Evidence to support compensation among FGF members exists for FGF3 and FGF10, which interact primarily with FGFR1 and FGFR2 113. Single deletion of either FGF3 or FGF10 has minimal effects on tooth development, whereas concomitant loss of FGF3 and FGF10 results in smaller molars 114,115. In general, FGFs can bind to multiple FGFRs, although FGF/FGFR ligand/receptor pairs differ in their affinities and tissue spatiotemporal distribution. Functional redundancy in FGFs suggests that for therapeutics to be successful in modulating effects of FGF-mediated processes, multiple FGFs/FGFRs need to be targeted simultaneously. Additionally, we were unable to determine the effects on FGF signaling activity (e.g, factors such as phospho-MAPK), which will also require consideration in future studies. While dental and craniofacial changes are not expected and have not been detected at the doses used in clinical trials in children with achondroplasia, our findings confirm the importance of dental monitoring in clinical studies.
EXPERIMENTAL PROCEDURES
Toxicokinetic Studies
Infigratinib in the vehicle (acetic acid/acetate buffer solution [pH 4.6] and polyethylene glycol 300 [PEG300] at 50:50 [v/v]) was administered by oral gavage to 3 groups of 105 male and 105 female juvenile Crl:WI(Han) rats once daily from PND 7 through 35. The dose levels were 0.1, 0.3, and 1 mg/kg/day. The dose volume was 5 mL/kg for all groups. A control group, consisting of 15 animals/sex, received the vehicle on the same regimen. On PND7, 12, 17, 23, and 35, blood samples were collected from 3 animals/sex/treated group/time point prior to dose administration and at 0.5, 1, 3, 7, 12, and 24 hours postdose. Samples were also collected from the control group animals at 1 hour postdose on PND 7, 12, 17, 23, and 35. Blood samples were collected via cardiac puncture and/or inferior vena cava under anesthesia on PND 7, 12, and 17 into tubes containing K2EDTA. On PND23 and 35, blood samples (0.3 mL) were collected via inferior vena cava after euthanasia into tubes containing K2EDTA. Samples were mixed gently and placed on crushed wet ice until centrifuged for approximately 10 minutes at 3500 rpm in a centrifuge set to maintain 4°C. The resultant plasma was transferred to uniquely labeled clear polypropylene tubes and frozen immediately over dry ice or in a freezer set to maintain ≤ −60°C until shipped for analysis. Samples to be analyzed were shipped following completion of each collection interval to Worldwide Clinical Trials Early Phase Services/Bioanalytical Sciences, Inc (Austin, TX). Plasma concentrations of infigratinib were measured using a validated liquid chromatography with tandem mass spectrometry (LC-MS/MS) method. The results of these analyses were used for toxicokinetic (TK) evaluation. The lower limit of quantitation for infigratinib was 0.05 ng/mL.
Toxicokinetic parameters were estimated using Phoenix® PK software (Certara, USA, Inc.; Princeton, NJ) and nominal sampling times relative to each dose administration and nominal doses. Plasma concentration values obtained at the predose time point were used for the concentration at time zero on all sample days. Concentration values reported as not quantifiable (below quantitation limit; BQL) were assigned a value of zero. The area under the concentration versus time curve (AUC) was calculated using the linear trapezoidal method with linear interpolation. The AUC was not calculated for TK profiles with < 3 consecutive quantifiable concentrations of the analyte. When practical, the terminal elimination phase of each concentration versus time curve was identified using at least the final 3 observed concentration values not including Cmax. The slope of the terminal elimination phase was determined using log linear regression on the unweighted concentration data. Parameters relying on the determination of the terminal elimination phase were not reported if the coefficient of determination (r2) was < 0.800, or if the extrapolation of the AUC to infinity represented > 20% of the total area. Microsoft Excel 2013 was used for receipt of bioanalytical data and minor formatting for transfer into Phoenix® for TK analysis. All available plasma concentration data from all animals were included in the analysis. Descriptive statistics (numbers [N], means, standard deviation [SD], and percent coefficient of variation [%CV]) and ratios (RAUC, dose, metabolite, and sex) for appropriate grouping and sorting variables were generated.
Animals
Male and female Wistar rats were dosed daily by oral gavage with either vehicle (acetate buffer solution, pH 4.68, and polyethylene glycol 300 (PEG300) at 50:50 (v/v)) , 0.1mg/kg BGJ398 (low-dose), or 1.0mg/kg BGJ398 (high-dose) beginning on postnatal day 7(PND7). Rats were euthanized on PND14, or 37, and heads from each group (5 males, 5 females per group) were fixed in formalin. Low dose was determined based on proposed therapeutic efficacy in clinical trials.
MicroCT Scanning
For craniofacial morphology and linear measurements, skulls were scanned in Scanco uCT 50 scanner (Scanco Medical; Wayne, PA) with 24.0 μm voxel size, 70 kVP, 85 mA, and 900ms integration time. Scans were reconstructed, oriented, calibrated, and a threshold of 600 mg HA/cm3 was set for mineralized tissues. Landmarks were identified on these scans using previously reported methods 37, and linear distances between landmarks and interfrontal suture width were determined using a custom ImageJ macro. For segmentation of cranial vault bones, a Sobel filter with a kernel size of 7 was applied. Bones were segmented at 500 mg HA/cm3, and manual corrections to delineate individual bones were applied when needed. This cranial vault segmentation map was then loaded back onto the original calibrated image and used as a mask to highlight any bone under this mask with a density over 600 mg HA/cm3. Quantitative analysis was then performed on the original calibrated image. Average density was determined from these volumes.
MicroCT scanning of formalin-fixed hemi-mandibles was conducted using a Scanco μCT 50 scanner (Scanco Medical; Wayne, PA). Scanning parameters were set at 10.3 μm voxel size, 70 kVP, 85 mA, and 900ms integration time. Images were reconstructed using Scanco proprietary software (Scanco Medical; Wayne, PA). Reconstructed images were calibrated to 5 known densities of hydroxyapatite. Using guidelines for microCT analysis established previously, samples were 3D reconstructed and reoriented using AnalyzePro 1.0 (AnalyzeDirect; Overland Park, KS) with comparable coronal, sagittal, and transverse landmarks chosen for image comparison 116. In the sagittal view, the plane generated by the mesial and distal aspects of mandibular first molar cemento-enamel junction (CEJ) was oriented parallel to the transverse plane. In the transverse view, the plane generated by mid-root mesial and distal root canals of the first molar was oriented parallel to the sagittal plane. In the coronal view, the plane bisecting the pulp of the mesial root was oriented parallel to the sagittal plane. Region of interest (ROI) was determined using a reoriented mandible. ROI was defined by 824μm mesial to the first molar mesial height of contour and 824um distal to the second molar distal height of contour. This included all alveolar bone buccal and lingual to the molars, interdental bone between first, second, and third molars, as well as the alveolar rise mesial to the first molar.
Enamel, dentin, and bone thresholds were assigned according to anatomical landmarks for PND37 (Enamel: 1500 mg HA/cm3; Dentin/Bone: 650 mg HA/cm3) and PND14 (Enamel: 1250 mg HA/cm3; Dentin/Bone: 400 mg HA/cm3). Pulp, which was enclosed by dentin, was identified using a combination of semiautomatic and manual functions. Enamel and dentin thicknesses were determined using cortical thickness algorithms from 30 slices mid-crown that formed a hollow cylinder of enamel, dentin, and pulp. Root lengths were determined by measuring the distance between the apex of the root and furcation. See Figure 7 for visual representation of tissues analyzed by microCT.
Tissue Preparation/Histology
Tissues fixed in 10% neutral buffered formalin were rinsed with 70% ethanol and demineralized in acetic acid/formalin/sodium chloride solution. Tissues were processed according to standard histological procedures and embedded in paraffin. Five-micrometer sagittal sections of molars were prepared using a microtome and mounted as numbered serial sections on charged glass slides. Standard hematoxylin and eosin (H&E) staining was used for morphological examination. Imaging was performed using a NanoZoomer XR digital slide scanner (Hamamatsu Photonics) equipped with an Olympus plan-apochromat 20X/0.75NA lens. Micrographs were saved as .ndp files and subsequently exported as .tiff using the NDP.view 2 image viewing software (Hamamatsu Photonics).
Immunohistochemistry
Immunohistochemistry (IHC) was performed on deparaffinized histological sections using an avidin-biotinylated peroxidase (ABC) based kit (Vectastain Elite, Vector Labs, Burlingame, CA, USA) with a 3-amino-9-ethylcarbazole (AEC) substrate (Vector Labs) to produce a red-brown product. Primary antibodies included: LF-175 anti-mouse osteopontin (OPN; Dr. Larry Fisher, NIDCR, Bethesda, MD), polyclonal rabbit anti- mouse bone sialoprotein (BSP) IgG (Dr. Renny Franceschi, University of Michigan), rabbit anti-human FGFR3 (LS-C979523-400, Lifespan Biosciences, Seattle, WA, USA), polyclonal rabbit-anti-human FGF18 (bs-9762R, Bioss, Boston, MA, USA), and rabbit anti-Cathepsin K (ab19027, Abcam, Cambridge, MA, USA). Sections were counterstained with Harris hematoxylin (26041-06, Electron Microscopy Sciences, Hatfield, PA, USA); in the case of FGF18, sections were counterstained with methyl green (H-3402-500, Vector Labs). QuPath117 was used to measure the staining intensity of BSP and OPN, as well as CTSK and the area of resorption pits. Briefly, for BSP and OPN, the alveolar bone between the first and second molars of PND37 rats was traced and a DAB intensity threshold of 0.2 was applied to obtain the percent area with positive staining.
Statistics
Data (presented as mean + standard deviation) were analyzed using one-way ANOVA with post-hoc Tukey test for pairwise comparisons (Prism version 8.0; GraphPad Software, La Jolla, CA), where p<0.05 was considered statistically significant. Significance is designated with asterisks (*: p<0.05, **: p<0.01, ***: p<0.001, ****: p<0.0001).
ACKNOWLEDGEMENTS
The authors declare no potential conflicts of interest with respect to the research, authorship, and/or publication of this article. This work was funded by National Institute of Dental and Craniofacial Research (NIDCR)/National Institutes of Health (NIH) grant to E.Y.C. (R00DE031148) and QED Therapeutics to M.T.C. (CRADA#O20181031).
Footnotes
CRediT AUTHOR STATEMENT
Zachary D. Michel: Conceptualization, Methodology, Validation, Formal Analysis, Investigation, Writing-Original Draft, Visualization, Writing-Review & Editing Sarah F. Aitken: Conceptualization, Methodology, Validation, Formal Analysis, Investigation, Writing-Original Draft, Visualization, Writing-Review & Editing Omar D. Glover: Conceptualization, Methodology, Validation, Formal Analysis, Investigation, Visualization, Writing-Review & Editing Lucy O. Alejandro Methodology, Validation, Software, Formal analysis, Investigation, Writing-Review & Editing Davide Randazzo Methodology, Investigation, Resources, Software, Writing-Review & Editing Carl Dambkowski Conceptualization, Methodology, Resources, Data curation, Project administration, Formal analysis, Validation, Writing-Review & Editing, Funding acquisition David Martin Conceptualization, Methodology, Resources, Data curation, Project administration, Formal analysis, Validation, Writing-Review & Editing, Funding acquisition Michael T. Collins Conceptualization, Formal analysis, Investigation, Methodology, Validation, Resources, Supervision, Writing-Review & Editing, Funding acquisition Martha J. Somerman Conceptualization, Formal analysis, Investigation, Methodology, Validation, Resources, Supervision, Writing-Review & Editing, Funding acquisition Emily Y. Chu Conceptualization, Methodology, Validation, Formal Analysis, Investigation, Writing-Original Draft, Writing-Review & Editing, Visualization, Supervision, Funding acquisition
REFERENCES
- 1.Waller D k., Correa A, Vo TM, et al. The population-based prevalence of achondroplasia and thanatophoric dysplasia in selected regions of the US. Am J Med Genet A. 2008;146A(18):2385–2389. doi: 10.1002/ajmg.a.32485 [DOI] [PMC free article] [PubMed] [Google Scholar]
- 2.Legare JM. Achondroplasia. In: Adam MP, Ardinger HH, Pagon RA, et al. , eds. GeneReviews®. University of Washington, Seattle; 1993. Accessed March 1, 2022. http://www.ncbi.nlm.nih.gov/books/NBK1152/ [PubMed] [Google Scholar]
- 3.Kubota T, Adachi M, Kitaoka T, et al. Clinical Practice Guidelines for Achondroplasia. Clin Pediatr Endocrinol Case Rep Clin Investig Off J Jpn Soc Pediatr Endocrinol. 2020;29(1):25–42. doi: 10.1297/cpe.29.25 [DOI] [PMC free article] [PubMed] [Google Scholar]
- 4.Ireland PJ, Pacey V, Zankl A, Edwards P, Johnston LM, Savarirayan R. Optimal management of complications associated with achondroplasia. Appl Clin Genet. 2014;7:117–125. doi: 10.2147/TACG.S51485 [DOI] [PMC free article] [PubMed] [Google Scholar]
- 5.Rousseau F, Bonaventure J, Legeai-Mallet L, et al. Mutations in the gene encoding fibroblast growth factor receptor-3 in achondroplasia. Nature. 1994;371(6494):252–254. doi: 10.1038/371252a0 [DOI] [PubMed] [Google Scholar]
- 6.Rousseau F, Bonaventure J, Legeai-Mallet L, et al. Mutations of the fibroblast growth factor receptor-3 gene in achondroplasia. Horm Res. 1996;45(1-2):108–110. doi: 10.1159/000184768 [DOI] [PubMed] [Google Scholar]
- 7.Shiang R, Thompson LM, Zhu YZ, et al. Mutations in the transmembrane domain of FGFR3 cause the most common genetic form of dwarfism, achondroplasia. Cell. 1994;78(2):335–342. [DOI] [PubMed] [Google Scholar]
- 8.Delezoide AL, Benoist-Lasselin C, Legeai-Mallet L, et al. Spatio-temporal expression of FGFR 1, 2 and 3 genes during human embryo-fetal ossification. Mech Dev. 1998;77(1):19–30. doi: 10.1016/S0925-4773(98)00133-6 [DOI] [PubMed] [Google Scholar]
- 9.Naski MC, Colvin JS, Coffin JD, Ornitz DM. Repression of hedgehog signaling and BMP4 expression in growth plate cartilage by fibroblast growth factor receptor 3. Development. 1998;125(24):4977–4988. doi: 10.1242/dev.125.24.4977 [DOI] [PubMed] [Google Scholar]
- 10.Ornitz DM, Legeai-Mallet L. Achondroplasia: Development, pathogenesis, and therapy. Dev Dyn Off Publ Am Assoc Anat. 2017;246(4):291–309. doi: 10.1002/dvdy.24479 [DOI] [PMC free article] [PubMed] [Google Scholar]
- 11.Legare JM, Pauli RM, Hecht JT, et al. CLARITY: Co-occurrences in achondroplasia—craniosynostosis, seizures, and decreased risk of diabetes mellitus. Am J Med Genet A. 2021;185(4):1168–1174. doi: 10.1002/ajmg.a.62096 [DOI] [PubMed] [Google Scholar]
- 12.Bessenyei B, Nagy A, Balogh E, et al. Achondroplasia with multiple-suture craniosynostosis: A report of a new case of this rare association. Am J Med Genet A. 2013;161(10):2641–2644. doi: 10.1002/ajmg.a.36130 [DOI] [PubMed] [Google Scholar]
- 13.Accogli A, Pacetti M, Fiaschi P, et al. Association of achondroplasia with sagittal synostosis and scaphocephaly in two patients, an underestimated condition? Am J Med Genet A. 2015;167(3):646–652. doi: 10.1002/ajmg.a.36933 [DOI] [PubMed] [Google Scholar]
- 14.Fakhry A, Ratisoontorn C, Vedhachalam C, et al. Effects of FGF-2/-9 in calvarial bone cell cultures: differentiation stage-dependent mitogenic effect, inverse regulation of BMP-2 and noggin, and enhancement of osteogenic potential. Bone. 2005;36(2):254–266. doi: 10.1016/j.bone.2004.10.003 [DOI] [PubMed] [Google Scholar]
- 15.Di Rocco F, Biosse Duplan M, Heuzé Y, et al. FGFR3 mutation causes abnormal membranous ossification in achondroplasia. Hum Mol Genet. 2014;23(11):2914–2925. doi: 10.1093/hmg/ddu004 [DOI] [PubMed] [Google Scholar]
- 16.Richtsmeier JT, Flaherty K. Hand in glove: brain and skull in development and dysmorphogenesis. Acta Neuropathol (Berl). 2013;125(4):469–489. doi: 10.1007/s00401-013-1104-y [DOI] [PMC free article] [PubMed] [Google Scholar]
- 17.Parrot J Les malformations achondropalsiquws. Soc Anthr Paris. Published online 1878:3. [Google Scholar]
- 18.Celenk P, Arici S, Celenk C. Oral Findings in a Typical Case of Achondroplasia. J Int Med Res. 2003;31(3):236–238. doi: 10.1177/147323000303100311 [DOI] [PubMed] [Google Scholar]
- 19.Chawla K, Lamba AK, Faraz F, Tandon S. Achondroplasia and periodontal disease. J Indian Soc Periodontol. 2012;16(1):138–140. doi: 10.4103/0972-124X.94624 [DOI] [PMC free article] [PubMed] [Google Scholar]
- 20.Kale L, Khambete N, Sodhi S, Kumar R. Achondroplasia with oligodontia: Report of a rare case. J Oral Maxillofac Pathol JOMFP. 2013;17(3):451–454. doi: 10.4103/0973-029X.125219 [DOI] [PMC free article] [PubMed] [Google Scholar]
- 21.Raviraj J, Suman V, Suresh D, Kartik K. Achondroplasia with multiple supplemental supernumerary teeth and multiple talon cusps: A rare case report. Dent Res J 2017;14(3):219–222. [DOI] [PMC free article] [PubMed] [Google Scholar]
- 22.Chellaiah AT, McEwen DG, Werner S, Xu J, Ornitz DM. Fibroblast growth factor receptor (FGFR) 3. Alternative splicing in immunoglobulin-like domain III creates a receptor highly specific for acidic FGF/FGF-1. J Biol Chem. 1994;269(15):11620–11627. [PubMed] [Google Scholar]
- 23.Li CY, Prochazka J, Goodwin AF, Klein OD. Fibroblast growth factor signaling in mammalian tooth development. Odontology. 2014;102(1):1–13. doi: 10.1007/s10266-013-0142-1 [DOI] [PMC free article] [PubMed] [Google Scholar]
- 24.Du W, Du W, Yu H. The Role of Fibroblast Growth Factors in Tooth Development and Incisor Renewal. Stem Cells Int. 2018;2018:7549160. doi: 10.1155/2018/7549160 [DOI] [PMC free article] [PubMed] [Google Scholar]
- 25.Kettunen P, Karavanova I, Thesleff I. Responsiveness of developing dental tissues to fibroblast growth factors: expression of splicing alternatives of FGFR1, -2, -3, and of FGFR4; and stimulation of cell proliferation by FGF-2, -4, -8, and -9. Dev Genet. 1998;22(4):374–385. doi: [DOI] [PubMed] [Google Scholar]
- 26.Kettunen P, Thesleff I. Expression and function of FGFs-4, -8, and -9 suggest functional redundancy and repetitive use as epithelial signals during tooth morphogenesis. Dev Dyn. 1998;211(3):256–268. doi: [DOI] [PubMed] [Google Scholar]
- 27.Porntaveetus T, Otsuka-Tanaka Y, Basson MA, Moon AM, Sharpe PT, Ohazama A. Expression of fibroblast growth factors (Fgfs) in murine tooth development. J Anat. 2011;218(5):534–543. doi: 10.1111/j.1469-7580.2011.01352.x [DOI] [PMC free article] [PubMed] [Google Scholar]
- 28.Tsuboi T, Mizutani S, Nakano M, Hirukawa K, Togari A. Fgf-2 regulates enamel and dentine formation in mouse tooth germ. Calcif Tissue Int. 2003;73(5):496–501. doi: 10.1007/s00223-002-4070-2 [DOI] [PubMed] [Google Scholar]
- 29.Kurosaka H, Islam MN, Kuremoto K, et al. Core binding factor beta functions in the maintenance of stem cells and orchestrates continuous proliferation and differentiation in mouse incisors. Stem Cells. 2011;29(11):1792–1803. doi: 10.1002/stem.722 [DOI] [PubMed] [Google Scholar]
- 30.Haara O, Harjunmaa E, Lindfors PH, et al. Ectodysplasin regulates activator-inhibitor balance in murine tooth development through Fgf20 signaling. Development. 2012;139(17):3189–3199. doi: 10.1242/dev.079558 [DOI] [PMC free article] [PubMed] [Google Scholar]
- 31.Gudernova I, Vesela I, Balek L, et al. Multikinase activity of fibroblast growth factor receptor (FGFR) inhibitors SU5402, PD173074, AZD1480, AZD4547 and BGJ398 compromises the use of small chemicals targeting FGFR catalytic activity for therapy of short-stature syndromes. Hum Mol Genet. 2016;25(1):9–23. doi: 10.1093/hmg/ddv441 [DOI] [PubMed] [Google Scholar]
- 32.Guagnano V, Furet P, Spanka C, et al. Discovery of 3-(2,6-Dichloro-3,5-dimethoxy-phenyl)-1-{6-[4-(4-ethyl-piperazin-1-yl)-phenylamino]-pyrimidin-4-yl}-1-methyl-urea (NVP-BGJ398), A Potent and Selective Inhibitor of the Fibroblast Growth Factor Receptor Family of Receptor Tyrosine Kinase. J Med Chem. 2011;54(20):7066–7083. doi: 10.1021/jm2006222 [DOI] [PubMed] [Google Scholar]
- 33.Komla-Ebri D, Dambroise E, Kramer I, et al. Tyrosine kinase inhibitor NVP-BGJ398 functionally improves FGFR3-related dwarfism in mouse model. J Clin Invest. 2016;126(5):1871–1884. doi: 10.1172/JCI83926 [DOI] [PMC free article] [PubMed] [Google Scholar]
- 34.Hines RN. Ontogeny of human hepatic cytochromes P450. J Biochem Mol Toxicol. 2007;21(4):169–175. doi: 10.1002/jbt.20179 [DOI] [PubMed] [Google Scholar]
- 35.Tang LWT, Teng JW, Verma RK, et al. Infigratinib Is a Reversible Inhibitor and Mechanism-Based Inactivator of Cytochrome P450 3A4. Drug Metab Dispos. 2021;49(9):856–868. doi: 10.1124/dmd.121.000508 [DOI] [PubMed] [Google Scholar]
- 36.Davidson D, Blanc A, Filion D, et al. Fibroblast Growth Factor (FGF) 18 Signals through FGF Receptor 3 to Promote Chondrogenesis *. J Biol Chem. 2005;280(21):20509–20515. doi: 10.1074/jbc.M410148200 [DOI] [PubMed] [Google Scholar]
- 37.Xu H, Lenhart SA, Chu EY, et al. Dental and craniofacial defects in the Crtap−/− mouse model of osteogenesis imperfecta type VII. Dev Dyn Off Publ Am Assoc Anat. 2020;249(7):884–897. doi: 10.1002/dvdy.166 [DOI] [PMC free article] [PubMed] [Google Scholar]
- 38.Ornitz DM, Itoh N. The Fibroblast Growth Factor signaling pathway. WIREs Dev Biol. 2015;4(3):215–266. doi: 10.1002/wdev.176 [DOI] [PMC free article] [PubMed] [Google Scholar]
- 39.Javle M, Roychowdhury S, Kelley RK, et al. Infigratinib (BGJ398) in previously treated patients with advanced or metastatic cholangiocarcinoma with FGFR2 fusions or rearrangements: mature results from a multicentre, open-label, single-arm, phase 2 study. Lancet Gastroenterol Hepatol. 2021;6(10):803–815. doi: 10.1016/S2468-1253(21)00196-5 [DOI] [PubMed] [Google Scholar]
- 40.Lyou Y, Rosenberg JE, Hoffman-Censits J, et al. Infigratinib in Early-Line and Salvage Therapy for FGFR3-Altered Metastatic Urothelial Carcinoma. Clin Genitourin Cancer. 2022;20(1):35–42. doi: 10.1016/j.clgc.2021.10.004 [DOI] [PMC free article] [PubMed] [Google Scholar]
- 41.Lassman AB, Sepúlveda-Sánchez JM, Cloughesy T, et al. Infigratinib in Patients with Recurrent Gliomas and FGFR Alterations: A Multicenter Phase II Study. Clin Cancer Res Off J Am Assoc Cancer Res. Published online March 28, 2022:clincanres.2664.2021. doi: 10.1158/1078-0432.CCR-21-2664 [DOI] [PMC free article] [PubMed] [Google Scholar]
- 42.Hartley IR, Miller CB, Papadakis GZ, et al. Targeted FGFR Blockade for the Treatment of Tumor-Induced Osteomalacia. N Engl J Med. 2020;383(14):1387–1389. doi: 10.1056/NEJMc2020399 [DOI] [PMC free article] [PubMed] [Google Scholar]
- 43.Bellus GA, McIntosh I, Smith EA, et al. A recurrent mutation in the tyrosine kinase domain of fibroblast growth factor receptor 3 causes hypochondroplasia. Nat Genet. 1995;10(3):357–359. doi: 10.1038/ng0795-357 [DOI] [PubMed] [Google Scholar]
- 44.Savarirayan R, De Bergua JM, Arundel P, et al. Infigratinib in children with achondroplasia: the PROPEL and PROPEL 2 studies. Ther Adv Musculoskelet Dis. 2022;14:1759720X221084848. doi: 10.1177/1759720X221084848 [DOI] [PMC free article] [PubMed] [Google Scholar]
- 45.Tekin M, Hismi BO, Fitoz S, et al. Homozygous mutations in fibroblast growth factor 3 are associated with a new form of syndromic deafness characterized by inner ear agenesis, microtia, and microdontia. Am J Hum Genet. 2007;80(2):338–344. doi: 10.1086/510920 [DOI] [PMC free article] [PubMed] [Google Scholar]
- 46.Guven Y, Rosti RO, Tuna EB, Kayserili H, Aktoren O. Orodental findings of a family with lacrimo-auriculo-dento digital (LADD) syndrome. Oral Surg Oral Med Oral Pathol Oral Radiol Endod. 2008;106(6):e33–44. doi: 10.1016/j.tripleo.2008.07.019 [DOI] [PubMed] [Google Scholar]
- 47.Mori H, Matsumoto K, Kawai N, Izawa T, Horiuchi S, Tanaka E. Long-term follow-up of a patient with achondroplasia treated with an orthodontic approach. Am J Orthod Dentofac Orthop Off Publ Am Assoc Orthod Its Const Soc Am Board Orthod. 2017;151(4):793–803. doi: 10.1016/j.ajodo.2016.03.034 [DOI] [PubMed] [Google Scholar]
- 48.Swathi KV, Maragathavalli G. Achondroplasia: A form of disproportionate dwarfism - A case report. Indian J Dent Res Off Publ Indian Soc Dent Res. 2020;31(5):794–798. doi: 10.4103/ijdr.IJDR_303_19 [DOI] [PubMed] [Google Scholar]
- 49.Richette P, Bardin T, Stheneur C. Achondroplasia: from genotype to phenotype. Joint Bone Spine. 2008;75(2):125–130. doi: 10.1016/j.jbspin.2007.06.007 [DOI] [PubMed] [Google Scholar]
- 50.Xie Y, Luo F, Xu W, et al. FGFR3 deficient mice have accelerated fracture repair. Int J Biol Sci. 2017;13(8):1029–1037. doi: 10.7150/ijbs.19309 [DOI] [PMC free article] [PubMed] [Google Scholar]
- 51.Biosse Duplan M, Dambroise E, Estibals V, Veziers J, Guicheux J, Legeai-Mallet L. An Fgfr3-activating mutation in immature murine osteoblasts affects the appendicular and craniofacial skeleton. Dis Model Mech. 2021;14(4):dmm048272. doi: 10.1242/dmm.048272 [DOI] [PMC free article] [PubMed] [Google Scholar]
- 52.Ishii M, Sun J, Ting MC, Maxson RE. The Development of the Calvarial Bones and Sutures and the Pathophysiology of Craniosynostosis. Curr Top Dev Biol. 2015;115:131–156. doi: 10.1016/bs.ctdb.2015.07.004 [DOI] [PubMed] [Google Scholar]
- 53.Maga AM. Postnatal Development of the Craniofacial Skeleton in Male C57BL/6J Mice. J Am Assoc Lab Anim Sci JAALAS. 2016;55(2):131–136. [PMC free article] [PubMed] [Google Scholar]
- 54.Wei X, Thomas N, Hatch NE, Hu M, Liu F. Postnatal Craniofacial Skeletal Development of Female C57BL/6NCrl Mice. Front Physiol. 2017;8:697. doi: 10.3389/fphys.2017.00697 [DOI] [PMC free article] [PubMed] [Google Scholar]
- 55.Greenwald JA, Mehrara BJ, Spector JA, et al. In vivo modulation of FGF biological activity alters cranial suture fate. Am J Pathol. 2001;158(2):441–452. doi: 10.1016/s0002-9440(10)63987-9 [DOI] [PMC free article] [PubMed] [Google Scholar]
- 56.Eswarakumar VP, Lax I, Schlessinger J. Cellular signaling by fibroblast growth factor receptors. Cytokine Growth Factor Rev. 2005;16(2):139–149. doi: 10.1016/j.cytogfr.2005.01.001 [DOI] [PubMed] [Google Scholar]
- 57.Perlyn CA, Morriss-Kay G, Darvann T, Tenenbaum M, Ornitz DM. A model for the pharmacological treatment of crouzon syndrome. Neurosurgery. 2006;59(1):210–215; discussion 210–215. doi: 10.1227/01.NEU.0000224323.53866.1E [DOI] [PMC free article] [PubMed] [Google Scholar]
- 58.Rachwalski M, Khonsari RH, Paternoster G. Current Approaches in the Development of Molecular and Pharmacological Therapies in Craniosynostosis Utilizing Animal Models. Mol Syndromol. 2019;10(1-2):115–123. doi: 10.1159/000493535 [DOI] [PMC free article] [PubMed] [Google Scholar]
- 59.Sun X, Zhang R, Chen H, et al. Fgfr3 mutation disrupts chondrogenesis and bone ossification in zebrafish model mimicking CATSHL syndrome partially via enhanced Wnt/β-catenin signaling. Theranostics. 2020;10(16):7111–7130. doi: 10.7150/thno.45286 [DOI] [PMC free article] [PubMed] [Google Scholar]
- 60.Grova M, Lo DD, Montoro D, et al. Animal Models of Cranial Suture Biology. J Craniofac Surg. 2012;23(7 0 1):1954–1958. doi: 10.1097/SCS.0b013e318258ba53 [DOI] [PMC free article] [PubMed] [Google Scholar]
- 61.White HE, Goswami A, Tucker AS. The Intertwined Evolution and Development of Sutures and Cranial Morphology. Front Cell Dev Biol. 2021;9. Accessed May 11, 2022. 10.3389/fcell.2021.653579 [DOI] [PMC free article] [PubMed]
- 62.Kimonis V, Gold JA, Hoffman TL, Panchal J, Boyadjiev SA. Genetics of craniosynostosis. Semin Pediatr Neurol. 2007;14(3):150–161. doi: 10.1016/j.spen.2007.08.008 [DOI] [PubMed] [Google Scholar]
- 63.Park J, Park OJ, Yoon WJ, et al. Functional characterization of a novel FGFR2 mutation, E731K, in craniosynostosis. J Cell Biochem. 2012;113(2):457–464. doi: 10.1002/jcb.23368 [DOI] [PubMed] [Google Scholar]
- 64.Heuzé Y, Martínez-Abadías N, Stella JM, et al. Quantification of facial skeletal shape variation in fibroblast growth factor receptor-related craniosynostosis syndromes. Birt Defects Res A Clin Mol Teratol. 2014;100(4):250–259. doi: 10.1002/bdra.23228 [DOI] [PMC free article] [PubMed] [Google Scholar]
- 65.Kutkowska-Kaźmierczak A, Gos M, Obersztyn E. Craniosynostosis as a clinical and diagnostic problem: molecular pathology and genetic counseling. J Appl Genet. 2018;59(2):133–147. doi: 10.1007/s13353-017-0423-4 [DOI] [PubMed] [Google Scholar]
- 66.Sawh-Martinez R, Steinbacher DM. Syndromic Craniosynostosis. Clin Plast Surg. 2019;46(2):141–155. doi: 10.1016/j.cps.2018.11.009 [DOI] [PubMed] [Google Scholar]
- 67.Albino FP, Wood BC, Oluigbo CO, Lee AC, Oh AK, Rogers GF. Achondroplasia and multiple-suture craniosynostosis. J Craniofac Surg. 2015;26(1):222–225. doi: 10.1097/SCS.0000000000001267 [DOI] [PubMed] [Google Scholar]
- 68.Zhang X, Ibrahimi OA, Olsen SK, Umemori H, Mohammadi M, Ornitz DM. Receptor specificity of the fibroblast growth factor family. The complete mammalian FGF family. J Biol Chem. 2006;281(23):15694–15700. doi: 10.1074/jbc.M601252200 [DOI] [PMC free article] [PubMed] [Google Scholar]
- 69.Kano T, Morita T, Sumida K, Yumoto H, Baba O. Expression of fibroblast growth factor receptor1, -2c, and -3c transcripts in mouse molars after tooth eruption. Anat Sci Int. 2021;96(2):301–309. doi: 10.1007/s12565-020-00594-4 [DOI] [PubMed] [Google Scholar]
- 70.Schwartz GT, Dean MC. Sexual dimorphism in modern human permanent teeth. Am J Phys Anthropol. 2005;128(2):312–317. doi: 10.1002/ajpa.20211 [DOI] [PubMed] [Google Scholar]
- 71.Honnebier MB, Cabiling DS, Hetlinger M, McDonald-McGinn DM, Zackai EH, Bartlett SP. The natural history of patients treated for FGFR3-associated (Muenke-type) craniosynostosis. Plast Reconstr Surg. 2008;121(3):919–931. doi: 10.1097/01.prs.0000299936.95276.24 [DOI] [PubMed] [Google Scholar]
- 72.Alamoudi MO, Abdel-Rahman EH, Hassan SSM. Ontogenetic and sexual patterns in the cranial system of the brown rat (Rattus norvegicus Berkenhout, 1769) from Hai’l region, Kingdom of Saudi Arabia. Saudi J Biol Sci. 2021;28(4):2466–2475. doi: 10.1016/j.sjbs.2021.01.048 [DOI] [PMC free article] [PubMed] [Google Scholar]
- 73.Chu EY, Fong H, Blethen FA, et al. Ablation of systemic phosphate-regulating gene fibroblast growth factor 23 (Fgf23) compromises the dentoalveolar complex. Anat Rec Hoboken NJ 2007. 2010;293(7):1214–1226. doi: 10.1002/ar.21152 [DOI] [PMC free article] [PubMed] [Google Scholar]
- 74.Blau JE, Collins MT. The PTH-Vitamin D-FGF23 axis. Rev Endocr Metab Disord. 2015;16(2):165–174. doi: 10.1007/s11154-015-9318-z [DOI] [PubMed] [Google Scholar]
- 75.Huja SS, Fernandez SA, Hill KJ, Li Y. Remodeling dynamics in the alveolar process in skeletally mature dogs. Anat Rec A Discov Mol Cell Evol Biol. 2006;288(12):1243–1249. doi: 10.1002/ar.a.20396 [DOI] [PMC free article] [PubMed] [Google Scholar]
- 76.Foster BL. Methods for studying tooth root cementum by light microscopy. Int J Oral Sci. 2012;4(3):119–128. doi: 10.1038/ijos.2012.57 [DOI] [PMC free article] [PubMed] [Google Scholar]
- 77.Hurley MM, Lee SK, Raisz LG, Bernecker P, Lorenzo J. Basic Fibroblast Growth Factor Induces Osteoclast Formation in Murine Bone Marrow Cultures. Bone. 1998;22(4):309–316. doi: 10.1016/S8756-3282(97)00292-5 [DOI] [PubMed] [Google Scholar]
- 78.Lin JM, Callon KE, Lin JS, et al. Actions of fibroblast growth factor-8 in bone cells in vitro. Am J Physiol Endocrinol Metab. 2009;297(1):E142–150. doi: 10.1152/ajpendo.90743.2008 [DOI] [PubMed] [Google Scholar]
- 79.Knowles HJ. Hypoxia-Induced Fibroblast Growth Factor 11 Stimulates Osteoclast-Mediated Resorption of Bone. Calcif Tissue Int. 2017;100(4):382–391. doi: 10.1007/s00223-016-0228-1 [DOI] [PMC free article] [PubMed] [Google Scholar]
- 80.Su N, Sun Q, Li C, et al. Gain-of-function mutation in FGFR3 in mice leads to decreased bone mass by affecting both osteoblastogenesis and osteoclastogenesis. Hum Mol Genet. 2010;19(7):1199–1210. doi: 10.1093/hmg/ddp590 [DOI] [PMC free article] [PubMed] [Google Scholar]
- 81.Foster BL, Soenjaya Y, Nociti FH, et al. Deficiency in acellular cementum and periodontal attachment in bsp null mice. J Dent Res. 2013;92(2):166–172. doi: 10.1177/0022034512469026 [DOI] [PMC free article] [PubMed] [Google Scholar]
- 82.Ao M, Chavez MB, Chu EY, et al. Overlapping functions of bone sialoprotein and pyrophosphate regulators in directing cementogenesis. Bone. 2017;105:134–147. doi: 10.1016/j.bone.2017.08.027 [DOI] [PMC free article] [PubMed] [Google Scholar]
- 83.Foster BL, Ao M, Salmon CR, et al. Osteopontin regulates dentin and alveolar bone development and mineralization. Bone. 2018;107:196–207. doi: 10.1016/j.bone.2017.12.004 [DOI] [PMC free article] [PubMed] [Google Scholar]
- 84.Ishijima M, Rittling SR, Yamashita T, et al. Enhancement of Osteoclastic Bone Resorption and Suppression of Osteoblastic Bone Formation in Response to Reduced Mechanical Stress Do Not Occur in the Absence of Osteopontin. J Exp Med. 2001;193(3):399–404. doi: 10.1084/jem.193.3.399 [DOI] [PMC free article] [PubMed] [Google Scholar]
- 85.Bouleftour W, Boudiffa M, Wade-Gueye NM, et al. Skeletal development of mice lacking bone sialoprotein (BSP)--impairment of long bone growth and progressive establishment of high trabecular bone mass. PloS One. 2014;9(5):e95144. doi: 10.1371/journal.pone.0095144 [DOI] [PMC free article] [PubMed] [Google Scholar]
- 86.Shimizu-Sasaki E, Yamazaki M, Furuyama S, Sugiya H, Sodek J, Ogata Y. Identification of FGF2-response element in the rat bone sialoprotein gene promoter. Connect Tissue Res. 2003;44 Suppl 1:103–108. [PubMed] [Google Scholar]
- 87.Soenjaya Y, Foster BL, Nociti FH, et al. Mechanical Forces Exacerbate Periodontal Defects in Bsp-null Mice. J Dent Res. 2015;94(9):1276–1285. doi: 10.1177/0022034515592581 [DOI] [PMC free article] [PubMed] [Google Scholar]
- 88.Xie Y, Su N, Yang J, et al. FGF/FGFR signaling in health and disease. Signal Transduct Target Ther. 2020;5(1):1–38. doi: 10.1038/s41392-020-00222-7 [DOI] [PMC free article] [PubMed] [Google Scholar]
- 89.Muenke M, Schell U, Hehr A, et al. A common mutation in the fibroblast growth factor receptor 1 gene in Pfeiffer syndrome. Nat Genet. 1994;8(3):269–274. doi: 10.1038/ng1194-269 [DOI] [PubMed] [Google Scholar]
- 90.Wilkes D, Rutland P, Pulleyn LJ, et al. A recurrent mutation, ala391glu, in the transmembrane region of FGFR3 causes Crouzon syndrome and acanthosis nigricans. J Med Genet. 1996;33(9):744–748. doi: 10.1136/jmg.33.9.744 [DOI] [PMC free article] [PubMed] [Google Scholar]
- 91.Wilkie AOM. Bad bones, absent smell, selfish testes: the pleiotropic consequences of human FGF receptor mutations. Cytokine Growth Factor Rev. 2005;16(2):187–203. doi: 10.1016/j.cytogfr.2005.03.001 [DOI] [PubMed] [Google Scholar]
- 92.Cunningham ML, Seto ML, Ratisoontorn C, Heike CL, Hing AV. Syndromic craniosynostosis: from history to hydrogen bonds. Orthod Craniofac Res. 2007;10(2):67–81. doi: 10.1111/j.1601-6343.2007.00389.x [DOI] [PubMed] [Google Scholar]
- 93.Agochukwu NB, Solomon BD, Gropman AL, Muenke M. Epilepsy in Muenke syndrome: FGFR3-related craniosynostosis. Pediatr Neurol. 2012;47(5):355–361. doi: 10.1016/j.pediatrneurol.2012.07.004 [DOI] [PMC free article] [PubMed] [Google Scholar]
- 94.He X, Xie F, Ren Z rui. Rapid Detection of G1138A and G1138C Mutations of the FGFR3 Gene in Patients with Achondroplasia Using High-Resolution Melting Analysis. Genet Test Mol Biomark. 2012;16(4):297–301. doi: 10.1089/gtmb.2011.0113 [DOI] [PubMed] [Google Scholar]
- 95.Krejci P The paradox of FGFR3 signaling in skeletal dysplasia: why chondrocytes growth arrest while other cells over proliferate. Mutat Res Rev Mutat Res. 2014;759:40–48. doi: 10.1016/j.mrrev.2013.11.001 [DOI] [PubMed] [Google Scholar]
- 96.Sobhani N, Ianza A, D’Angelo A, et al. Current Status of Fibroblast Growth Factor Receptor-Targeted Therapies in Breast Cancer. Cells. 2018;7(7):E76. doi: 10.3390/cells7070076 [DOI] [PMC free article] [PubMed] [Google Scholar]
- 97.Katoh M Fibroblast growth factor receptors as treatment targets in clinical oncology. Nat Rev Clin Oncol. 2019;16(2):105–122. doi: 10.1038/s41571-018-0115-y [DOI] [PubMed] [Google Scholar]
- 98.Wiwanitkit V FGFR mutation in Pfeiffer syndrome. J Craniofac Surg. 2013;24(4):1503. doi: 10.1097/SCS.0b013e3182902d37 [DOI] [PubMed] [Google Scholar]
- 99.Chen P, Zhang L, Weng T, et al. A Ser252Trp mutation in fibroblast growth factor receptor 2 (FGFR2) mimicking human Apert syndrome reveals an essential role for FGF signaling in the regulation of endochondral bone formation. PloS One. 2014;9(1):e87311. doi: 10.1371/journal.pone.0087311 [DOI] [PMC free article] [PubMed] [Google Scholar]
- 100.Li ZL, Chen X, Zhuang WJ, et al. FGFR2 mutation in a Chinese family with unusual Crouzon syndrome. Int J Ophthalmol. 2016;9(10):1403–1408. doi: 10.18240/ijo.2016.10.06 [DOI] [PMC free article] [PubMed] [Google Scholar]
- 101.Sargar KM, Singh AK, Kao SC. Imaging of Skeletal Disorders Caused by Fibroblast Growth Factor Receptor Gene Mutations. Radiogr Rev Publ Radiol Soc N Am Inc. 2017;37(6):1813–1830. doi: 10.1148/rg.2017170017 [DOI] [PubMed] [Google Scholar]
- 102.Rai R, Iwanaga J, Dupont G, et al. Pfeiffer type 2 syndrome: review with updates on its genetics and molecular biology. Childs Nerv Syst ChNS Off J Int Soc Pediatr Neurosurg. 2019;35(9):1451–1455. doi: 10.1007/s00381-019-04244-7 [DOI] [PubMed] [Google Scholar]
- 103.Al-Namnam NM, Jayash SN, Hariri F, Rahman ZAA, Alshawsh MA. Insights and future directions of potential genetic therapy for Apert syndrome: A systematic review. Gene Ther. 2021;28(10-11):620–633. doi: 10.1038/s41434-021-00238-w [DOI] [PubMed] [Google Scholar]
- 104.Kuremoto K, Okawa R, Matayoshi S, Kokomoto K, Nakano K. Estimation of dental age based on the developmental stages of permanent teeth in Japanese children and adolescents. Sci Rep. 2022;12(1):3345. doi: 10.1038/s41598-022-07304-2 [DOI] [PMC free article] [PubMed] [Google Scholar]
- 105.Mandler M, Neubüser A. FGF signaling is necessary for the specification of the odontogenic mesenchyme. Dev Biol. 2001;240(2):548–559. doi: 10.1006/dbio.2001.0490 [DOI] [PubMed] [Google Scholar]
- 106.Jackman WR, Draper BW, Stock DW. Fgf signaling is required for zebrafish tooth development. Dev Biol. 2004;274(1):139–157. doi: 10.1016/j.ydbio.2004.07.003 [DOI] [PubMed] [Google Scholar]
- 107.Javle M, Lowery M, Shroff RT, et al. Phase II Study of BGJ398 in Patients With FGFR-Altered Advanced Cholangiocarcinoma. J Clin Oncol. 2018;36(3):276–282. doi: 10.1200/JCO.2017.75.5009 [DOI] [PMC free article] [PubMed] [Google Scholar]
- 108.Chakrabarti S, Finnes HD, Mahipal A. Fibroblast growth factor receptor (FGFR) inhibitors in cholangiocarcinoma: current status, insight on resistance mechanisms and toxicity management. Expert Opin Drug Metab Toxicol. 2022;18(1):85–98. doi: 10.1080/17425255.2022.2039118 [DOI] [PubMed] [Google Scholar]
- 109.Roskoski R Properties of FDA-approved small molecule protein kinase inhibitors: A 2022 update. Pharmacol Res. 2022;175:106037. doi: 10.1016/j.phrs.2021.106037 [DOI] [PubMed] [Google Scholar]
- 110.Fumarola C, Cretella D, La Monica S, et al. Enhancement of the anti-tumor activity of FGFR1 inhibition in squamous cell lung cancer by targeting downstream signaling involved in glucose metabolism. Oncotarget. 2017;8(54):91841–91859. doi: 10.18632/oncotarget.19279 [DOI] [PMC free article] [PubMed] [Google Scholar]
- 111.Nakamura IT, Kohsaka S, Ikegami M, et al. Comprehensive functional evaluation of variants of fibroblast growth factor receptor genes in cancer. Npj Precis Oncol. 2021;5(1):1–14. doi: 10.1038/s41698-021-00204-0 [DOI] [PMC free article] [PubMed] [Google Scholar]
- 112.Zheng J, Zhang W, Li L, et al. Signaling Pathway and Small-Molecule Drug Discovery of FGFR: A Comprehensive Review. Front Chem. 2022;10. Accessed May 19, 2022. 10.3389/fchem.2022.860985 [DOI] [PMC free article] [PubMed]
- 113.Kettunen P, Laurikkala J, Itäranta P, Vainio S, Itoh N, Thesleff I. Associations of FGF-3 and FGF-10 with signaling networks regulating tooth morphogenesis. Dev Dyn Off Publ Am Assoc Anat. 2000;219(3):322–332. doi: [DOI] [PubMed] [Google Scholar]
- 114.Harada H, Toyono T, Toyoshima K, et al. FGF10 maintains stem cell compartment in developing mouse incisors. Dev Camb Engl. 2002;129(6):1533–1541. doi: 10.1242/dev.129.6.1533 [DOI] [PubMed] [Google Scholar]
- 115.Wang XP, Suomalainen M, Felszeghy S, et al. An integrated gene regulatory network controls stem cell proliferation in teeth. PLoS Biol. 2007;5(6):e159. doi: 10.1371/journal.pbio.0050159 [DOI] [PMC free article] [PubMed] [Google Scholar]
- 116.Chavez MB, Chu EY, Kram V, de Castro LF, Somerman MJ, Foster BL. Guidelines for Micro-Computed Tomography Analysis of Rodent Dentoalveolar Tissues. JBMR Plus. 2021;5(3):e10474. doi: 10.1002/jbm4.10474 [DOI] [PMC free article] [PubMed] [Google Scholar]
- 117.Bankhead P, Loughrey MB, Fernández JA, et al. QuPath: Open source software for digital pathology image analysis. Sci Rep. 2017;7(1):16878. doi: 10.1038/s41598-017-17204-5 [DOI] [PMC free article] [PubMed] [Google Scholar]