

Summary
Massively parallel reporter assay measures transcriptional activities of various cis-regulatory modules (CRMs) in a single experiment. We developed a thermodynamic computational model framework that calculates quantitative levels of gene expression directly from regulatory DNA sequences. Using the framework, we investigated the molecular mechanisms of cis-regulatory mutations of a synthetic enhancer that cause abnormal gene expression. We found that, in a human cell line, competitive binding between family transcription factors (TFs) with slightly different binding preferences significantly increases the accuracy of recapitulating the transcriptional effects of thousands of single- or multi-mutations. We also discovered that even if various harmful mutations occurred in an activator binding site, CRM could stably maintain or even increase gene expression through a certain form of competitive binding between family TFs. These findings enhance understanding the effect of SNPs and indels on CRMs and would help building robust custom-designed CRMs for biologics production and gene therapy.
Subject areas: Molecular mechanism of gene regulation, Experimental models in systems biology, Artificial intelligence
Graphical abstract
Highlights
-
•
We created an MPRA-based thermodynamic model framework analyzing the effect of mutations
-
•
Analysis of MPRA data for a synthetic CRE enhancer led to the following results
-
•
Competition among family TFs is essential for predicting changes in enhancer activity
-
•
A certain form of competitive binding between family TFs increases mutational robustness
Molecular mechanism of gene regulation; Experimental models in systems biology; Artificial intelligence
Introduction
Transcription factors (TFs) bound on cis-regulatory modules (CRMs), such as promoters and enhancers, regulate transcription. Genetic variations on CRMs can interrupt TF binding and therefore alter gene expression levels. The growing body of evidence indicates a strong association between non-coding variants and many genetic diseases,1 such that genetic modifications on CRMs can increase the risk of certain diseases. Thus, systematic analysis of the molecular-level effect of DNA alteration on gene expression is essential to better understand the development of various genetic diseases. While traditional reporter assays, measuring gene expression levels driven by a CRM individually, are time- and labor-intensive, massively parallel reporter assays (MPRAs) measure transcriptional activities of large amounts of CRMs in a single experiment.2,3,4,5,6,7,8,9,10,11,12,13,14,15,16,17,18,19 In an MPRA, thousands or tens of thousands of reporter constructs tagged with unique barcode sequences are transfected together into cells, and the transcribed barcode tags and/or reporter protein expression are rapidly quantified by next-generation sequencing and/or fluorescence-activated cell sorting (FACS). With this advantage, a variety of MPRA-based studies have been conducted using various model systems, such as in vitro HeLa extract,20 E. coli,21 yeast,5 and mammalian cells.2,3,4
In order to predict and ultimately better understand various CRM activities, large amounts of gene expression data obtained from MPRAs were used to train several classifiers, regression models22,23,24 and deep learning algorithms such as convolutional neural network or bidirectional long short term memory.25,26,27,28 While these models show high performance in predicting mRNA expression levels, most of them have not been able to explain the variant-mediated molecular mechanisms that possibly cause changes in gene expression. There were some models capable of doing this, the ability to decompose and analyze underlying molecular mechanisms was relatively limited.16,28,29,30 Here, we present a thermodynamic model framework that predicts the levels of MPRA gene expression data directly from various regulatory DNA sequences, infers the contribution of each nucleotide to the predicted gene expression and identifies abnormal molecular interactions that may arise from single nucleotide polymorphisms (SNPs) and insertion-deletion mutations (indels). As a proof of concept, we tested our thermodynamic model framework using carefully measured, biologically replicated MPRA data of an 87 bp long synthetic enhancer and tens of thousands of variants of it.3 Based on the model analysis results, we propose a theory of robustness of regulatory DNAs against SNPs, which includes binding competition of TFs within the same families.
Results
We developed a thermodynamic model framework that calculates the levels of MPRA gene expression data directly from various regulatory DNA sequences, such as enhancers and promoters (Figure 1). If the CRM sequences are fed into the model framework that equips with binding preferences and relative concentrations of TFs, it returns the quantitative levels of gene expression as an output (Figure 1: Training). The thermodynamic model at the core of the framework incorporates seven well-documented transcriptional molecular mechanisms of eukaryotes — TF binding to DNA, cooperative binding,31,32,33,34 competitive binding,35,36 co-activation,31,37,38,39 short-range quenching,40,41 direct-repression42,43 and transcription synergy.44,45 In the model framework, depending on the purpose of the study, each TF or molecular mechanism (i.e., cooperative binding) can be easily removed or added to analyze its contribution to the change in gene expression (Figure 1: Analysis). In addition, parameters in the model have a direct biological meaning, enabling the detailed interpretation of molecular mechanisms that regulate gene expression.
Figure 1.

Computational model framework of this study
A flow diagram for the thermodynamic computational model of a synthetic CRE enhancer and its variants. Our model calculates gene expression rates considering fractional occupancies of TFBSs and 8∼32 parameters. Concentrations of the transcription factor and PWMs were used to calculate fractional occupancy on the WT and variant enhancers. During the training process (top panels), the model parameters are fitted to minimize sum squared error between MPRA single-hit experimental data and model estimates. We validated model reliability using three different methods (middle panel). First, 5-fold cross validation was conducted. Following, 4/5 single-hit sequences were used for training, and 1/5 sequences were used to test prediction power. Second, we validated models trained with single-hit data to predict and compare against MPRA multi-hit sequences, which were not used in the training process. Third, we validated whether our models could explain simple biological phenomena, such as reverse and rearrangement of enhancer sequences. During the analysis process (bottom panels), we found most reliable models by altering some mechanisms in the model and analyzing molecular mechanisms of synthetic enhancers. We analyzed the change in fractional occupancy and arrangement of TFBSs, and compared the contribution of each TF in WT and variant enhancer sequences to gene expression.
The MPRA dataset that we used in this study is an output of transfected reporter constructs that are a synthetic cAMP responsive elements (CREs)-containing enhancer and its sequence variants.3 The enhancer, which is called the CRE enhancer here, contains four spatially separated binding sites for a human TF called CRE-binding protein (CREB): two full-length CRE (5′-TGACGTCA-3′) and two half-length CRE sequences (5′-CGTCA-3′). We call these four binding sites CRE1, 2, 3 and 4, starting from the leftmost one. The two binding sites CRE2 and CRE3, located in the middle of the enhancer, are the shorter ones and the inter-distances between the four sites are not identical. Upon mutations at each position of the enhancer (87 bp x 3 = 261 single-hits in total) or selected 27643 multi-hit substitutions, the gene expression levels measured in a human embryonic kidney cell line (HEK293) varied up to 16-fold, serving as a highly informative training and validation dataset for our model simulation (Figure 1: Training and Validation).
Baseline model of the CRE enhancer
We first started off from a simple model that calculates the levels of gene expression driven by the CRE enhancer and its 261 single-hit variants with only one type of TF — CREB1. CREB1 is one of the best known CRE binding proteins that can be activated by phosphorylation, for example, through forskolin treatment and is highly expressed in various tissues and cell lines such as cerebral cortex, lung, liver, HeLa, HEK293.46 Gene expression changes between the CRE enhancer and its single-hit variants (referred as Δactivities) are shown Figure 2B. This simple CREB1-only model (ignoring other possible TFs) served as a baseline model in our experiment. We used this baseline model to compare with more complicated models that are described later.
Figure 2.

A CRE enhancer and its mutational activities
(A) Synthetic cAMP response enhancer sequences. Red box indicates CRE sites and blue box represents the cryptic region.
(B and C) X-axis shows enhancer position in which variants were presented. Substitution bases are presented on the top left for each panel. Y-axis shows Δactivity. (B) MPRA experimental result (C) Fitting result of 7 ATF/CREB family model. Fitting results of baseline model (B.M) are represented on the left bottom of each panel.
(D) Motif logos for PWMs used in 7TF models.
For accurate modeling, it is the first step to know which TF is bound to which position and to what extent. Therefore, we first tested the quality of four CREB1 PWMs (position weight matrices) available from three different sources with the baseline model (see STAR Methods).47,48 The four PWMs computationally found all CRE binding sites (CRE1, 2, 3, and 4 in Figure 2A) of the enhancer. However, the modeling result indicated that a high-throughput quantitative data-based PWM48 shows the highest accuracy in calculating Δactivities in CREB1 sites (Figure S1), while some PWMs produced Δactivities that were not relevant at all. This indicates that the quality of PWMs can significantly affect the accuracy of our computational model. For all subsequent modeling, only high-throughput PBM (protein binding microarray) or SELEX data-based PWMs were used, which showed overall high performance. Although the baseline model successfully calculated some Δactivities in three CREB1 sites on the right side of the enhancer — CRE2, 3 and 4, (see the inner panels at the bottom left of each panel in Figure 2C) they failed to recapitulate Δactivities in CRE1 and overall Δactivities elsewhere due to challenges described below (Figure 2C).
First, Δactivities in the extra few base pairs of some CREB binding sites (i.e., CRE4) were observed (red arrows in Figure 2B). This shows the possibility that (1) CREB proteins required wider sequences than CRE for proper binding or (2) additional TF(s) that have similar binding preference shared their binding sites with CRE. Second, CRE1 and CRE4 in the CRE enhancer possessed identical sequences (5′-TGACGTCA-3′); however, Δactivities in the CRE sequences were significantly different, meaning that unlike CRE4, CRE1 was insensitive to almost all single-hit mutations (green arrows in Figure 2B). It indicates two possibilities. Either (1) the CRE-bound TF is distance dependent from transcription start site (TSS)49 so that CRE1-bound TF contributes significantly less to gene expression than CRE4-bound TF or (2) the different CRE-neighboring sequences make the difference (Figure 2A). Third, noticeable Δactivities were observed in an unexpected region (asterisks in Figure 2B) on the left side of CRE4, indicating unknown TF might bind and regulate gene expression. We referred to the region as the cryptic region here as Melnikov et al. did.3
Inference of CREB1-mediated regulatory mechanisms
To address the challenge described above, we considered additional molecular mechanisms that are expected to play an important role in regulating gene expression of the synthetic enhancer. Inclusion of “weak” binding sites for CREB1 and self-competition between CREB1 over overlapping sites was our first choice. Previous reports indicate that competitive binding of overlapping TFBSs is an essential mechanism for accurately calculating TF occupancy.35,36 We found multiple weak CREB1 binding sites partially overlapped with CRE1, 3, and 4, suggesting that these partially overlapped weak binding sites might play a role in the experimentally observed Δactivities near the CREs. We allowed competitive binding of the same kind of TF (CREB1 in this case) as well as other kinds of TF if their binding sites overlap (Figure S2C). Applying self-competition mechanism to the baseline model (CREB1 self-competition model) increased the overall accuracy of the model from rmax = 0.58, RMSEbest = 0.35, ravg = 0.33 to rmax = 0.64, RMSEbest = 0.33, ravg = 0.63.
We then tested another known molecular mechanism, distance-dependent CREB1 activity (mentioned in the second challenge), with the baseline model. Previous literature reported that CREB, a distance-dependent activator, maintains its activity up to 200 bp from the transcription start site (TSS) of the TH gene, and the activity is lost thereafter.49 In our model, the distance-dependent manner of CREB1 activity was assumed to be mediated through CREB1-TFIID interaction (coactivation). It is known that CREB1 interacts with TFIID through TAFs proteins.50,51,52 We set the coactivation strength of CREB1 in the model to gradually decrease to 200 bp, based on the reported information.49 If the distance between CREB1 and TFIID (we used a PWM of TBP (subunit of TFIID) for TFIID positioning) was larger than 200 bp, the coactivation coefficient was set to zero so that such CREB1 could not contribute to the initiation of transcription. However, addition of the distance-dependent CREB1 activity had no significant impact on improving model calculations compared to the simpler CREB1 self-competition model (rmax increased to 0.68 from 0.58 (RMSE: 0.35 to 0.32), ravg: 0.33 to 0.63; Figure S2D). In addition, modeling was also performed with other distance ranges between 10 bp and 200 bp, but no significantly improved results were observed (Figure S3). These results indicate that distance-dependent action of CREB1 may have only a limited role in this CRE enhancer.
We further tested the distance-dependent CREB1 mechanism by adding it to the CREB1 self-competition model to see if synergistic effects existed between the two possible mechanisms (Figure S2E). Even though the model showed slightly improvement in calculating some Δactivities in the CRE2, 3, and 4 and cryptic region (rmax = 0.70 (RMSE = 0.31), ravg = 0.69), this model still failed to accurately recapitulate the insensitive Δactivities upon mutations in CRE1, the peripheral sequences of CRE4, and the cryptic region. This result indicates that, instead of the distance-dependent CREB1 mechanism, additional, unknown TF(s) might have a role in regulating gene expression of the CRE enhancer and its variants.
Inclusion of TFs based on pattern of changes in binding affinity
We sought the unknown TFs for the CRE enhancer according to the following criteria. First, the TFs must be expressed in the HEK293 cell line, in which levels of gene expression of the CRE enhancer and its variants were measured. Second, the predicted pattern of “binding affinity changes upon mutations” (Δbinding affinities) would be similar (for activators) or opposite (for repressors) to the pattern of Δactivities in the CREs or the cryptic region. As a first candidate, CREB3 was assessed. It was co-expressed with CREB1 in HEK293, and its Δbinding affinities highly matched to the pattern of Δactivities near CRE4. When we added CREB3 as another activator to the CREB1 self-competition model, the accuracy of the “CREB3-included model” calculation dramatically increased (rmax = 0.78, RMSEbest = 0.24, ravg = 0.76, RMSEavg = 0.27) (Figure S2G). This result indicates that co-binding of CREB3, a family member of CREB1, near CRE4 might play a role in regulating in vivo gene expression in the CRE enhancer and its variants. We then examined other TFs to determine whether they could also improve the model calculation. We added TFs predicted to have binding sites near the four CREs to the CREB1 self-competition model individually (we refer to them as 2TFs models) and evaluated the results. However, adding the predicted TFs did not significantly improve accuracy of the model (Figure 3A). We also assessed the role of co-binding of another TF(s) on the cryptic region. We added CITED2, EOMES, JDP2, TBX2 and ZNF410 individually to the CREB3-included model. However, they also did not noticeably increase the accuracy of the model (Figure S4). This result indicates that addition of other TFs to our model does not guarantee improvement of the model calculation, indicating that our model does not artificially compensate for missing mechanisms.
Figure 3.

Inclusion of family and non-family TFs
(A) Correlation between experimental data and estimation from models with the mentioned TFs added. Dashed line distinguishes CREB1 self-competition model (CREB1_self model) from 2TFs models including non-ATF/CREB family TFs (non-family TFs) or ATF/CREB family TFs. Red line shows the best CREB1_self model’s Pearson’s R. 10 models were trained for each group. The boxes show the first and third quartiles, and the horizontal line inside each box marks the median. The vertical lines extending above and below the boxes cover a range of 1.5 times the interquartile range (IQR). Black dots outside the box represent outliers.
(B–E) Correlation coefficient according to the number of ATF/CREB family TFs (CREB1, CREB3, CREB5, CREM, ATF1, ATF4, ATF7). Models are grouped by the number of ATF/CREB family TFs (n), with each group having 7Cn combinations of TFs (i.e., 1TF models: 7C1 = 7, 2TFs models: 7C2 = 21, 3TFs models: 7C3 = 35). 8 models were trained for each TF combination. Black dots on the plot represent the mean for each group, and any outliers are highlighted with colored dots. (B,C) without self-competition mechanism models (B: without self-competition single-hit fitting and C: without self-competition multi-hit prediction) and (D,E) with self-competition mechanism models (D: with self-competition single-hit fitting and E: with self-competition multi-hit prediction).
CREB family TFs improves accuracy of model calculation
As encouraged by the CREB3-included model, we tested other ATF/CREB family TFs, although their pattern of Δbinding affinities are not significantly correlated with the pattern of Δactivities in the CREs or cryptic region. It is well known that many ATF/CREB family TFs bind to CRE sequences as either homodimer or heterodimer complexes.53,54 When co-expressing ATF/CREB family members in HEK293 were individually added —CREB5, CREM, ATF1, ATF4, and ATF7, to the CREB1 self-competition model, all except ATF1 significantly improved the accuracy of the model calculation (Figure 3A). By contrast, none of the non-ATF/CREB3 related TFs improved the model accuracy. This result indicates that the co-expressing family TFs might play an important role in regulating gene expression of the CRE enhancer and its variants, in which similar phenomena have been previously reported.55,56
We then examined the possibility of competitive interaction between family TFs in the CRE enhancer and its variants. When all five TFs were added to the "CREB3-included model'' and allowed to bind competitively, it significantly improved the overall accuracy of the model calculation and successfully recapitulated many of the Δactivities in all four CREs (rmax = 0.88 (p < 2.2e-16), RMSEbest = 0.20, ravg = 0.84, RMSEavg = 0.23) (Figure 2C). This model is referred to as the "7 CREB family model''. Surprisingly, this model was also able to restore Δactivities in the cryptic region (Figure 2).
To determine which TF(s) contributed most to the improved model performance, the minimum sets of TFs sufficient to recapitulate most Δactivities observed in the MPRA experiment of the CRE enhancer, and the molecular mechanisms most likely to explain the Δactivities of the CRE enhancer (four challenges), we trained the thermodynamic model for single TF (7 cases) and combinations (2–7 combinations) cases. In total, 2032 trained models were generated (127 cases; for each case, 16 models with different seed parameters were trained; Figures 3B–3E).
Validation of CREB family-included thermodynamic models
We first validated which thermodynamic models successfully reproduced the changes in gene expression (caused by single substitution mutations) used in the training set. We then verified the models’ ability to predict changes in gene expression that were not used in the training set (changes caused by unused single substitutions or multi-substitutions). We found that as the number of TF increased, overall performance of fitting or predicting gene expression changes increased (Figures 3B–3E). Further, increasing the number of family TFs to four greatly improved model performance; however, in five or more TF models, performance converged to a certain threshold (rthreshold≈0.8) and has not increased any further.
We found that 4 TF model with CREB1, CREM, ATF1, and ATF7 was the one of the minimal TF models to reproduce major Δactivities in the four CREs and cryptic region (rmax = 0.869, p < 2.2e-16, RMSE = 0.216, ravg = 0.842). The models also showed strong predictive capability for gene expression changes caused by mutations that were not used in the training set. In the 5-fold cross-validation tests, rmax = 0.886 (RMSEbest = 0.229) and rmed = 0.832 and ravg = 0.806 were measured for the 4 TF model (Figure 4L). For the untrained multi-hit substitution data, which were measured in Melnikov et al.,3 the 4 TF model shows good predictive performance (rmax = 0.795, RMSEbest = 0.722 and rmed = 0.742 and ravg = 0.732) (Figure 4M). Because this 4 TF model is the simplest model to best illustrate the four CRE enhancer activities among all models, we restricted our full-scale model analysis to the 4 TF model. However, for comparison with the 4 TF model, we also analyzed other TF models.
Figure 4.

A comparison between our model and QSAM model using a hypothetical experiment involving the billboard enhancer’s feature
(A–C) Sequence scheme. (A) Case 1: reversed sequence. (B) Case 2: rearranged sequence. (C) Case 3 reversed and rearranged sequence.
(D–I) Comparison between normal synthetic enhancer activity (X axis) and each model prediction expression rates (Y axis). Model estimates about intent sequences are represented on the left top of each panel. (D–F) Thermodynamic model. Expression rates of (D) Case 1, (E) Case 2, and (F) Case 3 calculated with the best 4 TF model. (G-I) QSAM model. (G) Case 1, (H) Case 2, and (I) Case 3 sequences calculated with linear QSAM.
(J) Multi-hit prediction with the 4 TF model.
(K) Multi-hit prediction with linear QSAM.
(L and M) 5-fold cross validation result of best 5 models for each number of TFs. X axis represents the number of TFs, and the Y axis shows the mean of Pearson’s correlation of (L) training set, and (M) validation set. Data are represented as mean +/− standard error.
We further validated the reliability of this thermodynamic model using the following hypothetical experiment: predicting the activities of the enhancer when all or part of the enhancer was reversed or rearranged. To date, two types of enhancers are well-documented — billboard-type or enhanceosome-type.57 A common feature of billboard enhancers is the independent action of its elements. Unlike enhanceosome-type enhancers, the entire region of a billboard enhancer need not function as a cooperative unit, but rather as an ensemble of separate elements that can independently affect gene expression.57,58 Because the CRE enhancer and its sequence variants are considered to be billboard enhancers,3 they should show similar gene expression patterns even when reversed or rearranged. We conducted this hypothetical experiment with the 4 TF model. We assumed that the pattern of Δactivities in the CRE enhancer does not change when the entire enhancer sequence is reversed (Case 1), divided in half and its position is switched (Case 2), or the two previous cases are combined (Case 3) (Figures 4A–4C). We fed the three modified DNA sequences and their sequence variants to one of the best 4 TF models that was trained only with unmodified CRE enhancer and its variants. We compared the Δactivities predicted by the model to the ones measured from the intact CRE enhancer and its variants (Figure 4). The thermodynamic model reproduced similar Δactivities when the CRE enhancer was reversed or relocated (rcase1 = 0.817, RMSEcase1 = 0.272, rcase2 = 0.868, RMSEcase2 = 0.216 and rcase3 = 0.823, RMSEcase3 = 0.268). This result shows that this thermodynamic model has high extensibility that accurately predicts the effects of small and large-scale mutations in the CRE enhancer and its variants.
We then repeated the hypothetical experiment with a different computational model trained with the same MPRA data as a control — the quantitative sequence-activity model (QSAM).3,21,59 The QSAM uses mutual dependence between each position of DNA and enhancer activities to predict activities of novel sequence variants. From complex gene expression data, QSAM can be used to quickly determine the impact of each variant. This capability makes QSAM ideal for applying enhancer engineering. The trained linear QSAM reproduced Δactivities of the CRE enhancer and its variable with notably high accuracy (r ≈ 1, p < 2.2e-16). However, because mutual dependence was inferred from the nucleotide positions, not from the TF binding to DNA or TF-TF or TF-Transcription machinery interactions, QSAM could not predict gene expression properly when the relative position of TFBS in the pre-learned enhancer was altered. The output of the QSAM model with the altered enhancers exhibited almost 0% correlation with Δactivities measured in the intact CRE enhancer and its sequence variants (Figures 4G–4I). Despite its successful application to model transcriptional activities of enhancer variants, this result shows that the QSAM approach may not be feasible as a general method for predicting gene expression changes caused by potentially more severe mutations such as indels, inversions, and translocations.
Proposed regulatory mechanisms of the CRE enhancer
We conducted a full-scale analysis of the 4 TF models that have been validated in the previous section. We analyzed each of the best trained 4 TF models to grasp which molecular mechanisms could account for significant changes in gene expression induced by all possible substitution mutations. In particular, the differential Δactivities between CRE1 and CRE4 and the positive Δactivities (gene expression increased upon substitutions) in the cryptic region were the key focus of this study (Figures 5, S5, and S6). Interestingly, when point mutations occurred in two identical TFBS sequences (CRE1 and CRE4), CRE4 was very sensitive to the mutations while CRE1 was highly resistant to the same mutations (see Figures 2B, 5A, and 5G). We have shown in the previous in silico analysis that the functional differences between CRE1 and CRE4 do not depend on distance from TSS. If this is true in vivo, the functional difference between the two identical sites must be influenced by the surrounding sequences (underlined): … GACAGTGACGTCAGCTGC … and … CCCATTGACGTCAATGGG …, respectively. The thermodynamic computational model revealed that different forms of competitive interaction between family TFs that bind fully or partially overlapping sites with CRE1 and CRE4 can cause the different Δactivities.
Figure 5.

Functional binding site analysis of A/T substitutions
(A and G) Δactivity after A (A) or T (G) substitution. MPRA experimental result (top) and model calculation (bottom).
(B and H) TFBSs in WT sequence. Each box represents TFBS, and transparency indicates fractional occupancy of the TFBS. The bottom red box represents the CRE sequences and the blue box represents the cryptic region.
(C, D, I, and J) TFBSs in CRE1 region (C, I) and CRE4 region (D, J) after variant introduction. The wild type base and position, as well as the substituted base, are shown in the upper right corner of each figure. For example, T11A indicates that the T at the 11th position was substituted with an A. The bottom yellow box shows the position where variants were introduced.
(E) Activation coefficient of TFs.
(F and K) Cumulative bar plot representing ΔΔA of CRE1/CRE4 binding TFs after variant introduction. ΔΔA can be interpreted as a contribution to initiate transcription. Contributions from the same TFBSs are connected by two lines.
In the intact CRE enhancer (without mutations), CREB1 competed with ATF7 and CREM at the CRE1 site, while CREB1 competed with ATF1 and CREM at the CRE4 site (Figure 5B). In the best trained models, all four TFs were activators, although the activation efficiency of transcription varied from TF to TF (Figure 5E): ATF1 and ATF7 were predicted to be weaker activators than CREM and CREB1. When substitution mutations occurred at CRE1 and CRE4 (also at CRE2 and CRE3), binding affinities of the CREB1 sites and other overlapping sites (CREM, ATF7 and ATF1) generally decreased, meaning that the degrees of TF binding to the sites (referred to as fractional occupancies) also generally decreased. This is why Δactivities at all CRE regions, except CRE1, are generally negative (meaning that gene expression is decreased when the mutations occurred). Especially, two substitution mutations in CRE4, C72A and G73T, in which C is substituted with A at 72 nt position from TSS or G is substituted with T at 73 nt position, lead to the significant reduction in gene expression (about 4-fold). The explanation based on the trained computer models is as follows. When the mutations occurred in CRE4, binding sites of two strong activators CREM and CREB1 were all weakened (the two overlapping CREM sites disappeared and the two overlapping CREB1 sites remained, but became weaker) (Figures 5D and 5J). Interestingly, the absence of CREM (and also the weakened CREB1 sites) increased the fractional occupancy of its competitor ATF1 (compare Figure 5B with 5D and 5H with 5J), however, the ATF1 with the increased occupancy was not sufficient to replace the role of the strong activators CREM and CREB1 in CRE4 (Figure 5F). It is because, in the trained models, ATF1 is a relatively weaker activator than CREM and CREB1 (Figure 5E). In other words, ATF1 makes less contribution to initiate transcription than CREM or CREB1 when bound to DNA with the same fractional occupancy. To our knowledge, no experiments have been published comparing the activities of these activators, however, multiple sequence alignments show that activation domains of ATF1, ATF7, and CREB1 diverge from that of CREM in descending order (Figure S7), suggesting the different activation efficiencies.
However, in CRE1, the same type of substitution mutations (C14A and G15T) produced completely different results. For example, C14A had almost no effect on gene expression, while the same type of mutation C72A in CRE4 caused 4-fold reduction in gene expression (Figure 5A). Like C72A, C14A removed CREM binding sites and weakened the binding affinities of CREB1 sites in CRE1. However, C14A also removed a site for ATF7 that fully overlaps with CRE1 (Figures 5C and 5D), while its counterpart C72A could not remove the ATF1 site because the ATF1 site only partially overlapped with CRE4 and the C72A mutation was located outside of the ATF1 site. Note that ATF7 was one of the most strongly binding TF on the intact CRE1. Since ATF7 is a relatively weak activator, similar to ATF1, the absence of ATF7 in CRE1 itself has little impact on gene expression. However, the co-absence of ATF7 with CREM increased the fractional occupancy of its competitor CREB1 (Figure 5F) in CRE1, despite the reduced affinity of the binding site. Even though the strong activator CREM was lost and the binding affinities of CREB1 sites are weakened in both CRE4 and CRE1, the increased fractional occupancy of a CREB1 site in CRE1 was able to maintain gene expression similar to that of the intact CRE enhancer (although slightly reduced). In contrast, fractional occupancy of a CREB1 site in CRE4 was not increased upon the same type of mutation because, unlike ATF7, partially overlapped ATF1 was still bound.
More dramatic effect of the increased fractional occupancy of CREB1 (by the absence of ATF7) was observed upon other mutations, T11A and A18T, in CRE1. These mutations also removed binding sites for CREM and ATF7 in CRE1. Yet, the gene expression levels driven by the mutated CRE enhancer were almost unchanged, while its equivalent T69A and A76T caused approximately 2-fold reduction in gene expression. The C14A mutation, mentioned earlier, weakened two overlapping CREB1 sites, but C11A and A18T weakened only one of the CREB1 sites in CRE1 (because the other site was slightly off the mutation position). In the absence of the competitor ATF7 and CREM (with the weakened overlapping CREB1 site), the fractional occupancy of the unaffected CREB1 site was significantly increased (6 and 2 times, respectively), replacing all previous roles of the intact CREM and CREB1 sites before the mutations (Figure 5). This result suggests that under specific conditions, the summed contribution of multiple overlapping sites to transcription initiation can be stably maintained even if the majority of the overlapping sites are seriously damaged by substitution mutations (if one or a few sites remain).
In the cryptic region (… CCCC …, 63–66 nt positions from TSS), gene expression levels were noticeably increased when substitution mutations occurred (Figure S6). It is because the mutations altered key nucleotides of an ATF1 site across the cryptic region and CRE1. For example, with one exception C65T, all 11 substitution mutations removed or weakened the ATF1 site. The absence of ATF1 binding increased the fractional occupancy of its competitors (strong activators) CREB1 and CREM in CRE4, and the increased fractional occupancies increased the levels of gene expression. Interestingly, in C65A mutations, a novel binding site for CREB1 was created. The presence of an extra CREB1 binding site can further increase gene expression. For the exceptional C65T mutation in the cryptic region, Δactivities were near zero because the ATF1 binding site was not damaged after the mutations (the mutations were slightly off the key consensus binding sequence of ATF1).
Discussion
In this study, we developed an MPRA-based thermodynamic model framework that serves as a powerful tool for analyzing the effects of various cis-regulatory mutations on gene expression (Figure 1). Theoretically, this computational model can analyze the effects of mutations of all types and sizes that can occur within a single gene, but here, we conducted an in-depth analysis of single base pair mutations that is most frequently found in the human genome. Using this model framework, we successfully reproduced the transcriptional outputs of single-hit mutations that occurred in the synthetic CRE enhancer (Figure 2), and also predicted various multi-hits-driven abnormal gene expression (untrained data) with a high level of accuracy (Figure 4). The predictive power of this model may be further improved if this model framework considers the three-dimensional DNA shape around TF binding sites, which is known to influence the binding affinity of TFs.60
In addition, the computational model was able to analyze the possible changes in the interaction between TF-TF and TF-Transcription machinery and their results, triggered by various substitutions (Figure 5). Through the in-silico analysis, the model suggested experimentally testable hypotheses that which mutations have a significant or negligible effect on gene expression, and if so, by what molecular mechanisms. These results showed that this model framework can provide a theoretical basis for elucidating the detailed molecular mechanisms of key mutations that cause abnormal gene expression and ultimately various monogenic diseases.
The analytical power of this mechanistic model is a great advantage. Currently, many sequence-based computational models predicting gene expression use statistical regression, ensemble methods, or deep-learning algorithms.25,26,27 These models have the advantage of being simple in structure and showing high predictive power, but they do not explain what molecular interactions are likely to cause the changes of gene expression. The thermodynamic mechanistic model presented here is a good complement to the shortcomings of those correlative, prediction-oriented models. Further, this model framework would be useful to find novel therapies because it provides molecular interpretation of how cis-regulatory mutations are linked to specific genetic diseases in terms of their interactions with TFs and other regulatory proteins (i.e., kinases). The unexpected result of steroid treatment for Hemophilia B Leyden patients is an example. It is now known that the androgen receptor binds to the F9 promoter and acts as an activator,61,62 but in the past, it was not known why steroid administration raises coagulation factor IX (FIX; F9) to levels sufficient to prevent most bleeding in some hemophilia B patients.63 Regulatory TFs, their roles, and interactions with other proteins predicted by this MPRA-driven thermodynamic model can be potential targets for new therapeutic agents.
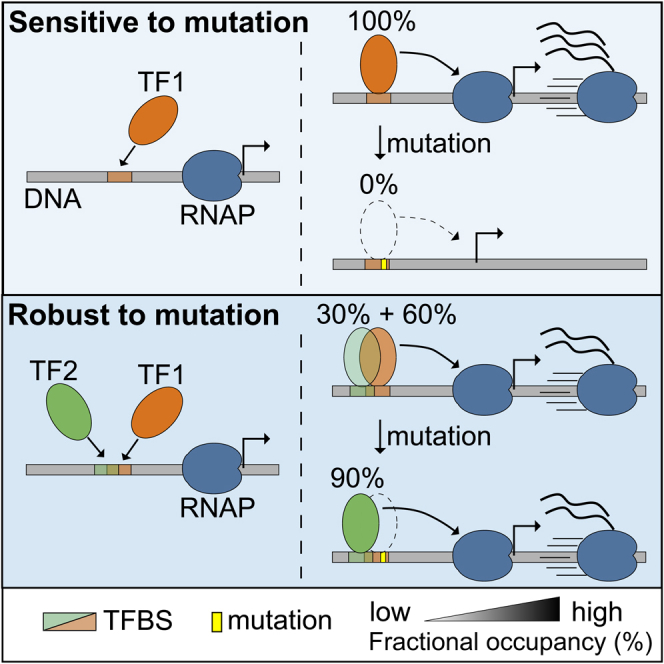
One of the most remarkable features of biological systems is the persistence of a certain function or trait against various perturbations.64 Such robustness is well seen in gene expression patterns that remain constant despite the occurrence of various mutations. This phenomenon is called mutational robustness and many studies have been conducted to elucidate the cause of the mutational robustness.65,66,67,68 For example, mechanisms such as robustness of individual TFBSs, homotypic clusters of sites, redundant TFs, cooperative TF-TF interactions, redundant enhancers, and wiring of transcriptional regulatory circuits have been proposed as the cause of such robustness.69 Here, in addition to these mechanisms, we suggest another mutational robustness of transcriptional ‘activation’ — binding competition between ‘activators’.
In this synthetic CRE enhancer, two regions (CRE1 and 4) with exactly the same DNA sequence, exhibit completely different mutational robustness (Δactivities) when the same substitution and insertion mutations occur in the two regions (Figures 2 and S8). In the original analysis of this synthetic enhancer, this difference in Δactivities was thought to be due to the distance between the TFBSs and the TATA box near TSS.3 Davis et al. also reported that the degree of gene expression induced by CREs gradually decreases in the form of a damped oscillation with a period of about 10 bp and a length of about 190 bp in the presence of high concentration of forskilin.70 However, in this study, we showed by computer simulations that functional differences between CRE1 and CRE4 cannot be fully explained by the distance-dependent activity of CREs alone (Figure S3). Rather, the thermodynamic model demonstrated that all major Δactivities in the four CREs and the cryptic region can be reproduced with high accuracy through competitive binding of just four family TFs – CREB1, CREM, ATF1, and ATF7 without any distance dependent mechanism. The reason that mutations on CRE1 have little effect on gene expression is not because the activity of CRE1 was almost absent due to the effect of distance. According to the computer simulation, CRE1 is functionally active but resistant to mutations due to the specific arrangement of the site with other nearby TF binding sites. And this proposal was also confirmed by experimental results (see the supplement Figures 4 and 5 in Melnikov et al.3). The experiments introducing 5 or 10 base insertion or 8 base translocation/transversion to CRE1 site show significantly decreased activity, demonstrating CRE1 is functionally active. These results gave us a new perspective on the different Δactivities in CRE1 and CRE4: The two identical sites show significantly different robustness to the same mutations, and their origin comes from differences in DNA sequences around the two sites, which create different forms of the overlapping family TFBSs.
This type of mutational robustness can be explained in great detail by comparing the most sensitive mutation C72A occurring in CRE4 and the equivalent mutation C14A, occurring at the same position in CRE1 (Figure 5A). As we analyzed earlier, in the intact CRE enhancer, CREB1 competed with ATF7 and CREM at the CRE1 site while CREB1 competed with ATF1 and CREM at the CRE4 site (Figure 5B). When the mutations occurred, they damaged the binding sites of two or three TFs out of the four. If ATF7 and ATF1 are called C1, C4 (C stands for “competitor”) respectively, we can say that upon the mutations the C1 binding site that overlaps with the CRE1 site disappeared while the C4 binding site that overlaps with CRE4 remained (it is slightly out of mutation). The explanation of CREM is omitted here to highlight the difference between CRE1 and CRE2 (see the results section for details). Note that the C14A mutation not only damaged the competitor (C1)'s site but also the site of CREB1. But the binding site of the C1 was more sensitive to the C14A mutation and could no longer compete with CREB1 in the mutated CRE1 (Figure 5C). If the CREB1 site alone was in the CRE1 region, the mutation in CRE1 would noticeably reduce the fractional occupancy of CREB1. However, because the competitor C1 disappeared, some of the fractional occupancy of CREB1 that had been suppressed (or lost) by C1 was recovered. As a result, the total fractional occupancy of CREB1 and its contribution to initiate transcription (ΔΔA) remains almost the same (see the yellow part of the C14A bar graph in Figure 5F). In addition, since C1 is a relatively weaker activator than CREB1 (Figure 5E) in the model, the absence of C1 in CRE1 itself has little impact on gene expression (the purple part of the bar graph of the WT CRE1 in Figure 5F). In this specific situation, the competitor C1 acts like a “capacitor” that stores some of the binding energy for CREB1 (instead of electrical energy) because if C1 disappears due to C14A, CREB1 regains the fractional occupancy lost to C1, which has the same effect as increasing the binding energy between CREB1 and the mutated CRE1.
On the other hand, CRE4 does not show resistance to the same mutation (C72A). CRE4 overlaps a C2 site instead of the C1 site due to the different surrounding sequences. Unlike the C14A mutation in CRE1, C72A in CRE4 does not damage the binding site of the competitor C2 (the sites of CREB1 were weakened though). In other words, two redundant TFs - CREB1 and C2 are still bound to the mutated CRE4. The consequences are more severe (4 times less expression). In the computational model, the C1 site covers CRE1 entirely, while the C2 site overlaps only the edges of CRE4. When C72A mutation occurred, the C2 site survived intact (it occurs outside the C2 site site) and the partially overlapping C2 site drastically reduced the mutational robustness against the mutation. This is because C2, which has little influence on gene expression, has won the competition with the more influential CREB1 in the mutated CRE4, resulting in the decreased gene expression. This mechanism is different from the TF redundancy mechanism mentioned elsewhere.67,68,69 That is, if one gene has a problem (for example, a mutation in the coding sequence), redundant genes with the same or similar functions act as a substitute for the broken gene. However, what we found in this study is that this mutational robustness arises from the specific combination of overlapping sites of multiple activator TFs, not from redundant coding sequences.
Well-designed deep learning and statistical models will have high competitiveness in the field of predicting abnormal gene expression due to mutations as quantitative experimental data such as MPRA data are accumulated. However, mechanistic models are also necessary because, unlike deep learning and statistical models, a molecular level explanation of the effects of mutations on gene expression is possible. This model goes beyond simulating the function of individual promoters and enhancers, and can model the entire gene, including a promoter and several enhancers. This opens the possibility of detailed molecular analysis of the aberrant transcriptional regulation of disease-associated genes at single nucleotide resolution. In addition, the robustness generation principle based on the competitive binding of family TFs can be used in medical and pharmaceutical fields, such as improving the mutational robustness of protein expression vectors.
Limitations of the study
This transcriptional model framework is designed to comprehensively analyze the effect of every single-hit and various multiple-hit mutations in the regulatory DNA on gene expression. Thus, this model framework may not be applicable to MPRA datasets that do not contain the results of fully saturated single-hit mutagenesis. In addition, the selection of functional TFs relies on available PWMs and RNA-seq dataset. Therefore, the computational analysis of enhancers regulated by TFs for which these data do not exist is inevitably limited.
STAR★Methods
Key resources table
| REAGENT or RESOURCE | SOURCE | IDENTIFIER |
|---|---|---|
| Software and algorithms | ||
| Transcpp | Barr and Reinitz45 | github.com/kennethabarr |
| Clustal Omega | Sievers et al., 2011 | https://www.ebi.ac.uk/Tools/msa/clustalo/ |
Resource availability
Lead contact
Further information and requests for resources and reagents should be directed to and will be fulfilled by the lead contact, Ah-Ram Kim (arkim@handong.edu)
Materials availability
This study did not generate new unique reagents.
Data and code availability
Code:
This paper does not report original code, but the code of the thermodynamic model used for this work is available at github.com/kennethabarr.
Data:
PWMs used for ATF/CREB family TFs are in Table S2.
All the sequences and corresponding expression levels are in Table S3.
Protein sequences of pKID domains or GCN4_cent domains for multiple sequence alignment can be obtained from NCBI RefSeq (81) by following accession number: CREB1 (NP_004370.1), CREM (NP_877572.1), ATF1 (NP_005162.1), and ATF7 (NP_006847.1).
Method details
Molecular interaction thermodynamic model
The thermodynamic model described in this study is based on a published model, primarily used to study Drosophila melanogaster even-skipped gene expression patterns.44,45,71 Briefly, this model uses mathematical equations to describe the rate-limiting step of transcription — the transcription initiation process. Its inputs are CRM sequences, expression levels of the CRMs, concentrations of regulatory TFs, and their position weight matrices (PWMs). Using these inputs, the model derives the TF binding strength, binding positions, and TF-TF interaction to ultimately calculate mRNA expression levels. The following types of TF-TF interactions were implemented in this thermodynamic model: Competitive binding between TFs,35,36 enhancer competition,72,73,74,75 coactivation,31,37,38,39 short-range quenching,40,41 direct repression,42,43 and cooperative binding.31,32,33,34 However, in this study, we limited the molecular mechanisms of this model to coactivation between TFs and GTFs(general transcription factors such as TFIID) and competitive binding between TFs.
The model calculates the binding sites and binding affinities of TFs on given CRM sequences using PWMs. The PWM scores are calculated for each window of 1bp shift, and then converted to free energy to be compatible with PWMs from various source experiments and algorithms. The PWM score S of TF a to the binding site i (binding to the mth to nth bp) is given as,
| (Equation 1) |
where Pa is the TF binding frequency of base j (A, C, G, or T) at the kth position of binding site i. Pbg is the frequency of base j found in the host cell’s genome. Weak binding sites below a threshold are discarded. The remaining binding sites' score S are converted to free energy K, using the maximum possible score of PWM (Smax) and the proportionality constant to free energy λ.
| (Equation 2) |
Before calculating the binding probability of TF a on a given CRM context, the model divides TFBSs into multiple subgroups based on their competitive binding and cooperative binding relationships. For each subgroup(s), numerous binding scenarios (case; c) can exist, and each scenario has its own weight, as represented by Equation 3 where TF b concentration vb is Abvbfl, Ab is the TF concentration measured through fluorescence in situ hybridization, and vbfl is an adjusting factor of fluorescent signal to actual TF concentration. Kcoop is the cooperative coefficient of two binding sites of k and h. W0 is a weight of a scenario where no TF binds to the given DNA of the subgroup (in most cases W0=1). In this study, we fixed the TF concentration Ab to 100, because the actual TF concentration in the active form was not available. However, the model was able to optimize the parameters λ and Kmax (Vbfl) to find the optimal fractional occupancy. We expect to be able to analyze more detailed mechanisms if we can obtain the concentration of TFs in their activated form.
| (Equation 3) |
The weights of overlapping TFBSs for a single TF in self-competition can be treated as independent TFBSs. When self-competition was not considered, only the strongest of the overlapping TFBSs for a single TF was considered.
| (Equation 4) |
The probability of TF binding on site i(fractional occupancy; f) is calculated by dividing the total weight of the scenarios where TF binds site i by the total weight of all the scenarios. Zs is the total weight of all the possible scenarios in the subgroup.
As transcription initiation is affected by nearby occupying activators, the contribution of a TF to transcription can be expressed as the product of its fractional occupancy and activation coefficient. However, the function of a TF can change depending on the presence of nearby TFs. In this study, we applied this mechanism to interaction between CRE and TATA box. The ATF/CREB family TFs were set as repressors with a repression coefficient of 0 (or weak activator with activation coefficient of about 0), but they turn into strong activators as they get closer to the TATA box. Fractional occupancy can be divided into fractional occupancy as an activator and as a repressor, as shown in Equations 5 and 6. (EbC: coactivation coefficient of TF b, cb: distance function between TF a and b, dik: distance between site i and k.)
| (Equation 5) |
| (Equation 6) |
The corrected fractional occupancy (F) is calculated by considering a short-range quenching mechanism in which a repressor interferes with the binding of neighboring activators. However, in this study, there are no repressors except for those with a repression coefficient of 0. Therefore, all fractional occupancies (fA) and corrected fractional occupancies (FA) are the same. Equations for mechanisms not covered in this study, such as short-range quenching and direct repression, are omitted here.
| (Equation 7) |
| (Equation 8) |
By lowering the activation barrier, RNA polymerase can bind to the promoter and initiate transcription. This amount of decrease(ΔΔA) can be calculated as the sum of the production of activation coefficient and the corrected fractional occupancy. Using diffusion-limited Arrhenius rate laws, we can describe the effect of lowering this activation energy. As long as M is within a certain range, this rate law can represent synergy that is greater than multiplicative. The transcription rate R ([mRNA]) approaches Rmax when the activation energy barrier drops to 0, because new polymerase molecules can diffuse to the basal complex at the same rate as the diffusion of new polymerase molecules.
Sequences and expression level for modeling
Previously published CRM sequences (synthetic cAMP-regulated enhancer) and mRNA expression data were used for the model training and validation.3 In brief, 87bp CRM sequences were cloned into pGL4.10M. Cloned pGL4.10M with 87bp CRM were transfected into the HEK293T/17 cell line that was treated by 100 μM forskolin. Relative activity of variant enhancers (Δactivity) were obtained by comparing variant enhancers’ tag count ratio (mRNA/plasmid) to mRNA/plasmid ratio of WT.
For the CRM sequences and expression levels as model inputs, upstream 20bp, and downstream 90bp from pGL4.10M are added. In total, 197 bp enhancer sequences were used. Relative levels being multiplied by 100.
We also selected multi-hit synthetic enhancer sequences with distances between variants in the enhancer as greater than 9, because adjacent variants can generate additional unknown TF binding sites.
For hypothetical analysis about the billboard enhancer’s feature, entire 87bp CRE enhancers are flipped for reversed CRM sequences. In rearranged sequences, the 43bp from 3′ and 44bp from 5′ of the synthetic enhancer’s locations are switched (Figures 4A–4C). Upstream and downstream sequences were also added without any modification.
Selection of PWMs and their thresholds
In this study, position weight matrices (PWMs) from the following three different sources are used: JASPAR,47 previously published HT-SELEX data,76 and PBM data-derived PWMs.48,77,78 Only TFs that are expressed in the HEK293 cell line using RNA-seq data from the Human Protein Atlas46 were used. We assumed that if the transcript per million (TPM) was greater than 0, then the TF is expressed in the HEK293 cell line. In the model, although some basic-leucine zipper family TFs can form heterodimer, only homodimer PWMs are considered because they are more readily available. The binding threshold for discarding negative TF binding sites was estimated as a free parameter between a minimum-maximum normalization score of 0.6 to 1. The normalized binding score (Sij) of a TF binding site i, based on a PWM j, is calculated by the following equation.
Parameter estimation
Lam-Delosme Simulated Annealing in serial was used to optimize the model parameters by minimizing the sum of squared differences between the model and data. At least 8 models are trained for each configuration. The parameters for the trained 4TF_self model, 7TF and 7TF_self model could be found in Table S1.
QSAM
A linear QSAM model is a model that predicts the expression rate of a gene based on its enhancer sequence. The model consists of a parameter matrix that represents the contribution of each base at a specific position to expression. The input enhancer sequences were one-hot encoded and multiplied with the parameter matrix to obtain the Δactivity.
Multiple sequence alignments
Transactivation domains sequences (pKID domains or GCN4_cent domain) of 4 ATF/CREB families (CREB1 (NP_004370.1), CREM (NP_877572.1), ATF1 (NP_005162.1), and ATF7 (NP_006847.1)) from NCBI RefSeq79 are compared using Clustal Omega80 with following options. Output guide tree: true, Output distance matrix: false, Dealign input sequences: false, mBed-like clustering guide tree: true, mBed-like clustering iteration: true, Number of iterations: 0, Maximum guide tree iterations: -1, Maximum HMM iterations: -1, Output alignment format: clusta_num, Output order: aligned, Sequence Type: protein.
Quantification and statistical analysis
Pearson’s correlation coefficient (R) between log2(model) and log2(data) was calculated in R(version 4.2.0). The effect of TF combinations on model performance was compared by the highest (rmax), average (ravg), or median (rmed) of the R values for each combination.
Acknowledgments
We would like to thank Manolis Kellis. His advice and inspiration greatly contributed to starting this study. We also thank Kenneth Barr for his technical support, and John Reinitz for his generosity in allowing us to modify and utilize the thermodynamic model of transcriptional regulation. This work was supported by the Basic Science Research Program through the National Research Foundation of Korea (NRF) funded by the Ministry of Education (2015R1D1A1A01059995, 2019R1I1A2A01063045).
Author contributions
Conceptualization, A.R.K.; Methodology, C.K.K. and A.R.K.; Formal Analysis, C.K.K.; Investigation, C.K.K. and A.R.K.; Resources, C.K.K. and A.R.K.; Data Curation, C.K.K.; Writing – Original Draft, C.K.K. and A.R.K.; Writing – Review and Editing, C.K.K. and A.R.K.; Visualization, C.K.K. and A.R.K.; Supervision, A.R.K.; Funding Acquisition, A.R.K.
Declaration of interests
Patent application has been filed by Handong Global University related to this work (Korea Patent application number 10-2023-0049847).
Published: December 15, 2023
Footnotes
Supplemental information can be found online at https://doi.org/10.1016/j.isci.2023.108747.
Supplemental information
References
- 1.Maurano M.T., Humbert R., Rynes E., Thurman R.E., Haugen E., Wang H., Reynolds A.P., Sandstrom R., Qu H., Brody J., et al. Systematic Localization of Common Disease-Associated Variation in Regulatory DNA. Science. 2012;337:1190–1195. doi: 10.1126/science.1222794. [DOI] [PMC free article] [PubMed] [Google Scholar]
- 2.Patwardhan R.P., Hiatt J.B., Witten D.M., Kim M.J., Smith R.P., May D., Lee C., Andrie J.M., Lee S.I., Cooper G.M., et al. Massively parallel functional dissection of mammalian enhancers in vivo. Nat. Biotechnol. 2012;30:265–270. doi: 10.1038/nbt.2136. [DOI] [PMC free article] [PubMed] [Google Scholar]
- 3.Melnikov A., Murugan A., Zhang X., Tesileanu T., Wang L., Rogov P., Feizi S., Gnirke A., Callan C.G., Jr., Kinney J.B., et al. Systematic dissection and optimization of inducible enhancers in human cells using a massively parallel reporter assay. Nat. Biotechnol. 2012;30:271–277. doi: 10.1038/nbt.2137. [DOI] [PMC free article] [PubMed] [Google Scholar]
- 4.Kwasnieski J.C., Mogno I., Myers C.A., Corbo J.C., Cohen B.A. Complex effects of nucleotide variants in a mammalian cis-regulatory element. Proc. Natl. Acad. Sci. USA. 2012;109:19498–19503. doi: 10.1073/pnas.1210678109. [DOI] [PMC free article] [PubMed] [Google Scholar]
- 5.Sharon E., Kalma Y., Sharp A., Raveh-Sadka T., Levo M., Zeevi D., Keren L., Yakhini Z., Weinberger A., Segal E. Inferring gene regulatory logic from high-throughput measurements of thousands of systematically designed promoters. Nat. Biotechnol. 2012;30:521–530. doi: 10.1038/nbt.2205. [DOI] [PMC free article] [PubMed] [Google Scholar]
- 6.Smith R.P., Taher L., Patwardhan R.P., Kim M.J., Inoue F., Shendure J., Ovcharenko I., Ahituv N. Massively parallel decoding of mammalian regulatory sequences supports a flexible organizational model. Nat. Genet. 2013;45:1021–1028. doi: 10.1038/ng.2713. [DOI] [PMC free article] [PubMed] [Google Scholar]
- 7.Kheradpour P., Ernst J., Melnikov A., Rogov P., Wang L., Zhang X., Alston J., Mikkelsen T.S., Kellis M. Systematic dissection of regulatory motifs in 2000 predicted human enhancers using a massively parallel reporter assay. Genome Res. 2013;23:800–811. doi: 10.1101/gr.144899.112. [DOI] [PMC free article] [PubMed] [Google Scholar]
- 8.Nguyen T.A., Jones R.D., Snavely A.R., Pfenning A.R., Kirchner R., Hemberg M., Gray J.M. High-throughput functional comparison of promoter and enhancer activities. Genome Res. 2016;26:1023–1033. doi: 10.1101/gr.204834.116. [DOI] [PMC free article] [PubMed] [Google Scholar]
- 9.Tewhey R., Kotliar D., Park D.S., Liu B., Winnicki S., Reilly S.K., Andersen K.G., Mikkelsen T.S., Lander E.S., Schaffner S.F., Sabeti P.C. Direct identification of hundreds of expression-modulating variants using a multiplexed reporter assay. Cell. 2016;165:1519–1529. doi: 10.1016/j.cell.2016.04.027. [DOI] [PMC free article] [PubMed] [Google Scholar]
- 10.Ulirsch J.C., Nandakumar S.K., Wang L., Giani F.C., Zhang X., Rogov P., Melnikov A., McDonel P., Do R., Mikkelsen T.S., Sankaran V.G. Systematic functional dissection of common genetic variation affecting red blood cell traits. Cell. 2016;165:1530–1545. doi: 10.1016/j.cell.2016.04.048. [DOI] [PMC free article] [PubMed] [Google Scholar]
- 11.Keren L., Hausser J., Lotan-Pompan M., Vainberg Slutskin I., Alisar H., Kaminski S., Weinberger A., Alon U., Milo R., Segal E. Massively parallel interrogation of the effects of gene expression levels on fitness. Cell. 2016;166:1282–1294.e18. doi: 10.1016/j.cell.2016.07.024. [DOI] [PubMed] [Google Scholar]
- 12.Maricque B.B., Dougherty J.D., Cohen B.A. A genome-integrated massively parallel reporter assay reveals DNA sequence determinants of cis-regulatory activity in neural cells. Nucleic Acids Res. 2017;45:e16. doi: 10.1093/nar/gkw942. [DOI] [PMC free article] [PubMed] [Google Scholar]
- 13.Inoue F., Kircher M., Martin B., Cooper G.M., Witten D.M., McManus M.T., Ahituv N., Shendure J. A systematic comparison reveals substantial differences in chromosomal versus episomal encoding of enhancer activity. Genome Res. 2017;27:38–52. doi: 10.1101/gr.212092.116. [DOI] [PMC free article] [PubMed] [Google Scholar]
- 14.Levo M., Avnit-Sagi T., Lotan-Pompan M., Kalma Y., Weinberger A., Yakhini Z., Segal E. Systematic investigation of transcription factor activity in the context of chromatin using massively parallel binding and expression assays. Mol. Cell. 2017;65:604–617.e6. doi: 10.1016/j.molcel.2017.01.007. [DOI] [PubMed] [Google Scholar]
- 15.Grossman S.R., Zhang X., Wang L., Engreitz J., Melnikov A., Rogov P., Tewhey R., Isakova A., Deplancke B., Bernstein B.E., et al. Systematic dissection of genomic features determining transcription factor binding and enhancer function. Proc. Natl. Acad. Sci. USA. 2017;114:E1291–E1300. doi: 10.1073/pnas.1621150114. [DOI] [PMC free article] [PubMed] [Google Scholar]
- 16.Belliveau N.M., Barnes S.L., Ireland W.T., Jones D.L., Sweredoski M.J., Moradian A., Hess S., Kinney J.B., Phillips R. Systematic approach for dissecting the molecular mechanisms of transcriptional regulation in bacteria. Proc. Natl. Acad. Sci. USA. 2018;115:E4796–E4805. doi: 10.1073/pnas.1722055115. [DOI] [PMC free article] [PubMed] [Google Scholar]
- 17.Maricque B.B., Chaudhari H.G., Cohen B.A. A massively parallel reporter assay dissects the influence of chromatin structure on cis-regulatory activity. Nat. Biotechnol. 2018;37:90–95. doi: 10.1038/nbt.4285. [DOI] [PMC free article] [PubMed] [Google Scholar]
- 18.Castaldi P.J., Guo F., Qiao D., Du F., Naing Z.Z.C., Li Y., Pham B., Mikkelsen T.S., Cho M.H., Silverman E.K., Zhou X. Identification of functional variants in the FAM13A chronic obstructive pulmonary disease genome-wide association study locus by massively parallel reporter assays. Am. J. Respir. Crit. Care Med. 2019;199:52–61. doi: 10.1164/rccm.201802-0337OC. [DOI] [PMC free article] [PubMed] [Google Scholar]
- 19.Barnes S.L., Belliveau N.M., Ireland W.T., Kinney J.B., Phillips R. Mapping DNA sequence to transcription factor binding energy in vivo. PLoS Comput. Biol. 2019;15 doi: 10.1371/journal.pcbi.1006226. [DOI] [PMC free article] [PubMed] [Google Scholar]
- 20.Patwardhan R.P., Lee C., Litvin O., Young D.L., Pe’er D., Shendure J. High-resolution analysis of DNA regulatory elements by synthetic saturation mutagenesis. Nat. Biotechnol. 2009;27:1173–1175. doi: 10.1038/nbt.1589. [DOI] [PMC free article] [PubMed] [Google Scholar]
- 21.Kinney J.B., Murugan A., Callan C.G., Cox E.C. Using deep sequencing to characterize the biophysical mechanism of a transcriptional regulatory sequence. Proc. Natl. Acad. Sci. USA. 2010;107:9158–9163. doi: 10.1073/pnas.1004290107. [DOI] [PMC free article] [PubMed] [Google Scholar]
- 22.Beer M.A. Predicting enhancer activity and variant impact using gkm-SVM. Hum. Mutat. 2017;38:1251–1258. doi: 10.1002/humu.23185. [DOI] [PMC free article] [PubMed] [Google Scholar]
- 23.Kreimer A., Zeng H., Edwards M.D., Guo Y., Tian K., Shin S., Welch R., Wainberg M., Mohan R., Sinnott-Armstrong N.A., et al. Predicting gene expression in massively parallel reporter assays: a comparative study. Hum. Mutat. 2017;38:1240–1250. doi: 10.1002/humu.23197. [DOI] [PMC free article] [PubMed] [Google Scholar]
- 24.Liu Y., Irie T., Yada T., Suzuki Y. A new computational method to predict transcriptional activity of a DNA sequence from diverse datasets of massively parallel reporter assays. Nucleic Acids Res. 2017;45:e124. doi: 10.1093/nar/gkx396. [DOI] [PMC free article] [PubMed] [Google Scholar]
- 25.Zhou J., Troyanskaya O.G. Predicting effects of noncoding variants with deep learning–based sequence model. Nat. Methods. 2015;12:931–934. doi: 10.1038/nmeth.3547. [DOI] [PMC free article] [PubMed] [Google Scholar]
- 26.Quang D., Xie X. DanQ: a hybrid convolutional and recurrent deep neural network for quantifying the function of DNA sequences. Nucleic Acids Res. 2016;44:e107. doi: 10.1093/nar/gkw226. [DOI] [PMC free article] [PubMed] [Google Scholar]
- 27.Kelley D.R., Snoek J., Rinn J.L. Basset: learning the regulatory code of the accessible genome with deep convolutional neural networks. Genome Res. 2016;26:990–999. doi: 10.1101/gr.200535.115. [DOI] [PMC free article] [PubMed] [Google Scholar]
- 28.Movva R., Greenside P., Marinov G.K., Nair S., Shrikumar A., Kundaje A. Deciphering regulatory DNA sequences and noncoding genetic variants using neural network models of massively parallel reporter assays. PLoS One. 2019;14 doi: 10.1371/journal.pone.0218073. [DOI] [PMC free article] [PubMed] [Google Scholar]
- 29.Fiore C., Cohen B.A. Interactions between pluripotency factors specify cis-regulation in embryonic stem cells. Genome Res. 2016;26:778–786. doi: 10.1101/gr.200733.115. [DOI] [PMC free article] [PubMed] [Google Scholar]
- 30.White M.A., Parker D.S., Barolo S., Cohen B.A. A model of spatially restricted transcription in opposing gradients of activators and repressors. Mol. Syst. Biol. 2012;8:614. doi: 10.1038/msb.2012.48. [DOI] [PMC free article] [PubMed] [Google Scholar]
- 31.Small S., Blair A., Levine M. Regulation of even-skipped stripe 2 in the Drosophila embryo. EMBO J. 1992;11:4047–4057. doi: 10.1002/j.1460-2075.1992.tb05498.x. [DOI] [PMC free article] [PubMed] [Google Scholar]
- 32.Hanes S.D., Riddihough G., Ish-Horowicz D., Brent R. Specific DNA recognition and intersite spacing are critical for action of the bicoid morphogen. Mol. Cell Biol. 1994;14:3364–3375. doi: 10.1128/mcb.14.5.3364. [DOI] [PMC free article] [PubMed] [Google Scholar]
- 33.Ma X., Yuan D., Diepold K., Scarborough T., Ma J. The Drosophila morphogenetic protein Bicoid binds DNA cooperatively. Development. 1996;122:1195–1206. doi: 10.1242/dev.122.4.1195. [DOI] [PubMed] [Google Scholar]
- 34.Burz D.S., Rivera-Pomar R., Jäckle H., Hanes S.D. Cooperative DNA-binding by Bicoid provides a mechanism for threshold-dependent gene activation in the Drosophila embryo. EMBO J. 1998;17:5998–6009. doi: 10.1093/emboj/17.20.5998. [DOI] [PMC free article] [PubMed] [Google Scholar]
- 35.Wasson T., Hartemink A.J. An ensemble model of competitive multi-factor binding of the genome. Genome Res. 2009;19:2101–2112. doi: 10.1101/gr.093450.109. [DOI] [PMC free article] [PubMed] [Google Scholar]
- 36.Zabet N.R., Adryan B. The effects of transcription factor competition on gene regulation. Front. Genet. 2013;4:197. doi: 10.3389/fgene.2013.00197. [DOI] [PMC free article] [PubMed] [Google Scholar]
- 37.Small S., Kraut R., Hoey T., Warrior R., Levine M. Transcriptional regulation of a pair-rule stripe in Drosophila. Genes Dev. 1991;5:827–839. doi: 10.1101/gad.5.5.827. [DOI] [PubMed] [Google Scholar]
- 38.Small S., Arnosti D.N., Levine M. Spacing ensures autonomous expression of different stripe enhancers in the even-skipped promoter. Development. 1993;119:762–772. [PubMed] [Google Scholar]
- 39.Sauer F., Hansen S.K., Tjian R. Multiple TAFIIs Directing Synergistic Activation of Transcription. Science. 1995;270:1783–1788. doi: 10.1126/science.270.5243.1783. [DOI] [PubMed] [Google Scholar]
- 40.Arnosti D.N., Gray S., Barolo S., Zhou J., Levine M. The gap protein knirps mediates both quenching and direct repression in the Drosophila embryo. EMBO J. 1996;15:3659–3666. [PMC free article] [PubMed] [Google Scholar]
- 41.Hewitt G.F., Strunk B.S., Margulies C., Priputin T., Wang X.D., Amey R., Pabst B.A., Kosman D., Reinitz J., Arnosti D.N. Transcriptional repression by the Drosophila giant protein: cis element positioning provides an alternative means of interpreting an effector gradient. Development. 1999;126:1201–1210. doi: 10.1242/dev.126.6.1201. [DOI] [PubMed] [Google Scholar]
- 42.Gray S., Levine M. Short-range transcriptional repressors mediate both quenching and direct repression within complex loci in Drosophila. Genes Dev. 1996;10:700–710. doi: 10.1101/gad.10.6.700. [DOI] [PubMed] [Google Scholar]
- 43.Chopra V.S., Kong N., Levine M. Transcriptional repression via antilooping in the Drosophila embryo. Proc Natl Acad Sci. 2012;109:9460–9464. doi: 10.1073/pnas.1102625108. [DOI] [PMC free article] [PubMed] [Google Scholar]
- 44.Kim A.R., Martinez C., Ionides J., Ramos A.F., Ludwig M.Z., Ogawa N., Sharp D.H., Reinitz J. Rearrangements of 2.5 kilobases of noncoding DNA from the Drosophila even-skipped locus define predictive rules of genomic cis-regulatory logic. PLoS Genet. 2013;9 doi: 10.1371/journal.pgen.1003243. [DOI] [PMC free article] [PubMed] [Google Scholar]
- 45.Barr K.A., Reinitz J. A sequence level model of an intact locus predicts the location and function of nonadditive enhancers. Levine M., editor. PLoS One. 2017;12 doi: 10.1371/journal.pone.0180861. [DOI] [PMC free article] [PubMed] [Google Scholar]
- 46.Uhlén M., Fagerberg L., Hallström B.M., Lindskog C., Oksvold P., Mardinoglu A., Sivertsson Å., Kampf C., Sjöstedt E., Asplund A., et al. Tissue-based map of the human proteome. Science. 2015;347:1260419. doi: 10.1126/science.1260419. [DOI] [PubMed] [Google Scholar]
- 47.Bryne J.C., Valen E., Tang M.H.E., Marstrand T., Winther O., da Piedade I., Krogh A., Lenhard B., Sandelin A. JASPAR, the open access database of transcription factor-binding profiles: new content and tools in the 2008 update. Nucleic Acids Res. 2008;36:D102–D106. doi: 10.1093/nar/gkm955. [DOI] [PMC free article] [PubMed] [Google Scholar]
- 48.Weirauch M.T., Cote A., Norel R., Annala M., Zhao Y., Riley T.R., Saez-Rodriguez J., Cokelaer T., Vedenko A., Talukder S., et al. Evaluation of methods for modeling transcription factor sequence specificity. Nat. Biotechnol. 2013;31:126–134. doi: 10.1038/nbt.2486. [DOI] [PMC free article] [PubMed] [Google Scholar]
- 49.Tinti C., Yang C., Seo H., Conti B., Kim C., Joh T.H., Kim K.S. Structure/Function Relationship of the cAMP Response Element in Tyrosine Hydroxylase Gene Transcription. J. Biol. Chem. 1997;272:19158–19164. doi: 10.1074/jbc.272.31.19158. [DOI] [PubMed] [Google Scholar]
- 50.Ferreri K., Gill G., Montminy M. The cAMP-regulated transcription factor CREB interacts with a component of the TFIID complex. Proc Natl Acad Sci. 1994;91:1210–1213. doi: 10.1073/pnas.91.4.1210. [DOI] [PMC free article] [PubMed] [Google Scholar]
- 51.Felinski E.A., Quinn P.G. The CREB constitutive activation domain interacts with TATA-binding protein-associated factor 110 (TAF110) through specific hydrophobic residues in one of the three subdomains required for both activation and TAF110 binding. J. Biol. Chem. 1999;274:11672–11678. doi: 10.1074/jbc.274.17.11672. [DOI] [PubMed] [Google Scholar]
- 52.Conkright M.D., Canettieri G., Screaton R., Guzman E., Miraglia L., Hogenesch J.B., Montminy M. TORCs: Transducers of Regulated CREB Activity. Mol. Cell. 2003;12:413–423. doi: 10.1016/j.molcel.2003.08.013. [DOI] [PubMed] [Google Scholar]
- 53.Karin M., Smeal T. Control of transcription factors by signal transduction pathways: the beginning of the end. Trends Biochem. Sci. 1992;17:418–422. doi: 10.1016/0968-0004(92)90012-x. [DOI] [PubMed] [Google Scholar]
- 54.Hai T., Curran T. Cross-family dimerization of transcription factors Fos/Jun and ATF/CREB alters DNA binding specificity. Proc. Natl. Acad. Sci. USA. 1991;88:3720–3724. doi: 10.1073/pnas.88.9.3720. [DOI] [PMC free article] [PubMed] [Google Scholar]
- 55.Chaudhari H.G., Cohen B.A. Local sequence features that influence AP-1 cis-regulatory activity. Genome Res. 2018;28:171–181. doi: 10.1101/gr.226530.117. [DOI] [PMC free article] [PubMed] [Google Scholar]
- 56.Wu W.S., Lai F.J. Functional redundancy of transcription factors explains why most binding targets of a transcription factor are not affected when the transcription factor is knocked out. BMC Syst. Biol. 2015;9:S2. doi: 10.1186/1752-0509-9-S6-S2. [DOI] [PMC free article] [PubMed] [Google Scholar]
- 57.Arnosti D.N., Kulkarni M.M. Transcriptional enhancers: Intelligent enhanceosomes or flexible billboards? J. Cell. Biochem. 2005;94:890–898. doi: 10.1002/jcb.20352. [DOI] [PubMed] [Google Scholar]
- 58.Ong C.T., Corces V.G. Enhancer function: new insights into the regulation of tissue-specific gene expression. Nat. Rev. Genet. 2011;12:283–293. doi: 10.1038/nrg2957. [DOI] [PMC free article] [PubMed] [Google Scholar]
- 59.Jonsson J., Norberg T., Carlsson L., Gustafsson C., Wold S. Quantitative sequence-activity models (QSAM)—tools for sequence design. Nucleic Acids Res. 1993;21:733–739. doi: 10.1093/nar/21.3.733. [DOI] [PMC free article] [PubMed] [Google Scholar]
- 60.Zhou T., Shen N., Yang L., Abe N., Horton J., Mann R.S., Bussemaker H.J., Gordân R., Rohs R. Quantitative modeling of transcription factor binding specificities using DNA shape. Proc. Natl. Acad. Sci. USA. 2015;112:4654–4659. doi: 10.1073/pnas.1422023112. [DOI] [PMC free article] [PubMed] [Google Scholar]
- 61.Picketts D.J., Mueller C.R., Lillicrap D. Transcriptional control of the factor IX gene: analysis of five cis-acting elements and the deleterious effects of naturally occurring hemophilia B Leyden mutations. Blood. 1994;84:2992–3000. [PubMed] [Google Scholar]
- 62.Funnell A.P.W., Crossley M. Hemophilia B Leyden and once mysterious cis-regulatory mutations. Trends Genet. 2014;30:18–23. doi: 10.1016/j.tig.2013.09.007. [DOI] [PubMed] [Google Scholar]
- 63.Rimmer E.K., Houston D.S., Seftel M.D. An Unintended Benefit of Anabolic Steroid Use: Therapy of Hemophilia B Leiden. Blood. 2010;116:3661. doi: 10.1002/ajh.22190. [DOI] [PubMed] [Google Scholar]
- 64.Kitano H. Biological robustness. Nat. Rev. Genet. 2004;5:826–837. doi: 10.1038/nrg1471. [DOI] [PubMed] [Google Scholar]
- 65.Wagner A. Robustness, evolvability, and neutrality. FEBS Lett. 2005;579:1772–1778. doi: 10.1016/j.febslet.2005.01.063. [DOI] [PubMed] [Google Scholar]
- 66.Hietpas R.T., Jensen J.D., Bolon D.N.A. Experimental illumination of a fitness landscape. Proc. Natl. Acad. Sci. USA. 2011;108:7896–7901. doi: 10.1073/pnas.1016024108. [DOI] [PMC free article] [PubMed] [Google Scholar]
- 67.Payne J.L., Wagner A. The Robustness and Evolvability of Transcription Factor Binding Sites. Science. 2014;343:875–877. doi: 10.1126/science.1249046. [DOI] [PubMed] [Google Scholar]
- 68.Fares M.A. The origins of mutational robustness. Trends Genet. 2015;31:373–381. doi: 10.1016/j.tig.2015.04.008. [DOI] [PubMed] [Google Scholar]
- 69.Payne J.L., Wagner A. Mechanisms of mutational robustness in transcriptional regulation. Front Genet. 2015;6:322. doi: 10.3389/fgene.2015.00322. [DOI] [PMC free article] [PubMed] [Google Scholar]
- 70.Davis J.E., Insigne K.D., Jones E.M., Hastings Q.A., Boldridge W.C., Kosuri S. Dissection of c-AMP Response Element Architecture by Using Genomic and Episomal Massively Parallel Reporter Assays. Cell Syst. 2020;11:75–85.e7. doi: 10.1016/j.cels.2020.05.011. [DOI] [PubMed] [Google Scholar]
- 71.Bertolino E., Reinitz J., Manu The analysis of novel distal Cebpa enhancers and silencers using a transcriptional model reveals the complex regulatory logic of hematopoietic lineage specification. Dev. Biol. 2016;413:128–144. doi: 10.1016/j.ydbio.2016.02.030. [DOI] [PMC free article] [PubMed] [Google Scholar]
- 72.Frankel N., Davis G.K., Vargas D., Wang S., Payre F., Stern D.L. Phenotypic robustness conferred by apparently redundant transcriptional enhancers. Nature. 2010;466:490–493. doi: 10.1038/nature09158. [DOI] [PMC free article] [PubMed] [Google Scholar]
- 73.Perry M.W., Boettiger A.N., Bothma J.P., Levine M. Shadow Enhancers Foster Robustness of Drosophila Gastrulation. Curr. Biol. 2010;20:1562–1567. doi: 10.1016/j.cub.2010.07.043. [DOI] [PMC free article] [PubMed] [Google Scholar]
- 74.Perry M.W., Boettiger A.N., Levine M. Multiple enhancers ensure precision of gap gene-expression patterns in the Drosophila embryo. Proc. Natl. Acad. Sci. USA. 2011;108:13570–13575. doi: 10.1073/pnas.1109873108. [DOI] [PMC free article] [PubMed] [Google Scholar]
- 75.Cannavò E., Khoueiry P., Garfield D.A., Geeleher P., Zichner T., Gustafson E.H., Ciglar L., Korbel J.O., Furlong E.E.M. Shadow Enhancers Are Pervasive Features of Developmental Regulatory Networks. Curr. Biol. 2016;26:38–51. doi: 10.1016/j.cub.2015.11.034. [DOI] [PMC free article] [PubMed] [Google Scholar]
- 76.Jolma A., Yan J., Whitington T., Toivonen J., Nitta K.R., Rastas P., Morgunova E., Enge M., Taipale M., Wei G., et al. DNA-Binding Specificities of Human Transcription Factors. Cell. 2013;152:327–339. doi: 10.1016/j.cell.2012.12.009. [DOI] [PubMed] [Google Scholar]
- 77.Weirauch M.T., Yang A., Albu M., Cote A.G., Montenegro-Montero A., Drewe P., Najafabadi H.S., Lambert S.A., Mann I., Cook K., et al. Determination and Inference of Eukaryotic Transcription Factor Sequence Specificity. Cell. 2014;158:1431–1443. doi: 10.1016/j.cell.2014.08.009. [DOI] [PMC free article] [PubMed] [Google Scholar]
- 78.Zhao Y., Stormo G.D. Quantitative analysis demonstrates most transcription factors require only simple models of specificity. Nat. Biotechnol. 2011;29:480–483. doi: 10.1038/nbt.1893. [DOI] [PMC free article] [PubMed] [Google Scholar]
- 79.O’Leary N.A., Wright M.W., Brister J.R., Ciufo S., Haddad D., McVeigh R., et al. Reference sequence (RefSeq) database at NCBI: current status, taxonomic expansion, and functional annotation. Nucleic Acids Res. 2015;44:D733–D745. doi: 10.1093/nar/gkv1189. [DOI] [PMC free article] [PubMed] [Google Scholar]
- 80.Sievers F., Wilm A., Dineen D., Gibson T.J., Karplus K., Li W., et al. Fast, scalable generation of high-quality protein multiple sequence alignments using Clustal Omega. Mol. Syst. Biol. 2011;7:539. doi: 10.1038/msb.2011.75. [DOI] [PMC free article] [PubMed] [Google Scholar]
Associated Data
This section collects any data citations, data availability statements, or supplementary materials included in this article.
Supplementary Materials
Data Availability Statement
Code:
This paper does not report original code, but the code of the thermodynamic model used for this work is available at github.com/kennethabarr.
Data:
PWMs used for ATF/CREB family TFs are in Table S2.
All the sequences and corresponding expression levels are in Table S3.
Protein sequences of pKID domains or GCN4_cent domains for multiple sequence alignment can be obtained from NCBI RefSeq (81) by following accession number: CREB1 (NP_004370.1), CREM (NP_877572.1), ATF1 (NP_005162.1), and ATF7 (NP_006847.1).