

Abstract
While synthetic, conventional surfactants have a known negative environmental impact, their high cost poses a significant challenge. In contrast, naturally extracted surfactants are cheaper and are readily available. The applicability of natural surfactants depends on the saponin concentration, extraction, and synthesis methods. Certain parameters, such as their efficiency in obtaining the required interfacial tension (IFT) values, salinity tolerance, and stability under reservoir conditions, must be examined. Kazakhstan produces a substantial quantity of flaxseed, and flaxseed oil is a good source of fatty acids that can be converted to natural surfactants. Therefore, the work aims to identify the potential of the natural-flaxseed oil surfactant. The experimental study evaluated the synthesized surfactant, effective concentration, salinity’s effect, interfacial tension, rheology, and oil recovery concerns in vugs limestone. A microscopic study was conducted to provide insight into the flow in the vugus matrix. At the same time, the numerical method was also employed to establish a potential recovery understanding. The Fourier spectrometer results proved the distinct presence of the triterpenoid. The critical micelle concentrations are 6 and 2.5 wt % for solution in 0 and seawater salinity, respectively. The IFT was reduced by 40–48% and is more effective in seawater solutions. The oil additional recovery was 39–50% after surfactants. The presence of a fractured vugus did not affect the success of the application. Despite the difficulty in modeling the system, the numerical results agree with the experiments and show only 7% differences in total recovery. The research offers novel natural surfactants that can be applied in offshore Kazakhstan.
1. Introduction
Enhanced oil recovery (EOR) targets increasing oil mobility by changing the physical or chemical properties. Generally, the methods include injecting gas, water, or chemicals into the reservoir.1 Injected fluids improve the overall displacement, mobilizing and producing more trapped hydrocarbons.2,3 Chemical flooding is a technique that employs various chemical agents such as surfactants, polymers, and alkalies. Chemical EOR (CEOR) is employed to enhance oil production by optimizing the effectiveness of water injection into the reservoir. For instance, introducing polymers into the process elevates the viscosity of the water-based solution. This improvement in oil mobility leads to an augmented oil flow toward the production well.4 Alkali is used to modify the surfaces by chemical reaction, or it can react with the oil and create in situ soap.5 Surfactant solutions reduce the interfacial tension (IFT) between water and oil and lower the capillary forces of trapped and residual oil in the reservoir.2 Also, due to the effect of wettability alteration and surfactant desorption, the oil-wet layer alters to a water-wet state, increasing oil production.6,7
Surfactants can reduce the IFT to different degrees. A successful surfactant must achieve an IFT of less than 10–2 mN/m. For surfactants to achieve a microemulsion state, the values vary between 10–3 and 10–5 mN/m.3 The surfactant’s effectiveness depends on the reservoir temperature, salinity, and rock composition.8 On another upscaled level, the initial water saturation can play a role in risk factors, especially in the numerical modeling outcomes.9 Among the latest employed surfactants are gemini surfactants, which reportedly need very low workable concentrations, between 0.001 and 0.1 wt %.10 Sodium dodecyl sulfate (SDS) is more conventional and extensively explored in the petroleum context.11 The surfactant’s application still faces three significant challenges: first, reducing surfactant concentration due to adsorption results in high cost; second, the surfactant’s chemical structure and stability at temperatures above 60 °C;10 and lastly, the surfactant’s tolerance to high salinity makes it lose its efficiency.12
Besides the technical shortcomings, synthetic surfactants derived from petroleum sources have been reported to have a negative environmental impact, including toxicity that harms the entire ecosystem.13,14 Therefore, many industrial applications are encouraged to reduce the harmful chemical impact on the environment. Changing the extraction and implementation of the natural surfactant can be a possible solution. Compared to conventional surfactants, they can be sustainable, cheaper, and less environmentally hazardous and have excellent potential for IFT reduction. Natural surfactants are extracted from renewable sources, such as animals or plants.15 Saponin is the primary surfactant source and a compound of naturally occurring glycoside groups.16 The complex molecular structure results in the detergent characteristics of the saponin; shaking creates soapy formation in the water solutions. Therefore, stable foam is produced in the water.17,18 The natural surfactant’s behavior and efficiency in the oil recovery process can vary depending on the source and method of extraction. The different extraction methods include spray drying, maceration, Soxhlet extraction, ultrasonic extraction, and chemical conversion of herbal to produce natural surfactants.19 Investigating the contrast between natural and conventional approaches is a cornerstone of scholarly pursuits within the EOR domain, signifying a fundamental paradigm shift in research objectives.20 There is also a substantial amount of research on natural surfactants considering IFT and wettability results, as presented in Table 1. As elucidated by Mehrjoo et al., biosurfactants stand as an example of both economic prudence and environmental friendliness in the realm of surfactant technologies for the oil industry.21 A recent example of a natural surfactant application is Alfalfa, extracted from a perennial flowering plant. Results of experiments showed an IFT reduction of 63.39% at 4 wt % CMC. Moreover, the application of Alfalfa surfactant changed rock wettability from sharp oil wet to water wet, resulting in a contact angle change of 49.91%.22 Another study by Alamier et al. tested three natural surfactants: AlkaSurf X, Palm kernel oil, and Moringa leaves. Core flooding results showed 22.7 and 18.8% of additional oil extracted from AlkaSurf X and Moringa leaves, respectively. The success was proved in ambient conditions, and further tests in elevated temperatures and pressures are necessary.23 The effect of natural surfactant adsorption was studied by Abbas et al., three natural surfactants (saponin sources): fenugreek, sugar beet leaves, and chickpeas. Results showed 192 g/kg surfactant adsorption of a rock surface at 5 wt % CMC.24 The study was limited to surface interaction, and no phase analysis was studied. The comparative study conducted by Sami et al. shows the effectiveness of Avena sativa surfactant over traditional DIW flooding. Results showed higher recovery for natural surfactant compared to DIW; recovery values are 28.29 and 23.14%, respectively.25 Chauhan et al. have used the natural surfactant Chuback with Xanthan gum polymer to evaluate the recovery performance. Results showed a more significant recovery of 28.6%, an IFT reduction of 74%, and considerable wettability alteration in sandstone and carbonate cores. As demonstrated by Cheok et al., Quinoa natural surfactant is stable under reservoir conditions and has excellent IFT reduction efficiency. Results from core flooding experiments revealed an extra 24.1% in oil recovery. In addition, the contact angle reduced from 146 degrees to 26.3 degrees, and the interfacial tension (IFT) from 33.2 to 8.7 mN/m.17 El-Dossoki et al. analyzed the hydrophobicity of four different surfactant solutions: Aspilia africana, Dialium guineense Willd, Vernonia amygdalina, and Jatropha curcas. Results from the study showed average CMC values for all surfactants between 0.45 and 0.6% and hydrophobicity values from 0.116 and 0.194. According to the analysis this range of hydrophobicity results in great IFT reductions; however, no experiments were conducted to address the recovery and IFT.26 Based on reported data, the main identified constituents are saponin, flavonoids, alkaloids, and terpenoid.27 All extracted and synthesized natural surfactants have the potential for success which depends on their active chemical constituents and purity. Thus, understanding the performance of each surfactant under different conditions is the key to uncovering the application potential. There is no straightforward answer for the natural surfactant efficiency in field scale due to the complexity of flow in porous media.28,29 However, the performance prediction for each natural chemical in the laboratory provides an estimation of fractional oil recovery that is relatively useful if it was associated with the numerical model.
Table 1. Recent Studies on Natural Surfactant.
| natural surfactant | CMC | IFT reduction | contact angle reduction | core flooding | references |
|---|---|---|---|---|---|
| vitagnus | 3000 ppm | from 29.5 to 1.87 mN/m | from 114 to 29° | incremental RF 12.8% | (30) |
| passiflora plant | 4 wt % | from 32 to 13 mN/m | from 122 to 55° | incremental RF 7.5% | (31) |
| tanacetum plant | 1000 ppm | from 29.5 to 5.12 mN/m | from 100 to 33° | incremental RF 13.2% | (32) |
| tarragon plant | 1000 ppm | from 28 to 6.57 mN/m | from 100 to 30.8° | incremental RF 11.7% | (32) |
| fenugreek seeds | 0.2 wt % | from 27 to 10 mN/m | from 74 to 48° | incremental RF 10–17% | (33) |
| alfalfa, Medicago sativa | 4 wt % | 63.39% | 49.41% | incremental RF 19.2% | (22) |
| hibiscus, Moringa oleifera | 0.4 wt % | N/A | N/A | incremental RF 18.8–22.7% | (34) |
| Chuback acanthophyllum | 1.25 wt % | 74% | from 16.71 to 60.52° | incremental RF 16% | (35) |
| quinoa | 1500 ppm | 24.5 mN/m | from 146 to 26.3° | incremental RF 24.1% | (36) |
| Glycyrrhiza glabra | 0.35 wt % | from 49.06 to 65.64% | N/A | N/A | (37) |
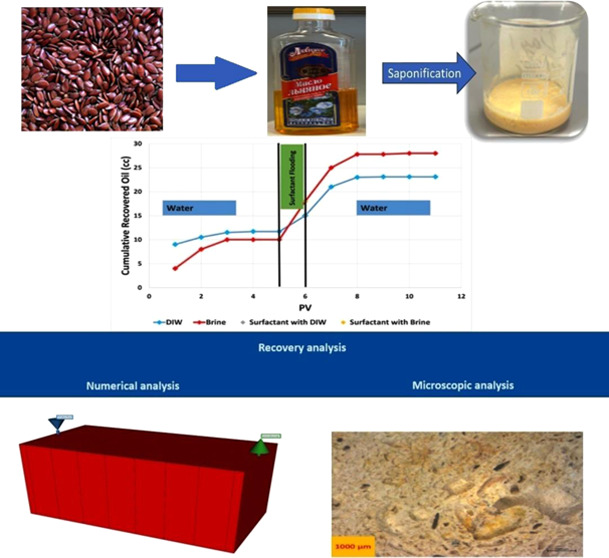
This current work is motivated by Kazakhastan’s sustainable goals. The conversion of offshore practices to environmentally friendly chemicals is a priority, bearing in mind that chemicals should originate from readily available resources in the country. Therefore, the work intends to identify the flaxseed oil surfactant potential in offshore CEOR. The proposed surfactant will be experimentally evaluated for yield and composition in the first stage, followed by the effect of seawater salinity on the surfactant’s effective concentrations and the rheology concerns in the porous media. The study offers new information on possible natural surfactant application in the vugus matrix by reporting the oil recovery and microscopic visualization output. Visual observation is an indirect approach to demonstrate the flow. A numerical method was adopted, and the history was matched against the core flooding parameters. The aforementioned numerical flow procedure is enacted to provide a numerical oil recovery range, which puts the evaluation in an industrial prospect; the current study endeavors to bridge the gap between chemical innovation and physical understanding in complex reservoirs.
2. Methodology
The central aim of this section is to dissect the performance of natural surfactants for EOR. This exploration is predicated on the hypothesis that these interactions play a pivotal role in amplifying microscopic sweep efficiency, a cornerstone in the efficacy of EOR methods. Accordingly, our study employs several procedures designed to capture and quantify key parameters. Starting by synthesizing the natural surfactant and characterizing the functional group. The interfacial tension (IFT) between the involved fluids is meticulously measured. Lastly, the methodology offered three different evaluations of oil displacement within porous media using experimental, microscopic, and numerical models.
2.1. Materials
Cold-pressed flaxseed oil, produced by Lyubimoye and co-workers from Kazakhstan, was used for this study. It is unrefined and natural and was supplied at the local store. This type of oil, also called “Linum usitatissimum,” is produced from flaxseeds and is well known for its versatility. With a high concentration of omega-3 fatty acids, flaxseed oil is often used in health care, cooking, skincare, etc.
Sigma-Aldrich supplied sodium hydroxide (NaOH) used in the saponification process with 97% purity and 40.00 g/mol molecular weight. The synthetic oil, Octane, was provided by Sigma-Aldrich and has 98% purity and a molecular weight of 114.23 g/mol. The reason for choosing Octane instead of the Kazakhastan oil sample is due to the high sulfur content that might affect the screening required in the study, yet it provides a comparable density. Moreover, the Oil Red O dye with a molecular formula C26H24N4O from the AlfaAesar was used to impart a color to the oil for higher accuracy and precision of the results. The chemical properties are presented in Table 2.
Table 2. Chemical Properties.
| material properties | density, g/cm3 | viscosity at 25 °C, cP |
|---|---|---|
| flaxseed oil | 0.929 | 25 |
| octane | 0.703 | 0.51 |
| brine | 1.023 | 0.97 |
| water | 0.997 | 1.00 |
The core used is carbonate Edwards Brown limestone from Texas, as shown in Figure 1. This core has a similar lithology to the Kashagan field.38
Figure 1.

Limestone core used in the experiment.
2.2. Synthesis of Surfactant
200 mL of flaxseed oil and 200 mL of NaOH at a concentration of 10 M were placed on a magnetic stirrer at 50 °C and 150 rpm stirring speed for 30 min to complete homogenization. Then, the sample was closed with laboratory wax paper and stored in a dry, dark place for 24 h. Finally, excessive oil was removed from the sample to use the solidified part further. This procedure was followed by sample preparation by diluting it in a solution.24
2.3. Preparation of the Surfactant Solution
Surfactant stock solutions of 100 mL were prepared for each concentration: 1, 2, 5, 6, and 10 wt %. A similar preparation was also conducted for seawater salinity. All solutions were placed on a magnetic stirrer with a 150–200 rpm speed until complete homogenization.
2.4. Chemical Characterization
2.4.1. FTIR Analysis
Fourier transform infrared (FTIR) spectroscopy, also known as FTIR spectroscopy or FTIR analysis, was employed to characterize the functional groups of interest. This analytical technique is commonly utilized to identify organic, polymeric, and sometimes inorganic compounds. Specifically, FTIR spectroscopy was employed to scrutinize the functional chemical groups and structural attributes of both flaxseed oil and flaxseed surfactant samples.
To acquire the FTIR spectra, a Nicolet iS10 FTIR spectrometer was employed. The device is equipped with a ZnSe flat crystal. The FTIR spectra of the samples were obtained using the OMNIC program, and the process involved several steps. Initially, a background spectrum was collected for each sample and checked against the reference background spectra. Subsequently, the pressure was adjusted, and 20 mg of finely ground powdered samples was added to the crystal. A total of 32 recordings were conducted to generate the spectra for analysis.
2.4.2. IFT Measurement
Interfacial tension (IFT) is the force at the interface between two immiscible phases. The apparatus used for the IFT measurement was the IFT 700-HPHT Interfacial Tension Meter from Vinci Technologies, France. This device uses a pendant drop method to determine the IFT using the Laplace equation. The mechanism is as follows: a droplet (drop fluid) is formed in the chamber containing bulk fluid through a capillary needle. State-of-the-art cameras can capture droplets to capture the image. Using the Laplace equation, the camera provides the image to computer software that determines the necessary geometric parameters to derive the interfacial tension.
As a drop in the experiment, we used the synthetic oil octane with a red dye to differentiate it from the surfactant, as both fluids were transparent cite. The surfactant solutions with 1, 2, 5, 6, and 10 wt % concentrations have been measured. The results were obtained. A similar procedure was conducted for the seawater samples. As a result, the critical micelle concentration (CMC) value can be determined from the inflation point by drawing the concentrations vs their corresponding IFT values. It is worth noting that the critical micelle concentration signifies the lowest amount of surfactant concentration required in the solution to provide the lowest IFT values. Any additional concentrations will form micelles and will not interact with oil.
2.4.3. Rheology Test
It is necessary to highlight the rheology of the formed novel surfactant to ensure that the surfactant formulations are suitable for the reservoir conditions. The rheology test was completed using the Physica MCR-302, an Austrian Anton Paar rheometer. The setup was used to measure shear rates between 1 and 1000 1/s, and the viscosity was measured at different temperatures between 25 and 55 °C with increments of 10 °C for each concentration. The concentrations used in this experiment are 0.5, 2, and 5 wt % of the surfactant solution with DIW.
2.5. Core Flooding
The core flooding experiment was performed to identify the EOR potential of the surfactant. The ACA-700 Aging cell apparatus provided by the French Vinci Technologies system is shown in Figure 2. It consisted of two fluid batteries, one for injected fluid and one for water; a core holder; a hydraulic pump to supply confining oil; a DIW pump to regulate the injection flow rate; and two pressure gauges for confining and back pressures. The selected core was an Edward Brown carbonate core to mimic Kazakhstan reservoir rocks. The reported cylindrical core dimensions were 7.55 cm long and 3.75 cm in diameter. The dry core was first saturated with DIW; rates from 0.5 to 4 cc/min with a step of 1 cc/min were used to compute permeability. Darcy’s law was used to calculate the permeability. Afterward, the effective pore volume and porosity were calculated on the weighting scale. A summary of core characteristics is presented in Table 3.
Figure 2.

ACA-700 aging cell apparatus.
Table 3. Core Data.
| parameter | core 1 | core 2 |
|---|---|---|
| diameter, cm | 3.75 | 3.75 |
| length, cm | 7.55 | 9.42 |
| dry weight, g | 125.4 | 125.72 |
| wet weight, g | 157.3 | 163.22 |
| pore volume, cc | 32 | 37.5 |
Core flooding preparation started with setting confining and back pressures of 1000 and 300 psi, respectively. The core sample was saturated with Octane to create initial oil saturation, and the water was reduced to the critical saturation. After this step, the core was set in the experiment; the ambient temperature was held constant at 25 °C. For the water flooding preflush, 5 PV of DIW were injected at a 1 cc/min rate until no oil production was observed. The main flush consisted of 1 PV of surfactant at the CMC, injected at 1 cc/min. In the last step, 5 PV of DIW was injected as a postflush until no oil was produced. The same procedure was repeated for surfactant and brine at 35000 ppm NaCl.
2.6. Microscope View
Original cores were studied under the ZEISS Stemi 508 stereo microscope, made in Germany, and images of cores before and after the flooding were taken. These pictures were taken to visualize the remaining oil distribution after surfactant flooding and compare them to the original images of the dry core. Moreover, these pictures help to explain the displacement mechanisms of oil movement and help us to understand the microscopic sweep efficiency and effectiveness of surfactant flooding experiments. The stereo microscope depicts objects in the field of view up to 120 mm with 8:1 zoom, enabling high-resolution and good-quality pictures. Analyzed cores before and after flooding were cut into 5 mm cylinders, and the surface of the samples was recorded through a camera and software. Different magnification levels were used to characterize the core matrix from 100 to 1000 times upscale. High-resolution upscaling can indicate possible plugging mechanisms and fluid flow paths. Imaging software analyses and increased precision images distinguish the surfactant swept area from the original oil pores.
2.7. Numerical Simulation
For a clear vision of flow mechanisms during surfactant flooding, the core flooding experiments must be adequately modeled and calibrated by matching the core flooding experimental data. Therefore, the experimental data was tested with computer modeling group software, CMG STARS, using 1D model construction and simulation runs, as shown in Figure 3. Technically, STARS software has shown comparable laboratory scale simulations and core results with friendly settings.39
Figure 3.

3D view of the grid model.
One of the main assumptions in model construction is cubic grid geometry instead of cylindrical geometry to simplify the model. The model was divided into 9 Cartesian coordinate grids by BUILDER in CMG, using the direct line drive. This flooding pattern depicts the core setup and where the injector and producers are perforated in the first and last grids, for the initial core parameters were set in the core flooding experiment, as indicated in Table 4.
Table 4. Input Parameters for Numerical Simulation.
| parameter | value | unit |
|---|---|---|
| grid numbers (I, J, K) | 9 × 1 × 1 | |
| grid dimensions | 0.0027; 7 × 0.01; 0.0027 | |
| porosity | 0.38 | fraction |
| permeability (i, j, k) | 287 | mD |
| initial pressure | 1000 | psi |
| temperature | 25 | °C |
| initial water saturation | 25 | % |
| oil density | 703 | kg/m2 |
| oil viscosity | 0.51 | cP |
| surfactant concentration | 6 | wt % |
| surfactant viscosity | 1.1 | cP |
| injection rate | 1 | mL/min |
| simulation step time | 5 | min |
The software results were compared with the flooding experiment results. History matching, including the Corey tuning parameters end point, was conducted to find the tuning parameters of the surfactant injection time. The process was intended to evaluate the cumulative oil production using simplified numerical constraints.
3. Results and Discussion
3.1. Saponification
After stirring the solution of 10 mL of flaxseed oil and 10 mL of NaOH solution, the obtained sample was air-dried for 24–48 h. As a result of the saponification, the fatty esters within the flaxseed oil have been broken and fatty acid salts have been formed. The mass of the obtained surfactant was 18.45 g. The solidification process can be observed in Figure 4.
Figure 4.

Saponification stages.
The saponification reaction is simply the hydrolysis of an ester with a base, which forms the salt of the acid, soap, and alcohol. Considering the mechanism of the process, it is considered a nucleophilic carbonyl substitution. First, the ester group is attacked by a nucleophilic hydroxide ion, which forms the intermediate. Then, this intermediate is rearranged by a leaving group release, which is then removed to form carboxylic acid and alkoxide. Finally, a carboxylate ion and alcohol are formed due to deprotonation, where the hydrogen is removed from the carboxylic acid by an alkoxide.40
In this case, during this saponification reaction, each of the ester bonds in the triglyceride is hydrolyzed by sodium hydroxide, resulting in equivalent molecules of fatty acid salts (soap) and a single molecule of glycerol. Similarly, the soap has been made in studies from different types of oil. According to Sutheimer, Caster, and Smith, green soap was formed due to the saponification of avocado oil. The extracted avocado oil was mixed with aqueous sodium hydroxide for 20–30 min, and then the soap bars were cured for the following month for further solidification. Furthermore, J. curcas seed oil was used in another experiment by Tennouga et al. J. curcas seed oil was mixed with potassium hydroxide and ethanol with the later addition of water to form soap. Generally, the reaction is similar to what was reported in the literature.
3.2. Natural Material Characterization
3.2.1. FT-IR Analysis
The functional groups in the flaxseed oil and saponin samples were determined by using Fourier transform infrared (FTIR) spectroscopy. As seen in Figure 5, notable bands in the infrared absorption spectra of flaxseed oil can be linked to the vibratory stretching of C=C–H and C–H. These bands are located at 3007 and 2921 cm–1, respectively. Additionally, the spectra indicated vibratory stretching at 1741 cm–1 for C=O and 1157 cm–1 for C–O.
Figure 5.

FTIR absorption spectrum data for flaxseed oil and the extracted surfactant.
The infrared absorption range of the surfactant extracted from natural sources was juxtaposed with the established saponin spectrum found in the literature (Shi et al.). There were recognizable infrared absorption signals, such as the hydroxyl group (O–H) at 3292 cm–1. Furthermore, specific functional groups of the compounds O–H, C=C, and C=O=C were used to establish the existence of terpenoid compounds in the sample. The absorption peak for C=C was observed at 1634 cm–1; for C=O=C, it was noted at 1457 cm–1. Consequently, saponin in the surfactant was positively identified by detecting its distinctive chemical marker, namely, terpenoid.
The spectra for the extracted natural surfactant were similar to those of earlier published studies. For instance, the FTIR analysis of the surfactant extracted from the seed oil of Baphia nitida has identified the presence of C–H stretching and C=C–H vibrations.41 Moreover, the results obtained from the palm fatty acid-based polymeric surfactant analysis showed the presence of O–H and C=O functional groups.42 In general, most of the research papers have presented different results in FTIR analysis, with a primary similarity by the identified C=C, O–H, and C=O functional groups. As these bonds were shown from the spectrum of the extracted surfactant sample, the presence of saponin within the surfactant can be confirmed based on the comparative analysis within the published literature.
3.3. Interfacial Tension Measurement
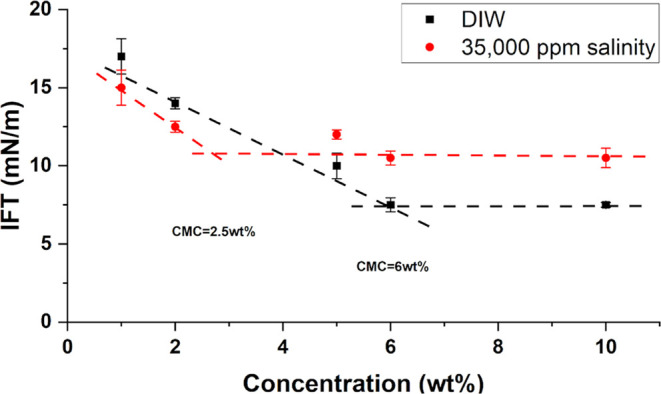
The reduction of the water–oil IFT by surfactant occurs because the surfactant expands and adsorbs on oil and water, forming a film. This causes a low interfacial tension between oil and water molecules. The measurements were tripled to confirm the measurement. The IFT standard deviation error is approximately ±1. Figure 6 shows the IFT of natural surfactants under different solutions against oil. The observations show that the IFT alters as concentration changes. Mainly, both DIW and salinity solutions of natural surfactants showed a decreasing trend initially. They reached the point when the IFT reduction was no longer visible. The difference in IFT between DIW and salinity shows the superiority of the brine-based solution in reducing the IFT at low concentrations of natural surfactants. In contrast, the DIW solution reduced IFT significantly compared with the brine solution at a higher concentration. These results could be attributed to previous observations by some researchers describing the effect of high monovalent ion concentrations on the transfer of surfactant molecules to the oleic phase. This transfer results in increasing the measured IFT.29,43
Figure 6.
Concentration vs IFT.
The current study uses IFT measurements to identify the inflation point. It is usually recorded by the maximum concentration that results in minimum interfacial tension. The CMC values for the surfactant solutions with both DIW and at 35 000 ppm salinity (seawater salinity) were identified at the inflation point in the concentration vs IFT measurement.
As shown in Figure 7, the stabilization concentration for the surfactant in DIW was about 6 wt %. IFT reduced from 33 to 7.5 mN/m, which accounted for 77.3% reduction. Similar results were obtained for saponin extracted from A. sativa. Results of a study by Bao et al. showed 74.20% IFT reduction. Another study by Daghbandan et al. reported an IFT reduction from 49.06 to 65.64%. For quinoa surfactant, the CMC was 1.5 wt % and the IFT changed from 33.2 to 8.7 mN/m which obtained around 73.8% reduction.36 Based on the current finding, the flaxseed-derived surfactants have acceptable competitive results.
Figure 7.

Viscosity of the surfactant solution: (a) 1 wt %, (b) 2 wt %, and (c) 5 wt % at different temperatures.
The mechanism contributing to the micellization of nonionic surfactants is the hydrophobic tail attached to the oil, while the hydrophilic part is attached to water molecules. This creates an adsorption film that eventually reduces the surface repulsion between the active energy of the two phases.44 Any further surfactant addition will not contribute to the IFT reduction, and the IFT will remain unchanged.
By looking at the effect of salinity is looked at, it can be seen that salinity negatively affects the IFT reduction. IFT measurements at 35 000 ppm salinity decreased from 23.9 to 12.3 mN/m at the CMC of 2.5 wt % and resulted in 48.5% reduction. Previous work on Tarragon surfactant and Tanacetum surfactant in brine of 7000 ppm showed that the IFT reduced by 93.3 and 76.5%, respectively.45 The salinity is 5 times higher for the current study, which justifies the difference. Nevertheless, it is an indication that the performance is acceptable. More observations were reported regarding the low solubility of nonionic surfactants in high salinity. According to Miyagishi et al., this tendency was not observed in the cationic and anionic surfactants. The presence of salt ions reduces the solubility of natural surfactants and, as a result, decreases the CMC with IFT.28 This confirms that the CMC value and IFT reduction potential of nonionic natural surfactants depend on the reservoir’s salinity.
The CMC value identification is considered necessary because it mirrors the cost of the required surfactant. The low CMC values indicate an economic advantage compared to the higher ones. It is well known that aggregates of monomers are formed above the CMC value. This does not allow the interaction of the oil and water, trapping one phase inside the newly shaped structure.46 However, since Kazakhstan’s oil fields are mainly offshore, it is essential to consider that distilled or deionized water will not be used to prepare the surfactant aqueous phase. The seawater will probably be used, which might not reflect the true potential of the surfactant to solubilize the oil. However, the brine and high salt concentration lead to the micelles forming more readily, thus reducing the CMC value.36,47
3.4. Rheology
In this study, the rheology of the natural surfactant was measured by rheometer using DIW solutions of 0.5, 2, and 5 wt %. The surfactant is expected to be a non-Newtonian fluid. Surfactant changes the surface and interfacial tension. Also, surfactants can promote emulsification; these factors change the molecular structure of the solution.6 As a result, the apparent viscosity of the solution varies, depending on the concentration of the surfactant.
The rheology results in Figure 7 show that increasing the surfactant concentrations results in higher viscosity, which is a typical behavior for natural surfactants. Additionally, as the temperature increases from 25 to 55 °C, the viscosity drops by 13, 15, and 23% at concentrations of 0.5, 2, and 5 wt %, respectively. The temperature mechanism has been interpreted as the rise in temperature leading to faster movement of particles that shortens interaction time within particles and reduces internal friction; thus, the viscosity decreases.
For every concentration, the recorded viscosity increased by 0.5 cP. The increase in viscosity with concentration is due to a change in the number of molecules. The more surfactant molecules in the solution, the harder it is to move the solution.14
The viscosity at 10–15 s–1 shear rate altered between 1 and 2 cP. As fluids in the reservoir move at 1 ft/s speed and have a low shear rate of 8–10 s–1, the values mentioned above were taken.48 Also, the general viscosity of the solution is low at high shear rates.
According to Narehei et al., where plant-based surfactants were characterized, the saponin surfactant’s viscosity and shear stress were similar to this study’s results. However, the rheometer recorded the slight shear thickening behavior of the solution as the shear rate increased from 1 to 1000 s–1. In addition, some unusual decreases in the viscosity at 500 s–1 were shown at 2 and 5 wt %.
3.5. Core Flooding
3.5.1. Core Characterization
The main investigation of limestone’s core characteristics is crucial. It was rough because limestone is usually inspected visually. As seen in Figure 1, the apparent vugs and cavities were not dominant in all of the cores. The microscopic view, as shown in Figure 9a, indicated the same visual inspection findings. However, the importance of characterizing the cavities is linked to the effective porosity, which explains the storage of hydrocarbon capacity. Additionally, the permeability analysis indicates the possible response to the chemical flow. Although major advancements in EOR are achieved in sandstone, it is also necessary to explore limestone to promote its application in this formation. The cores were characterized as high-porosity limestone with very fine grains and pebbles or quartz bodies within the rock. The density of the visible caves and dissolved pores was limited to less than a radius of less than 0.1 mm in the entire section. Yet, it provided 38 and 36% for Core 1 and 2, respectively. In association with porosity, the determination of permeability, as seen in Table 5, provided 287 and 288 mD. The results matched the Kocurek Industries, from which the limestone core was provided. The average permeability is 60–300 mD, which shows that the resulting value is within the range of reference.
Figure 9.

Image of core sample surface: (a) before surfactant flooding and (b) after flooding using 100, 200, 500, and 1000 μm unit scale.
Table 5. Core Parameters Measurement prior to Core Flooding.
| parameter | core 1 | core 2 |
|---|---|---|
| porosity | 0.38 | 0.36 |
| absolute permeability | 287 mD | 288 mD |
| relative permeability Ko | 140 mD | 145 mD |
| Sor | 0.13 | 0.12 |
| Sw | 0.25 | 0.24 |
3.5.2. Core Flooding
Several explanations have been proposed to evaluate the role of natural surfactants in enhancing oil recovery. The mechanisms involved include a reduction in IFT, which significantly reflects the amount of oil recovered. Also, wettability alteration was a possible mechanism, but the impurity of the extraction or esterification masks it.49 To some extent, the mechanism could be comparable to that of any synthetic surfactant. However, the complexity level rises at the cores that are not defined by a simple geometric or are not homogeneous as typical sandstone. The effectiveness of the surfactant will be defined by the flow path during the injections. In the current study, since vugs contribute to the expected oil recovered at the end of the process, the results were reported based on the effluent fluid measurement. To ensure uniformity between the two flooding scenarios, 11 PVs were injected for each core. The process and results are presented in Table 6. The major difference between the two cases is the concentration corresponding to the CMC.
Table 6. Core Flooding.
| parameters | units | core 1 (DIW) | core 2 (brine) |
|---|---|---|---|
| nat. surfactant viscosity at 25 °C | cP | 1.5 | 1.5 |
| nat. surfactant concentration | wt % | 2.5 | 6 |
| salinity | ppm | 0 | 35 000 |
| permeability to oil | mD | 214 | 240 |
| water breakthrough after (PV injected) | 1.3 | 1.2 | |
| recovery from initial WF 5 PV | % | 36.5 | 27 |
| additional recovery after 1 PV of nat. surfactant | % | 12 | 11 |
| additional recovery after the final WF (5 PV) | % | 23.5 | 36.6 |
| estimated water saturation | % | 22 | 25 |
In a practical sense, in the absence of salinity, the results obtained in Figure 9a showed that the water flooding recovered around 36.5% and the surfactant PV resulted in 12%, yet during the post flush, the oil recovery maximized by 23%.
The results of the postflush indicated the superiority of the saline brine in achieving better recovery after the flooding as seen in Figure 9b. This behavior is explained by the interaction between the brine and oil-wet surface, which might be a direct reason for shifting the wettability and the lower IFT achieved. Moreover, it can be argued that the maximum oil recovery is achieved because capillary forces are minimized further during the brine (seawater salinity).50 There is no doubt that the achieved oil displacement is efficient in both cases due to the natural surfactant.
In Figure 8a,b, the pressure drop (dP) profile exhibits an initial rise during water flooding, followed by a plateau likely due to the minimum mobilization of oil, suggesting a limit to further oil extraction with this method alone (reaching the remaining oil saturation). Subsequently, a peak in dP marks the shift from water preflush to surfactant flooding, after which the pressure drop declines and reaches a new equilibrium. This behavior may indicate the formation of an oil bank or the creation of smaller oil droplets, which alters the oil flow. Comparing both profiles, the increased dP during brine flooding suggests that the presence of NaCl aids in oil untrapping. The enhanced oil recovery mechanism by seawater is mainly attributed to ion exchange between the water and the rock.51 Throughout the surfactant and subsequent water postflush stages, the persistent higher dP in comparison to deionized water (DIW) implies increased flow resistance. This is attributed to the lower interfacial tension (IFT) caused by brine, which facilitates oil mobilization. Additional factors influencing these disparities include the higher density of brine compared with DIW and the role of NaCl in enhancing oil-rock interactions for more efficient oil displacement.
Figure 8.

(a) Cumulative oil produced by surfactant in Deionized water, (b) cumulative oil produced by surfactant in seawater salinity, and (c) recovery factor comparison.
Despite the potential for channeling in heterogeneous, vuggy limestone rock formations, which can complicate core-scale analyses, natural surfactants were able to flow in the smaller pores. Surfactant dynamics preferentially target expansive vugs until they reach capacity, thereafter diffusing into finer porosities to facilitate hydrocarbon displacement. Subsequent dilution during postflush phases induces secondary interfacial tension reduction, enhancing oil mobilization by reducing surfactant concentration within vugular structures, especially in dilute secondary floods, which appear to be effective,52
As seen in Figure 8c, the oil recovery factor increases with the volume of pore (PV) injected for both DIW and Brine. Initially, both fluids demonstrate a marked increase in oil recovery as more PV is injected, indicating that the initial injection effectively displaces oil. However, the recovery curves during surfactant injection present a new trend where the residual oil causes a spike in the pressure drop. The plateau between DIW and salinity is reached approximately after injecting 8–10 PV, suggesting that nearly maximum recovery has been achieved and further injection yields no significant increase in oil recovery. The incremental oil recovery due to the surfactant is around 11–12%. Previous ranges of incremental recovery indicated that Acanthophyllum (Chuback) has 16%35 to higher at 24.1% for Quinoa.36 For Hibiscus and Moringa oleifera, the range slightly widens from 18.8% to 24.1%.34 However, our current results indicate that most of the incremental recovery is achieved during the postflush phase.
3.6. Microscope View
Figure 9a shows the core surface captured under a microscope to demonstrate the pores. The pore size can reach 100–500 μm, considered above average. The pore size and structure variations affect the capillary and capillary numbers across different rocks.44
In Figure 9b, the color could distinguish the oil and surfactant presence after core flooding. The natural surfactant is yellowish. By observation of the images, the surfactant was visible in the narrow and small pores, as seen in the highest magnification.
The observation could explain the reduction in residual oil saturation after surfactant and postflush. This is because the reduction of IFT allows the oil ganglia to break into smaller drops, allowing them to flow more easily and consequently reduce the residual oil saturation.53 The macroscale cannot confirm the surfactant route during injection and oil production. However, the interpretation of Figure 9b inferred the surfactant’s aid in mobilizing the oil trapped in small pores.
The current study continues a known theory on the role of surfactants in providing microscopic displacement by indicating the existence of surfactants in smaller pores and not only the larger voids, which suffices for the hypothesis on microscopic displacement occurrence. This indicates the increase in the number of capillaries and is supported by the substantial amount of recovered oil.
3.7. Numerical Simulation
CEOR modeling is complex due to the chemical interaction, fluid flow geometry, and capillary number changes. Prior to the oil field pilot, it is unavoidable to confirm the core flooding result by appropriate history matching of the flooding data. In an attempt to understand the natural surfactant flooding, numerical simulation software was used to build a 1D model using CMG STARS. The model concept was simplified to a single porosity system, which does not reflect the microscopic scale. As seen in Figure 10, the results achieved during the WF period showed a pattern identical with that of the experiment. However, the numerical model showed an 8% difference during the surfactant flooding. Surprisingly, the model output is less than the experimental results. The modification and tuning process during the surfactant flooding showed that the saturation end point was less than what was reported earlier. However, the tuning result indicates that the relative permeability curve and the pores’ geometry have a significant impact. This impact is high on the numerical output of the recovery during the surfactant and postflush period. In agreement with previous discussions, the limestone cavity reflected significantly on the recovery attained. With this in mind, it is worth noting that the underestimation by the numerical model does not hinder the application. However, it might not be reliable if further upscaling was considered for the field investigations. The study finding aligns with a previous attempt for a nonionic surfactant numerical study in fractured carbonates. The Transfer Function Approach and 2-D were employed to mimic the gravity drainage at different setups of fractures. The result showed that the vertical fracture tremendously affected oil recovery.54 It is worth noting that a previous study, considering the use of computational fluid dynamics for surfactants in carbonate, showed that the simulation results have a relative error of 14.92%. The results discussed that assumptions like uniform porosity and neglecting loss of surfactant due to adsorption on porous media are the main reasons for the error.55
Figure 10.

Comparison of numerical and experimental results.
4. Conclusions
The inherent accessibility of naturally sourced surfactants, rooted in the renewable abundance of plants, fundamentally transforms the landscape of CEOR. Exploring new natural surfactants is a significant leap forward, yet it also unveils the more complex system of physical knowledge that is yet to be conquered. Therefore, the study focuses on the potential of the natural surfactant of flaxseed in Kazakhstan. The natural surfactant extracted through saponification of the flaxseed oil, readily available in the country, can reduce the IFT and increase the oil recovery factor. The natural surfactant contains saponin, which was identified by FTIR and showed the presence of triterpenoid groups. The critical micelle concentration (CMC) for a developed natural surfactant was estimated to be 6 wt % in deionized water (DIW) and 2.5 wt % in seawater salinity. The surfactant demonstrated remarkable interfacial tension reduction at these optimized concentrations, achieving peak reductions of 76.36% in DIW and 48.54% in seawater salinity. These IFT reductions showed that saponin surfactant has the potential to be applicable in enhanced oil recovery. In the conducted core flooding experiments, the application of the natural surfactant resulted in significant enhancement of oil recovery. Precisely, the additional oil recovery achieved was quantified at 26% in the absence of seawater salinity and at an impressive 40% in its presence. These findings underline the demonstrated effectiveness of natural surfactants under varying salinity conditions.
In microscopic images, the evident presence of surfactants within the confines, both small and large pores, elucidates the decline in residual oil saturation after surfactant injection. This supports the theory of surfactants aiding microscopic displacement, proven by their presence in smaller pores alongside larger vugs. In the numerical model, the relative permeability curve and the geometry of pores greatly influenced oil recovery. Despite potential underestimation by the numerical model, it remains applicable. The study’s limitations are notably the need for extensive research to comprehend diverse, fractured matrices and their intricate interactions with physical flows.
Acknowledgments
The authors thank the NU Faculty Development Competitive Research Grants Program (grant no. 20122022FD4137). They also thank Dr. Chonghong Gao for his patience in reviewing the student thesis and Dr. Rizwan Muneer for his assistance.
Glossary
Nomenclature
- CMC
critical miscibility concentration (wt %)
- CMG
computer modeling group
- DIW
deionized water
- EOR
enhanced oil recovery
- FT-IR
Fourier transform infrared spectroscopy
- IFT
interfacial tension (mN/m)
- OOIP
original oil in place
- ppm
particles per million
- PV
pore volume
- RPM
revolutions per minute
- T
temperature (°C)
- WF
water flooding
Glossary
Parameters
- Sor
residual oil saturation
- Sow
residual water saturation
- M
molarity (mol/L)
- μ
viscosity (cP)
- ρ
density (g/cc)
Author Contributions
Y.Z.: Methodology, formal analysis, investigation, writing—original draft. A.S.: Methodology, formal analysis, investigation. G.S.: Software, original draft, review. A.H.A.: Conceptualization, methodology, investigation, supervision, and financial support. P.P.: Review and financial support.
The authors declare no competing financial interest.
References
- Kumar H.; Katal A. Thermodynamic analysis of micelles formation of anionic surfactant SDS in the presence of aqueous and aqueous solution of ionic liquid 1-butyl-3-methylimidazolium chloride. J. Phys. Org. Chem. 2021, 34 (7), e4199 10.1002/poc.4199. [DOI] [Google Scholar]
- Farahani R. K.; Bagheri A. The interaction of the surface active ionic liquid with nonionic surfactants (Triton X-100 and Triton X-405) in aqueous solution by using tensiometry method. J. Mol. Liq. 2022, 345, 118260 10.1016/j.molliq.2021.118260. [DOI] [Google Scholar]
- Sheng J.Modern Chemical Enhanced Oil Recovery: Theory and Practice; Gulf Professional Publishing, 2010. [Google Scholar]
- Massarweh O.; Abushaikha A. S. The use of surfactants in enhanced oil recovery: A review of recent advances. Energy Rep. 2020, 6, 3150–3178. 10.1016/j.egyr.2020.11.009. [DOI] [Google Scholar]; Tavakkoli O.; Kamyab H.; Shariati M.; Mohamed A. M.; Junin R. Effect of nanoparticles on the performance of polymer/surfactant flooding for enhanced oil recovery: A review. Fuel 2022, 312, 122867 10.1016/j.fuel.2021.122867. [DOI] [Google Scholar]
- Olkowska E.; Ruman M.; Polkowska Ż. Occurrence of surface active agents in the environment. J. Anal. Methods Chem. 2014, 2014, 769708 10.1155/2014/769708. [DOI] [PMC free article] [PubMed] [Google Scholar]
- Arab D.; Bryant S. L.; Torsæter O.; Englezos P.; Gopaluni B.; Kantzas A. Elucidation of the mechanistic aspects of chemical EOR in viscous oil systems. J. Pet. Sci. Eng. 2022, 216, 110846 10.1016/j.petrol.2022.110846. [DOI] [Google Scholar]
- Tavakkoli O.; Kamyab H.; Junin R.; Ashokkumar V.; Shariati A.; Mohamed A. M. SDS–aluminum oxide nanofluid for enhanced oil recovery: IFT, adsorption, and oil displacement efficiency. ACS Omega 2022, 7 (16), 14022–14030. 10.1021/acsomega.2c00567. [DOI] [PMC free article] [PubMed] [Google Scholar]
- Kumar A.; Saw R. K.; Mandal A. RSM optimization of oil-in-water microemulsion stabilized by synthesized zwitterionic surfactant and its properties evaluation for application in enhanced oil recovery. Chem. Eng. Res. Des. 2019, 147, 399–411. 10.1016/j.cherd.2019.05.034. [DOI] [Google Scholar]; Pradhan A.; Bhattacharyya A. Quest for an eco-friendly alternative surfactant: Surface and foam characteristics of natural surfactants. J. Cleaner Prod. 2017, 150, 127–134. 10.1016/j.jclepro.2017.03.013. [DOI] [Google Scholar]
- Ghimire Y.; Amatya S.; Shah S. K.; Bhattarai A. Thermodynamic properties and contact angles of CTAB and SDS in acetone–water mixtures at different temperatures. SN Appl. Sci. 2020, 2, 1295 10.1007/s42452-020-3036-1. [DOI] [Google Scholar]
- Kamal M. S. A review of gemini surfactants: potential application in enhanced oil recovery. Surfactants Deterg. 2016, 19 (2), 223–236. 10.1007/s11743-015-1776-5. [DOI] [Google Scholar]
- Azmi N. S. M.; Bakar N. F. A.; Mohd T. A. T.; Azizi A. Molecular dynamics simulation on CO2 foam system with addition of SiO2 nanoparticles at various sodium dodecyl sulfate (SDS) concentrations and elevated temperatures for enhanced oil recovery (EOR) application. Comput. Mater. Sci. 2020, 184, 109937 10.1016/j.commatsci.2020.109937. [DOI] [Google Scholar]; Kamkar A.; Hosseini H.; Norouzi-Apourvari S.; Schaffie M. Insight into the Synergic Effect of Ultrasonic Waves, SDS Surfactant, and Silica Nanoparticles on Wettability Alteration of Carbonate Rocks. Arab. J. Sci. Eng. 2021, 47, 11609–11622. 10.1007/s13369-021-06356-2. [DOI] [Google Scholar]; Ahmadi M. A.; Sheng J. Performance improvement of ionic surfactant flooding in carbonate rock samples by use of nanoparticles. Pet. Sci. 2016, 13, 725–736. 10.1007/s12182-016-0109-2. [DOI] [Google Scholar]
- Charoentanaworakun C.; Srisuriyachai F.; Assabumrungrat S.; Soottitantawat A. Performance and Salinity Tolerance of Palm Oil-Derived Anionic Biosurfactant and Synthetic Surfactant for Waxy Oil Recovery in Sandstone Reservoirs. Energy Fuels 2023, 37 (17), 13191–13201. 10.1021/acs.energyfuels.3c01507. [DOI] [Google Scholar]
- Rai S.; Kafle A.; Devkota H. P.; Bhattarai A. Characterization of saponins from the leaves and stem bark of Jatropha curcas L. for surface-active properties. Heliyon 2023, 9 (5), e15807 10.1016/j.heliyon.2023.e15807. [DOI] [PMC free article] [PubMed] [Google Scholar]; Abbas A. H.; Moslemizadeh A.; Sulaiman W. R. W.; Jaafar M. Z.; Agi A. An insight into a di-chain surfactant adsorption onto sandstone minerals under different salinity-temperature conditions: Chemical EOR applications. Chem. Eng. Res. Des. 2020, 153, 657–665. 10.1016/j.cherd.2019.11.021. [DOI] [Google Scholar]
- Han M.; Ayirala S.; Al-Yousef A. In Review of Offshore Chemical Flooding Field Applications and Lessons Learned, SPE Improved Oil Recovery Conference, 2022.
- Ribeiro B. D.; Alviano D. S.; Barreto D. W.; Coelho M. A. Z. Functional properties of saponins from sisal (Agave sisalana) and juá (Ziziphus joazeiro): Critical micellar concentration, antioxidant and antimicrobial activities. Colloids Surf. A 2013, 436, 736–743. 10.1016/j.colsurfa.2013.08.007. [DOI] [Google Scholar]
- Sabri N.; Moulai-Mostefa N. Formulation and characterization of oil-in-water emulsions stabilized by saponins extracted from Hedera Helix Algeriensis using response surface method. Biointerface Res. Appl. Chem. 2020, 10, 6282–6292. 10.33263/BRIAC105.62826292. [DOI] [Google Scholar]
- Cheok C. Y.; Salman H. A. K.; Sulaiman R. Extraction and quantification of saponins: A review. Food Res. Int. 2014, 59, 16–40. 10.1016/j.foodres.2014.01.057. [DOI] [Google Scholar]
- Chauhan S.; Chauhan M.; Kaushal D.; Syal V.; Jyoti J. Study of micellar behavior of SDS and CTAB in aqueous media containing furosemide—a cardiovascular drug. J. Solution Chem. 2010, 39 (5), 622–638. 10.1007/s10953-010-9534-9. [DOI] [Google Scholar]
- Hama S. M.; Manshad A. K.; Ali J. A. Review of the application of natural surfactants in enhanced oil recovery: State-of-the-art and perspectives. Energy Fuels 2023, 37 (14), 10061–10086. 10.1021/acs.energyfuels.3c01347. [DOI] [Google Scholar]; Adenutsi C. D.; Turkson J. N.; Wang L.; Zhao G.; Zhang T.; Quaye J. A.; Erzuah S.; Sokama-Neuyam Y. A. Review on Potential Application of Saponin-Based Natural Surfactants for Green Chemical Enhanced Oil Recovery: Perspectives and Progresses. Energy Fuels 2023, 37, 8781–8823. 10.1021/acs.energyfuels.3c00627. [DOI] [Google Scholar]
- Yekeen N.; Malik A. A.; Idris A. K.; Reepei N. I.; Ganie K. Foaming properties, wettability alteration and interfacial tension reduction by saponin extracted from soapnut (Sapindus Mukorossi) at room and reservoir conditions. J. Pet. Sci. Eng. 2020, 195, 107591 10.1016/j.petrol.2020.107591. [DOI] [PMC free article] [PubMed] [Google Scholar]; Yusuf M.; Wathon M. H.; Thanasaksukthawee V.; Saul A.; Tangparitkul S. Adsorption of saponin natural surfactant on carbonate rock and comparison to synthetic surfactants: an enhanced oil recovery prospective. Energy Fuels 2021, 35 (14), 11193–11202. 10.1021/acs.energyfuels.1c00721. [DOI] [Google Scholar]
- Mehrjoo H.; Riazi M.; Norouzi-Apourvari S. A comprehensive review on the use of eco-friendly surfactants in oil industry. Chem. Methods 2022, 357–399. 10.1016/B978-0-12-821931-7.00009-2. [DOI] [Google Scholar]
- Eslahati M.; Mehrabianfar P.; Isari A. A.; Bahraminejad H.; Manshad A. K.; Keshavarz A. Experimental investigation of Alfalfa natural surfactant and synergistic effects of Ca2+, Mg2+, and SO42– ions for EOR applications: interfacial tension optimization, wettability alteration and imbibition studies. J. Mol. Liq. 2020, 310, 113123 10.1016/j.molliq.2020.113123. [DOI] [Google Scholar]
- Alamier W. M.; Tasneem S.; Nabi A.; Hasan N.; Nabi F. Thermodynamic and Spectroscopic Studies of SDS in Cinnamaldehyde+ Ethanol Mixtures: Influences of Temperature and Composition. Appl. Sci. 2022, 12 (23), 12020 10.3390/app122312020. [DOI] [Google Scholar]
- Abbas A. H.; Abd Alsaheb R. A.; Abdullah J. K. Comparative study of natural chemical for enhanced oil recovery: Focus on extraction and adsorption at quartz sand surface. Petroleum 2023, 1, 83–93. 10.1016/j.petlm.2022.01.007. [DOI] [Google Scholar]
- Bao Y.; Guo J.; Ma J.; Liu P.; Kang Q.; Zhang J. Cationic silicon-based gemini surfactants: Effect of hydrophobic chains on surface activity, physic-chemical properties and aggregation behaviors. J. Ind. Eng. Chem. 2017, 53, 51–61. 10.1016/j.jiec.2017.03.045. [DOI] [Google Scholar]
- El-Dossoki F. I.; Gomaa E. A.; Hamza O. K. Solvation thermodynamic parameters for sodium dodecyl sulfate (SDS) and sodium lauryl ether sulfate (SLES) surfactants in aqueous and alcoholic-aqueous solvents. SN Appl. Sci. 2019, 1, 933 10.1007/s42452-019-0974-6. [DOI] [Google Scholar]
- Schreiner T. B.; Colucci G.; Santamaria-Echart A.; Fernandes I. P.; Dias M. M.; Pinho S. P.; Barreiro M. F. Evaluation of saponin-rich extracts as natural alternative emulsifiers: A comparative study with pure Quillaja Bark saponin. Colloids Surf., A 2021, 623, 126748 10.1016/j.colsurfa.2021.126748. [DOI] [Google Scholar]
- Friedmann F. Surfactant and polymer losses during flow through porous media. SPE Reserv. Eng. 1986, 1 (03), 261–271. 10.2118/11779-PA. [DOI] [Google Scholar]
- Pola J.; Geiger S.; Mackay E.; Maier C.; Al-Rudaini A. In Numerical Simulations of Surfactant Flooding in Carbonate Reservoirs: The Impact of Geological Heterogeneities Across Scales, SPE Europec featured at EAGE Conference and Exhibition, 2021.
- Dashtaki S. R. M.; Ali J. A.; Manshad A. K.; Nowrouzi I.; Mohammadi A. H.; Keshavarz A. Experimental investigation of the effect of Vitagnus plant extract on enhanced oil recovery process using interfacial tension (IFT) reduction and wettability alteration mechanisms. J. Pet. Explor. Prod. Technol. 2020, 10, 2895–2905. 10.1007/s13202-020-00966-6. [DOI] [Google Scholar]
- Magham S. K.; Ali J. A.; Khaksar Manshad A.; Jaf P. T.; Hisqel B. S. Investigation of the Passiflora Plant as a Promising Natural Surfactant for Enhanced Oil Recovery: Insights into Crude Oil–Water–Rock Interaction. Energy Fuels 2023, 37 (16), 11881–11892. 10.1021/acs.energyfuels.3c02179. [DOI] [Google Scholar]
- Dashtaki S. R. M.; Ali J. A.; Majeed B.; Manshad A. K.; Nowrouzi I.; Iglauer S.; Keshavarz A. Evaluation the role of natural surfactants from Tanacetum and Tarragon plants in EOR applications. J. Mol. Liq. 2022, 361, 119576 10.1016/j.molliq.2022.119576. [DOI] [Google Scholar]
- Singh A.; Sharma T.; Kumar R. S.; Arif M. Biosurfactant Derived from Fenugreek Seeds and Its Impact on Wettability Alteration, Oil Recovery, and Effluent Treatment of a Rock System of Mixed Composition. Energy Fuels 2023, 37 (9), 6683–6696. 10.1021/acs.energyfuels.3c00105. [DOI] [Google Scholar]
- Obuebite A.; Onyekonwu M.; Akaranta O.; Ubani C.; Uzoho C. An experimental approach to low cost, high-performance surfactant flooding. Sci. Afr. 2020, 8, e00361 10.1016/j.sciaf.2020.e00361. [DOI] [Google Scholar]
- Navaie F.; Esmaeilnezhad E.; Choi H. J. Xanthan gum-added natural surfactant solution of Chuback: A green and clean technique for enhanced oil recovery. J. Mol. Liq. 2022, 354, 118909 10.1016/j.molliq.2022.118909. [DOI] [Google Scholar]
- Norouzpour M.; Nabipour M.; Azdarpour A.; Akhondzadeh H.; Santos R. M.; Keshavarz A. Experimental investigation of the effect of a quinoa-derived saponin-based green natural surfactant on enhanced oil recovery. Fuel 2022, 318, 123652 10.1016/j.fuel.2022.123652. [DOI] [Google Scholar]
- Daghbandan A.; Shahrabadi A.; Arabiyoun M. Adsorption of Glycyrrhiza glabra natural nonionic surfactant onto the carbonate reservoir rock in the presence of SiO2 nanoparticles surface: Towards enhanced oil recovery. J. Environ. Chem. Eng. 2022, 10 (1), 107109 10.1016/j.jece.2021.107109. [DOI] [Google Scholar]
- Satter A.; Iqbal G. M.. Enhanced Oil Recovery Processes: Thermal, Chemical, and Miscible Floods. In Reservoir Engineering; Elsevier B.V., 2016; pp 313–337. [Google Scholar]; Abbas A. H.; Ajunwa O. M.; Mazhit B.; Martyushev D. A.; Bou-Hamdan K. F.; Alsaheb R. A. A. Evaluation of OKRA (Abelmoschus esculentus) macromolecular solution for enhanced oil recovery in Kazakhstan carbonate reservoir. Energies 2022, 15 (18), 6827. 10.3390/en15186827. [DOI] [Google Scholar]
- Abbas A. H.; Elhag H. H.; Sulaiman W. R. W.; Gbadamosi A.; Pourafshary P.; Ebrahimi S. S.; Alqohaly O. Y.; Agi A. Modelling of continuous surfactant flooding application for marginal oilfields: a case study of Bentiu reservoir. J. Pet. Explor. Prod. 2021, 11 (2), 989–1006. 10.1007/s13202-020-01077-y. [DOI] [Google Scholar]; Elhag H. H.; Abbas A. H.; Gbadamosi A.; Agi A.; Oseh J.; Gbonhinbor J. In Evaluation of Continuous Surfactant Flooding in North East Africa: Case Study of Bentiu Reservoir, SPE Nigeria Annual International Conference and Exhibition, 2020.
- Sheng J. J. In A Comprehensive Review of Alkaline-Surfactant-Polymer (ASP) Flooding, SPE Western Regional & AAPG Pacific Section Meeting Joint Technical Conference, 2013.
- Winnik M. A.; Bystryak S. M.; Chassenieux C.; Strashko V.; Macdonald P. M.; Siddiqui J. Study of interaction of poly (ethylene imine) with sodium dodecyl sulfate in aqueous solution by light scattering, conductometry, NMR, and microcalorimetry. Langmuir 2000, 16 (10), 4495–4510. 10.1021/la991553u. [DOI] [Google Scholar]
- Zhang H.; Xu J.; Wang M.; Xia X.; Dai R.; Zhao Y. Steroidal saponins and sapogenins from fenugreek and their inhibitory activity against α-glucosidase. Steroids 2020, 161, 108690 10.1016/j.steroids.2020.108690. [DOI] [PubMed] [Google Scholar]
- Kamal M. S. A review of gemini surfactants: potential application in enhanced oil recovery. J. Surfactants Deterg. 2016, 19 (2), 223–236. 10.1007/s11743-015-1776-5. [DOI] [Google Scholar]
- Melrose J. C. Role of capillary forces in determining microscopic displacement efficiency for oil recovery by waterflooding. J. Can. Pet. Technol. 1974, 13, 374013 10.2118/74-04-05. [DOI] [Google Scholar]
- Dashtaki S. R. M.; Ali J. A.; Majeed B.; Manshad A. K.; Nowrouzi I.; Iglauer S.; Keshavarz A. Evaluation the role of natural surfactants from Tanacetum and Tarragon plants in EOR applications. J. Mol. Liq. 2022, 361, 119576 10.1016/j.molliq.2022.119576. [DOI] [Google Scholar]
- Yu K.; Li B.; Wang Z.; Zhang W.; Wang D.; Xu H.; Wang J.; Harbottle D. Synergy between composite nanoparticles and saponin β-escin to produce long-lasting foams. Ind. Eng. Chem. Res. 2020, 59 (16), 7495–7501. 10.1021/acs.iecr.9b06355. [DOI] [Google Scholar]
- Abbas A. H.; Sulaiman W. R. W.; Jaafar M. Z.; Aja A. A. Micelle Formation of Aerosol-OT Surfactants in Sea Water Salinity. Arab. J. Sci. Eng. 2017, 43, 2515–2519. 10.1007/s13369-017-2593-0. [DOI] [Google Scholar]
- Hassan A. M.; Al-Shalabi E. W.; Ayoub M. A. Updated perceptions on polymer-based enhanced oil recovery toward high-temperature high-salinity tolerance for successful field applications in carbonate reservoirs. Polymers 2022, 14 (10), 2001. 10.3390/polym14102001. [DOI] [PMC free article] [PubMed] [Google Scholar]
- Salehi M.; Johnson S. J.; Liang J.-T. Mechanistic study of wettability alteration using surfactants with applications in naturally fractured reservoirs. Langmuir 2008, 24 (24), 14099–14107. 10.1021/la802464u. [DOI] [PubMed] [Google Scholar]
- Fabbri C.; Romero C.; Aubertin F.; Nguyen M.; Hourcq S.; Hamon G. In Secondary Polymer Flooding in Extra-Heavy Oil: Gaining Information on Polymer-Oil Relative Permeabilities, SPE Asia Pacific Enhanced Oil Recovery Conference, 2013.
- Zhu G.; Xu L. K.; Wang X.; Liu F.; Cong Y.; Zhang Y.; Ou J. In Enhanced Oil Recovery by Seawater Flooding in Halfaya Carbonate Reservoir, Iraq: Experiment and Simulation, SPE EOR Conference at Oil and Gas West Asia, 2016.
- Mohan K. In Alkaline Surfactant Flooding for Tight Carbonate Reservoirs, SPE Annual Technical Conference and Exhibition, 2009.; Hou J.; Luo M.; Zhu D. Foam-EOR method in fractured-vuggy carbonate reservoirs: Mechanism analysis and injection parameter study. J. Pet. Sci. Eng. 2018, 164, 546–558. 10.1016/j.petrol.2018.01.057. [DOI] [Google Scholar]
- Yang W.; Lu J.; Wei B.; Yu H.; Liang T. Micromodel studies of surfactant flooding for enhanced oil recovery: a review. ACS Omega 2021, 6 (9), 6064–6069. 10.1021/acsomega.0c05750. [DOI] [PMC free article] [PubMed] [Google Scholar]
- Alamdari B. B.; Kiani M.; Kazemi H. In Experimental and Numerical Simulation of Surfactant-Assisted Oil Recovery in Tight Fractured Carbonate Reservoir Cores, SPE Improved Oil Recovery Conference, 2012.
- Nandwani S. K.; Chakraborty M.; Gupta S. Chemical flooding with ionic liquid and nonionic surfactant mixture in artificially prepared carbonate cores: a diffusion controlled CFD simulation. J. Pet. Sci. Eng. 2019, 173, 835–843. 10.1016/j.petrol.2018.10.083. [DOI] [Google Scholar]