

Abstract

The design and development of new small-molecule glycation inhibitors are essential for preventing various chronic diseases, including diabetes mellitus, immunoinflammation, cardiovascular, and neurodegenerative diseases. 4-Thiazolidinone or thiazolidine-4-one is a well-known heterocyclic compound with the potential to inhibit the formation of advanced glycation end products. In the present work, we report the synthesis and characterization of four new 5-arylidene 3-cyclopropyl-2-(phenylimino)thiazolidin-4-one (1–4) compounds and their human serum albumin glycation inhibitory activity. One of the compounds 5-(2H-1,3-benzodioxol-5-ylmethylidene)-3-cyclopropyl-2-(phenylimino)-1,3-thiazolidin-4-one (3) showed potent inhibition in the synthesis of initial, intermediary, and final products of glycation reactions. Besides, conformational changes in the α-helix and β-sheet (due to hyperglycemia) were also found to be reversed upon the addition of (3). Experimental findings were complemented by computational [molecular docking, ADME/Tox, and density functional theory (DFT)] studies. The docking scores of the compounds were in order 1 > 3 > 2 > 4, indicating the importance of the polar group at the 5-arylidene moiety. The results of ADME/Tox and DFT calculations revealed the safe nature of the compounds with high drug-likeness and stability. Overall, we speculate that the results of this study could provide valuable insights into the biological activity of 4-thiazolidinones.
1. Introduction
Maillard, or the glycation reaction, is a spontaneous nonenzymatic reaction between nonreducing sugars and amine-containing compounds.1 This reaction is a part of normal human physiology in which an amino acid/protein reacts with sugar; however, it becomes detrimental when it occurs inside a human body over an extended time period.2 Especially under abnormal physiological conditions (e.g., diabetes mellitus, pancreatic cancer, and chronic diseases), the glycation reaction is significantly altered and uncontrolled. Such accelerated glycation reactions lead to the formation of various initial (ketoamines), intermediary (carbonyl and dicarbonyl compounds), and final end products, which are known as advanced glycation end products (AGEs).1 These irreversibly formed glycated products directly affect the pancreatic cells, leading to their malfunction and death.3 Furthermore, the interaction of AGEs with the receptor for AGEs (RAGE) activates signal transduction, leads to oxidative stress in cells and their dysfunction, and may cause organ damage.2 AGEs can be formed via the glycation reaction of long-lived proteins, which are available as substrates for a longer duration. However, these processes may expedite under oxidative stress, affecting other biomolecules (proteins, hormones, and enzymes).2 All these events may contribute to the development of diabetic complications and strong relations in the pathogenesis of other diseases such as Alzheimer’s disease, Parkinson’s disease, cardiovascular disorders, kidney dysfunction, hepatic fibrosis, and cancers.4
Extensive research has been conducted to identify inhibitors that can halt or inhibit glycation or their end products.5,6 A huge effort has been made to discover natural product-based antiglycation agents.7 Although several extracts have shown appreciable inhibitory activity, their purity, tedious separation, and challenging structural characterization remain daunting. Moreover, as evident from many reports, researchers failed to identify the exact component responsible for glycation inhibition. To overcome these challenges, synthetic compounds such as Schiff bases,8 oxindole,9 benzimidazole,10 thiazole,11 oxadiazole derivatives,12 and others13 have been reported with antiglycative inhibitors. Among a large pool of heterocyclic compounds, N-, O-, and S-containing thiazolidinone frameworks are quite popular in diabetic research. In fact, glitazones and epalrestat, used for treating diabetes-related complications, are based on a thiazolidine-2,4-dione core. These drugs are known to impart activity by insulin sensitization via peroxisome-proliferated activated receptor activation, reducing oxidative stress and conserving islet β-cell function. Despite their high popularity, the use of thiazolidine-2,4-dione is severely limited due to poor selectivity, hepatotoxicity, and carcinogenicity.14 Among others, one possible way to overcome these limitations is to use a similar core. Thiazolidin-4-one fits well into this criterion.6,15 Despite the fact that thiazolidin-4-one-based compounds have been reported to inhibit the formation of AGEs,16 limited research has been carried out. Intrigued by this, herein, we present the synthesis and characterization of four new 4-thiazolidinone derivatives (1–4) and the study of their human serum albumin (HSA) glycation inhibitory activity. In silico molecular docking, absorption, distribution, metabolism, excretion, and toxicity (ADMET), and density functional theory (DFT) studies were carried out to compare HSA binding affinity, identify sites, and assess the toxicity of the compounds.
2. Materials and Methods
2.1. General Procedures
All reagents and solvents were obtained from Sigma-Aldrich and used as received. Thin-layer chromatography was performed on silica gel-coated aluminum sheets (Merck, Germany). Infrared (IR) spectra were recorded using the KBr pellet technique on a PerkinElmer (1600 FT-IR RX1) spectrophotometer. 1H- and 13C-nuclear magnetic resonance (NMR) spectra were collected on a Bruker Spectrospin DPX 300 MHz spectrometer. The chemical shift values were recorded on d scale (expressed in ppm) and the coupling constants (J) in Hertz. Tetramethylsilane was used as an internal standard. The following abbreviations were used in reporting spectra: s = singlet, d = doublet, dd = double doublet, and m = multiplet. The mass spectra of the compounds were recorded on a microTOF-Q II 10330.
2.2. General Protocol for the Synthesis of 4-Thiazolidinone Derivatives (1–4)
4-Thiazolidinone derivatives (1–4) used in this study were synthesized following the protocol available in the literature and depicted in Scheme 1. Intermediate compounds [1-cyclopropyl-3-phenyl thiourea and 4-thiazolidinone core, i.e., 3-cyclopropyl-2-(phenylimino) thiazolidin-4-one] were obtained following the reported method.17 Final compounds (1–4) were prepared as follows. In a round-bottom flask, 3-cyclopropyl-2-(phenylimino)-thiazolidin-4-one (1.0 mmol) was dissolved in absolute ethanol (50 mL). After this, piperidine (1.15 mmol) was added to the reaction mixture. Following this, 1.0 mmol of different aldehydes (Ar–CHO) was added to the mixture, and the mixture was refluxed for 10–12 h. The progress of the reaction was monitored by thin-layer chromatography in 5% ethyl acetate and hexane. After the completion of the reaction, a yellow precipitate was formed, which was filtered off. The obtained crude product was recrystallized in chloroform and methanol (1:1). The chemical composition of the compounds was determined by multiple spectroscopic techniques (vide infra).
Scheme 1. Synthesis of 4-Thiazolidinone Derivatives.
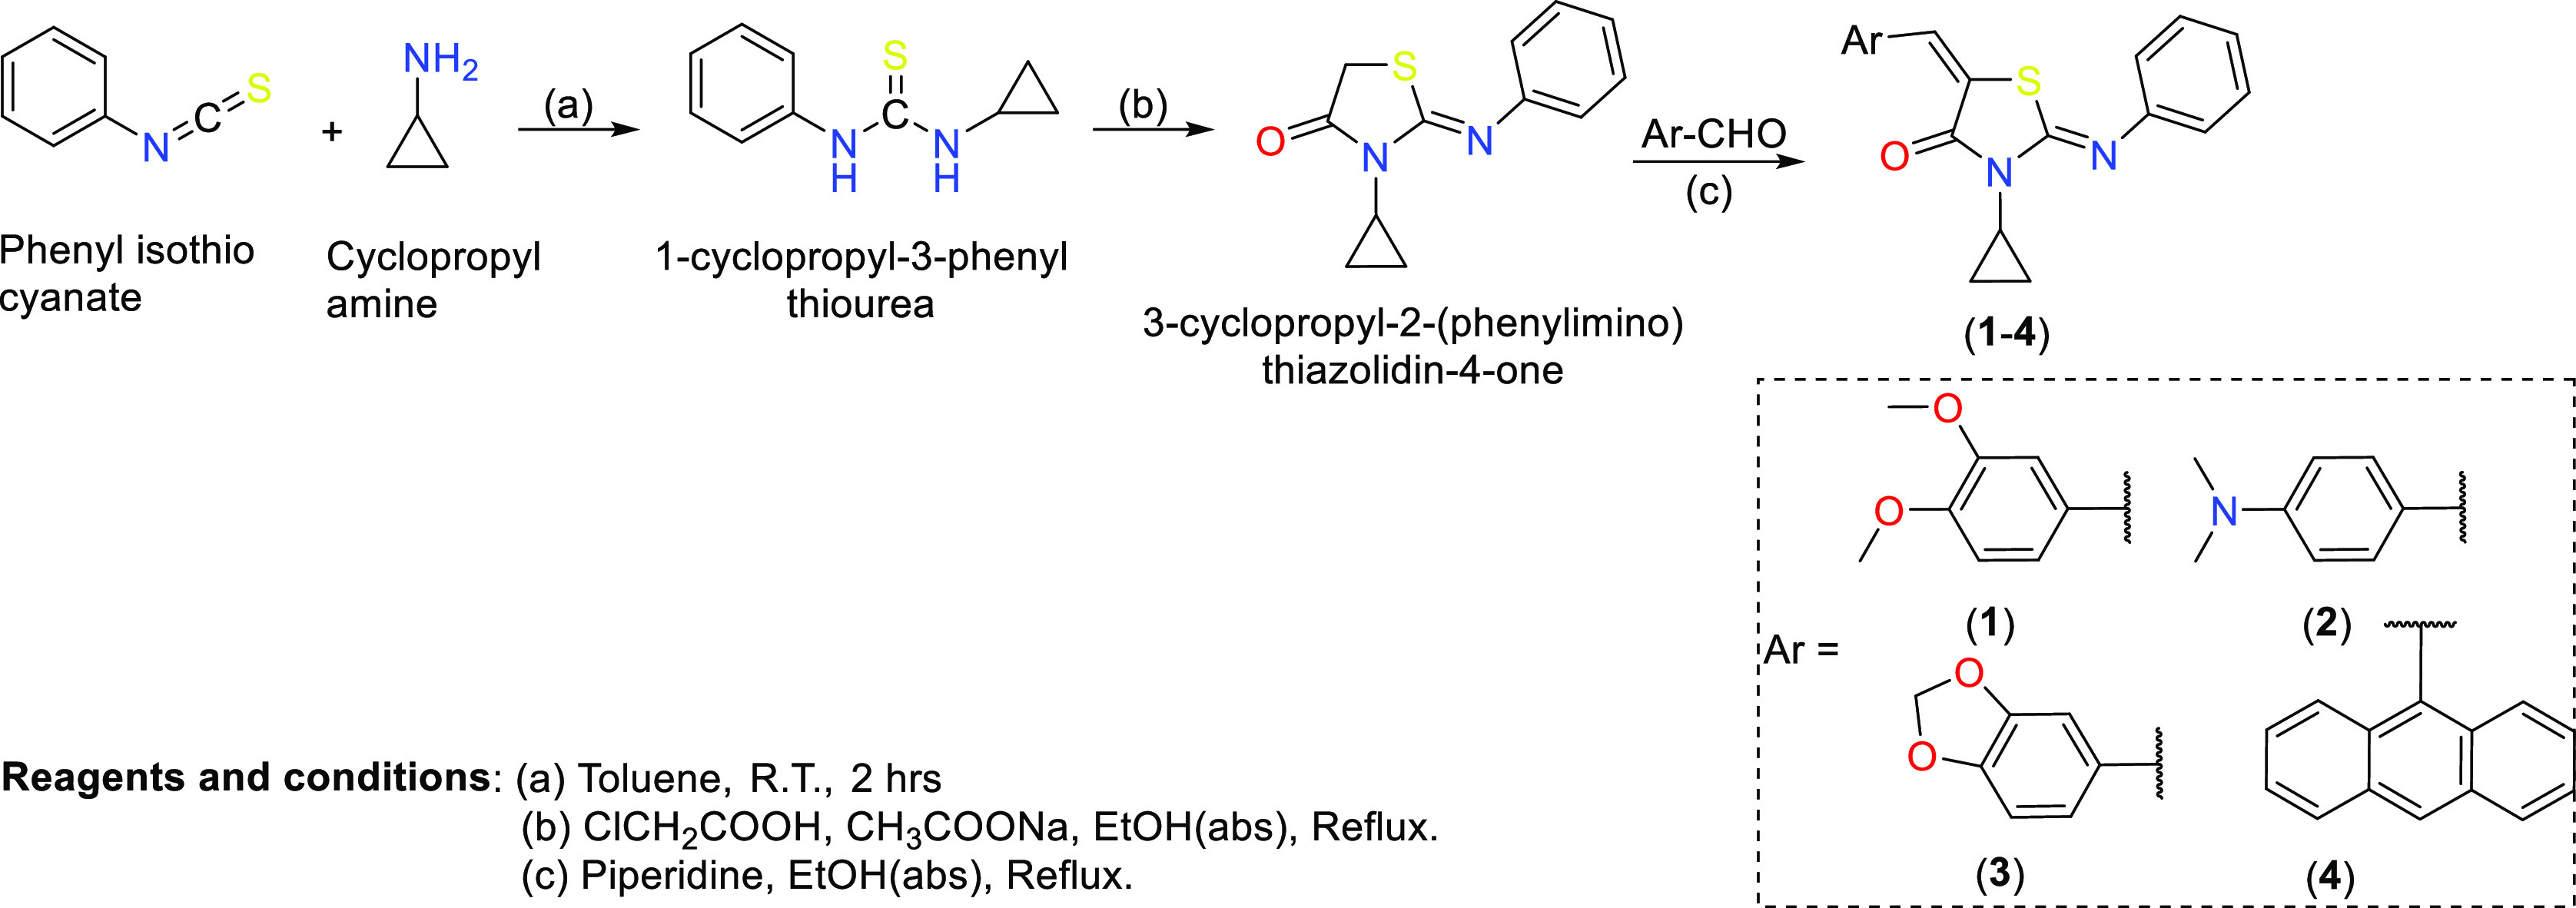
2.2.1. 3-Cyclopropyl-5-[(2,5-dimethoxyphenyl)methylidene]-2-(phenylimino)-1,3-thiazolidin-4-one (1)
Yield: 72%; IR νmax (cm–1): 3025.9 (Ar–H), 1715.2 (–C=O), 1624.2 (C=N), 1548.1 (–C=C−); 1H NMR (CDCl3): δ (ppm): 8.05 (s, 1H, H–C=C−), 7.39 (t, 2H, J = 8.0 Hz, Ar–H), 7.17 (t, 1H, J = 7.0 Hz, Ar–H), 6.99 (d, 2H, J = 7.5 Hz, Ar–H), 6.67–6.63 (m, 3H, Ar–H), 3.79 (s, 3H, OCH3), 3.69 (s, 3H, OCH3), 2.92–2.87 (m, 1H, cyclopropyl, –CH–), 1.09–0.98 (m, 4H, cyclopropyl, –CH2–); 13C NMR (CDCl3): δ (ppm): 167.1 (–C=O), 148.6 (–C=C–), 153.5, 152.8, 151.6, 134.9, 129.3, 125.92, 124.8, 123.9, 121.9, 121.1, 115.7, 114.7, 111.9 (aromatic), 56.1 (OCH3), 56.1 (OCH3), 34.8 (CH-cyclopropyl), 25.9 (CH2–, cyclopropyl). Calculated mass: 380.46; observed mass (m/z): 381.0 [M + H]+, 382.0.0 [M + 2H]+ and 383.0 [M + 3H]+.
2.2.2. 2-Cyclopropyl-5[4-(dimethylamino)phenyl]methylidene-2-(phenylimino)-1,3-thiazolidin-4-one (2)
Yield: 80%; IR νmax (cm–1): 3065.8 (Ar–H), 1706.0 (–C=O), 1583.45 (C=N), 1508.0 (–C=C–); 1H NMR (CDCl3): δ (ppm): 7.64 (s, 1H, H–C=C−), 7.40 (t, 2H, J = 7.5 Hz, Ar–H), 7.33 (d, 2H, J = 5.4 Hz, Ar–H), 7.20 (t, 1H, J = 7.2 Hz, Ar–H), 7.03 (d, 2H, J = 4.5 Hz, Ar–H), 6.65 (d, 2H, J = 5.4 Hz, Ar–H), 2.99 (s, 6H, N,N dimethyl), 2.92–2.85 (m, 1H, –CH–), 1.09–0.81 (m, 4H, cyclopropyl protons); 13C NMR (CDCl3): δ (ppm): 167.8 (–C=O), 149.1, (C=C–), 152.4, 135.3, 132.1, 129.6, 128.9, 124.6, 121.4, 114.8, 112.0 (aromatics), 40.1 (–N(CH3)2), 34.8 (−CH-cyclopropyl), 25.7 (cyclopropyl). Calculated mass = 363.48 observed mass (m/z): 364.0 [M + H]+, 365.0 [M + 2H]+ and 366.0 [M + 3H]+.
2.2.3. 5-(2H-1,3-Benzodioxol-5-ylmethylidene)-3-cyclopropyl-2-(phenylimino)-1,3-thiazolidin-4-one (3)
Yield: 75%; IR νmax (cm–1): 3020.3 (Ar–H), 1714.6 (N–C=O), 1639.7 (C=N), 1592.3 (–C=C–); 1H NMR (CDCl3) δ (ppm): 7.59 (s, 1H, H–C=C), 7.40 (t, 2H, J = 7.5 Hz, Ar–H), 7.20 (t, 1H, J = 7.5 Hz, Ar–H), 7.00–6.88 (m, 4H, Ar–H), 6.81 (d, 1H, J = 8.5 Hz, Ar–H), 5.97 (s, 2H, CH2-piperonal ring), 2.92–2.79 (m, 1H,–CH–), 1.17–1.06 (m, 4H, cyclopropyl ring proton); 167.3 (–C=O), 148.7(–C=C−), 151.3, 135.0, 130.6, 129.9128.5, 126.0, 124.8, 121.4, 116.1, 108.9, 101.8 (aromatics) 34.9, (cyclopropyl, –CH–), 25.9 (cyclopropyl–CH2–); Calculated mass 364.41; observed mass (m/z): 364.42; observed mass 364.0 [M]+ and 365.0 [M + H]+.
2.2.4. 5-(Anthracen-9-ylmethylidene)-3-cyclopropyl-2-(phenylimino)-1,3-thiazolidin-4-one (4)
Yield: 73%; IR νmax (cm–1): 3013.1 (Ar–H), 1718.1 (C=O), 1621.5 (–C=N), 1587.9 (–C=C−); 1H NMR (CDCl3): δ (ppm): 8.67 (s, 1H, anthracene), 8.43 (s, 1H, H–C=C−), 8.00–7.95 (m, 4H, anthracene), 7.51–7.46 (m, 4H, anthracene), 7.20 (t, 2H, J = 7.5 Hz, Ar–H), 7.00 (t, 1H, J = 7.5 Hz, Ar–H), 6.84 (d, 2H, J = 7.5 Hz, Ar–H); 13C NMR (CDCl3): δ (ppm): 165.9 (–C=O), 148.3 (–C=C, alkene), 151.2, 135.3, 131.2, 130.4, 129.3, 129.1, 128.7, 127.9, 126.6, 125.7, 124.7, 123.6, 120.9 (aromatics), 53.5 (−CH–N), 26.2 (–CH2-cyclopropyl carbon); calculated mass: 420.525; observed mass (m/z): 421.0 [M + H]+, 422.0 [M + 2H]+, and 423.0 [M + 3H]+.
2.3. Glycation of HSA Proteins
Normal HSA (N-HSA) was converted to glycated HSA (G-HSA) by treating 15.15 μM HSA in 20 mM phosphate-buffered saline (PBS, pH 7.4) with 0.05 M d-glucose (passed through a 0.2 μm filter). The resulting mixture was incubated at 37 °C for the next 10 weeks under strict sterile conditions. Compounds 1–4 (0.78–400 μg/mL) were added to this reaction mixture. HSA without glucose served as the control. After incubation, samples were extensively dialyzed against PBS and stored at −20 °C before use. The HSA concentration was measured using Nanodrop.
2.4. Ultraviolet Absorption Spectroscopy
The ultraviolet absorption spectra of native and modified HSA samples were analyzed in the wavelength range 260–360 nm on a spectrophotometer (UV-1700, Shimadzu, Kyoto, Japan) using a cuvette of 1 cm path length. G-HSA was added with different compounds (1–4) at varying concentrations (0.078–400 μg/mL). Each sample was run in triplicate, and the mean ± SD values were given in the data.
2.5. Fluorescence Spectroscopy
2.5.1. Tryptophan-Specific Fluorescence
Protein samples were analyzed by measuring tryptophan-specific fluorescence on a spectrofluorometer (RF-5301, Shimadzu, Tokyo, Japan). To study the cumulative effect of tryptophan, the samples were excited at 285 nm, and the emissions were measured over 290–430 nm.18a Compounds (1–4) at a 200 μg/mL concentration were added to the glycation reactions, incubated for a similar period, and analyzed with N-HSA and G-HSA samples. The concentration of protein samples was taken as 100 μM.
2.5.2. Pentosidine-Specific Fluorescence
The fluorometric analysis of the AGE pentosidine was performed at an excitation wavelength of 375 nm. The pentosidine-specific peak was observed in the 300–400 nm range. Excitation and emission slit widths were 10 nm. All protein solutions were of the same concentration (60 μM). Different compounds (1–4) at a concentration of 200 μg/mL were mixed with the glycation reaction to detect their inhibitory effect on the formation of the AGE pentosidine.
2.6. Circular Dichroism Study
Circular dichroism (CD) of native and modified HSA and G-HSA with compounds (1–3) was measured in a JASCO J-810 spectropolarimeter attached to a thermally controlled sample cell holder. Samples were analyzed with a scan speed of 20 nm/min and a response time of 1 s. Each spectrum was the average of 2 scans. Measurements in the 200–350 nm range were taken using a protein concentration of 2.2 μM with a 1 mm path length cell. For each sample, the buffer was used as a blank. The results were expressed as mean residual electricity (MRE) and expressed in deg·cm2·dmol–1, which is defined as
where θobs is the CD in millidegrees, n is the number of amino acid residues, l is the path length of the cell, and Cp is the mole fraction. The relative percentages of the secondary structure elements present were estimated using the Yang equation.18b
2.7. Ketoamine Estimation by Nitroblue Tetrazolium
Samples were quantified by a published colorimetric procedure using nitroblue tetrazolium (NBT) with a slight modification.19 Bovine serum albumin (BSA) (10 mg/mL) was incubated with 0.5 M glucose for 2 weeks at 37 °C in 20 mM PBS. The treatment resulted in extensive glycation of proteins with the subsequent formation of ketoamines.20 In a 96-well microtiter plate, 50 μL of samples was added, and after that, 100 μL of NBT reagent (250 μM in 0.1 M carbonate buffer, pH 10.35) was added to each well and kept for 2 h at 37 °C. A microplate reader recorded the color developed at 550 nm. A standard curve of glycated BSA was used to calculate the amount of ketoamine in each sample.
2.8. Determination of Protein-Bound Carbonyl Groups
Levine et al.21 published a well-established procedure for estimating protein-bound carbonyl groups. Briefly, a protein sample (200 μL; 0.1 mg of protein) was mixed with an amount of 400 μL from 7 mM dinitrophenyl hydrazine (DNPH) solution prepared in 2 M HCl. Samples of proteins without DNPH served as the control. The reaction mixture was incubated for 1 h at room temperature, and then, 500 μL of trichloroacetic acid (4% w/v) was added, causing precipitation. The precipitate was centrifuged for 5 min at 14,000g. The supernatant was removed, and ethanol/ethyl acetate (1:1, v/v) was added to the pellet and centrifuged. After 3–4 washes, unwanted DNPH was removed. Then, 0.6 mL of a 6 M guanidinium hydrochloride solution (20 mM phosphate buffer; pH 2.3) was added to the pellet. Freezing overnight at −20 °C followed by thawing dissolved hydrazones completely. The samples (200 μL) were recorded in a microplate reader at 379 nm. The results were evaluated as moles of carbonyl per mole of HSA using an ε379 nm = 22,000 M–1 cm–1.
2.9. Computational Details
Molecular docking was performed using the Schrödinger software with the Glide module with default settings.22 The pharmacokinetic profile (ADMET) of the compounds was determined using the Qikprop module of Schrödinger.23 The SMILE format of the ligands was generated using Marvin 21.18.0, 2021, ChemAxon (http://www.chemaxon.com). The crystal structure of the HSA protein (PDB: 1AO6) was downloaded from the protein data bank (http://www.rcsb.org) and prepared using the Glide module of the Schrödinger suite. Preparation includes the removal of water molecules/heteroatoms and the assignment of protonation states. Tautomeric forms of amino acid residues were considered to ensure their physiological relevance. The energy minimization was carried out using Schrödinger’s Protein Preparation Wizard, addressing steric clashes and optimizing geometry. For ligands, the LigPrep wizard was utilized for structure minimization and optimization. A docking grid was generated to cover the pertinent binding site on the protein. The results were analyzed, taking into account the binding energy, interaction patterns, and ligand pose. The identification of top-scoring complexes was a crucial aspect of the analysis.24 DFT calculations were performed using the B3LYP/6-31G* basis set in the gas phase by Spartan’20 software (Wave function Inc.). All calculations (docking, result visualization, quantum chemical calculations, and ADMET predictions) followed our previously published protocol.25
3. Results and Discussion
3.1. Synthesis and Characterization
The targeted series of four new 5-arylidene 3-cyclopropyl-2-(phenylimino)thiazolidin-4-one (1–4) compounds were synthesized following the reported protocols. All the synthesized compounds obtained were light to dark yellow solids and stable at room temperature. These compounds were characterized by IR spectroscopy, 1H/13C NMR spectroscopy, and high-resolution mass spectrometry (Figures S1–S12, supplementary file).
3.2. HSA Antiglycation Studies
HSA is one of the most important carrier proteins in human blood and is known for its high ligand (drugs) binding capacity.26 Under hyperglycemic conditions, this protein undergoes structural and conformational changes, leading to abnormalities/diseases. It has been suggested from previous studies that glycation causes protein aggregation, and protein albumin, upon glycation, forms dimers and multimers.27,28 These dimers and multimers may be formed due to intramolecular cross-links such as dialkyl-dihydro pyrazine lysine–lysine cross-links.27 Thus, G-HSA showed a decrease in UV–vis intensity compared to that of the native HSA (N-HSA). In this study, we monitored the level of HSA glycation in the presence and absence of compounds (compounds 1–4) using UV–vis spectroscopy (Figure 1). Since the glycation of a biomolecule depends on the sugar concentration, HSA was incubated with varying levels of compounds. Concentrations of 0.78–400 μg/mL were used for each compound in the glycation reactions. The native protein (N-HSA, 0.242 ± 0.0078) and glycated protein (G-HSA, 0.132 ± 0.0051) showed significant differences (p < 0.01) in the absorbance intensities at 280 nm. There is a significant (p < 0.01) change in UV intensity in the glycation reaction with compounds 3 (0.179 ± 0.0063) at a concentration of 400 μg/mL compared to that of the G-HSA sample without compounds (Figure 1C). This inhibition was decreased with a decrease in inhibitor 3 concentrations. However, there is no significant difference in inhibition of the glycation reactions between the 200 μg/mL (0.177 ± 0.0058) and 400 μg/mL concentrations. Compound 1 showed a maximum change in UV intensity (0.161 ± 0.0057) at a concentration of 400 μg/mL followed by a slight decrease in UV intensity (0.158 ± 0.0048) at 200 μg/mL (Figure 1A). Conversely, for compound 2, the maximum UV intensity (0.155 ± 0.0063) was observed at a 200 μg/mL concentration. The concentrations 100 μg/mL (0.151 ± 0.0050) and 400 μg/mL (0.153 ± 0.0047) of 2 compounds did not show significant differences in the UV intensity compared to the UV intensity at 200 μg/mL (Figure 1B). Compound 4, when introduced into the glycation reactions, showed no respectable change in the UV intensity, even at higher concentrations (Figure 1D).
Figure 1.

Compounds 1 (A), 2 (B), 3 (C), and 4 (D) were used as inhibitors in the glycation reactions with varying concentrations (0.78–400 μg/mL). Each value is the mean ± SD of three independent assays.
Figure 2 shows the inhibition in the glycation reactions by all four different compounds at a concentration of 200 μg/mL. Compound 3 showed maximum inhibition (42.73%; p < 0.01) at a 400 μg/mL concentration in the glycation reaction. Compounds 1 and 2 showed 28.2% (p < 0.05) at 400 μg/mL and 20.9% (p = ns) at 200 μg/mL inhibitions in the glycation of HSA molecules, respectively. However, compound 4 showed no respectable inhibition and was not involved in further experimental analysis. Moreover, very slight differences were observed in glycation inhibition for 1 and 3 at 200 and 400 μg/mL. After comparing these results, the 200 μg/mL concentration was selected for compounds 1, 2, and 3 for further analysis.
Figure 2.

Inhibition of UV intensities of the glycation reactions using compounds (1–4) at a concentration of 200 μg/mL. Each value is the mean ± SD of three independent assays. Significance was defined by p < 0.05, p < 0.01, and p = ns. The “ns” represents nonsignificant.
Under hyperglycemic conditions, blood proteins undergo numerous alterations. Several studies were conducted to prove that proteins, such as albumin, collagen, histone, insulin, etc., undergo structural alterations due to glycation.28,29 One of the unique characteristics of the HSA molecule is that it has a single tryptophan residue. Analysis of tryptophan-specific fluorescence of HSA molecules can provide structural alteration at the microenvironment levels. Increased tryptophan fluorescence in G-HSA was significantly inhibited by 3. A significant (p < 0.05) percent inhibition (39%) of tryptophan-specific fluorescence was observed with compound 3 coupled with a blue shift in the fluorescence intensity in the glycation reaction when 3 was introduced to the reaction (Figure 3). The 1 and 2 compounds also showed 22 and 16% inhibition in glycation reactions, respectively (Figure 3). However, no blue shifts were seen in the tryptophan fluorescence intensities with the 1 and 2 compounds.
Figure 3.

Tryptophan-specific fluorescence of the glycation reactions using compounds (1–3) at a 200 μg/mL concentration. Each value is the mean ± SD of three independent assays. Significance was defined by p < 0.05.
One of the most studied AGEs is pentosidine, which can be analyzed at a specific fluorescence intensity (excitation wavelength of 375 nm). There was a significant increase in the pentosidine-specific fluorescence in 10 weeks of incubated G-HSA samples compared to that of the N-HSA. However, the addition of compounds 3 and 1 decreased the fluorescence intensities significantly (43.6 and 24.7%, respectively) (Figure 4). There was also a slight change (nonsignificant) in the fluorescence intensity due to compound 2. Furthermore, increased amounts of AGE pentosidine were estimated in G-HSA samples, which decreased significantly when compounds 1 and 3 were introduced.
Figure 4.

Pentosidine-specific fluorescence in N-HSA and G-HSA. The G-HSA reactions were incubated in the presence of compounds (1–3). The concentration of compounds was set at 200 μg/mL. Each value is the mean ± SD of three independent assays. Significance was defined by p < 0.05 and p < 0.01.
Ketoamine is one of the initial products in the glycation reaction. The level of ketoamines may be related to the extent of protein glycation. Several studies have established the formation of ketoamines, an initial reversible product of the glycation reaction.28,30 This is also supported by the ketoamine analysis of this study. When compound 3 was added to the glycation reaction, the level of ketoamine decreased significantly. Significantly (p < 0.001), a high amount of ketoamines was generated in the glycation reaction of HSA (6.9 ± 0.40) compared to that of N-HSA (0.19 ± 0.11) when incubated for 10 weeks. Compound 3 exerts significant inhibition (p < 0.05) in the formation of ketoamine (Figure 5). However, compounds 1 and 2 did not show a respectable inhibition.
Figure 5.

Inhibition of ketoamine formation using compounds (1–3). The concentration of 200 μg/mL of compounds was used to coincubate in the glycation reactions. Each value is the mean ± SD of three independent assays. Significance was defined by p < 0.05.
Carbonyl compounds are highly toxic to biomolecules in human blood and are generated in large amounts during the glycation reaction. Dicarbonyl compounds are precursors for developing AGEs and participate in insulin resistance. Some of the highly reactive dicarbonyls are methylglyoxal and 3-deoxyglucosone.31 In this study, significant carbonyl compounds were estimated in G-HSA, which were inhibited strongly by 1 and 3 compounds. The G-HSA sample showed a high amount of carbonyl compounds (8.3 ± 0.31; p < 0.001) compared to that of N-HSA (Figure 6). Compounds 1 and 3 exhibited significant percent inhibition (33.73 and 50.6%, respectively) in the formation of carbonyl compounds, whereas compound 2 did not show any significant change in the levels of carbonyl compounds.
Figure 6.

Inhibition in the generation of carbonyl compounds in the presence of the compounds (1–3). A concentration of 200 μg/mL of compounds was used to coincubate in the glycation reactions. Each value is the mean ± SD of three independent assays. Significance was defined by p < 0.05 and p < 0.01.
CD analysis was performed to identify the changes in the secondary structure of the HSA molecules when it was modified with glucose. In this study, G-HSA was evaluated for detecting changes in the secondary structure (α-helix, β-sheet, β-turn, and random coil). CD analysis of G-HSA showed remarkable changes in α-helix and β-sheet (Figure 7). Structural modifications may cause protein toxicity and dysfunction. However, these changes were reversed to some extent after the addition of compound 3. There were significant changes observed in the α-helix (p < 0.05) and β-sheet (p < 0.01) structures of the HSA molecules upon glycation. There was a negative change in the α-helix (−12.15%), whereas a positive change was detected in the β-sheet (+19.47%) structure after glycation. Nonsignificant, minimal effects were also observed in both turn and random coil structures in G-HSA compared to those in N-HSA (Table 1). Furthermore, compounds were coincubated in the glycation reactions to inhibit these secondary structure changes. However, a significant reverse effect was detected in both the α-helix (−6.78%) and β-sheet (+11.10%) structures with inhibitor 3. Compounds 1 and 2 showed minimal alterations in the α-helix and β-sheet structures of G-HSA samples, which were nonsignificant.
Figure 7.

CD analysis of the N-HSA and G-HSA samples. A reduction in glycation was observed with compounds 1 (G-HSA + 1), 2 (G-HSA + 2), and 3 (G-HSA + 3). The compound concentration of 200 μg/mL was added with 2.2 μM of HSA in all the samples. N-HSA and G-HSA samples were served as negative and positive controls. Each spectrum is the average of three independent assays.
Table 1. CD Analysis for N-HSA, G-HSA, and G-HSA Incubated with Compounds (1–3)a.
| conformation | N-HSA | G-HSA | 1 + G-HSA | 2 + G-HSA | 3 + G-HSA |
|---|---|---|---|---|---|
| α-helix | 42.8 ± 0.23 | 37.6 ± 0.25* | 38.2 ± 0.31 | 37.9 ± 0.28 | 39.9 ± 0.28a |
| (−12.15%) | (−10.75%) | (−11.45%) | (−6.78%) | ||
| β-sheet | 26.2 ± 0.21 | 31.3 ± 0.27** | 30.7 ± 0.30 | 31.0 ± 0.26 | 29.1 ± 0.23a |
| (+19.47%) | (+17.17%) | (+18.32%) | (+11.10%) | ||
| β-turn | 19.7 ± 0.26 | 20.2 ± 0.21 | 20.2 ± 0.18 | 20.2 ± 0.18 | 20.0 ± 0.18 |
| (+2.54%) | (+2.54%) | (+2.54%) | (+1.52%) | ||
| random coil | 11.3 ± 0.22 | 10.9 ± 0.18 | 10.9 ± 0.16 | 10.9 ± 0.16 | 11.0 ± 0.13 |
| (−3.54%) | (−3.54%) | (−3.54%) | (2.65%) |
The values are in percentages. Each sample was read in triplicate. The data given are the mean ± standard deviation. * p < 0.05, **p < 0.01 versus control (N-HSA). Values in parentheses represent the percent change in the secondary structure from N-HSA. Percent decrease and increase are denoted by “–” and “+” signs. The concentrations of 200 μg/mL compounds (1, 2, and 3) were used in the glycation reactions. A t-test was adopted for the comparison between the groups. The sign “#” represents significance p < 0.05 when the values were compared with those of G-HSA.
3.3. Computational Studies
3.3.1. Molecular Docking
Computational molecular docking has emerged as an efficient approach for predicting molecular targets and supporting experimental findings. Compounds 1–4 were docked with HSA (PDB: 1AO6), and the results are summarized in Table ST1 (Supporting Information) and Figure 8. HSA is a carrier protein that contains 585 amino acids with three (I–III) subdomains. Subdomain I (A and B) is composed of residues 1–195, while II (A and B) spans from 196 to 383 and III (A and B) spans from 384 to 585.26,32 It has been reported that the ligand (drug/compound) is mainly transported via binding through Sudlow sites II and III. Sudlow site I is located in subdomain IIA and Sudlow site II is located in subdomain IIIA.32 Molecular docking results also confirm this observation as compounds 1–4 interacted with different amino acids of the Sudlow sites II and III. The docking scores of the compounds were found to be in order 1 (−3.91 kcal/mol) > 3 (−3.69 kcal/mol) > 2 (−3.22 kcal/mol) > 4 (1.91 kcal/mol), which supported the experimental data (compounds 1 and 3 showed better in vitro results than those of 2). Besides, compounds interacted with Asn295, Lys436, and Lys444 receptor residues via hydrogen bonding. The involvement of such domains and residues in binding with exogenous compounds using experimental and computational methods is already established.32,33 It should be noted that compounds 1 and 4 have oxygen atoms that assist in H-bonding. Owing to the lack of any polar group at the 5-arylidene group, compound 4 did not form any hydrogen bond but interacted through relatively weak π-cation (Lys444, Lys395), salt bridge (Asp451), and π–π (Tyr452) interactions.
Figure 8.

Molecular docking outcomes for compounds (A) 1, (B) 2, (C) 3, and (D) 4. Only the residues involved in H-bond formation, π–π stacking, and salt bridge interactions are shown.
3.3.2. Drug-Likeness, Bioavailability, and Toxicity Prediction (ADME Prediction)
Pharmacokinetic profiles, including drug-likeness, bioavailability, and toxicology of the compounds, were computed further using Qikprop and pkcsm tools to check the suitability of the studied molecules as drug candidates. Such tools are standard in drug discovery research due to their high efficiency and fast output. While various parameters can be calculated using these tools,34 we predicted properties such as octanol/water partition coefficient (QPlogPo/w), aqueous solubility (QPlogS), HSA binding (QPlog Khsa), apparent Caco cell permeability (QPPCaco), number of N and O (# N&O), blood–brain partition coefficient (QPlog BB), human oral absorption level (%HOA), van der Waals surface area of polar atoms (PSA), and the number of violations of Lipinski’s rule of five (Ro5) were calculated and compared. Owing to their small size, all the compounds show excellent absorption, distribution, metabolism, and excretion properties. The relatively high inhibitory activity of 1–3 compared to that of 4 could be due to the greater number of N and O atoms in the former, which assisted the molecules interacting with the receptor via different noncovalent interactions. It is also worth noting that all the compounds, except 4, did not show any Ro5 violations. Also, compound 4 has a relatively higher MW and volume than those of compounds 1–3. Other parameters were also within the reference range. For instance, QPlog Khsa (recommended value: −1.5 to +1.5), QPPCaco (recommended value: >500), QPlog BB (recommended value: −3.0 to 1.2), etc., were within the reference range. These findings align with the earlier study, which suggests that descriptors such as lipophilicity, number of HBA/HBD, size, and rigidity are some of the important parameters that govern the antiglycation property of a heterocyclic core.35 The toxicity assessment using the web-based platform pkCSM36 revealed that compounds have no skin sensitivity but may cause hepatotoxicity and AMES toxicity and inhibit hERG II. The predicted maximum tolerated dose for human use was in the range of 0.469–0.542 log mg/kg/day, while oral rat acute toxicity (LD50) was in the range of 2.19–2.24 mol/kg. One should read carefully as further biological studies are required to confirm these observations.
3.3.3. DFT Analysis
DFT calculation lies at the crossroads of interdisciplinary research as it provides information on several underlying properties, such as energy and localization of frontier orbitals, possible electronic transitions, stability, and reactivity of a compound. We carried out DFT calculations using a B3LYP/6-31G* instrument in the gas phase (SPARTAN 20). The distribution of the frontier orbitals is given in Figure 9, while the energy of the frontier molecular orbitals and other parameters are given in Table ST2 (Supporting Information). It has been reported that a 4-thiazolidinone derivative having 5-chlorobenzene at position 5 has HOMO at −6.16 eV, while LUMO lies at −2.38 eV.17 It has also been reported that HOMO is localized mainly over the 4-thiazolidinone ring and the exocyclic benzene ring. Therefore, one may expect that a change in the functionality at 5-arylidene may also affect the localization and energy of the frontier orbitals. In our case, the HOMO energy was found in the range of −5.01 to −5.93 eV while LUMO in the range of −1.55 to −1.87 eV, leading to a HOMO–LUMO gap (ΔE) value between 3.14 and 4.21 eV. This value is similar to that of the structurally close thiazolidinone derivatives reported earlier.37
Figure 9.

DFT-calculated HOMO–LUMO orbitals and the ESP map of compounds 1 (A), 2 (B), 3 (C), and 4 (D).
Indices such as ionization energy, electron affinity, electronegativity (χ), chemical potential (μ), chemical hardness (η), softness (σ), and electrophilicity index (ω) are often used to interpret the stability and reactivity of a molecule.38 It has also been demonstrated that the interacting site of AGE compounds can be predicted using chemical reactivity descriptors.39 For example, a higher HOMO energy level means greater electron-donating ability, while a lower LUMO level indicates the electron acceptability of a molecule. A molecule with a lower ΔE value requires less energy for electronic excitation (thus the creation of a charge carrier) and possesses high chemical reactivity (soft molecules).40 This gap has also been correlated with the biological activity of a molecule.41 We found that compound 4 (3.14 eV) had the lowest ΔE value, while compound 1 had the highest ΔE value (4.21 eV). It is to be noted that compounds with a higher ΔE value (such as 1 and 3) have relatively good in vitro activities. Similarly, a positive I value indicates that the compound is stable, while a positive A value means energy is released when going from atom to anion (the greater the value of A, the more stable the anion will be). We found that all compounds under investigation are stable. We speculate that compound 4 is more stable in anionic form than neutral form, while compound 2 is more stable in neutral form. The chemical reactivity of the compounds follows the order 1 > 3 > 4 > 2 (the greater the electronegativity, the lower the chemical potential and the higher the chemical reactivity).42 Negative μ values indicate that the compound is stable and cannot decompose spontaneously. Similarly, the electrophilicity index (ω) is related to the stabilization in energy in a situation where the system gains an additional electronic charge from the surrounding and quantifies the global electrophilic power of the molecule.43
The electrostatic potential (ESP) map provides information about the electrostatic charge distribution in a molecule and is useful to map sites for electrophilic/nucleophilic attack and noncovalent interaction-forming units. While the regions colored in red are electron-rich (site for electrophilic attack), those in blue are electron-deficient (site for nucleophilic attack), and those in green are considered neutral. The ESP map of compounds 1–4 is depicted in Figure 9. As expected, a blue/green region over the cyclopropyl ring/aromatic, yellow-orange over N-phenyl, red over the carbonyl of the TZD ring, etc., can be seen. A shift in electron density over 5-arylidene is also apparent due to the change in functionalities.
4. Conclusions
Glycation reactions are inevitable in human physiology. However, with abnormal changes in physiological conditions as well as in chronic conditions, glycation reactions may be accelerated. Accelerated glycation reactions may produce ketoamines, carbonyl compounds, and AGEs with structural alteration. High levels of dicarbonyl compounds and AGEs are toxic and may cause disease pathogenesis. Different compounds were used in this study to halt or inhibit the formation of toxic glycation products. From a series of compounds, compound 3 was found to be an excellent inhibitor of glycation reactions and HSA modifications. Considering the high drug likeness and inhibitory ability of compound 3, further in vivo investigations are needed to elucidate the complete mechanism.
Acknowledgments
This research has been funded by the Scientific Research Deanship at the University of Ha’il–Saudi Arabia through project number MDR-22 022.
Supporting Information Available
The Supporting Information is available free of charge at https://pubs.acs.org/doi/10.1021/acsomega.3c08463.
1H NMR, 13C NMR, and ESI-MS spectra of compounds 1–4; docking score, molecular, absorption, distribution, metabolism, excretion properties, and toxicity of compounds 1–4; and chemical reactivity parameters calculated using HOMO–LUMO energy levels (PDF)
The authors declare no competing financial interest.
Supplementary Material
References
- Yeh W.-J.; Hsia S.-M.; Lee W.-H.; Wu C.-H. Polyphenols with antiglycation activity and mechanisms of action: a review of recent findings. J. Food Drug Anal. 2017, 25 (1), 84–92. 10.1016/j.jfda.2016.10.017. [DOI] [PMC free article] [PubMed] [Google Scholar]
- Ramasamy R.; Yan S. F.; Schmidt A. M. Receptor for AGE (RAGE): signaling mechanisms in the pathogenesis of diabetes and its complications. Ann. N.Y. Acad. Sci. 2011, 1243 (1), 88–102. 10.1111/j.1749-6632.2011.06320.x. [DOI] [PMC free article] [PubMed] [Google Scholar]
- Lee B.-W.; Chae H. Y.; Kwon S. J.; Park S. Y.; Ihm J.; Ihm S.-H. RAGE ligands induce apoptotic cell death of pancreatic β-cells via oxidative stress. Int. J. Mol. Med. 2010, 26 (6), 813–818. 10.3892/ijmm_00000529. [DOI] [PubMed] [Google Scholar]; a Lin N.; Zhang H.; Su Q. Advanced glycation end-products induce injury to pancreatic beta cells through oxidative stress. Diabetes Metabol. 2012, 38 (3), 250–257. 10.1016/j.diabet.2012.01.003. [DOI] [PubMed] [Google Scholar]
- Rungratanawanich W.; Qu Y.; Wang X.; Essa M. M.; Song B.-J. Advanced glycation end products (AGEs) and other adducts in aging-related diseases and alcohol-mediated tissue injury. Exp. Mol. Med. 2021, 53 (2), 168–188. 10.1038/s12276-021-00561-7. [DOI] [PMC free article] [PubMed] [Google Scholar]
- Asgharpour Dil F.; Ranjkesh Z.; Goodarzi M. T. A systematic review of antiglycation medicinal plants. Diabetes Metabol. Syndr. 2019, 13 (2), 1225–1229. 10.1016/j.dsx.2019.01.053. [DOI] [PubMed] [Google Scholar]; a Abbas G.; Al-Harrasi A. S.; Hussain H.; Hussain J.; Rashid R.; Choudhary M. I. Antiglycation therapy: discovery of promising antiglycation agents for the management of diabetic complications. Pharmaceut. Biol. 2016, 54 (2), 198–206. 10.3109/13880209.2015.1028080. [DOI] [PubMed] [Google Scholar]
- Bongarzone S.; Savickas V.; Luzi F.; Gee A. D. Targeting the receptor for advanced glycation endproducts (RAGE): a medicinal chemistry perspective. J. Med. Chem. 2017, 60 (17), 7213–7232. 10.1021/acs.jmedchem.7b00058. [DOI] [PMC free article] [PubMed] [Google Scholar]
- Khan M. W. A.; Otaibi A. A.; Alhumaid A. F.; Alsukaibi A. K.; Alshamari A. K.; Alshammari E. M.; Al-Zahrani S. A.; Almudyani A. Y.; Sherwani S. Garlic extract: inhibition of biochemical and biophysical changes in glycated HSA. Appl. Sci. 2021, 11 (22), 11028. 10.3390/app112211028. [DOI] [Google Scholar]; a Elosta A.; Ghous T.; Ahmed N. Natural products as anti-glycation agents: possible therapeutic potential for diabetic complications. Curr. Diabetes Rev. 2012, 8 (2), 92–108. 10.2174/157339912799424528. [DOI] [PubMed] [Google Scholar]; b Starowicz M.; Zieliński H. Inhibition of advanced glycation end-product formation by high antioxidant-leveled spices commonly used in European cuisine. Antioxidants 2019, 8 (4), 100. 10.3390/antiox8040100. [DOI] [PMC free article] [PubMed] [Google Scholar]
- Khan K. M.; Khan M.; Ali M.; Taha M.; Rasheed S.; Perveen S.; Choudhary M. I. Synthesis of bis-Schiff bases of isatins and their antiglycation activity. Biorg. Med. Chem. 2009, 17 (22), 7795–7801. 10.1016/j.bmc.2009.09.028. [DOI] [PubMed] [Google Scholar]
- Khan K. M.; Khan M.; Ambreen N.; Taha M.; Rahim F.; Rasheed S.; Saied S.; Shafi H.; Perveen S.; Choudhary M. I. Oxindole derivatives: Synthesis and antiglycation activity. Med. Chem. 2013, 9 (5), 681–688. 10.2174/1573406411309050007. [DOI] [PubMed] [Google Scholar]
- Taha M.; Mosaddik A.; Rahim F.; Ali S.; Ibrahim M.; Almandil N. B. Synthesis, antiglycation and antioxidant potentials of benzimidazole derivatives. J. King Saud Univ. Sci. 2020, 32 (1), 191–194. 10.1016/j.jksus.2018.04.003. [DOI] [Google Scholar]
- Taha M.; Rahim F.; Khan I. U.; Uddin N.; Farooq R. K.; Wadood A.; Rehman A. U.; Khan K. M. Synthesis of thiazole-based-thiourea analogs: as anticancer, antiglycation and antioxidant agents, structure activity relationship analysis and docking study. J. Biomol. Struct. Dyn. 2023, 41, 12077–12092. 10.1080/07391102.2023.2171134. [DOI] [PubMed] [Google Scholar]
- Taha M.; Ismail N. H.; Jamil W.; Imran S.; Rahim F.; Kashif S. M.; Zulkefeli M. Synthesis of 2-(2-methoxyphenyl)-5-phenyl-1, 3, 4-oxadiazole derivatives and evaluation of their antiglycation potential. Med. Chem. Res. 2016, 25, 225–234. 10.1007/s00044-015-1476-8. [DOI] [Google Scholar]
- Khanam A.; Ahmad S.; Husain A.; Rehman S.; Farooqui A.; Yusuf M. A. Glycation and antioxidants: hand in the glove of antiglycation and natural antioxidants. Curr. Protein Pept. Sci. 2020, 21 (9), 899–915. 10.2174/1389203721666200210103304. [DOI] [PubMed] [Google Scholar]
- Kaminskyy D.; Kryshchyshyn A.; Lesyk R. 5-Ene-4-thiazolidinones—an efficient tool in medicinal chemistry. Eur. J. Med. Chem. 2017, 140, 542–594. 10.1016/j.ejmech.2017.09.031. [DOI] [PMC free article] [PubMed] [Google Scholar]; a Sameeh M. Y.; Khowdiary M. M.; Nassar H. S.; Abdelall M. M.; Alderhami S. A.; Elhenawy A. A. Discovery potent of thiazolidinedione derivatives as antioxidant, α-amylase inhibitor, and antidiabetic agent. Biomedicines 2022, 10 (1), 24. 10.3390/biomedicines10010024. [DOI] [PMC free article] [PubMed] [Google Scholar]
- Brown F. C. 4-thiazolidinone. Chem. Rev. 1961, 61 (5), 463–521. 10.1021/cr60213a002. [DOI] [Google Scholar]; a Ibrahim A. M.; Shoman M. E.; Mohamed M. F.; Hayallah A. M.; Abuo-Rahma G. E.-D. A.. Chemistry and applications of functionalized 2, 4-thiazolidinediones. Eur. J. Org. Chem., 26, (19), e202300184. 10.1002/ejoc.202300184 [DOI] [Google Scholar]
- Miyata T.; van Ypersele de Strihou C. Angiotensin II receptor blockers and angiotensin converting enzyme inhibitors: implication of radical scavenging and transition metal chelation in inhibition of advanced glycation end product formation. Arch. Biochem. Biophys. 2003, 419 (1), 50–54. 10.1016/j.abb.2003.08.010. [DOI] [PubMed] [Google Scholar]
- Mushtaque M.; Avecilla F.; Pingale S. S.; Kamble K. M.; Yab Z.; Rizvi M. M. A. Computational and experimental studies of 4-thiazolidinone-cyclopropyl hybrid. J. Mol. Liq. 2017, 241, 912–921. 10.1016/j.molliq.2017.06.041. [DOI] [Google Scholar]
- a Shaklai N.; Garlick R. L.; Bunn H. F. Nonenzymatic glycosylation of human serum albumin alters its conformation and function. J. Biol. Chem. 1984, 259, 3812–3817. 10.1016/S0021-9258(17)43168-1. [DOI] [PubMed] [Google Scholar]; b Chen Y.-H.; Yang J. T. A new approach to the calculation of secondary structures of globular proteins by optical rotatory dispersion and circular dichroism. Biochem. Biophys. Res. Commun. 1971, 44 (6), 1285–1291. 10.1016/S0006-291X(71)80225-5. [DOI] [PubMed] [Google Scholar]
- Mashiba S.; Uchida K.; Okuda S.; Tomita S. Measurement of glycated albumin by the nitroblue tetrazolium colorimetric method. Clin. Chim. Acta 1992, 212 (1–2), 3–15. 10.1016/0009-8981(92)90133-B. [DOI] [PubMed] [Google Scholar]
- Ahmed N.; Furth A. J. A microassay for protein glycation based on the periodate method. Anal. Biochem. 1991, 192 (1), 109–111. 10.1016/0003-2697(91)90193-W. [DOI] [PubMed] [Google Scholar]
- Levine R. L.; Garland D.; Oliver C. N.; Amici A.; Climent I.; Lenz A.-G.; Ahn B.-W.; Shaltiel S.; Stadtman E. R.. [49] Determination of Carbonyl Content in Oxidatively Modified Proteins. Methods in Enzymology; Elsevier, 1990; Vol. 186, pp 464–478. [DOI] [PubMed] [Google Scholar]
- Halgren T. A.; Murphy R. B.; Friesner R. A.; Beard H. S.; Frye L. L.; Pollard W. T.; Banks J. L. Glide: a new approach for rapid, accurate docking and scoring. 2. Enrichment factors in database screening. J. Med. Chem. 2004, 47 (7), 1750–1759. 10.1021/jm030644s. [DOI] [PubMed] [Google Scholar]
- Schrödinger, LLC . QikProp, version 3.5; Schrödinger: New York, NY, 2012. Google scholar there is no corresponding record for this reference.
- Ahmad S.; Gupta D.; Ahmed T.; Islam A. Designing of new tetrahydro-β-carboline-based ABCG2 inhibitors using 3D-QSAR, molecular docking, and DFT tools. J. Biomol. Struct. Dyn. 2023, 41, 14016–14027. 10.1080/07391102.2023.2176361. [DOI] [PubMed] [Google Scholar]
- Ahamad S.; Hema K.; Gupta D. Identification of novel tau-tubulin kinase 2 inhibitors using computational approaches. ACS Omega 2023, 8 (14), 13026–13037. 10.1021/acsomega.3c00225. [DOI] [PMC free article] [PubMed] [Google Scholar]
- Fasano M.; Curry S.; Terreno E.; Galliano M.; Fanali G.; Narciso P.; Notari S.; Ascenzi P. The extraordinary ligand binding properties of human serum albumin. IUBMB life 2005, 57 (12), 787–796. 10.1080/15216540500404093. [DOI] [PubMed] [Google Scholar]
- Bouma B.; Kroon-Batenburg L. M.; Wu Y.-P.; Brünjes B.; Posthuma G.; Kranenburg O.; de Groot P. G.; Voest E. E.; Gebbink M. F. Glycation induces formation of amyloid cross-β structure in albumin. J. Biol. Chem. 2003, 278 (43), 41810–41819. 10.1074/jbc.M303925200. [DOI] [PubMed] [Google Scholar]
- Ali Khan M. W.; Rasheed Z.; Ali Khan W.; Ali R. Biochemical, biophysical, and thermodynamic analysis of in vitro glycated human serum albumin. Biochemistry 2007, 72, 146–152. 10.1134/S0006297907020034. [DOI] [PubMed] [Google Scholar]
- Ashraf J. M.; Rabbani G.; Ahmad S.; Hasan Q.; Khan R. H.; Alam K.; Choi I. Glycation of H1 histone by 3-deoxyglucosone: effects on protein structure and generation of different advanced glycation end products. PLoS One 2015, 10 (6), e0130630 10.1371/journal.pone.0130630. [DOI] [PMC free article] [PubMed] [Google Scholar]; a Bansode S.; Bashtanova U.; Li R.; Clark J.; Müller K. H.; Puszkarska A.; Goldberga I.; Chetwood H. H.; Reid D. G.; Colwell L. J. Glycation changes molecular organization and charge distribution in type I collagen fibrils. Sci. Rep. 2020, 10 (1), 3397. 10.1038/s41598-020-60250-9. [DOI] [PMC free article] [PubMed] [Google Scholar]
- Khan M. W.; Otaibi A. A.; Al-Zahrani S. A.; Alshammari E. M.; Haque A.; Alouffi S.; Khan W. A.; Khan S. N. Experimental and theoretical insight into resistance to glycation of bovine serum albumin. J. Mol. Struct. 2021, 1230, 129645. 10.1016/j.molstruc.2020.129645. [DOI] [Google Scholar]
- Rabbani N. Methylglyoxal and glyoxalase 1—a metabolic stress pathway-linking hyperglycemia to the unfolded protein response and vascular complications of diabetes. Clin. Sci. 2022, 136 (11), 819–824. 10.1042/CS20220099. [DOI] [PMC free article] [PubMed] [Google Scholar]; a Alouffi S.; Khan M. W. A. Dicarbonyls generation, toxicities, detoxifications and potential roles in diabetes complications. Curr. Protein Pept. Sci. 2020, 21 (9), 890–898. 10.2174/1389203720666191010155145. [DOI] [PubMed] [Google Scholar]
- Qiu H.-Y.; Hou N.-N.; Shi J.-F.; Liu Y.-P.; Kan C.-X.; Han F.; Sun X.-D. Comprehensive overview of human serum albumin glycation in diabetes mellitus. World J. Diabetes 2021, 12 (7), 1057–1069. 10.4239/wjd.v12.i7.1057. [DOI] [PMC free article] [PubMed] [Google Scholar]
- Godugu D.; Rupula K.; S Rao B. Binding interactions of forskolin with human serum albumin: Insights from in silico and spectroscopic studies. Curr. Chem. Biol. 2016, 10 (2), 127–134. 10.2174/2212796810666160926161127. [DOI] [Google Scholar]
- Shahbazi S.; Kaur J.; Kuanar A.; Kar D.; Singh S.; Sobti R. C. Risk of late-onset alzheimer’s disease by plasma cholesterol: rational in silico drug investigation of pyrrole-based HMG-CoA reductase inhibitors. Assay Drug Dev. Technol. 2017, 15 (7), 342–351. 10.1089/adt.2017.804. [DOI] [PubMed] [Google Scholar]; a Omoboyowa D. A. Exploring molecular docking with E-pharmacophore and QSAR models to predict potent inhibitors of 14-α-demethylase protease from Moringa spp. Pharmacol. Res. 2022, 4, 100147. 10.1016/j.prmcm.2022.100147. [DOI] [Google Scholar]
- Hamdan A.; Kasabri V.; Al-Hiari Y.; Arabiyat S.; AlAlawi S.; Bustanji Y. Dual anti-inflammatory and antiglycation propensities of a potentially novel class of functionalized fluoroquinolones. J. Heterocycl. Chem. 2020, 57 (2), 663–675. 10.1002/jhet.3807. [DOI] [Google Scholar]
- Pires D. E.; Blundell T. L.; Ascher D. B. pkCSM: predicting small-molecule pharmacokinetic and toxicity properties using graph-based signatures. J. Med. Chem. 2015, 58 (9), 4066–4072. 10.1021/acs.jmedchem.5b00104. [DOI] [PMC free article] [PubMed] [Google Scholar]
- Arshad R.; Khan M. A.; Mutahir S.; Hussain S.; Al-Hazmi G. H.; Refat M. S. DFT, Molecular Docking and ADME Studies of Thiazolidinones as Tyrosinase Inhibitors. Polycyclic Aromat. Compd. 2022, 43 (8), 6750–6765. 10.1080/10406638.2022.2124286. [DOI] [Google Scholar]; a Guerraoui A.; Goudjil M.; Direm A.; Guerraoui A.; Şengün İ. Y.; Parlak C.; Djedouani A.; Chelazzi L.; Monti F.; Lunedei E. A rhodanine derivative as a potential antibacterial and anticancer agent: Crystal structure, spectral characterization, DFT calculations, Hirshfeld surface analysis, in silico molecular docking and ADMET studies. J. Mol. Struct. 2023, 1280, 135025. 10.1016/j.molstruc.2023.135025. [DOI] [Google Scholar]
- Sánchez-Bojorge N.-A.; Flores-Holguín N.; Glossman-Mitnik D.; Rodríguez-Valdez L. M. Computational note on the chemical reactivity of pyrrole derivatives. J. Mol. Struct. 2009, 912 (1–3), 119–120. 10.1016/j.theochem.2009.07.037. [DOI] [Google Scholar]
- Frau J.; Glossman-Mitnik D. Chemical reactivity theory study of advanced glycation endproduct inhibitors. Molecules 2017, 22 (2), 226. 10.3390/molecules22020226. [DOI] [PMC free article] [PubMed] [Google Scholar]
- Mermer A.; Bayrak H.; Alyar S.; Alagumuthu M. Synthesis, DFT calculations, biological investigation, molecular docking studies of β-lactam derivatives. J. Mol. Struct. 2020, 1208, 127891. 10.1016/j.molstruc.2020.127891. [DOI] [Google Scholar]
- Kawakami J.; Kakinami H.; matsushima N.; Nakane A.; Kitahara H.; Nagaki M.; Ito S. Structure-activity relationship analysis for Antimicrobial activities of Tryptanthrin derivatives using quantum chemical calculations. J. Comput. Chem., Jpn. 2013, 12 (2), 109–112. 10.2477/jccj.2012-0026. [DOI] [Google Scholar]
- Abdou A.; Omran O. A.; Nafady A.; Antipin I. S. Structural, spectroscopic, FMOs, and non-linear optical properties exploration of three thiacaix (4) arenes derivatives. Arab. J. Chem. 2022, 15 (3), 103656. 10.1016/j.arabjc.2021.103656. [DOI] [Google Scholar]
- Parr R. G.; Szentpály L. v.; Liu S. Electrophilicity index. J. Am. Chem. Soc. 1999, 121 (9), 1922–1924. 10.1021/ja983494x. [DOI] [Google Scholar]
Associated Data
This section collects any data citations, data availability statements, or supplementary materials included in this article.