

Abstract
Objective
Cardiovascular disease (CVD) is the leading cause of death across Europe. We estimated lost earnings (productivity losses) associated with premature mortality due to CVD, and separately for its main sub-categories of coronary heart disease and cerebrovascular disease, across 54 country members of the European Society of Cardiology (ESC).
Methods and results
We used a standardized approach to estimate working years and earnings lost due to premature death resulting from CVD across the 54 ESC member countries in 2018. Our population-based approach was based on national data on the number of deaths, employment rates, and earnings by age group and sex. We discounted future working years and earnings lost to present values using a 3.5% annual rate. In 2018, there were 4.4 million deaths due to CVD across the 54 countries, with 7.1 million working years lost. This represented productivity losses due to premature death of €62 billion in 2018. Deaths due to coronary heart disease accounted for 47% (€29 billion) of all CVD costs, and cerebrovascular disease accounted for 18% (€11 billion). Approximately 60% (€37 billion) of all productivity losses occurred in the 28 European Union member states, despite accounting for only 42% (1.8 million) of deaths and 21% (1.5 million) of working years lost across the 54 countries.
Conclusion
Our study provides a snapshot of the economic consequences posed by premature mortality due to CVD across 54 countries in 2018. The considerable variation across countries highlights the potential gains from policies targeting prevention and care of cardiovascular diseases.
Keywords: Cost, Cardiovascular disease, Mortality, Stroke, Coronary heart disease
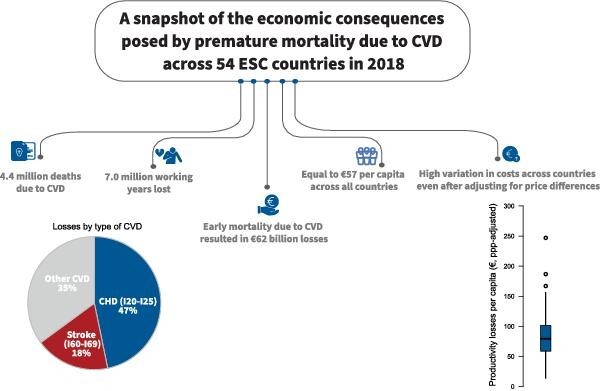
Graphical Abstract
Graphical Abstract.
Key learning points
What is already known on this topic
Cardiovascular disease is the leading cause of death in the world, with 17.9 million deaths.
Lost earnings due to premature death were €32 billion in 2015 across the European Union.
What this study adds
We estimate the lost earnings due to CVD-related premature death across 54 countries for 2018 at €62 billion. The total number of deaths due to CVD decreased from 4.8 million in 2000 to 4.6 million in 2010 and 4.4 million in 2018.
We found considerable variation across countries concerning the economic impact of CVD related deaths. This highlights the potential gains from policies targeting prevention and care of cardiovascular diseases.
Introduction
Cardiovascular disease (CVD, ICD-10 I00–I99) is the leading cause of death in the world, with 17.9 million deaths in 2019.1 CVD is the main source of years of life lost worldwide, accounting for 354.8 million years of life lost in 2019.2 The most common CVDs are coronary heart disease (CHD, ICD-10 I20–I25) and cerebrovascular disease (ICD-10 I60–I69), which were responsible for ∼50 and 35% of all CVD deaths, respectively.1
As well as the human costs of such deaths, early death due to CVD will negatively impact the workforce, and so the wider economy and society. Estimating the lost earnings (productivity losses) due to premature mortality provides an important societal perspective on the economic impact of CVD. Productivity losses consist of earnings associated with paid work that are lost if someone dies before their retirement age. Expected future earnings are assumed to reflect the individual's potential contribution to the economy.3 Estimating productivity costs is essential for policymakers who need to be aware of the societal impact of their decisions, since costs falling outside the healthcare budget can be considered equally important as those falling on the healthcare budget.
In our previous work, we estimated productivity losses due to CVD-related premature mortality for the European Union (EU) to be €24 billion in 2003 and €32 billion in 2015,4,5 after adjustments for employment rates and discounting. However, this work was restricted to the relatively affluent countries of the EU. These countries have advanced healthcare systems and often relatively low incidence of CVD, when compared with the rest of the world.
Our study aimed to update and enhance our estimates of the economic impact of CVD premature mortality to society. First, we estimated the number of working years lost and productivity losses in 2018 for countries with a European Society of Cardiology (ESC) affiliated national cardiac society. Second, we broke down productivity losses in EU and non-EU countries and examined variations across countries. Finally, we examined trends in CVD deaths between 2000 and 2018.
Methods
Analysis framework and data sources
We conducted a population-based cost analysis to evaluate productivity losses from premature death due to CVD. Although the ESC includes 57 National Cardiac Societies, we excluded countries with a population of <50 000 (San Marino), countries that are not members of the United Nations (Kosovo), and those with considerable political instability and conflict (Libya and Syria) in order to ensure reliability and validity of data. We adopted the same methodological framework for each of the 54 countries under study (28 EU member states as of 2018, and 26 non-EU member countries; see Supplementary material online, Table S1 for the full list). This is the same approach used in other cost-of-illness studies evaluating CVD,4,5 cancer,6–8 blood disorders,9 and dementia.10
We used the human capital approach to measure and value lost productivity due to premature mortality.3 This approach assumes that economic capital can be measured by an individual's ability to participate in paid employment. Within this framework, losses can be quantified by measuring the number of years by which working life is reduced due to mortality. Working years are valued using achievable gross earnings as a representation of the value of work to society. These costs are then adjusted for the proportion of the population who are employed.
Country-specific productivity losses from premature death were estimated by calculating the sum of the age- and sex-specific products of the following (see Supplementary material online, Table S2 for full references):
number of CVD-related deaths;
number of remaining work years at the time of death;
annual gross earnings;
economic activity and unemployment rates in the population (aged 15–79).
Working years left at the time of death were estimated as the number of years up to age 79. The most frequent retirement age across EU and OECD countries is 65 years (https://www.etk.fi/en/work-and-pensions-abroad/international-comparisons/retirement-ages/ & https://www.oecd-ilibrary.org/sites/99acb105-en/index.html?itemId=/content/component/99acb105-en), but there are a significant number of individuals working up to age 79.11 The number of working years left at the time of death was adjusted by the likelihood of individuals in each age group (5-year age bands from 15 to 79 years old) being economically active and employed. In Supplementary material online, Table S3, we report mean annual gross earnings by sex. (Note that we used age- and sex-specific earnings in our analysis.) Future earnings lost were discounted to present values using a 3.5% annual rate.4–10 All costs were expressed in 2018 prices and converted to euros where applicable.11,12
Finally, we examined the trends in all-cause and CVD-related mortality in the 54 ESC countries between 2000 and 2018 across all ages and for 15–64-year-olds. We estimated the proportion of CVD deaths of all deaths across all ages and for the 15–64-year-olds. Supplementary material online, Table S4 lists the data sources of mortality data by country and year.
Patient and public involvement
Patients were not involved in our study as it comprised the analysis of secondary data.
Statistical analysis
Costs in 2018 were estimated individually by country, by country groupings (e.g. EU member or not, by World Bank income group—low income, lower middle income, upper middle income and high income), and in total across all ESC countries. We also estimated costs per capita, dividing total costs by the population of each country.11 As a sensitivity analysis and to facilitate comparisons across countries, we employed the purchasing power parity (PPP) method to adjust annual gross earnings.12 The PPP method allowed us to account for price differentials across countries. This was done by first converting costs in local currency into 2018 international dollars (Int$, an international dollar buys in each country a comparable amount of goods and services that US dollar buys in the USA) and then to PPP-adjusted euros (applying the EU-28 to US PPP index in 2018, i.e. 1.44 749).
To explore variations in CVD-related productivity losses between countries in 2018, we undertook a series of ordinary least-squares (OLS) regression analyses (with robust SE) using CVD-related productivity losses per capita adjusted for price differentials (PPP adjusted). We explored the association between productivity losses and national income [gross domestic product (GDP)—per capita], proportion of GDP expenditure on healthcare, proportion of healthcare expenditure that was out-of-pocket expenditure, hospital beds per 1000 persons, and CVD incidence (crude rate per capita) in univariable and multivariable analyses.2 Diagnostic tests were performed for functional form (RESET test and link test). An explanatory variable was considered significant if its P value was less than 0.05. All regression analyses were performed using Stata version 15.0.
Results
Productivity losses due to CVD in 54 ESC member countries
As a whole, for the 54 ESC member countries under analysis, CVD accounted for 4.4 million deaths, 7.1 million working years lost, and €61.6 billion in productivity losses in 2018 (see Tables 1 and 2). The average lost earnings per capita across the 54 countries were €57 (median €56, interquartile range 38–85), varying from €6 in Algeria to €133 in Switzerland. Approximately 60% (€37 billion) of all productivity losses occurred in EU-28 countries, but these accounted for only 42% (1.8 million) of deaths and 21% (1.5 million) of working years lost across all 54 countries.
Table 1.
Productivity losses due to CVD, CHD, and cerebrovascular disease in EU-28, by country, 2018
| CVD (I00–I99) | CHD (I20–I25) | Cerebrovascular diseases (I60–I69) | |||||||
|---|---|---|---|---|---|---|---|---|---|
| Deaths (per 1000) | Working years lost (per 1000) | Productivity losses, € thousands (€ per capita) | Deaths (per 1000) | Working years lost (per 1000) | Productivity losses, € thousands (€ per capita) | Deaths (per 1000) | Working years lost (per 1000) | Productivity losses, € thousands (€ per capita) | |
| Austria | 33 668 (3.8) | 18 076 (2.0) | €842 487 (€95) | 14 313 (1.6) | 9777 (1.1) | €477 993 (€54) | 4808 (0.5) | 2676 (0.3) | €113 827 (€13) |
| Belgium | 20 999 (1.8) | 9379 (0.8) | €391 570 (€34) | 7099 (0.6) | 3608 (0.3) | €160 913 (€14) | 3530 (0.3) | 1309 (0.1) | €54 049 (€5) |
| Bulgaria | 72 146 (10.2) | 51 902 (7.4) | €285 491 (€40) | 12 949 (1.8) | 11 605 (1.6) | €65 264 (€9) | 20 278 (2.9) | 9523 (1.4) | €52 378 (€7) |
| Croatia | 23 781 (5.8) | 12 938 (3.2) | €151 462 (€37) | 11 239 (2.7) | 6450 (1.6) | €77 013 (€19) | 6187 (1.5) | 2341 (0.6) | €27 939 (€7) |
| Cyprus | 1992 (2.3) | 2837 (3.3) | €67 436 (€78) | 690 (0.8) | 1718 (2.0) | €42 183 (€49) | 384 (0.4) | 354 (0.4) | €8195 (€9) |
| Czech Republic | 49 597 (4.7) | 47 706 (4.5) | €580 970 (€55) | 24 524 (2.3) | 19 538 (1.8) | €249 814 (€24) | 8534 (0.8) | 6553 (0.6) | €79 515 (€7) |
| Denmark | 12 557 (2.2) | 13 113 (2.3) | €638 403 (€110) | 3728 (0.6) | 4459 (0.8) | €229 643 (€40) | 3262 (0.6) | 2817 (0.5) | €132 557 (€23) |
| Estonia | 8021 (6.1) | 8282 (6.3) | €106 153 (€80) | 3027 (2.3) | 3003 (2.3) | €39 086 (€30) | 899 (0.7) | 1126 (0.9) | €14 060 (€11) |
| Finland | 19 129 (3.5) | 14 492 (2.6) | €578 067 (€105) | 9859 (1.8) | 5688 (1.0) | €241 775 (€44) | 4050 (0.7) | 2418 (0.4) | €92 751 (€17) |
| France | 144 047 (2.2) | 87 924 (1.3) | €2943 168 (€44) | 33 217 (0.5) | 26 834 (0.4) | €988 293 (€15) | 32 318 (0.5) | 17 988 (0.3) | €579 195 (€9) |
| Germany | 345 208 (4.2) | 250 464 (3.0) | €9386 018 (€113) | 125 961 (1.5) | 105 148 (1.3) | €4123 052 (€50) | 55 498 (0.7) | 37 421 (0.5) | €1344 047 (€16) |
| Greece | 46 942 (4.4) | 29 290 (2.7) | €660 078 (€61) | 13 148 (1.2) | 16 873 (1.6) | €389 191 (€36) | 13 797 (1.3) | 4740 (0.4) | €104 166 (€10) |
| Hungary | 65 598 (6.7) | 53 671 (5.5) | €625 390 (€64) | 32 645 (3.3) | 23 797 (2.4) | €285 114 (€29) | 11 384 (1.2) | 8881 (0.9) | €102 857 (€11) |
| Ireland | 8889 (1.8) | 12 292 (2.5) | €460 782 (€95) | 4160 (0.9) | 6367 (1.3) | €246 668 (€51) | 1706 (0.4) | 1773 (0.4) | €65 954 (€14) |
| Italy | 221 887 (3.7) | 110 858 (1.8) | €3460 119 (€57) | 66 866 (1.1) | 39 621 (0.7) | €1334 541 (€22) | 56 958 (0.9) | 19 095 (0.3) | €582 434 (€10) |
| Latvia | 15 851 (8.2) | 21 196 (11.0) | €222 511 (€115) | 7451 (3.9) | 8274 (4.3) | €89 489 (€46) | 5345 (2.8) | 3909 (2.0) | €41 027 (€21) |
| Lithuania | 22 472 (8.0) | 27 146 (9.7) | €240 461 (€86) | 14 474 (5.2) | 13 838 (4.9) | €125 478 (€45) | 5362 (1.9) | 4689 (1.7) | €41 031 (€15) |
| Luxembourg | 1276 (2.1) | 901 (1.5) | €51 831 (€86) | 344 (0.6) | 352 (0.6) | €20 913 (€35) | 235 (0.4) | 91 (0.2) | €5473 (€9) |
| Malta | 1253 (2.6) | 1103 (2.3) | €20 482 (€43) | 690 (1.5) | 661 (1.4) | €12 490 (€26) | 265 (0.6) | 189 (0.4) | €3369 (€7) |
| The Netherlands | 38 412 (2.2) | 33 733 (2.0) | €1341 557 (€78) | 8428 (0.5) | 9830 (0.6) | €417 200 (€24) | 9262 (0.5) | 6779 (0.4) | €262 451 (€15) |
| Poland | 167 367 (4.4) | 148 332 (3.9) | €1673 758 (€44) | 44 816 (1.2) | 44 893 (1.2) | €523 801 (€14) | 30 684 (0.8) | 31 979 (0.8) | €352 930 (€9) |
| Portugal | 32 802 (3.2) | 36 438 (3.5) | €632 394 (€61) | 7366 (0.7) | 14 507 (1.4) | €259 342 (€25) | 11 737 (1.1) | 9721 (0.9) | €169 472 (€16) |
| Romania | 150 239 (7.7) | 143 543 (7.3) | €1537 420 (€79) | 49 778 (2.5) | 55 670 (2.9) | €606 341 (€31) | 42 689 (2.2) | 31 955 (1.6) | €342 175 (€18) |
| Slovakia | 24 266 (4.5) | 23 721 (4.4) | €275 027 (€51) | 13 723 (2.5) | 10 544 (1.9) | €126 816 (€23) | 5080 (0.9) | 4652 (0.9) | €52 534 (€10) |
| Slovenia | 8099 (3.9) | 3779 (1.8) | €85 985 (€42) | 2004 (1.0) | 2225 (1.1) | €51 027 (€25) | 1978 (1.0) | 595 (0.3) | €13 859 (€7) |
| Spain | 122 465 (2.6) | 72 040 (1.5) | €1797 868 (€39) | 32 325 (0.7) | 27 976 (0.6) | €743 018 (€16) | 26 937 (0.6) | 12 856 (0.3) | €312 019 (€7) |
| Sweden | 31 581 (3.1) | 20 858 (2.1) | €822 226 (€81) | 11 582 (1.1) | 10 099 (1.0) | €411 232 (€41) | 6093 (0.6) | 3112 (0.3) | €123 392 (€12) |
| Total EU-27 | 1690 544 (3.8) | 1256 015 (2.8) | €29 879 115 (€67) | 556 406 (1.2) | 483 353 (1.1) | €12 337 688 (€28) | 369 260 (0.8) | 229 542 (0.5) | €5073 657 (€11) |
| UK | 153 661 (2.3) | 210 320 (3.2) | €7247 985 (€109) | 66 709 (1.0) | 103 772 (1.6) | €3778 195 (€57) | 37 945 (0.6) | 35 919 (0.5) | €1183 667 (€18) |
| Total EU-28 | 1844 205 (3.6) | 1466 335 (2.9) | €37 127 099 (€72) | 623 115 (1.2) | 587 125 (1.1) | €16 115 883 (€31) | 407 205 (0.8) | 265 460 (0.5) | €6257 324 (€12) |
Table 2.
Productivity losses due to CVD, CHD, and cerebrovascular disease (€ million) in 26 non-EU member countries of ESC, by country, 2018
| CVD (I00–I99) | CHD (I20–I25) | Cerebrovascular diseases (I60–I69) | |||||||
|---|---|---|---|---|---|---|---|---|---|
| Deaths (per 1000) | Working years lost (per 1000) | Productivity losses, € thousands (€ per capita) | Deaths (per 1000) | Working years lost (per 1000) | Productivity losses, € thousands (€ per capita) | Deaths (per 1000) | Working years lost (per 1000) | Productivity losses, € thousands (€ per capita) | |
| Albania | 12 145 (4.2) | 14 356 (5.0) | €47 178 (€16) | 5873 (2.0) | 7568 (2.6) | €26 419 (€9) | 4840 (1.7) | 3874 (1.3) | €12 466 (€4) |
| Algeria | 79 389 (1.8) | 104 479 (2.4) | €271 257 (€6) | 49 213 (1.1) | 65 096 (1.5) | €178 318 (€4) | 19 189 (0.4) | 20 226 (0.5) | €51 011 (€1) |
| Armenia | 13 631 (4.6) | 32 771 (11.0) | €104 709 (€35) | 9433 (3.2) | 23 281 (7.8) | €75 568 (€25) | 2618 (0.9) | 5779 (1.9) | €18 048 (€6) |
| Azerbaijan | 40 266 (4.1) | 90 258 (9.1) | €249 796 (€25) | 27 269 (2.8) | 56 904 (5.7) | €164 779 (€17) | 9711 (1.0) | 17 084 (1.7) | €45 862 (€5) |
| Belarus | 73 014 (7.7) | 103 141 (10.9) | €389 895 (€41) | 52 644 (5.5) | 62 153 (6.5) | €240 610 (€25) | 15 860 (1.7) | 21 105 (2.2) | €78 612 (€8) |
| Bosnia | 18 107 (5.5) | 13 532 (4.1) | €94 659 (€29) | 8943 (2.7) | 7478 (2.3) | €54 118 (€17) | 6918 (2.1) | 3617 (1.1) | €24 191 (€7) |
| Egypt | 232 675 (2.3) | 642 212 (6.4) | €696 130 (€7) | 158 822 (1.6) | 447 167 (4.5) | €502 083 (€5) | 50 841 (0.5) | 117 178 (1.2) | €122 351 (€1) |
| Georgia | 29 989 (8.0) | 113 049 (30.3) | €351 910 (€94) | 15 009 (4.0) | 58 513 (15.7) | €185 699 (€50) | 10 212 (2.7) | 36 154 (9.7) | €111 929 (€30) |
| Iceland | 680 (2.0) | 735 (2.1) | €36 621 (€105) | 306 (0.9) | 436 (1.3) | €22 202 (€64) | 125 (0.4) | 74 (0.2) | €3512 (€10) |
| Israel | 11 849 (1.3) | 17 385 (2.0) | €409 703 (€46) | 6046 (0.7) | 9107 (1.0) | €223 523 (€25) | 3043 (0.3) | 3890 (0.4) | €91 184 (€10) |
| Kazakhstan | 67 339 (3.6) | 479 389 (25.5) | €1609 630 (€86) | 38 556 (2.1) | 229 329 (12.2) | €801 173 (€43) | 19 594 (1.0) | 127 754 (6.8) | €431 106 (€23) |
| Kyrgyzstan | 16 557 (2.6) | 51 189 (8.0) | €98 940 (€15) | 10 751 (1.7) | 25 159 (3.9) | €50 047 (€8) | 4534 (0.7) | 16 219 (2.5) | €31 426 (€5) |
| Lebanon | 14 094 (2.9) | 45 178 (9.3) | €256 934 (€53) | 10 240 (2.1) | 36 721 (7.6) | €213 019 (€44) | 2129 (0.4) | 3415 (0.7) | €17 947 (€4) |
| Liechtenstein | 64 (1.7) | 52 (1.4) | €3618 (€95) | 10 (0.3) | 4 (0.1) | €298 (€8) | 5 (0.1) | 4 (0.1) | €287 (€8) |
| Moldova | 23 194 (6.5) | 46 003 (13.0) | €139 051 (€39) | 15 217 (4.3) | 26 372 (7.4) | €80 541 (€23) | 5774 (1.6) | 12 963 (3.7) | €39 351 (€11) |
| Montenegro | 3737 (6.0) | 2892 (4.6) | €23 607 (€38) | 1446 (2.3) | 1365 (2.2) | €11 577 (€19) | 1797 (2.9) | 954 (1.5) | €7638 (€12) |
| Morocco | 115 124 (6.7) | 285 455 (16.6) | €1149 181 (€67) | 76 243 (4.4) | 197 909 (11.5) | €818 810 (€48) | 27 153 (1.6) | 55 030 (3.2) | €214 384 (€12) |
| North Macedonia | 10 518 (5.1) | 11 269 (5.4) | €68 109 (€33) | 4097 (2.0) | 5644 (2.7) | €34 974 (€17) | 4925 (2.4) | 3878 (1.9) | €23 226 (€11) |
| Norway | 10 430 (2.0) | 8759 (1.7) | €423 730 (€80) | 3581 (0.7) | 3787 (0.7) | €196 856 (€37) | 2341 (0.4) | 1569 (0.3) | €72 184 (€14) |
| Russia | 1000 223 (6.8) | 1781 424 (12.2) | €9152 918 (€62) | 562 921 (3.8) | 793 402 (5.4) | €4232 217 (€29) | 317 548 (2.2) | 362 878 (2.5) | €1869 031 (€13) |
| Serbia | 53 659 (7.7) | 56 577 (8.1) | €364 376 (€52) | 9347 (1.3) | 15 568 (2.2) | €100 730 (€14) | 11 208 (1.6) | 10 604 (1.5) | €68 728 (€10) |
| Switzerland | 20 999 (2.5) | 18 250 (2.2) | €1129 268 (€133) | 7099 (0.8) | 7345 (0.9) | €479 699 (€57) | 3530 (0.4) | 2567 (0.3) | €155 272 (€18) |
| Tunisia | 34 122 (2.9) | 46 082 (3.9) | €82 575 (€7) | 22 025 (1.9) | 31 972 (2.7) | €58 534 (€5) | 7969 (0.7) | 8127 (0.7) | €14 308 (€1) |
| Turkey | 167 258 (2.1) | 316 983 (3.9) | €4834 301 (€60) | 66 880 (0.8) | 151 580 (1.9) | €2451 962 (€30) | 38 098 (0.5) | 57 672 (0.7) | €881 662 (€11) |
| Ukraine | 427 321 (10.1) | 450 691 (10.7) | €1253 861 (€30) | 309 604 (7.3) | 229 861 (5.4) | €655 405 (€16) | 87 402 (2.1) | 88 453 (2.1) | €245 601 (€6) |
| Uzbekistan | 115 263 (3.5) | 893 367 (27.4) | €1221 475 (€37) | 82 813 (2.5) | 595 428 (18.2) | €829 007 (€25) | 25 137 (0.8) | 212 136 (6.5) | €292 064 (€9) |
| Total | 2591 647 (4.5) | 5625 478 (9.8) | €24 463 433 (€43) | 1554 388 (2.7) | 3089 149 (5.4) | €12 688 166 (€22) | 682 502 (1.2) | 1193 203 (2.1) | €4923 381 (€9) |
| Total 54 countries | 4435 852 (4.1) | 7091 813 (6.5) | €61 590 533 (€57) | 2177 503 (2.0) | 3676 274 (3.4) | €28 804 049 (€27) | 1089 707 (1.0) | 1458 663 (1.3) | €11 180 705 (€10) |
Productivity losses due to CVD in EU-28 in 2018
CVD accounted for 1.8 million deaths in the EU in 2018, representing 1.5 million potential years of work lost, which were estimated at €37.1 billion (see Table 1). In terms of deaths per 1000 citizens, the average was 3.6 and varied from 1.8 in Belgium and Ireland to 10.2 in Bulgaria. In terms of working years lost per 1000 citizens, the average was 2.9 and varied from 0.8 in Belgium to 11.0 in Latvia. Averaged across EU-28 population, this corresponded to €72 in lost earnings per capita, varying from €34 in Belgium to €115 in Latvia. Adjusting for price differentials, the range of costs increased across the EU-28 from €32 in Belgium to €167 in Latvia (see Figure 1A and Supplementary material online, Table S5).
Figure 1.

Productivity losses due to CVD premature mortality per capita in 2018. (A) EU countries. (B) Non-EU countries.
The main cause of CVD death was CHD, accounting for 34% (0.6 million deaths) of all deaths, followed by cerebrovascular diseases with 22% (0.4 million deaths). In terms of productivity losses, CHD and cerebrovascular disease accounted for 43% (€16.1 billion, €31 per capita) and 17% (€6.3 billion, €12 per capita), respectively, of all CVD-related losses. However, there was considerable variation across these countries in the proportion of losses due to CHD and cerebrovascular diseases. The proportion of losses attributable to CHD varied from 23% in Bulgaria to 63% in Cyprus. For cerebrovascular diseases, the proportion of total losses varied from 11% in Luxembourg to 27% in Portugal.
Productivity losses due to CVD in ESC member countries not part of the EU
CVD accounted for 2.6 million deaths in the remaining 26 ESC countries, representing 5.6 million potential years of work lost (see Table 2). CVD cost €24.5 billion in lost earnings, after adjusting for employment rates and discounted to present values. In terms of deaths per 1000 citizens, the average was 4.5 and varied from 1.3 in Israel to 10.1 in Ukraine. In terms of working years lost per 1000 citizens, the average was 9.8 and varied from 1.7 in Norway to 30.3 in Georgia. This corresponded to €43 in lost earnings per capita in these countries, varying from €6 in Algeria to €133 in Switzerland. Adjusting for price differentials, the range of productivity losses increased across countries from €14 per capita in Algeria to €247 per capita in Georgia (see Figure 1B). Using income categories from the World Bank, there was still considerable variation across countries in the same income group (see Supplementary material online, Table S5).
The main cause of CVD death was CHD, accounting for 60% of all deaths, followed by cerebrovascular diseases with 26%. In terms of productivity losses, CHD and cerebrovascular disease accounted for 52% (€12.7 billion, €22 per capita) and 20% (€4.9 billion, €9 per capita), respectively, of all CVD-related losses. However, there was considerable variation across these countries in the proportion of losses due to CHD and cerebrovascular diseases. The proportion of losses due to CVD attributable to CHD varied from 28% in Serbia to 83% in Lebanon. For cerebrovascular diseases, the proportion of total losses varied from 7% in Lebanon to 34% in North Macedonia.
Supplementary material online, Tables S6 and S7 report the ranking of countries by income category in terms of productivity losses per capita (PPP-adjusted) due to CHD and stroke. Amongst high- income countries, Lithuania (€71 due to CHD and €23 due to stroke) and Latvia (€67 due to CHD and €31 due to stroke) had the highest losses per capita, whereas Liechtenstein (€5 due to CHD and €5 due to stroke) and Belgium (€13 due to CHD and €4 due to stroke) reported the lowest losses for both conditions. Amongst upper-middle-income countries, Kazakhstan reported the highest losses per capita (€93 due to CHD and €50 due to stroke), whereas Algeria reported the lowest losses per capita (€9 due to CHD and €3 due to stroke). Finally, amongst lower-middle-income countries, Georgia reported the highest losses per capita (€130 due to CHD and €79 due to stroke), whereas Tunisia reported the lowest losses per capita (€13 due to CHD and €3 due to stroke).
Associations with CVD-related productivity losses per capita in ESC countries
Table 3 reports the OLS results examining associations with productivity losses (PPP adjusted) across the 54 countries. In terms of single analysis, we found a positive significant association between CVD-related productivity losses and incidence of CVD amongst 15–64-year-olds (P = 0.008), with each additional case per 1000 persons increasing CVD-related costs by €9.6 (see Supplementary material online, Figure S2). We also found significant associations between CVD productivity losses and healthcare expenditure as a proportion of GDP (P = 0.031), with each additional 1% of healthcare expenditure decreasing CVD-related productivity losses by €0.5 (see Supplementary material online, Figure S3). However, we found no association between CVD-related productivity losses and CVD incidence and healthcare expenditure in the multivariable analysis.
Table 3.
Marginal effects (ME) on productivity losses due to CVD premature death
| Dependent variable | CVD cost per capita (€, adjusted for PPP) | |
|---|---|---|
| Type of analysis | Single | Multivariable |
| Variables | ME (95% CI) | ME (95% CI) |
| 1 additional hospital bed per 1000 persons | 5.47 (−0.22 to 11.17) | 2.41 (−4.86 to 9.68) |
| 1 additional CVD case (incident) per 1000 persons | 9.62 (2.69 to 16.54) | 7.86 (−1.06 to 16.78) |
| €1000 increase in GPD per capita | −0.18 (−0.39 to 0.03) | 0.16 (−0.30 to 0.62) |
| 1% increase in healthcare expenditure out of GDP | −6.37 (−12.16 to −0.59) | −5.75 (−12.24 to 0.74) |
| 1% increase in out-of-pocket expenditure out of healthcare expenditure | 0.27 (−0.44 to 0.99) | −0.03 (−0.94 to 0.88) |
Marginal effects measure how much CVD costs per capita change when a specific variable changes, holding all other variables constant.
CVD deaths between 2000 and 2018
The total number of deaths due to CVD decreased from 4.8 million in 2000 to 4.6 million in 2010 and 4.4 million in 2018 (see Figure 2 and Supplementary material online, Tables S8andS10). Over the same time period, there was a significant increase in the number of deaths due to all causes, from 10.0 million in 2000 to 10.3 million in 2018. Hence, the proportion of all deaths due to CVD fell from 48% in 2000 to 46% in 2010 and 43% in 2018.
Figure 2.

Deaths due to all causes (white bar) and CVD (grey bar) in EU-27 and the UK between 2000 and 2018. Black line represents proportion of all-cause deaths due to CVD. (A) All ages. (B) 15–64-year- olds.
About 20% of all CVD deaths in 2000 occurred between 15 and 64 years of age, falling to 18% between 2015 and 2018. Among 15–64-year-olds, CVD accounted for 33% of all deaths in 2000, 33% in 2010 and 32% in 2018. However, there was considerable variation across countries over time (see Supplementary material online, Tables S9andS11 and Figure S1). For example, five countries (Azerbaijan, Bulgaria, Egypt, Morocco, and Uzbekistan) reported the proportion of all deaths due to CVD above 40% in 2018, whereas France and Israel reported the lowest proportion at 13% and 12%, respectively.
Discussion
Across 54 ESC member countries, we estimated the total lost earnings due to CVD-related premature mortality to be €62 billion a year in 2018, of which 60% were incurred in 28 EU member countries. The higher the proportion of healthcare expenditure, the lower the productivity losses per capita, holding all else constant. The higher the incidence of CVD, the higher the productivity losses per capita, holding all else constant. However, these associations do not imply causality and lost significance in multivariable analysis.
For the first time, this study assesses the mortality losses associated with CVD, CHD, and cerebrovascular disease across the whole of Europe, including countries in the European periphery, including Northern Africa, the Middle East, and former Soviet Republics in Asia. Furthermore, we were able to compare our results with previous work in which we estimated the productivity losses due to CVD mortality for the EU in earlier years. In 2003, we estimated these losses to be €24 billion for the 25 countries forming the EU at the time.4 These costs rose to €27 billion in 2009 (27 EU countries)13 and to €32 billion in 2015 (28 EU countries).5 In our current analysis, we estimated total productivity losses due to CVD mortality to be €37 billion for 2018. The increase in costs is explained by changes in employment rates and increase in average earnings from 2009 to 2018. For example, in 2018 prices, the productivity losses in 2015 were estimated at €34 billion compared with €37 billion in 2018 despite a decrease of about 75 000 CVD-related deaths. However, the number of potential years of work lost was similar in both years (1.5 million) due to an increase in employment rates since 2015. By using the same methodology to estimate the cost of CVD over time, it is possible to reliably compare the impact of CVD mortality on lost earnings over time. This comparative evidence is useful to decision-makers and health policy planners by informing evaluations of the impact of public health interventions, for example, in evaluating the societal benefits of addressing CVD risk factors.
The accuracy of our study depends on the quality and availability of comparable CVD-related data across countries. Our study included 54 countries, for each of which we required the identification of comparable data on mortality, earnings, and employment rates by sex and age group. This required consulting and using a wide range of sources to conduct comprehensive analyses. Importantly, data on deaths due to CVD, CHD, and cerebrovascular disease were derived from two main sources: EUROSTAT for EU member states or those with close links to the EU; and the Global Burden of Disease for the remainder. As a result, some of the differences identified between mainly relatively wealthy Western European countries and non-EU countries in Eastern Europe, the Middle East, and North Africa could be due to differing methodologies on how disease-specific deaths were calculated. Given the large numbers of countries included in this study, and the fact that for EU countries comparisons can be made to over 15 years of previous data, these results are important to policy-makers. Data on costs of CVD premature mortality can aid decisions about the allocation of national resources, including service provision, prevention strategies, and future research funding. They allow for benchmarks to be set up across the over 50 countries under study in order to identify the most efficient public policy initiatives and healthcare systems capable of achieving the best CVD outcomes.
We used the human capital approach to estimate productivity losses, as it is fairly transparent and can be quantified using available data, and is consistent with and permits comparisons with previous work on CVD and other conditions such as cancer, blood disorders, and dementia.4–10 However, it does have limitations, for example, by failing to value many socially valuable activities that are not remunerated as formal employment, such as much housework, caring, and volunteer activities. Alternative methods of valuing lives and life years, such as willingness to pay, have been proposed and discussed, but there is little consensus at present on which approach is best or on how these might be readily operationalized using existing data.14,15 Furthermore, our estimates comprise productivity losses due to CVD mortality alone. This does not comprise CVD-related morbidity losses, which are likely to be significant in terms of individuals being declared incapacitated or disabled because of CVD or taking sickness leave for a defined time period.
Our study provides a snapshot of the economic consequences outside the healthcare system posed by CVD in terms of lost earnings to 54 ESC member countries in 2018. Together with the evidence we have gathered over the last 15 years, it indicates that these costs are increasing over time, despite the decrease in CVD mortality. Comparative results across time and countries are important for policymakers to track the effect of public health interventions and treatments with the objective of contributing to maximizing social welfare in their countries.
Supplementary Material
Acknowledgement
The opinions and conclusions in this study are not necessarily those of the European Society of Cardiology.
Contributor Information
Ramon Luengo-Fernandez, Health Economics Research Centre, Nuffield Department of Population Health, University of Oxford, Oxford, OX3 7LF, UK.
Matthew Little, Health Economics Research Centre, Nuffield Department of Population Health, University of Oxford, Oxford, OX3 7LF, UK.
Alastair Gray, Health Economics Research Centre, Nuffield Department of Population Health, University of Oxford, Oxford, OX3 7LF, UK.
Aleksandra Torbica, Centre for Research on Health and Social Care Management (CERGAS), Bocconi University, Milan, 20136, Italy.
Aldo P Maggioni, ANMCO Research Center, Firenze, 50121, Italy.
Radu Huculeci, European Heart Agency, European Society of Cardiology, Brussels, 1000, Belgium.
Adam D Timmis, William Harvey Research Institute, Queen Mary University London, London, EC1M 6BQ, UK.
Panos Vardas, European Heart Agency, European Society of Cardiology, Brussels, 1000, Belgium; Hygeia Hospitals Group, HHG, Athens, 151 23, Greece.
Jose Leal, Health Economics Research Centre, Nuffield Department of Population Health, University of Oxford, Oxford, OX3 7LF, UK.
Author contributions
R.L.-F., A.G., and J.L. conceived the study, contributed to study design, and obtained funding. R.L.-F., M.L., and J.L. performed the analyses and wrote the manuscript. All authors interpreted the results, revised the manuscript, and approved the final version of the manuscript. J.L. is the guarantor of this paper.
Funding
This work was supported by an unrestricted grant from the European Society of Cardiology (ESC).
Conflict of interest: J.L., A.G., and R.L.-F. report research grants from the ESC. A.D.T. has stock in two start-up companies, receiving no income from these investments. A.T. has a consultancy agreement with ESC. A.P.M. reports payments from AstraZeneca and Bayer for participation in study committees in areas outside the present work. P.V. reports consulting fees from Servier International, Hygeia Hospital Group, and ESC. R.H. and M.L. report no disclosures.
Data availability
The data underlying this article will be shared on reasonable request to the corresponding author.
References
- 1. World Health Organisation . Global Health Estimates 2020: deaths by cause, age, sex, by country and by region, 2000–2019. https://www.who.int/data/gho/data/themes/mortality-and-global-health-estimates/ghe-leading-causes-of-death (accessed 16 March 2021). [Google Scholar]
- 2. World Health Organisation . Global Health Estimates 2020: disease burden by cause, age, sex, by country and by region, 2000–2019. https://www.who.int/data/gho/data/themes/mortality-and-global-health-estimates/global-health-estimates-leading-causes-of-dalys (accessed 16 March 2021). [Google Scholar]
- 3. Grossman M. Chapter 7—The human capital model. In: Culyer AJ, Newhouse JP (eds). Handbook of Health Economics: Elsevier; 2000, 347–408 [Google Scholar]
- 4. Leal J, Luengo-Fernández R, Gray A, Petersen S, Rayner M.. Economic burden of cardiovascular diseases in the enlarged European Union. Eur Heart J 2006;27:1610–1619. [DOI] [PubMed] [Google Scholar]
- 5. Wilkins EWL, Wickramasinghe K, Bhatnagar P, Leal J, Luengo-Fernandez R, Burns Ret al. European Cardiovascular Disease Statistics 2017. http://www.ehnheart.org/images/CVD-statistics-report-August-2017.pdf (accessed 16 March 2021). [Google Scholar]
- 6. Burns R, Leal J, Sullivan R, Luengo-Fernandez R.. Economic burden of malignant blood disorders across Europe: a population-based cost analysis. Lancet Haematol 2016;3:e362–e370 [DOI] [PubMed] [Google Scholar]
- 7. Leal J, Luengo-Fernandez R, Sullivan R, Witjes JA.. Economic burden of bladder cancer across the European Union. Eur Urol 2016;69:438–447. [DOI] [PubMed] [Google Scholar]
- 8. Luengo-Fernandez R, Leal J, Gray A, Sullivan R.. Economic burden of cancer across the European Union: a population-based cost analysis. Lancet Oncol 2013;14:1165–1174. [DOI] [PubMed] [Google Scholar]
- 9. Luengo-Fernandez R, Burns R, Leal J.. Economic burden of non-malignant blood disorders across Europe: a population-based cost study. Lancet Haematol 2016;3:e371–e378. [DOI] [PubMed] [Google Scholar]
- 10. Luengo-Fernandez R, Leal J, Gray AM.. Cost of dementia in the pre-enlargement countries of the European Union. J Alzheimers Dis 2011;27:187–196. [DOI] [PubMed] [Google Scholar]
- 11. EUROSTAT . Your key to European Statistics. https://ec.europa.eu/eurostat/data/database (accessed 27 April 2021). [Google Scholar]
- 12. World Bank . World Development Indicators database: PPP conversion factor, GDP (LCU per international $). https://data.worldbank.org/indicator/PA.NUS.PPP (accessed 27 April 2021). [Google Scholar]
- 13. Nichols MTN, Scarborough P, Luengo-Fernandez R, Leal J, Gray A, Scarborough Pet al. European Cardiovascular Disease Statistics 2012. Brussels: European Heart Network, 2012. [Google Scholar]
- 14. Johannesson M, Karlsson G.. The friction cost method: a comment. J Health Econ 1997;16:249–255. [DOI] [PubMed] [Google Scholar]
- 15. van den Hout WB. The value of productivity: human-capital versus friction-cost method. Ann Rheum Dis 2010;69:i89–i91. [DOI] [PubMed] [Google Scholar]
Associated Data
This section collects any data citations, data availability statements, or supplementary materials included in this article.
Supplementary Materials
Data Availability Statement
The data underlying this article will be shared on reasonable request to the corresponding author.