

Abstract

Aucubin (AU) is an active ingredient that exerts strong antioxidant and anti-inflammatory effects in the treatment of several diseases. In order to improve the efficiency of resource utilization of traditional biomass waste, Eucommia ulmoides seed-draff (EUSD) waste biomass was used as the raw material, and a series of deep eutectic solvents were selected to evaluate the extraction efficiency of aucubin from EUSD. A response surface experiment was designed based on a single-factor experiment to optimize the extract conditions. The results showed that the best conditions for aucubin extraction were an HBD–HBA ratio of 2.18, a liquid–solid ratio of 46.92 mL/g, a water percentage of 37.95%, a temperature of 321.03 K, and an extraction time of 59.55 min. The maximum amount of aucubin was 156.4 mg/g, which was consistent with the theoretical value (156.8 mg/g). Then, the performance of 12 resins for adsorption and desorption was contrasted. The results revealed that HPD950 resin exhibited the best performance, with an adsorption capacity of 95.2% and a desorption capacity of 94.3%. Additionally, the pseudo-second-order model provided the best match to the kinetics data, the Langmuir model provided the best fit to the isotherm data, and adsorption was a beneficial, spontaneous, exothermic, and physical process. In the recyclability test, the HPD950 resin had great potential and excellent sustainability in aucubin recovery. In the antioxidant activity study, the aucubin extract exerted a strong antioxidant ability with scavenging capabilities for four free radicals. Furthermore, the antifungal activity study found that the aucubin extract exhibited a good antifungal effect against 5 tested pathogens. The research results can provide a theoretical basis for the extraction of high-value components from waste biomass by deep eutectic solvent and a certain application value for the development and utilization of natural aucubin products.
1. Introduction
Eucommia ulmoides (E. ulmoides) has a history of more than 2000 years in China as a traditional Chinese medicine.1−3 It has a wide range of biological activities, including antihypertensive,4,5 antiobesity,6,7 antioxidative,8,9 and anti-inflammatory10,11 effects to strengthen the human immune and internal systems. E. ulmoides seed-draff (EUSD) waste biomass is the oily residue of the E. ulmoides seeds (EUS) after oil extraction; it can be extracted as aucubin (AU) as a high-value natural product rather than discarded. Aucubin is a C4 desmethyl-cycloalkenyl terpene compound,12,13 and numerous pharmacological activities are carried out by aucubin in different parts of EU, such as anti-inflammatory,14,15 antioxidative,16,17 antiaging,18,19 antiosteoporosis,20,21 antitumor,22,23 and liver-protecting activities.24,25 There are many medications and detergents that contain aucubin as the main medicinal ingredient, including hair dyes containing aucubin.
A variety of new extraction technologies have gradually been used in the assessment of aucubin extraction, such as ultrasound extraction (UAE),26 microwave extraction (MAE),27 solid-phase extraction (SPE),28 and supercritical extraction (SPE).29 Compared to conventional organic solvents, in recent years, deep eutectic solvent (DES) has emerged and attracted increasing interest as a family of formidable green solvents for natural product extraction due to low toxicity and high biodegradability in recent years. DES is a eutectic mixture formed by two or more components forming hydrogen bonds.30,31 Since it is liquid at room temperature and has functions similar to those of traditional solvents, it has attracted widespread attention. The components of DES include the hydrogen bond donor (HBD) and hydrogen bond acceptor (HBA), which can be biodegraded and meet the requirements of green chemistry. Moreover, DES has a simple preparation process and strong designability and is expected to become a green substitute for traditional solvents. There is a strong hydrogen bonding between two or more components in DES, which makes them have stronger penetration ability and the dissolution rate of active ingredients.32,33 Xing et al. effectually tested the use of DES-based ultrasound for the extraction of isoliquiritigenin (ISL) and glabridin (GLA) from Licorice (Glycyrrhiza glabra).34 Liu et al. confirmed the possibility to apply DES for the Glabridin extraction from the G. glabra residue.35 Additionally, most active compounds of flavonoids,36,37 terpenoids,38 and polyphenol39,40 could be efficiently extracted from natural plants by DES.
The method of macroporous resin adsorption has been extensively used in the purification of natural products.35,41 There are typically two steps in the procedure. First, the resin directly adsorbed the target component from the crude extracts with selectivity and concentration properties. Then, the resin can be reused once the desired component has been eluted using a tiny amount of organic solvent (usually ethanol). This method is effective, simple, practical, and environmentally friendly.
Currently, there are few studies on the extraction and purification of aucubin with DES and macroporous resins. One of the major issues is how to enrich and isolate aucubin from EUSD. Furthermore, there are still concerns about the utilization and recycling of macroporous resin. Therefore, it is important and necessary to explore a novel technique for extracting aucubin from EUSD with a high yield and purity. Our goal in this study is to explore a macroporous resin-based efficient technique to enrich and separate aucubin from EUSD. To find the best resin for aucubin separation, 12 different types of macroporous resin were examined and contrasted based on their adsorption and desorption properties. Scale-up purification and resin recyclability were also taken into account during the procedure. The extraction process was optimized to improve the extraction yield of aucubin, provide theoretical support for the effective utilization of EUSD, and expand the application fields of DES and macroporous resin. Finally, the antioxidant activity and antifungal activity against five tested pathogens (Rhizoctonia solani, Pyricularia oryzae, Sclerotinia sclerotiorum, Cercospora arachidicola, and Fusarium oxysporumf. sp. cucumerinum) of aucubin extract were investigated, which provide a theoretical reference for the application of natural product.
2. Material and Methods
2.1. Raw Material and Chemicals
The raw material for EUSD was supplied by Jishou University (Jishou, China). Before use, dried EUSD was ground and sieved through a mesh size of 200–300 μm while being kept in a vacuum drier. The macroporous resins ADS-8, HP20, XAD-1, H103, NKA-2, XAD-1180, LS-A40, EXA-45, ADS-11, S8, LS-305, and HPD950 were obtained from Beijing Solebo Technology (Beijing, China). Choline chloride (≥98.0%), urea (≥99.5%), acetic acid (≥99.8%), propionic acid (≥99.0%), citric acid (≥99.5%), oxalic acid (≥99.0%), malic acid (≥99.0%), lactic acid (≥85.0%), levulinic acid (≥99.0%), glycerol (≥99.0%), and ethylene glycol (≥98.0%) were purchased from Aladdin Bio-Chem Technology Co., Ltd. (Shanghai, China). Aucubin standard (≥98.0%) was purchased from China National Pharmaceutical Group Chemical Reagent Co., Ltd. (Shanghai, China), and other reagents were purchased from Fuchen Chemical Reagent Co., Ltd. (Tianjin, China) and used without further purification. Fresh deionized water was used during all of the experimental processes.
2.2. Preparation of Natural Deep Eutectic Solvents
Different types of HBA (choline chloride, ChCl) and HBD (urea, acetic acid, propionic acid, citric acid, oxalic acid, malic acid, lactic acid, levulinic acid, glycerol, and ethylene glycol) were mixed and stirred with a magnetic stirrer for 30–60 min at 353.15 K to form a clear liquid. Then, 20% (v/v) of water was added and stirred for 30 min to obtain homogeneous and clear DES (ChUre, ChAce, ChPro, ChCit, ChOxa, ChMal, ChLac, ChLev, ChGly, and ChEG) solvents.34,42
2.3. Preparation of Standard Solution
Twenty-five milligrams of aucubin was accurately weighed, sonicated with methanol, and fixed in a 5 mL volumetric flask. Then, it was filtered using a 0.22 μm microporous membrane (Jinteng Co. Ltd., Tianjin, China) and was used as a standard solution (5 mg/mL). The solution was diluted to 4.2, 3.4, 2.6, 1.8, 1.0, and 0.2 mg/mL, respectively.
2.4. Selection of Optimal DES Solvent for the Recovery of Aucubin
Ten grams of EUSD was accurately weighed and transferred to a flask, and then the DES solvent was added under the same conditions (DES composition molar ratio of 1:2, liquid–solid ratio of 40 mL/g, water percentage of 30%, temperature of 318.15 K, and extraction time of 60 min). After the reaction, the reactant was filtered, and the residues were rinsed with water and dried to constant mass. The extracted solution was filtered through a 0.22 μm microporous membrane (Jinteng Co. Ltd., Tianjin, China) and finally was detected by high-performance liquid chromatography (HPLC) to detect the aucubin content in the extract.
2.5. Characterization of EUSD before and after Extraction
Using a Micromeritics TriStar II 3020 analyzer to measure nitrogen adsorption/desorption isotherms at 77.3 K, the Brunauer–Emmett–Teller (BET) surface areas and pore volumes of the samples were determined. Before measurement, the samples were degassed at 373.15 K for 12 h.
2.6. Design of Single-Factor Experiments
Ten grams of EUSD was accurately weighed and transferred to a flask, and then the DES solvent was added. The effect of the DES composition molar ratio (1:1, 1:2, 1:3, and 1:4), liquid–solid ratio (10, 20, 30, 40, 50, and 60 mL/g), water percentage (0, 10, 20, 30, 40, and 50%), extraction temperature (298.15, 308.15, 318.15, 328.15, and 338.15 K), and time (30, 60, 90, and 120 min) on the aucubin yield was designed to test and analyze. Each of the treatment groups described above was repeated three times, and the data were collected.
2.7. HPLC Analysis and Quantification
A 0.22 μm microporous membrane was used to filter both the standard and extract solutions (Jinteng Co. Ltd., Tianjin, China) and finally taken as a test solution (detailed analysis provided in the Supporting Information). The HPLC chromatograms of the standard and extract are depicted in Figure S1. To ensure precision, three duplicates of each sample were performed.
2.8. Response Surface Optimization Design of Experiments
According to the results of the single-factor test, aucubin extraction was optimized using ChAce as the DES solvent. Five factors—DES composition, molar ratio, liquid/solid ratio (mL/g), water percentage (%), extraction temperature (K), and time (min)—were selected as experimental reference variables, and the aucubin amount was used as the response value. The specific factor level design of the Box–Behnken experimental using Design-Expert 13 (Stat-Ease) is shown in Table S1.
2.9. Static Adsorption and Desorption Tests
2.9.1. Resin Screening
One gram of resin and 30 mL of aucubin extract (4.08 mg/mL) were added to a conical flask. A thermostated water bath shaker (120 rpm) was used to shake the flask for 24 h at 298.15 K. A thermostatic water bath shaker (120 rpm) was used to shake the flask for 24 h at 298.15 K. Following this, the aucubin-laden resin was first washed thoroughly with distilled water, and then a 30 mL solution of 95% ethanol was used to desorb it under stirring (120 rpm) for 24 h at 298.15 K. The experiments were conducted in three parallels. The selection of resin was performed according to the adsorption/desorption capacity ratio, and its calculation formula is as follows.43
| 1 |
| 2 |
| 3 |
where qe and qd (mg/g) represent the adsorption capacity and desorption capacity, respectively; C0, Ce, and Cd (mg/mL) represent the initial concentration, equilibrium concentration, and desorption concentration, respectively; Vi and Vd (mL) represent the sample volume and eluate volume, respectively; D (%) represents the desorption ratio; and W (mg) represents the dry weight of the resin.
2.9.2. Adsorption Kinetics
One gram portion of resin and 30 mL of aucubin extract (4.08 mg/mL) were added to a conical flask under stirring (120 rpm) at 298.15 K. A sample of 0.2 mL was collected, and it was examined at specific intervals. The experiments were conducted in three parallels. The adsorption process was analyzed by three adsorption kinetic models as follows.43
| 4 |
| 5 |
| 6 |
where qe (mg/g) and qt (mg/g) represent the adsorption capacity at equilibrium and time t (min), respectively; k1 (min–1), k2 [g/(mg·min)], and ki [mg/(g·min0.5)] represent the rate constants of the pseudo-first-order model, pseudo-second-order model, and intraparticle diffusion model, respectively. Ci (mg/g) is a constant that depends on the thickness of the boundary layer.
2.9.3. Adsorption Isotherm and Thermodynamics
One gram of resin was put into conical flasks with 30 mL of aucubin extract (1.02, 2.04, 3.06, 4.08, 5.10, and 6.12 mg/mL) under stirring (120 rpm) at 298.15, 308.185, and 318.15 K. Three parallel experiments were conducted. Adsorption isotherms were produced in accordance with the predicted Ce and qe once adsorption equilibrium had been reached. In this paper, the Langmuir, Freundlich, and Temkin equations were used to simulate the equilibrium data.43
Langmuir equation
| 7 |
Freundlich equation
| 8 |
Temkin equation
| 9 |
where KL (L/mg), KF [(mg/g)·(L/mg)1/n], and KT (L/mg) represent the equilibrium constant for the Langmuir, Freundlich, and Temkin model, respectively; qm (mg/g) represents the maximum adsorption capacity; n is the Freundlich constant related to the heterogeneity of the adsorbent surface; and BT = RT/b, b (J/mol) is the Temkin constant related to the heat of adsorption.
The Gibbs free energy (ΔG), entropy (ΔS), and enthalpy (ΔH) were calculated for the thermodynamic analysis of the adsorption process, and the formula is as follows.44
| 10 |
| 11 |
where R (8.314 J·mol–1·K–1) is the universal gas constant, T is the absolute temperature (K), and K0 is the standard adsorption equilibrium constant (dimensionless).
The value of K0 can be calculated using the equilibrium constant KL for the Langmuir model, and the formula is as follows.45,46
| 12 |
2.10. Dynamic Adsorption and Desorption Tests
Ten grams of resin (dry weight basis) was placed in a glass column with an inner diameter of 12 mm × 500 mm (a BV of 15 mL). After all bubbles were drained, an appropriate amount of quartz sand was placed on top of the column to prevent the resin from loosening. At room temperature, the sample solution containing the appropriate concentration of aucubin (4.08 mg/mL) was passed through the resin bed at different flow rates (1.5, 3, and 4.5 BV/h). The effluent was gathered and analyzed at 30 mL intervals. Then, the sample-laden columns were eluted under different ethanol concentrations (30, 40, 50, 60, 70, 80, and 90%) at 1.5 BV/h and elution rates (1.5, 3.0, and 4.5 BV/h) using the optimal elute agent, respectively. The desorption solution was collected in sections at 10 mL intervals, and then the concentration was detected by HPLC and the dynamic desorption curve was created.
2.11. Scale-up Purification and Recyclability Tests
Aucubin was purified on a larger scale using a glass column (100 mm × 1500 mm) packed with HPD950 resin (a BV of 6.9 L) based on the improved results of the previous small-scale purification. The column was loaded with 8 BV of an aqueous aucubin extract solution (4.08 mg/mL) for adsorption at a rate of 1.5 BV/h. The column was initially eluted with 5 BV of water for desorption and then with 6 BV of 60% EtOH at 1.5 BV/h. The 60% EtOH was concentrated under lowered pressure and 328.15 K. Finally, the purity and recovery of aucubin were determined. The recovery yield of aucubin was calculated as follows
| 13 |
where Y (%) represents the recovery yield of aucubin, Cd represents the concentration of aucubin in the desorption solution (mg/L), Vd represents the volume of desorption solution (mL), C0 represents the initial concentration of aucubin (mg/L), Ca represents the concentration of aucubin in the eluent after adsorption (mg/L), and Vp represents the processing volume of the sample solution (mL).
The recyclability test was conducted according to the optimal process for the adsorption and desorption of aucubin, and the resin was continuously loaded and reused.
2.12. Antioxidant Activity Test
See the Supporting Information for further details.
2.13. Antifungal Activity Test
See the Supporting Information for further details.
3. Results and Discussion
3.1. Screening of DES
Since DES has different physicochemical properties, such as viscosity, polarity, and pH, its structure is important for extraction efficiency.47 The purpose of this study is to screen 14 DES systems for their performance in extracting aucubin from EUSD. According to reports, the high viscosity of DES could impede mass transfer and limit its use.48 Hence, different DESs blended with a moisture content of 20% (v/v) were employed, and the physicochemical properties and extraction yields are summarized in Table 1. The results show that ChAce performed the highest extraction efficiency in extracting aucubin compared to other DESs. The pH value of DES may affect the intermolecular interaction between the solute and solvent, resulting in a different extraction efficiency of the target compound from the sample matrix.49Table 1 shows that the extraction efficiency of DES with a pH of about 3 is higher than that of other DES. This may be due to the existence of alcoholic O–H group in aucubin. In addition, it was found that the increment of aucubin amount coincided with growing SBET and Vpore after extraction. There was damage to the cell wall structure, which made it easier for the DES solvent to penetrate the cells, thereby reducing mass transfer resistance and accelerating aucubin leaching.
Table 1. Aucubin Yield with Different Solvents and the Textural Parameters of the Sample before and after Extractiona.
|
SBET (m2/g) |
Vpore (cm3/g) |
||||||
|---|---|---|---|---|---|---|---|
| DES | pH | viscosity (mPa·s) | aucubin yield (mg/g)a | before extraction | after extraction | before extraction | after extraction |
| ChUre | 7.26 | 16.5 | 78.6 ± 1.02 | 1.32 | 14.38 | 0.08 | 0.17 |
| ChAce | 2.85 | 15.6 | 143.5 ± 0.56 | 1.32 | 23.16 | 0.08 | 0.23 |
| ChPro | 2.26 | 13.8 | 137.2 ± 1.12 | 1.32 | 22.08 | 0.08 | 0.23 |
| ChCit | 0.48 | 27.6 | 48.4 ± 0.62 | 1.32 | 10.75 | 0.08 | 0.13 |
| ChOxa | 0.11 | 50.8 | 31.5 ± 0.78 | 1.32 | 8.68 | 0.08 | 0.10 |
| ChMal | 0.22 | 560 | 37.3 ± 0.95 | 1.32 | 9.12 | 0.08 | 0.11 |
| ChLac | 0.85 | 26.9 | 62.4 ± 0.13 | 1.32 | 11.18 | 0.08 | 0.15 |
| ChLev | 1.09 | 103 | 70.3 ± 0.58 | 1.32 | 12.75 | 0.08 | 0.16 |
| ChGly | 6.75 | 876 | 112.5 ± 0.76 | 1.32 | 20.78 | 0.08 | 0.21 |
| ChEG | 6.89 | 378 | 103.8 ± 0.89 | 1.32 | 18.35 | 0.08 | 0.19 |
Extraction conditions: DES composition molar ratio of 1:2, liquid–solid ratio of 40 mL/g, water percentage of 30%, temperature of 318.15 K, and extraction time of 60 min. The aucubin amount (mg/g) is expressed based on mg of aucubin equivalent per g of raw material (mg aucubin/g raw material) and the results are expressed as mean ± standard deviation (n = 3).
3.2. Single-Factor Investigation of the Extraction Process
Different molar ratios of choline chloride to hydrogen bond donors can affect the surface tension and viscosity of solvents, thus affecting the extraction efficiency. Therefore, the effect of the DES composition molar ratio on the extraction efficiency was studied, and Figure 1a shows that the optimal DES composition (HBA–HBD) molar ratio is 1:2.
Figure 1.

Single-factor investigation of the extraction process (a) liquid–solid ratio of 50 mL/g, water percentage of 40%, temperature of 318.15 K, and extraction time of 60 min; (b) DES composition molar ratio of 1:2, water percentage of 40%, temperature of 318.15 K, and extraction time of 60 min; (c) DES composition molar ratio of 1:2, liquid–solid ratio of 50 mL/g, temperature of 318.15 K, and extraction time of 60 min; (d) DES compositions: molar ratio of 1:2, liquid–solid ratio of 50 mL/g, water percentage of 40%, and extraction time of 60 min; (e) DES composition: molar ratio of 1:2, liquid–solid ratio of 50 mL/g, water percentage of 40%, and temperature of 318.15 K.
It can be seen from Figure 1b that the yield of the aucubin amount showed a trend of first increasing and then stabilizing with the increase of the liquid–solid ratio, and an inflection point appeared when the liquid–solid ratio was 50 mL/g. An appropriate liquid–solid ratio is conducive to the extraction of chemical components. The aucubin was extracted completely when the liquid–solid ratio reached 50 mL/g, so the optimum liquid–solid ratio was 50 mL/g.
Figure 1c shows the effect of water percentage on aucubin extraction. Aucubin yield increased with the increased water volume fraction, which reached the highest at a percentage of 40%. The reason may be that the high water content could increase the polarity of the extraction medium, which destroyed the hydrogen bonding between the DES solvent and aucubin, thus causing a negative impact on the extraction of aucubin.50
The extract temperature is an important factor for the effective mass transfer. Figure 1d shows that the aucubin amount increased until 318.15 K and then decreased from 328.15 K onward. The possible reason is that the thermal effect increased with an increase in temperature, which accelerated the dissolution of aucubin in the cells and increased the extraction amount. As the temperature further increased, some aucubin destructed, and the dissolution of impurities increased, thereby reducing the extraction yield of aucubin.
As depicted in Figure 1e, the aucubin yield first increased and then decreased with the increase in the extract time. The reason may be that the extension of extract time helped to improve the concentration of solvent and solute. However, with the prolongation of time, the local temperature of the extraction system was too high, so that part of the aucubin was decomposed, and the extraction rate decreased. Therefore, the optimal extract time is selected as 60 min.
3.3. Optimization of Extraction Conditions by Response Surface Methodology (RSM)
3.3.1. Analysis of Quadratic Multiple Regression Model
After fitting regression, the quadratic response surface regression equation of the aucubin extraction rate relative to the actual value of each factor is obtained in Tables 2 and 3. It can be seen that the model of aucubin extraction rate P < 0.0001 indicates that the regression equation has high reliability and the result is effective. The lack of fit item P > 0.05 indicates that it is not significant relative to the pure error, thus suggesting that the model has a high degree of fitting, the actual value is highly consistent with the predicted value, and the error of the experimental result has little influence on the experimental result.
Table 2. ANOVA and Fit Statistics of the Aucubin Amount.
| aucubin amount source | sum of sq. | df | M. sq. | F-value | P-value | prob > F | index mark | value |
|---|---|---|---|---|---|---|---|---|
| model | 31519.13 | 20 | 1575.96 | 5944.39 | <0.0001 | significant | std. dev. | 0.5149 |
| A—HBD–HBA ratio | 329.42 | 1 | 329.42 | 1242.56 | <0.0001 | mean | 106.49 | |
| B—liquid–solid ratio | 1944.81 | 1 | 1944.81 | 7335.68 | <0.0001 | C.V. % | 0.4835 | |
| C—water percentage | 3155.63 | 1 | 3155.63 | 11902.80 | <0.0001 | R2 | 0.9998 | |
| D—temperature | 2.33 | 1 | 2.33 | 8.77 | 0.0066 | adjusted R2 | 0.9996 | |
| E—time | 1624.09 | 1 | 1624.09 | 6125.94 | <0.0001 | predicted R2 | 0.9992 | |
| AB | 19.36 | 1 | 19.36 | 73.02 | <0.0001 | A. Prec. | 273.2020 | |
| AC | 3.42 | 1 | 3.42 | 12.91 | 0.0014 | |||
| AD | 75.69 | 1 | 75.69 | 285.50 | <0.0001 | |||
| AE | 11.22 | 1 | 11.22 | 42.33 | <0.0001 | |||
| BC | 68.89 | 1 | 68.89 | 259.85 | <0.0001 | |||
| BD | 5.29 | 1 | 5.29 | 19.95 | 0.0001 | |||
| BE | 3.24 | 1 | 3.24 | 12.22 | 0.0018 | |||
| CD | 89.30 | 1 | 89.30 | 336.84 | <0.0001 | |||
| CE | 11.90 | 1 | 11.90 | 44.90 | <0.0001 | |||
| DE | 0.2500 | 1 | 0.2500 | 0.9430 | 0.3408 | |||
| A2 | 14212.00 | 1 | 14212.00 | 53606.60 | <0.0001 | |||
| B2 | 8218.67 | 1 | 8218.67 | 31000.20 | <0.0001 | |||
| C2 | 916.16 | 1 | 916.16 | 3455.70 | <0.0001 | |||
| D2 | 4177.73 | 1 | 4177.73 | 15758.07 | <0.0001 | |||
| E2 | 12871.68 | 1 | 12871.68 | 48551.00 | <0.0001 | |||
| residual | 6.63 | 25 | 0.2651 | |||||
| lack of fit | 5.95 | 20 | 0.2977 | 2.21 | 0.1934 | not significant | ||
| pure error | 0.6733 | 5 | 0.1347 | |||||
| cor total | 31525.76 | 45 |
Table 3. Model Equations with Coded Factors for Aucubin Amount.
| model | equation | |
|---|---|---|
| aucubin amount |
|
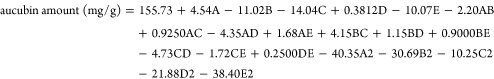
The response surface map (Figure 2) visually shows the relationship between the impact factors. As can be seen from Table 2, the order of the effect on the aucubin amount is as follows: C—Water percentage> B—Liquid–Solid ratio > E—Time> A—HBD–HBA ratio> D—Temperature.
Figure 2.

Response surface for the interactions of independent variables on aucubin amount (a) HBD–HBA ratio and liquid–solid ratio; (b) HBD–HBA ratio and water percentage; c: HBD–HBA ratio and temperature; (d) HBD–HBA ratio and time; (e) liquid–solid ratio and water percentage; (f) liquid–solid ratio and temperature; (g) liquid–solid ratio and time; (h) water percentage and temperature; i: water percentage and time; (j) temperature and time.
3.3.2. Determination and Verification of Optimal Conditions
According to the optimal conditions (HBD–HBA ratio of 2.18, liquid–solid ratio of 46.92 mL/g, water percentage of 37.95%, temperature of 321.03 K, and time of 59.55 min) by the response surface methodology, a maximum aucubin amount of 156.8 mg/g was obtained. To test the reliability of the results obtained by the response surface methodology, a verification test was carried out, and the highest aucubin amount was 156.4 mg/g. The relative standard deviation (RSD%) is 0.19%, indicating that the prediction model is good and the parameters of the experimental optimization process are reliable (Supporting Table S2).
3.4. Adsorption Capacity and Desorption Ratio
Table 4 shows the adsorption capacity of aucubin on different macroporous resins. It was found that the polar resins with a larger surface area and pore size have a greater adsorption capacity than those of the other resins. This may be explained by the fact that the adsorption process was improved by resins with similar polarity, larger surface areas, and larger average pore sizes.51 In addition, the desorption ratios on these macroporous resins were investigated, and the results are given in Table 4. The desorption ratio of aucubin was proportional to pore size, and the desorption performance of EXA-45, LS-305, and HPD950 resins was superior, which could be due to the presence of phenolic hydroxyl groups and physical force (for example, van der Waals force) and large surface areas. Therefore, the EXA-45, LS-305, and HPD950 resins were chosen for the separation of aucubin in further study.
Table 4. Physical Properties of Macroporous Resins and Their Adsorption Properties.
| resin | surface area (m2/g) | pore size (Å) | polarity | composition | adsorption capacity (mg/g) | desorption ratio (%) |
|---|---|---|---|---|---|---|
| ADS-8 | 450 | 130 | nonpolar | polystyrene | 85.9 ± 2.6 | 72.3 ± 3.5 |
| HP20 | 600 | 290 | nonpolar | SDVB | 95.6 ± 2.1 | 73.8 ± 2.3 |
| XAD-1 | 900 | 95 | nonpolar | polystyrene | 103.5 ± 2.2 | 72.8 ± 1.2 |
| H103 | 1000 | 95 | nonpolar | SDVB | 106.8 ± 1.8 | 73.2 ± 1.8 |
| NKA-2 | 200 | 150 | middle-polar | polystyrene | 86.8 ± 1.6 | 71.2 ± 1.2 |
| XAD-1180 | 600 | 150 | middle-polar | SDVB | 108.6 ± 1.2 | 76.8 ± 1.6 |
| LS-A40 | 700 | 150 | middle-polar | SDVB | 110.5 ± 1.6 | 78.3 ± 1.5 |
| EXA-45 | 1000 | 35 | middle-polar | SDVB | 116.8 ± 2.2 | 79.5 ± 1.6 |
| ADS-11 | 210 | 280 | polar | sulfonic group | 102.8 ± 1.6 | 70.2 ± 2.1 |
| S8 | 550 | 100 | polar | polystyrene | 113.5 ± 2.1 | 78.3 ± 1.7 |
| LS-305 | 1000 | 55 | polar | SDVB | 130.5 ± 1.5 | 80.2 ± 1.6 |
| HPD950 | 1350 | 100 | polar | SDVB | 153.6 ± 1.2 | 82.3 ± 1.5 |
3.5. Adsorption Kinetics
As depicted in Figure 3a, the aucubin capacity increased rapidly within 120 min on three tested resins and then plateaued at around 150 min. This suggests that there were sufficient sites on the surface of resins for the adsorption of aucubin during the earlier stages. As the process progressed, the number of active sites on the surface of resins decreased. This resulted in the formation of increasingly difficult conditions for the adsorption of adsorbed molecules because of larger repulsive interactions between adjacent adsorbed molecules and mass transfer resistance.
Figure 3.
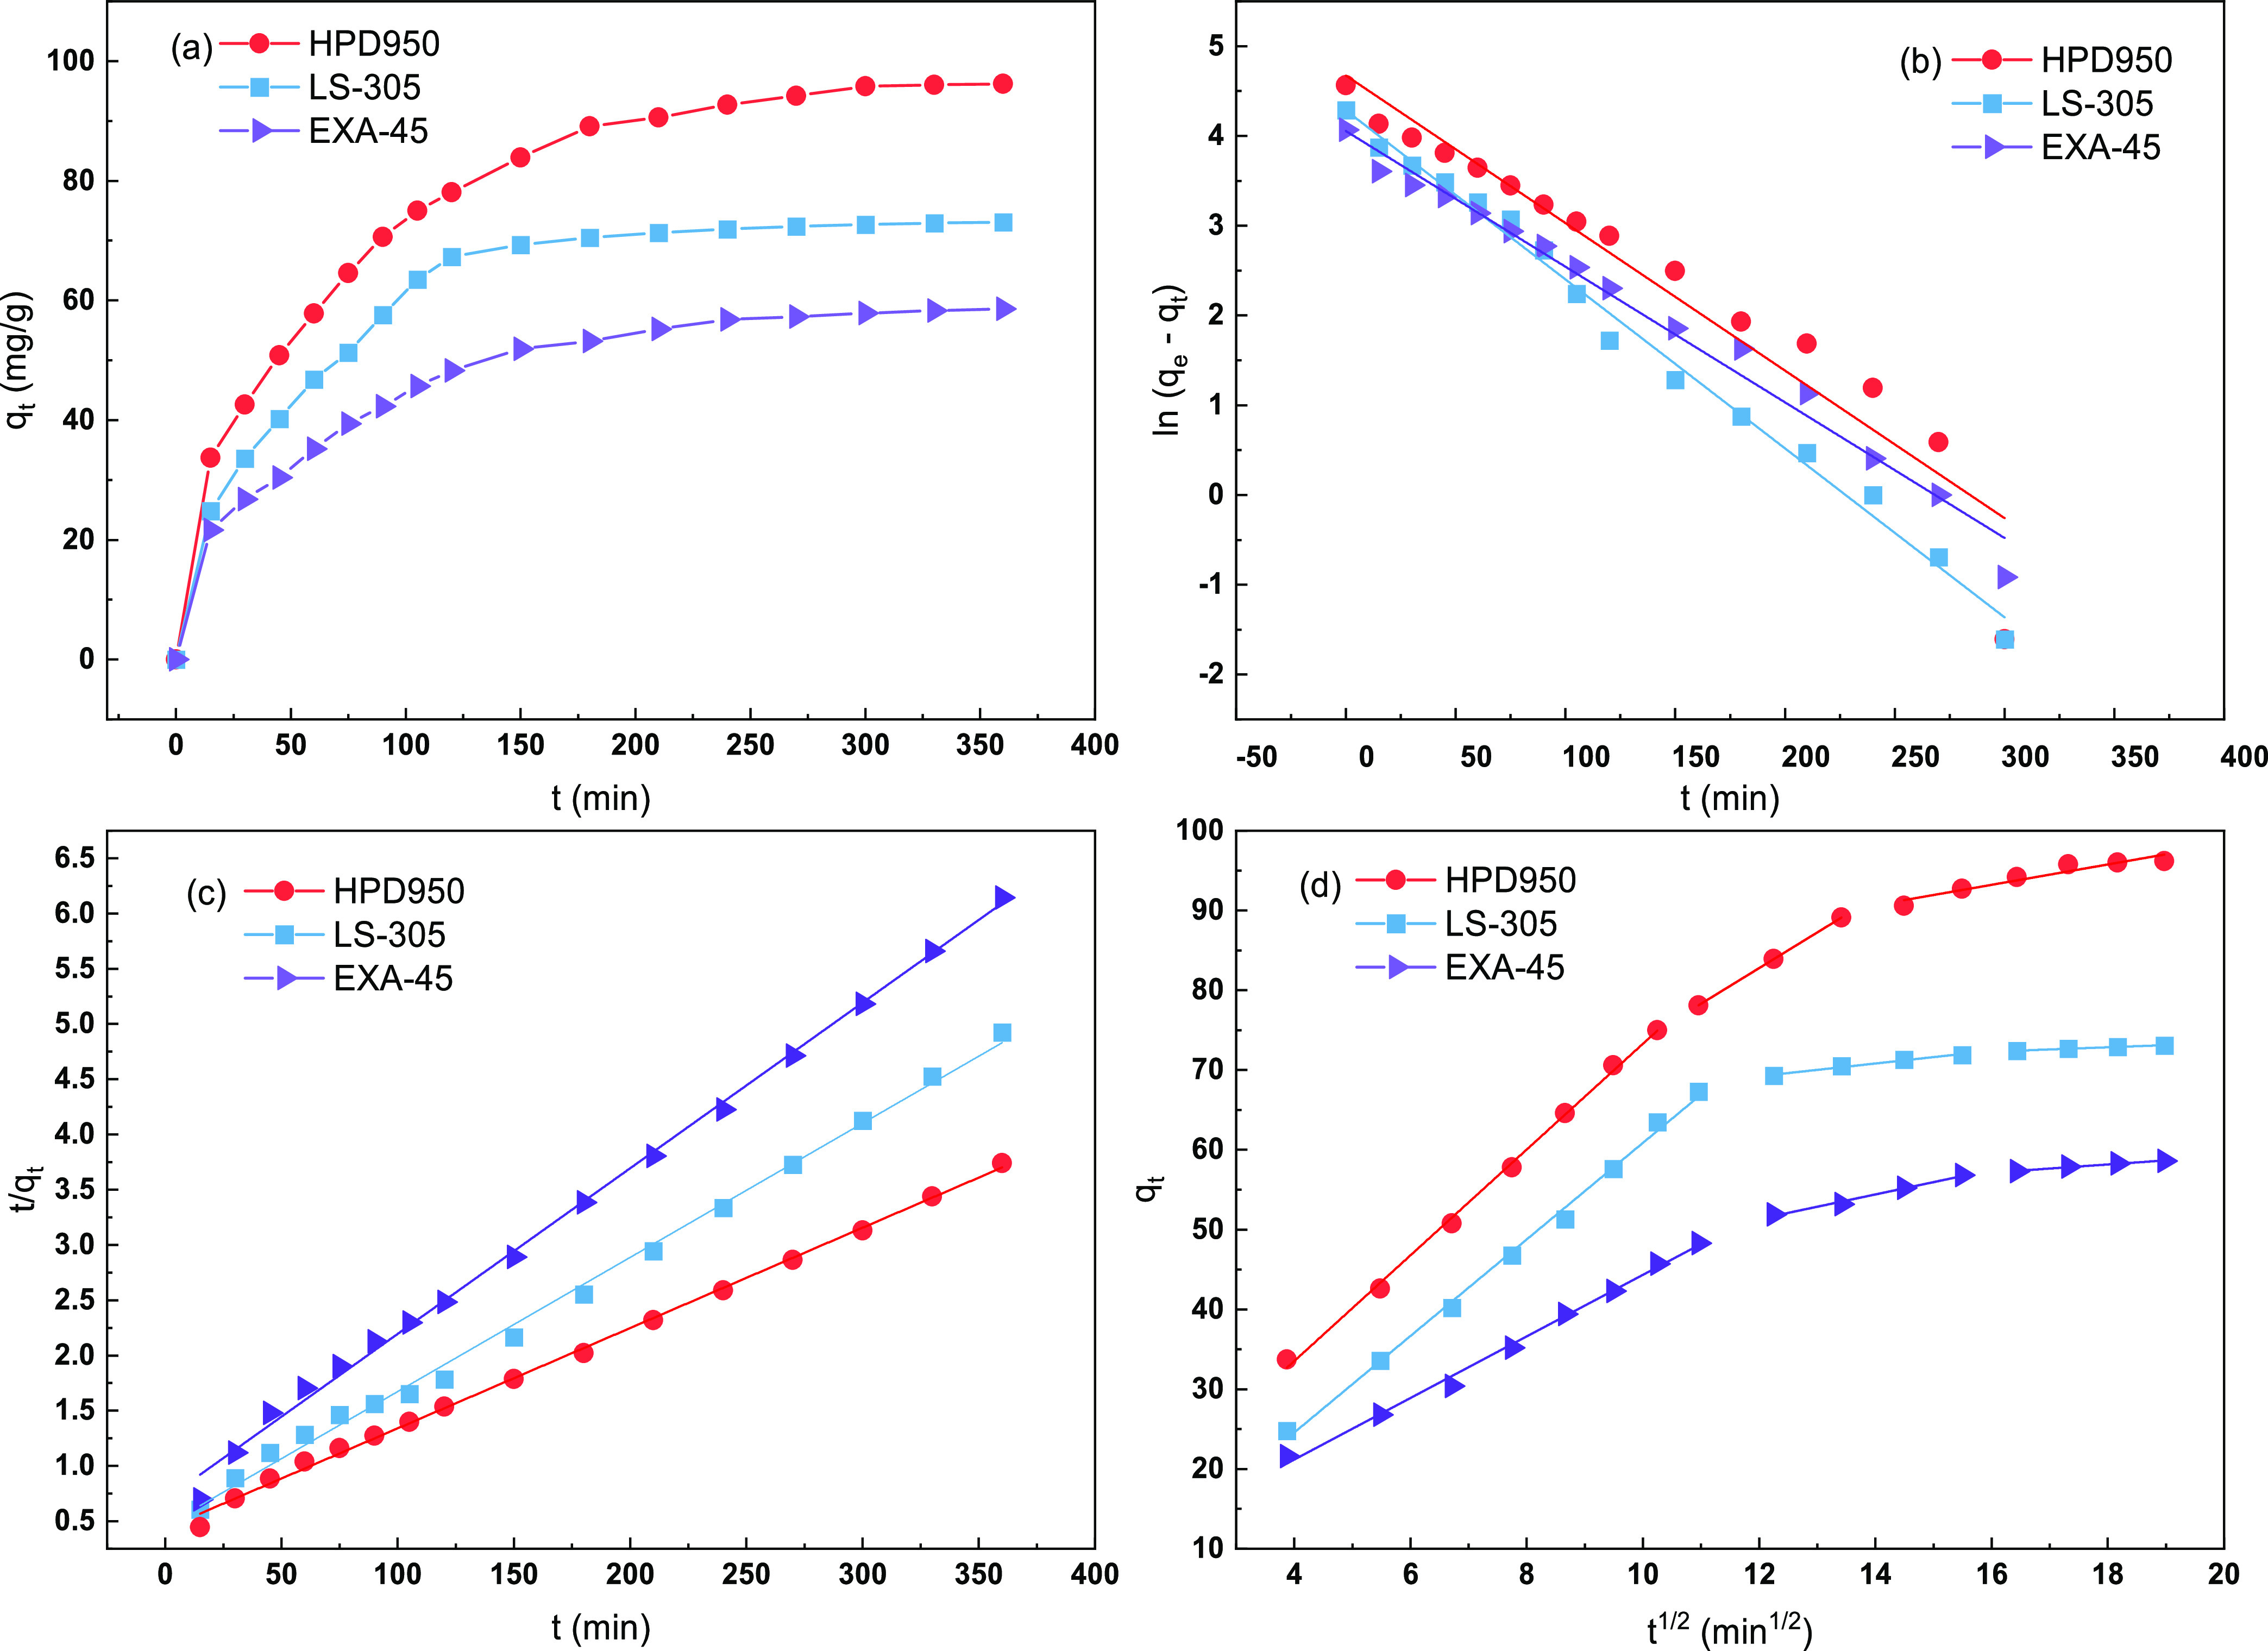
(a) Adsorption kinetics curve and linear correlations on the basis of (b) pseudo-first-order, (c) pseudo-second-order, and (d) intraparticle diffusion models for aucubin on EXA-45, LS-305, and HPD950 resins at 298.15 K.
The linear correlations of the pseudo-first-order (Figure 3b), pseudo-second-order (Figure 3c), and intraparticle diffusion (Figure 3d) models for aucubin on the EXA-45, LS-305, and HPD950 resins were evaluated, and the adsorption kinetic parameters are summarized in Table 5. The R2 value of the second-order model was higher than that of the first-order model for all three tested resins, which indicates that the second-order model is better fit with the collected data by kinetics. In terms of adsorption, it can be divided into three phases: film diffusion, intraparticle diffusion, and final adsorption on the active sites. The rate-limiting stage can be identified using the intraparticle diffusion model. According to Figure 3d, when the intraparticle diffusion model was used, the fitting result displayed a multilinear relationship, and the plots did not pass through the origin, suggesting that the intraparticle diffusion was not the sole rate-limiting step and the adsorption rate was simultaneously controlled by film diffusion.
Table 5. Adsorption Kinetics Equations and Parameters of Aucubin on EXA-45, LS-305, and HPD950 Resin.
| EXA-45 | |||
|---|---|---|---|
| kinetics models | equations | parameters | |
| pseudo-first-order | k1 = 0.0151 min–1 | ||
| qe = 55.5 mg/g | |||
| R2 = 0.984 | |||
| pseudo-second-order | k2 = 3.231 × 10⁻⁴ g·mg–1·min–1 | ||
| qe = 66.6 mg/g | |||
| R2 = 0.9974 | |||
| intraparticle diffusion | ki,1 = 3.8588 mg·g–1·min–0.5 | ||
| Ci,1 = 5.7 mg/g | |||
| R2 = 0.9946 | |||
| ki,1 = 1.5409 mg·g–1·min–0.5 | |||
| Ci,1 = 32.8 mg/g | |||
| R2 = 0.9848 | |||
| ki,1 = 0.5091 mg·g–1·min–0.5 | |||
| Ci,1 = 49.0 mg/g | |||
| R2 = 0.9728 | |||
| LS-305 | |||
|---|---|---|---|
| pseudo-first-order | k1 = 0.0188 min–1 | ||
| qe = 72.4 mg/g | |||
| R2 = 0.9913 | |||
| Pseudo-second-order | k2 = 3.1904 × 10⁻⁴ g·mg–1·min–1 | ||
| qe = 82.6 mg/g | |||
| R2 = 0.9961 | |||
| Intraparticle diffusion | ki,1 = 6.0503 mg·g–1·min–0.5 | ||
| Ci,1 = 0.37 mg/g | |||
| R2 = 0.9957 | |||
| ki,1 = 0.7991 mg·g–1·min–0.5 | |||
| Ci,1 = 59.6 mg/g | |||
| R2 = 0.9779 | |||
| ki,1 = 0.2720 mg·g–1·min–0.5 | |||
| Ci,1 = 67.9 mg/g | |||
| R2 = 0.9888 | |||
| HPD950 | |||
|---|---|---|---|
| pseudo-first-order | k1 = 0.0164 min–1 | ||
| qe = 106.9 mg/g | |||
| R2 = 0.9212 | |||
| pseudo-second-order | k2 = 1.875 × 10⁻⁴ g·mg–1·min–1 | ||
| qe = 111.1 mg/g | |||
| R2 = 0.9979 | |||
| intraparticle diffusion | ki,1 = 6.6273 mg·g–1·min–0.5 | ||
| Ci,1 = 7.0 mg/g | |||
| R2 = 0.9975 | |||
| ki,1 = 4.4683 mg·g–1·min–0.5 | |||
| Ci,1 = 29.1 mg/g | |||
| R2 = 0.9999 | |||
| ki,1 = 1.2758 mg·g–1·min–0.5 | |||
| Ci,1 = 72.8 mg/g | |||
| R2 = 0.8926 | |||
3.6. Adsorption Isotherms
Three isotherm models (Langmuir, Freundlich, and Temkin models) were employed to reveal the distribution of the adsorbate between the liquid phase and solid phase. As shown in Figure 4a, the equilibrium adsorption capacity of HPD950 resin clearly reduced with increasing temperature, indicating that this adsorption was an exothermic process.
Figure 4.

(a) Adsorption isotherms of aucubin and the fitting result by (b) Langmuir, (c) Frendlich, and (d) Temkin models on EXA-45, LS-305, and HPD950 resins at different temperatures.
At 298.15, 308.15, and 318.15 K, the linear correlations based on the Langmuir (Figure 4b), Freundlich (Figure 4c), and Temkin (Figure 4d) models for aucubin on HPD950 resin were assessed. The R2 values of the Langmuir model were higher than those of the Freundlich and Temkin model as shown in Table 6, demonstrating that the Langmuir model was more appropriate to describe the adsorption process of aucubin on HPD950 resin. Another conclusion that could be drawn was that adsorption was restricted to a single molecular layer.52
Table 6. Adsorption Isotherms Equations and Parameters of Aucubin on HPD950, LS-305, and EXA-45 Resins.
| Langmuir |
Freundlich |
Temkin |
||||||||
|---|---|---|---|---|---|---|---|---|---|---|
| resins | T (K) | equation | R2 | equation | R2 | equation | R2 | |||
| EXA-45 | 298.15 | 0.9987 | 0.9199 | 0.9122 | ||||||
| 308.15 | 0.9946 | 0.9858 | 0.8354 | |||||||
| 318.15 | 0.9932 | 0.9344 | 0.7732 | |||||||
| LS-305 | 298.15 | 0.9918 | 0.8313 | 0.9438 | ||||||
| 308.15 | 0.9958 | 0.9901 | 0.9707 | |||||||
| 318.15 | 0.9993 | 0.9449 | 0.8729 | |||||||
| HPD950 | 298.15 | 0.9934 | 0.8676 | 0.9745 | ||||||
| 308.15 | 0.9952 | 0.8494 | 0.9535 | |||||||
| 318.15 | 0.9903 | 0.8656 | 0.9635 | |||||||
The thermodynamic parameters for the adsorption of aucubin on EXA-45, LS-305, and HPD950 resins are listed in Table 7. ΔG < 0 suggested that the adsorption of aucubin on all three resins was spontaneous. Additionally, when the temperature increased, the absolute value of ΔG decreased, showing that the adsorption process was better suited for low temperatures. ΔH < 0 suggested an exothermic adsorption mechanism, and ΔH < 43 kJ/mol demonstrated that the process was a physical adsorption process. The negative value of ΔS during aucubin adsorption on all three resins was a result of reduced randomness at the solid/solution interface.
Table 7. Thermodynamic Parameters for the Adsorption of Aucubin on the EXA-45, LS-305, and HPD950 Resins.
| resins | T (K) | KL (L/mg) | K0 | ΔG (kJ/mol) | ΔH (kJ/mol) | ΔS (kJ/mol) |
|---|---|---|---|---|---|---|
| EXA-45 | 298.15 | 0.00082 | 283.99 | –14.003 | –20.08 | –0.02 |
| 308.15 | 0.00063 | 218.19 | –13.797 | |||
| 318.15 | 0.00049 | 169.7 | –13.58 | |||
| LS-305 | 298.15 | 0.00169 | 585.3 | –15.795 | –21.34 | –0.019 |
| 308.15 | 0.00124 | 429.45 | –15.532 | |||
| 318.15 | 0.00099 | 342.87 | –15.44 | |||
| HPD950 | 298.15 | 0.00254 | 879.68 | –16.805 | –21.61 | –0.016 |
| 308.15 | 0.00185 | 640.71 | –16.557 | |||
| 318.15 | 0.00147 | 509.11 | –16.486 |
3.7. Dynamic Adsorption and Recyclability Tests
Since the target analytes could rapidly leak from the resin once the breakthrough point was reached, the breakthrough point (10% of the initial concentration) was frequently utilized as a marker of the adsorption saturation for the dynamic adsorption process. Figure 5a shows the effect of different flow rates on the dynamic adsorption of aucubin. In general, the smaller the flow rate, the later the breakthrough point occurs and the larger the fully treated volume. As a result, when operating at a faster flow rate, the residence time of the fluid in the resin is short and the solution does not fully contact the resin bed, resulting in insufficient solute diffusion. Since the processing volume of the sample solution at a flow rate of 1.5 BV/h was higher than that at a rate of 3 or 4.5 BV/h, we deduced that enough particle diffusion was achieved at the lowest flow rate. The next experiments will employ a flow rate of 1.5 BV/h and a loading volume of 150 mL (10 BV) of sample solution to improve adsorption while reducing sample solution waste.
Figure 5.

(a) Breakthrough curves of aucubin with different flow rates for the dynamic process on columns packed with HPD950 resin, (b) effects of ethanol concentrations on the desorption ratio at 1.5 BV/h, and (c) dynamic desorption curves.
In order to fully recover aucubin, it is necessary to select a suitable desorbent that can dissolve the resin-enriched aucubin as much as possible in a small volume of desorbent. Under the same conditions, the solubility of aucubin in ethanol is higher than that in water.53 Besides, ethanol can be recycled and reused. On the basis of this, ethanol was selected as the desorbent in the desorption test. In addition, different concentrations of ethanol would affect the van der Waals force between aucubin and the resin, leading to different desorption properties; therefore, the influence of different ethanol concentrations on the desorption rate of HPD950 resin was investigated. It can be seen from Figure 5b that the desorption rate of the resin continues to increase as the ethanol concentration increases and reaches the highest value when the ethanol concentration reaches 70%. Subsequently, the desorption rate of resin began to show a downward trend with a further increase in the ethanol concentration. The explanation is that the polarity of the desorbent decreased with increasing ethanol content, which facilitated the dissolution of aucubin. However, the competitive dissolution of alcohol-soluble contaminants was more likely to occur at higher ethanol concentrations with a lower polarity. As a result, 70% ethanol was chosen as the best desorbent.
When aucubin was absorbed and saturated by the resin, the appropriate desorption flow rate was conducive to diffusion of the desorbent in the resin and enhanced the desorption effect of the resin. Therefore, the desorption curve of the resin at different flow rates was investigated. It can be seen from Figure 5c that all aucubin were desorbed with a flow rate of 1.5 BV/h and the amount of ethanol was 120 mL (8 BV), and the desorption curve is single, symmetrical, and does not have an obvious tailing phenomenon. On the contrary, with an increase in the flow rate, the amount of ethanol gradually increases, the peak shape becomes wider and wider, and the desorption curve shows an obvious tailing phenomenon. This occurred because there was no enough time for the ethanol solution to fully contact with the aucubin absorbed by the resin. Therefore, the ethanol was washed out of the column before the adsorbed aucubin could fully dissolve due to an excessively fast flow rate. The peak height also showed that the desorption result at 1.5 BV/h was superior to that at the other two flow rates. The target analytes and the desorption solution had sufficient contact time due to the decreased flow rate. Therefore, the optimal flow rate for dynamic adsorption and desorption was 1.5 BV/h.
3.8. Scale-up Purification and Recyclability Tests
As shown in Figure 6a, the purified extracts produced by this small-scale purification had an aucubin content of 72.6%, which was 2.52 times higher than that of the crude extract. After scale-up purification, it can be seen in Figure 6b that the purity of aucubin (72.1%) was 2.50 times higher compared to that of the crude extract, and the recovery of aucubin was 75.6%. Therefore, it is possible to draw the conclusion that the developed scale-up purification process is an effective way to purify aucubin on a wide scale.
Figure 6.

Scale-up verification results of purification processes and recyclability results of the HPD950 resin.
In addition, the regeneration performance of macroporous resin is crucial to its practical applicability. The dynamic adsorption capability of aucubin on HPD950 resin along with the five recycles was 95.2, 94.8, 94.3, 94.1, and 93.7%. The fifth adsorption capacity showed remarkable stability and repeatability; these results supported the hypothesis that HPD950 resin had great potential and excellent sustainability for utilization in aucubin recovery.
3.9. Antioxidant Activity Test
The antioxidant activity of aucubin extract was evaluated by using four free radicals, and the results are shown in Figure 7. Studies have shown that the aucubin extract has strong antioxidant abilities with scavenging capabilities for four free radicals (DPPH free radical, •OH free radical, ABTS free radical, and O2•– free radical). It can be seen from Figure 7b that the total antioxidant capacity and reducing capacity of aucubin extract showed a dose-dependent effect within a certain concentration range (0.5–3 mg/mL). The total antioxidant capacity of the aucubin extract with a concentration of 3 mg/mL is equivalent to that of 0.12 mg/mL Vc solution. Based on the above results, it can be seen that the total antioxidant capacity and reducing capacity of aucubin extract are relatively strong within a certain concentration range.
Figure 7.

(a) Scavenging percentage and (b) total antioxidant and reducing capacity of the aucubin extract with different concentrations.
3.10. Antifungal Activity Test
The antifungal activity of aucubin extract was evaluated against five pathogens, and the results are shown in Figure 8. The study showed that the aucubin extract exerted a strong antifungal activity against all tested pathogens and the antifungal effect of aucubin extract followed the order of R. solani (44.6 ± 1.08 mm)> P. oryzae (36.6 ± 1.29 mm)> S. sclerotiorum (31.5 ± 1.12 mm)> C. arachidicola (27.3 ± 1.05 mm) > F. oxysporumf. sp. cucumerinum (19.6 ± 1.26 mm) with the concentration of 40 mg/mL.
Figure 8.

Antifungal activity of the aucubin extract.
4. Conclusions
Ten kinds of green, environment-friendly, and low-cost DES were synthesized for the aucubin extraction from E. ulmoides seed-draff waste biomass. Among them, ChAce exerted the highest extraction efficiency. The maximum aucubin amount of 156.4 mg/g was obtained under optimal conditions (HBD–HBA ratio of 2.18, liquid–solid ratio of 46.92 mL/g, water percentage of 37.95%, temperature of 321.03 K, and time of 59.55 min). Moreover, the Langmuir and pseudo-second-order models accurately described the static adsorption equilibrium data for aucubin on HPD950 resin, and this adsorption was discovered to be a favorable, spontaneous, exothermic, and physical process. A 72.1% pure aucubin product was generated with a 75.6% recovery after the separation parameters were optimized using the HPD950 resin column with scale-up purification. Besides, the aucubin extract exerted a strong antioxidant ability with scavenging capabilities for four free radicals (DPPH free radical, •OH free radical, ABTS free radical, and O2•– free radical). The antifungal activity study found that the aucubin extract exhibited a good antifungal effect against all tested pathogens. We believe that this work could expand possibilities to ultimately develop a novel, green, and high-efficiency technique for the certain extraction and application of natural product from waste biomass.
Acknowledgments
This work was financially supported by the Natural Science Foundation of Hunan Province (2018WK2093) and the construct program of applied characteristic discipline in Hunan Province.
Supporting Information Available
The Supporting Information is available free of charge at https://pubs.acs.org/doi/10.1021/acsomega.3c08332.
Experimental details for HPLC analysis and quantification; experimental details for the antioxidant activity test; experimental details for antifungal activity test; specific factor level design for aucubin extraction; and HPLC chromatograms of standard and aucubin extract (PDF)
Author Present Address
∥ Yang Zi Tang Road 130, Lingling District, Yong Zhou City, Hunan, China
Author Contributions
Y.L.: Conceptualization, formal analysis, and writing—original draft, writing—review & editing, and data curation. F.C.: Data curation, formal analysis, and validation. H.T.: Investigation, methodology, validation, and software. W.D.: Writing—review & editing and data curation. Z.Q.: Resources, funding acquisition, and project administration.
The authors declare no competing financial interest.
Supplementary Material
References
- Ma L.; Meng N.; Liu B.; Wang C.; Chai X.; Huang S.; Yu H.; Wang Y. Quantitative Analysis and Stability Study on Iridoid Glycosides from Seed Meal of Eucommia ulmoides Oliver. Molecules 2022, 27, 5924 10.3390/molecules27185924. [DOI] [PMC free article] [PubMed] [Google Scholar]
- Tian S.; Zou Y.; Wang J.; Li Y.; An B.-z.; Liu Y.-Q. Protective effect of Du-Zhong-Wan against osteoporotic fracture by targeting the osteoblastogenesis and angiogenesis couple factor SLIT3. J. Ethnopharmacol. 2022, 295, 115399 10.1016/j.jep.2022.115399. [DOI] [PubMed] [Google Scholar]
- Sayed S. M. A.; Siems K.; Schmitz-Linneweber C.; Luyten W.; Saul N. Enhanced healthspan in Caenorhabditis elegans treated with extracts from the traditional Chinese medicine plants Cuscuta chinensisLam. and Eucommia ulmoidesOliv. Front. Pharmacol. 2021, 12, 604435 10.3389/fphar.2021.604435. [DOI] [PMC free article] [PubMed] [Google Scholar]
- Chen Y.; Pan R.; Zhang J.; Liang T.; Guo J.; Sun T.; Fu X.; Wang L.; Zhang L. Pinoresinol diglucoside (PDG) attenuates cardiac hypertrophy via AKT/mTOR/NF-κB signaling in pressure overload-induced rats. J. Ethnopharmacol. 2021, 272, 113920 10.1016/j.jep.2021.113920. [DOI] [PubMed] [Google Scholar]
- Xu X.; Tian W.; Duan W.; Pan C.; Huang M.; Wang Q.; Yang Q.; Wen Z.; Tang Y.; Xiong Y.; et al. Quanduzhong capsules for the treatment of grade 1 hypertension patients with low-to-moderate risk: A multicenter, randomized, double-blind, placebo-controlled clinical trial. Front. Pharmacol. 2023, 13, 1014410 10.3389/fphar.2022.1014410. [DOI] [PMC free article] [PubMed] [Google Scholar]
- Peng M.-f.; Tian S.; Song Y.-g.; Li C.-x.; Miao M.-s.; Ren Z.; Li M. Effects of total flavonoids from Eucommia ulmoides Oliv. leaves on polycystic ovary syndrome with insulin resistance model rats induced by letrozole combined with a high-fat diet. J. Ethnopharmacol. 2021, 273, 113947 10.1016/j.jep.2021.113947. [DOI] [PubMed] [Google Scholar]
- Yan J.; Hu R.; Li B.; Tan J.; Wang Y.; Tang Z.; Liu M.; Fu C.; He J.; Wu X. Effect of Eucommia ulmoides leaf extract on growth performance, carcass traits, parameters of oxidative stress, and lipid metabolism in broiler chickens. Front. Vet. Sci. 2022, 9, 945981 10.3389/fvets.2022.945981. [DOI] [PMC free article] [PubMed] [Google Scholar]
- Liu Z.; Ma W.; Chen B.; Pan H.; Zhu M.; Pang X.; Zhang Q. Deep eutectic solvents in the extraction of active compounds from Eucommia Ulmoides Oliv. leaves. J. Food Meas. Charact. 2022, 16, 3410–3422. 10.1007/s11694-022-01427-w. [DOI] [Google Scholar]
- Ren N.; Gong W.; Zhao Y.; Zhao D.-g.; Xu Y. Innovation in sweet rice wine with high antioxidant activity: Eucommia ulmoides leaf sweet rice wine. Front. Nutr. 2023, 9, 1108843 10.3389/fnut.2022.1108843. [DOI] [PMC free article] [PubMed] [Google Scholar]
- Yang P.; Zhang Q.; Shen H.; Bai X.; Liu P.; Zhang T. Research progress on the protective effects of aucubin in neurological diseases. Pharm. Biol. 2022, 60, 1088–1094. 10.1080/13880209.2022.2074057. [DOI] [PMC free article] [PubMed] [Google Scholar]
- Liang X.; Zhou K.; Li P.; Wan D.; Liu J.; Yi X.; Peng Y. Characteristics of endophytic bacteria and active ingredients in the Eucommiae cortex from different origins. Front. Microbiol. 2023, 14, 1164674 10.3389/fmicb.2023.1164674. [DOI] [PMC free article] [PubMed] [Google Scholar]
- Zhang S.; Feng Z.; Gao W.; Duan Y.; Fan G.; Geng X.; Wu B.; Li K.; Liu K.; Peng C. Aucubin attenuates liver ischemia-reperfusion injury by inhibiting the HMGB1/TLR-4/NF-κB signaling pathway, oxidative stress, and apoptosis. Front. Pharmacol. 2020, 11, 544124 10.3389/fphar.2020.544124. [DOI] [PMC free article] [PubMed] [Google Scholar]
- Xue H.; Chen K.; Zhang L.; Li Y. Review of the ethnopharmacology, phytochemistry, and pharmacology of the Genus Veronica. Am. J. Chin. Med. 2019, 47, 1193–1221. 10.1142/S0192415X19500617. [DOI] [PubMed] [Google Scholar]
- Zhang Y.; Tang L.-D.; Wang J.-Y.; Wang H.; Chen X.-Y.; Zhang L.; Yuan Y. Anti-inflammatory effects of aucubin in cellular and animal models of rheumatoid arthritis. Chin. J. Nat. Med. 2022, 20, 458–472. 10.1016/S1875-5364(22)60182-1. [DOI] [PubMed] [Google Scholar]
- Xiao S.; Zhong N.; Yang Q.; Li A.; Tong W.; Zhang Y.; Yao G.; Wang S.; Liu J.; Liu Z. Aucubin promoted neuron functional recovery by suppressing inflammation and neuronal apoptosis in a spinal cord injury model. Int. Immunopharmacol. 2022, 111, 109163 10.1016/j.intimp.2022.109163. [DOI] [PubMed] [Google Scholar]
- Jung E.; Park S. B.; Jung W. K.; Kim H. R.; Kim J. Aucubin, an active ingredient in Aucuba japonica, prevents N-methyl-N-nitrosourea-induced retinal degeneration in mice. Molecules 2019, 24, 4437–4447. 10.3390/molecules24244437. [DOI] [PMC free article] [PubMed] [Google Scholar]
- Ma B.; Zhang J.; Zhu Z. M.; Bao X. W.; Zhang M. Y.; Ren C. X.; Zhang Q. Aucubin, a natural iridoid glucoside, attenuates oxidative stress-induced testis injury by inhibiting JNK and CHOP activation via Nrf2 up-regulation. Phytomedicine 2019, 64, 153057 10.1016/j.phymed.2019.153057. [DOI] [PubMed] [Google Scholar]
- Chen Q.; Yang X.; Capanoglu E.; Amrouche A. T.; Wu L.; Luo J.; Zhu Y.; Wang Y.; Jiang X.; Zhang D.; Lu B. Eucommia ulmoides male flower as a remarkable edible floral resource exerts lifespan/healthspan-promoting effects on Caenorhabditis elegans. Food Funct. 2023, 14, 457–470. 10.1039/D2FO03006C. [DOI] [PubMed] [Google Scholar]
- Zeng X.; Guo F.; Ouyang D. A review of the pharmacology and toxicology of aucubin. Fitoterapia 2020, 140, 104443 10.1016/j.fitote.2019.104443. [DOI] [PubMed] [Google Scholar]
- Wang K.; Zhou C.; Li L.; Dai C.; Wang Z.; Zhang W.; Xu J.; Zhu Y.; Pan Z. Aucubin promotes bone-fracture healing via the dual effects of anti-oxidative damage and enhancing osteoblastogenesis of hBM-MSCs. Stem Cell Res. Ther. 2022, 13, 424 10.1186/s13287-022-03125-2. [DOI] [PMC free article] [PubMed] [Google Scholar]
- Wang C.-Y.; Tang L.; He J.-W.; Li J.; Wang Y.-Z. Ethnobotany, Phytochemistry and Pharmacological Properties of Eucommia ulmoides: A Review. Am. J. Chin. Med. 2019, 47, 259–300. 10.1142/S0192415X19500137. [DOI] [PubMed] [Google Scholar]
- Gao Z.-X.; Zhang Z.-S.; Qin J.; Zhang M.-Z.; Cao J.-L.; Li Y.-Y.; Wang M.-Q.; Hou L.-L.; Fang D.; Xie S.-Q. Aucubin enhances the antitumor activity of cisplatin through the inhibition of PD-L1 expression in hepatocellular carcinoma. Phytomedicine 2023, 112, 154715 10.1016/j.phymed.2023.154715. [DOI] [PubMed] [Google Scholar]
- Kartini K.; Irawan M. A.; Setiawan F.; Jayani N. I. E. Characteristics, Isolation Methods, and Biological Properties of Aucubin. Molecules 2023, 28, 4154. 10.3390/molecules28104154. [DOI] [PMC free article] [PubMed] [Google Scholar]
- Huang H.; Chang Y.-H.; Xu J.; Ni H.-Y.; Zhao H.; Zhai B.-W.; Efferth T.; Gu C.-B.; Fu Y.-J. Aucubin as a natural potential anti-acute hepatitis candidate: Inhibitory potency and hepatoprotective mechanism. Phytomedicine 2022, 102, 154170 10.1016/j.phymed.2022.154170. [DOI] [PubMed] [Google Scholar]
- Li Yc.; Hao Jc.; Shang B.; Zhao C.; Wang Lj.; Yang Kl.; He Xz.; Tian Qq.; Wang Zl.; Jing Hl.; et al. Neuroprotective effects of aucubin on hydrogen peroxide-induced toxicity in human neuroblastoma SH-SY5Y cells via the Nrf2/HO-1 pathway. Phytomedicine 2021, 87, 153577 10.1016/j.phymed.2021.153577. [DOI] [PubMed] [Google Scholar]
- Xu J.-K.; Li M.-F.; Sun R.-C. Identifying the impact of ultrasound-assisted extraction on polysaccharides and natural antioxidants from Eucommia ulmoides Oliver. Process Biochem. 2015, 50, 473–481. 10.1016/j.procbio.2014.12.021. [DOI] [Google Scholar]
- Dong J.; Ma X.; Fu Z.; Guo Y. Effects of microwave drying on the contents of functional constituents of Eucommia ulmoides flower tea. Ind. Crops Prod. 2011, 34, 1102–1110. 10.1016/j.indcrop.2011.03.026. [DOI] [Google Scholar]
- Lian X.; Wang N.; Ma L.; Jiang H.; Bai D.; Xue H.; Ma Q. Determination of aucubin by supramolecular solvent-based dispersive liquid-liquid microextraction and UPLC-MS/MS: Application to a pharmacokinetic study in rats with type 1 diabetes. J. Pharm. Biomed. Anal. 2020, 186, 113301 10.1016/j.jpba.2020.113301. [DOI] [PubMed] [Google Scholar]
- Li H.; Hu J.; Ouyang H.; Li Y.; Shi H.; Ma C.; Zhang Y. Extraction of Aucubin from Seeds of Eucommia ulmoides Oliv. Using Supercritical Carbon Dioxide. J. AOAC Int. 2009, 92, 103–110. 10.1093/jaoac/92.1.103. [DOI] [PubMed] [Google Scholar]
- Yan X. Y.; Cai Z. H.; Zhao P. Q.; Wang J. D.; Fu L. N.; Gu Q.; Fu Y. J. Application of a novel and green temperature-responsive deep eutectic solvent system to simultaneously extract and separate different polar active phytochemicals from Schisandra chinensis (Turcz.) Baill. Food Res. Int. 2023, 165, 112541 10.1016/j.foodres.2023.112541. [DOI] [PubMed] [Google Scholar]
- Tolmachev D.; Lukasheva N.; Ramazanov R.; Karttunen M.; et al. Computer Simulations of Deep Eutectic Solvents. Challenges, Solutions, and Perspectives. Int. J. Mol. Sci. 2022, 23, 645. 10.3390/ijms23020645. [DOI] [PMC free article] [PubMed] [Google Scholar]
- Pontes P. V. d. A.; Czaikoski A.; Almeida N. A.; Fraga S.; Rocha L. d. O.; Cunha R. L.; Maximo G. J.; Batista E. A. C. Extraction optimization, biological activities, and application in O/W emulsion of deep eutectic solvents-based phenolic extracts from olive pomace. Food Res. Int. 2022, 161, 111753 10.1016/j.foodres.2022.111753. [DOI] [PubMed] [Google Scholar]
- Lou R.; Zhang X. Evaluation of pretreatment effect on lignin extraction from wheat straw by deep eutectic solvent. Bioresour. Technol. 2022, 344, 126174 10.1016/j.biortech.2021.126174. [DOI] [PubMed] [Google Scholar]
- Xing C.; Cui W.-Q.; Zhang Y.; Zou X.-S.; Hao J.-Y.; Zheng S.-D.; Wang T.-T.; Wang X.-Z.; Wu T.; Liu Y.-Y.; et al. Ultrasound-assisted deep eutectic solvents extraction of glabridin and isoliquiritigenin from Glycyrrhiza glabra: Optimization, extraction mechanism and in vitro bioactivities. Ultrason. Sonochem. 2022, 83, 105946 10.1016/j.ultsonch.2022.105946. [DOI] [PMC free article] [PubMed] [Google Scholar]
- Liu X.; Yan S.; Zhou H.; Wu H.; Wang S.; Yong X.; Zhou J. Separation and purification of glabridin from a deep eutectic solvent extract of Glycyrrhiza glabra residue by macroporous resin and its mechanism. Sep. Purif. Technol. 2023, 315, 123731 10.1016/j.seppur.2023.123731. [DOI] [Google Scholar]
- Hao C.; Chen L.; Dong H.; Xing W.; Xue F.; Cheng Y. Extraction of Flavonoids from Scutellariae Radix using Ultrasound-Assisted Deep Eutectic Solvents and Evaluation of Their Anti-Inflammatory Activities. ACS Omega 2020, 5, 23140–23147. 10.1021/acsomega.0c02898. [DOI] [PMC free article] [PubMed] [Google Scholar]
- Wang Y.-Y.; Peng C.; Zhang Y.; Wang Z.-R.; Chen Y.-M.; Dong J.-F.; Xiao M.-L.; Li D.-L.; Li W.; Zou Q.-J.; et al. Optimization, identification and bioactivity of flavonoids extracted from Moringa oleifera leaves by deep eutectic solvent. Food Biosci. 2022, 47, 101687 10.1016/j.fbio.2022.101687. [DOI] [Google Scholar]
- Vo T. P.; Pham T. V.; Tran T. N. H.; Vo L. T. V.; Vu T. T.; Pham N. D.; Nguyen D. Q. Ultrasonic-Assisted and Microwave-Assisted Extraction of Phenolics and Terpenoids from Abelmoschus sagittifolius (Kurz) Merr Roots Using Natural Deep Eutectic Solvents. ACS Omega 2023, 8, 29704–29716. 10.1021/acsomega.3c03929. [DOI] [PMC free article] [PubMed] [Google Scholar]
- Bao N.; Rashed M. M. A.; Jiang B.; Zhai K.; Luo Z. Green and Efficient Extraction Approach for Polyphenol Recovery from Lotus Seedpods (Receptaculum Nelumbinis): Gas-Assisted Combined with Glycerol. ACS Omega 2021, 6, 26722–26731. 10.1021/acsomega.1c04190. [DOI] [PMC free article] [PubMed] [Google Scholar]
- Zhou M.; Fakayode O. A.; Li H. Green Extraction of Polyphenols via Deep Eutectic Solvents and Assisted Technologies from Agri-Food By-Products. Molecules 2023, 28, 6852. 10.3390/molecules28196852. [DOI] [PMC free article] [PubMed] [Google Scholar]
- Tang W.; Yao W.; Lei X.; Zhou Y.; Liu M.; Zeng Z.; Zhao C. Efficient enrichment and purification of anti-inflammatory nuezhenoside G13 from Osmanthus fragrans fruit by macroporous resin adsorption. Ind. Crops Prod. 2023, 192, 116092 10.1016/j.indcrop.2022.116092. [DOI] [Google Scholar]
- Czerwińska M. E.; Kalinowska E.; Popowski D.; Bazylko A. Lamalbid, chlorogenic acid, and verbascoside as tools for standardization of Lamium album flowers-development and validation of HPLC-DAD method. Molecules 2020, 25, 1721. 10.3390/molecules25071721. [DOI] [PMC free article] [PubMed] [Google Scholar]
- Hou M.; Zhang L. Adsorption/desorption characteristics and chromatographic purification of polyphenols from Vernonia patula (Dryand.) Merr. using macroporous adsorption resin. Ind. Crops Prod. 2021, 170, 113729 10.1016/j.indcrop.2021.113729. [DOI] [Google Scholar]
- Tran H. N.; Lima E. C.; Juang R.-S.; Bollinger J.-C.; Chao H.-P. Thermodynamic parameters of liquid–phase adsorption process calculated from different equilibrium constants related to adsorption isotherms: A comparison study. J. Environ. Chem. Eng. 2021, 9, 106674 10.1016/j.jece.2021.106674. [DOI] [Google Scholar]
- Zhou X.; Yu X.; Hao J.; Liu H. Correction to the thermodynamic calculation using the Langmuir isotherm model by Saeed et al. (2022). J. Hazard. Mater. 2022, 435, 129014 10.1016/j.jhazmat.2022.129014. [DOI] [PubMed] [Google Scholar]
- Zhou X.; Yu X.; Hao J.; Liu H. Comments on the calculation of the standard equilibrium constant using the Langmuir model in Journal of Hazardous Materials 422 (2022) 126863. J. Hazard. Mater. 2022, 429, 128407 10.1016/j.jhazmat.2022.128407. [DOI] [PubMed] [Google Scholar]
- Shang X.; Dou Y.; Zhang Y.; Tan J.-N.; Liu X.; Zhang Z. Tailor-made natural deep eutectic solvents for green extraction of isoflavones from chickpea (Cicer arietinum L.) sprouts. Ind. Crops Prod. 2019, 140, 111724 10.1016/j.indcrop.2019.111724. [DOI] [Google Scholar]
- Fan Y.; Wu H.; Cai D.; Yang T.; Yang L. Effective extraction of harmine by menthol/anise alcohol-based natural deep eutectic solvents. Sep. Purif. Technol. 2020, 250, 117211 10.1016/j.seppur.2020.117211. [DOI] [Google Scholar]
- Duan L.; Dou L. L.; Guo L.; Li P.; Liu E. H. Comprehensive evaluation of deep eutectic solvents in extraction of bioactive natural products. ACS Sustainable Chem. Eng. 2016, 4, 2405–2411. 10.1021/acssuschemeng.6b00091. [DOI] [Google Scholar]
- Ozturk B.; Parkinson C.; Gonzalez-Miquel M. Extraction of Polyphenolic Antioxidants from Orange Peel Waste using Deep Eutectic Solvents. Sep. Purif. Technol. 2018, 206, 1–13. 10.1016/j.seppur.2018.05.052. [DOI] [Google Scholar]
- Silva E. M.; Pompeu D. R.; Larondelle Y.; Rogez H. Optimisation of the adsorption of polyphenols from Inga edulis leaves on macroporous resins using an experimental design methodology. Sep. Purif. Technol. 2007, 53, 274–280. 10.1016/j.seppur.2006.07.012. [DOI] [Google Scholar]
- Gökmen V.; Serpen A. Equilibrium and kinetic studies on the adsorption of dark colored compounds from apple juice using adsorbent resin. J. Food Eng. 2002, 53, 221–227. 10.1016/S0260-8774(01)00160-1. [DOI] [Google Scholar]
- Yang X.; Wei M.; Tian H.; Liu T.; Yang L. Enrichment and Purification of Aucubin from Eucommia ulmoides Ionic Liquid Extract Using Macroporous Resins. Materials 2018, 11, 1758–1771. 10.3390/ma11091758. [DOI] [PMC free article] [PubMed] [Google Scholar]
Associated Data
This section collects any data citations, data availability statements, or supplementary materials included in this article.