

Abstract
Systemic lupus erythematosus (SLE) is characterized by the production of anti-nuclear autoantibodies. Here, for the first time, we show that the abundances of gut permeability marker Zonulin and IgA1- and IgA2- subclasses are significantly higher in the fecal samples of SLE patients compared to HCs. Importantly, IgA-total, IgA1- and IgA2-subclasses from SLE patients showed higher nAg reactivity titers. Notably, we found that not only the nuclear antigen (nAg) reactive fecal IgA1:IgA2 ratio is higher in SLE patients, but also the abundance and nAg reactivity of fecal IgA and subclasses, IgA1 particularly, correlate with the fecal levels of Zonulin, which is produced primarily in the small intestine. These observations that higher amounts of nAg-reactive IgA and gut permeability marker are produced, particularly, in the proximal gut suggest a compromised epithelial barrier function and pro-inflammatory characteristics of small intestine in SLE patients.
Keywords: Systemic lupus erythematosus, immunoglobulin A, nuclear antigen, intestinal inflammation markers
1. Introduction
Systemic lupus erythematosus (SLE) is an autoimmune disease that arises when abnormally functioning B lymphocytes produce autoantibodies to nuclear antigens (nAg). High levels of circulating autoantibodies and immune-complexes (IC), and IC deposition in the kidney causing glomerulonephritis are the hallmarks of SLE [1, 2]. Our preclinical studies using lupus-prone mice have shown: 1) that minor dietary deviations can alter the composition of gut microbiota and the lupus-like disease progression [3], 2) a potential contribution of pro-inflammatory immune response, including higher frequencies of plasma cells, initiated in the gut mucosa to the disease process and gender bias [4, 5], 3) higher frequencies of IgA-autoantibody producing cells in the gut mucosa, and 4) higher abundance and nAg reactivity of fecal IgA at pre-seropositive and -clinical stages [6, 7]. Importantly, higher gut permeability and microbial translocation have been implicated in the initiation and/or progression of autoimmunity in at risk subjects [8, 9].
IgA is the most abundant Ig isotype released into the gut lumen and it plays an important role in the protection against microbial infections as well as in maintaining a healthy gut microbiota [10]. In humans, two subclasses of IgA (viz: IgA1 and IgA2) are produced. In healthy human subjects, while the serum IgA antibodies are mostly IgA1, IgA antibodies secreted by intestinal B cells are composed of about 30–50% IgA1 and 50–70% IgA2 [11]. With respect to SLE, it has been shown that in addition to the differences in gut microbiota composition, the levels of total IgA in stool samples of SLE patients are relatively higher compared to that of healthy controls (HC) [12]. However, it is unknown if IgA subclasses are differently produced in the gut of lupus patients, and if their fecal IgA have higher nAg reactivity.
In the present study, we compared the abundance of pro-inflammatory marker calprotectin, permeability protein Zonulin, and IgA-total and IgA-subclasses in cross-sectional stool samples from HC subjects and SLE patients. We also examined the nAg reactivity of fecal IgA and its subclasses. We found that, in addition to relatively higher levels of total IgA [12], fecal levels of Zonulin, and IgA1- and IgA2- subclasses are significantly higher in SLE patients. We also found, for the first time, that fecal IgA and its subclasses, IgA1 particularly, from SLE patients have significantly higher nAg reactivity compared to that of HCs, and these features and nAg-reactive IgA1:IgA2 ratio correlate with the fecal levels of gut permeability marker Zonulin. These observations indicate that the epithelial barrier function of proximal gut in SLE patients is compromised, potentially leading to a pro-inflammatory response including higher nAg IgA production. These results prompt the need for systematic longitudinal studies in at-risk population to assess the possible role of pre-clinical stage gut permeability and inflammation in disease onset. Our results also suggest that fecal IgA features could serve as valuable indicators of the systemic autoimmune process in lupus patients, and potentially, at-risk subjects.
2. Materials and methods
2.1. Study subjects and samples.
Archived stool sample aliquots, originally collected at the Medical University of South Carolina (MUSC) clinics and cryopreserved for an independent microbiome project, under the Institutional review board (IRB) approved protocol, were used in this study. Additional IRB approval was obtained before using the stool sample aliquots for this study to determine the IgA features and gut inflammation marker levels. Cross-sectional samples from 21 adult SLE patients and 21 adult HC subjects were analyzed. Samples were either from patients with at least 4 of the 11 ACR revised criteria (for the Classification of SLE) or unaffected controls with no known personal or family history of autoimmune disease by self-report (for the classification of HC). The original IRB protocol excluded subjects who received systemic antibiotics or commercial supplemental probiotics within the past 3 months. Those with chronic gastrointestinal disorders such as inflammatory bowel disease, irritable bowel syndrome, celiac disease, persistent infectious gastroenteritis, colitis or gastritis, or chronic diarrhea by self-report were also excluded. All samples were from self-identified African American women. Serum samples from all subjects, obtained at the time of stool collection, were also tested for ANA levels at the Oklahoma Medical Research Foundation (OMRF). The clinical data recorded the ANA results as actual titer values or ANA positive (titer ≥1:80) or ANA negative (titer: <1:80). Key clinical characteristics including the systemic lupus erythematosus disease activity index (SLEDAI) scores of SLE and HC sample donors are shown in Table 1.
Table 1:
Demographic and clinical characteristic of HCs and SLE patients
| Variable | Study group | |
|---|---|---|
| HC (n=21) | SLE (n=21) | |
|
| ||
| Ethnicity- African American (%) | 100 | 100 |
|
| ||
| Age (years; mean ± SD) | 47.14 ± 15.40 | 53.57 ± 13.42 |
|
| ||
| Sex- female (%) | 100 | 100 |
|
| ||
| Smoking (%) | 23.80 | 4.76 |
|
| ||
| SLE diagnosis (%) | 0 | 100 |
|
| ||
| SLE onset age (years; mean ± SD) | NA* | 34.43 ± 14.73 |
|
| ||
| SLEDAI score (mean ± SD) | 0 | 6.28 ± 5.81 |
|
| ||
| SLICC total (mean ± SD) | 0.14 ± 0.35 | 3.19 ± 1.98 |
|
| ||
| ACR criteria count (mean ± SD) | 0.68 ± 0.67 | 6.97 ± 1.70 |
|
| ||
| ANA positivity-titer ≥ 1:80 (%) | 28.57 | 100 |
|
| ||
| ANA titer value (mean ± SD) | 28.57 ± 38.24** | 891.42 ± 2196** |
|
| ||
| Nephritis (%) | 0 | 47.62 |
|
| ||
| Malar rash (%) | 4.76 | 61.90 |
|
| ||
| Discoid rash (%) | 4.76 | 33.33 |
|
| ||
| Photosensitivity (%) | 0 | 76.19 |
|
| ||
| Cutaneous lesion (%) | 0 | 71.42 |
|
| ||
| Oral/Nasal ulcers (%) | 0 | 57.14 |
|
| ||
| Arthritis (%) | 0 | 100 |
|
| ||
| Serositis (%) | 4.76 | 52.38 |
|
| ||
| Renal disease (%) | 0 | 47.62 |
|
| ||
| Neurological disorder (%) | 0 | 9.52 |
|
| ||
| Hematological disorder (%) | 19.04 | 71.42 |
|
| ||
| Immune disorder (%) | 4.76 | 71.42 |
Not applicable
Results were recorded as ANA positive (≥1:80) and ANA negative (<1:80) for about 40% of the samples in our database. Hence, these values may not represent true titers of all samples.
2.2. Extraction and quantitation of inflammation markers and antibodies:
Stool aliquots were weighed, suspended in proportionate volume of PBS (10% suspension or 100 mg feces/ml; w/v) by breaking the fecal material using pipette tip, high speed vortexing for 1 min, and followed by shaking at 800rpm for overnight at 4°C. These suspensions were centrifuged at 14,000 rpm for 10 min, upper 2/3 portion of the supernatants were separated and used in ELISA assays for estimating Calprotectin, Zonulin, IgA, IgA1 and IgA2 levels. Calprotectin levels were determined in optimally diluted (1:20) extracts using Human- S100A8/S100A9 Heterodimer DuoSet-ELISA kit from R&D Systems. Zonulin levels were determined in similarly diluted extracts using human Zonulin Stool ELISA kit from ALPCO. For detection of IgA, IgA1 and IgA2, in-house sandwich ELISAs with purified, commercially available antibodies and standards for generating standard curves were employed.
For IgA, IgA1 and IgA2 sandwich ELISAs, purified anti-mouse IgA, IgA1 and IgA2 monoclonal antibody (Southern Biotech) coated wells (0.1μg/well in 50μl) were incubated with optimum dilution of samples for 2h. Wells were incubated further with biotin-linked polyclonal anti-mouse IgA, IgA1 and IgA2 antibody for 1h, and finally with streptavidin-HRP for 30 min, before developing the reaction using TMB/H202 substrate and read at 450nm. All polyclonal antibodies were human IgG and IgM and other species Ig adsorbed (Southern Biotech) and showed no detectable cross-reactivity when tested against purified IgG and IgM. Initial optimization steps determined that the optimum dilutions of the extracts were 1:3000 for IgA, 1:500 for IgA1, and 1:1000 for IgA2. Purified mouse IgA, IgA1 and IgA2 (Athens Research and Southern Biotech) were used in each plate for generating respective standard curves to calculate the concentration in 100mg stool samples. These values were then converted to respective antibody concentration per gram of stool with a multiplication factor of 10.
2.3. Determination of nAg reactivity titer of fecal antibodies:
Antibody titers against nAgs (nucleohistone and dsDNA) in aforementioned fecal extracts were determined by employing in-house indirect ELISA [3, 5] with necessary modifications. Briefly, 0.5μg/well of nucleohistone (Sigma-Aldrich) or dsDNA from calf thymus (Sigma-Aldrich) was coated as antigen (carbonate buffer or DNA-coating reagent from Invitrogen respectively), overnight, onto ELISA plate wells. These wells were then incubated with serial dilutions of the fecal extracts (starting at 1:20 dilution) for 2 hours and followed by 1 hour incubation with biotin-linked anti-human IgA, IgA1, and IgA2 antibody. Streptavidin-HRP was added to the well for 30 min, before developing the reaction using TMB/H202 substrate and the plates were read at a wavelength of 450 nm. Highest dilution of the sample that produced an OD value of ≥0.05 above background value was considered as the nAg reactive titer of 100 mg feces. These titer values were then converted to per gram nAg reactivity titer with a multiplication factor of 10.
2.4. IFA staining of Hep2 cells to detect ANA.
Kallestad Hep-2 Complete Kit (Bio-rad) was used to detect ANA reactive fecal IgA following the kit instructions. 1:40 dilution of fecal extracts was employed. Anti-human IgG-FITC from the kit was replaced with anti-human IgA-Alexa flour 488 reagent as the secondary antibody to detect fecal IgA antibody. Relative fluorescence intensities were graded arbitrarily on a 0–4 scale using a fluorescent microscope.
2.5. Statistical analysis:
Mann-Whitney test using GraphPad Prism was employed to calculate p-values. A P value of ≤0.05 was considered statistically significant.
3. Results
3.1. Levels of fecal proinflammatory/permeability marker and IgA and its subclasses (IgA1 and IgA2) are higher in SLE patients.
Extracts were prepared from frozen stool aliquots of 21 new onset SLE patients and 21 HCs and subjected to quantitative ELISA to determine the levels of calprotectin, zonulin, IgA, IgA1 and IgA2. As observed in Fig. 1A, protein levels of the pro-inflammatory marker calprotectin were modestly higher (not significant statistically) in stool samples from SLE patients compared to HC. Fig. 1B shows that fecal levels of the gut permeability marker zonulin were significantly higher in SLE patient samples compared to HC samples. As reported before [12], total IgA levels were also significantly higher in fecal samples of SLE patients (Fig. 1C). Importantly, the levels of both IgA subclasses, IgA1 and IgA2, were significantly higher in SLE patient samples compared to that of HCs (Fig. 1D & 1E). To assess if SLE patients, compared to HCs, show different degrees of IgA1 and IgA2 secretion in the gut, IgA1:IgA2 ratios were calculated for each sample. As observed in Fig. 1F, although not significant statistically, IgA1:IgA2 ratios were relatively higher in SLE patients compared to controls. To assess if fecal IgA levels correlate with the disease activity of SLE patients, IgA, IgA1 and IgA2 levels were correlated with the SLEDAI scores of SLE patients. As observed in Fig. 1G–I, the disease activity as indicated by higher SLEDAI scores correlated significantly with the fecal IgA and IgA1 levels, modestly with IgA2 levels. These results show that while the levels of overall IgA and both subclasses are higher in the stool samples of SLE patients and the IgA levels correlate with the disease activity, these patients appear to release relatively higher amounts of IgA1 than IgA2 into the gut lumen as compared to HCs.
Figure 1: Levels of fecal proinflammatory/permeability marker, and IgA and its subclasses (IgA1 and IgA2) in HC subjects and SLE patients.
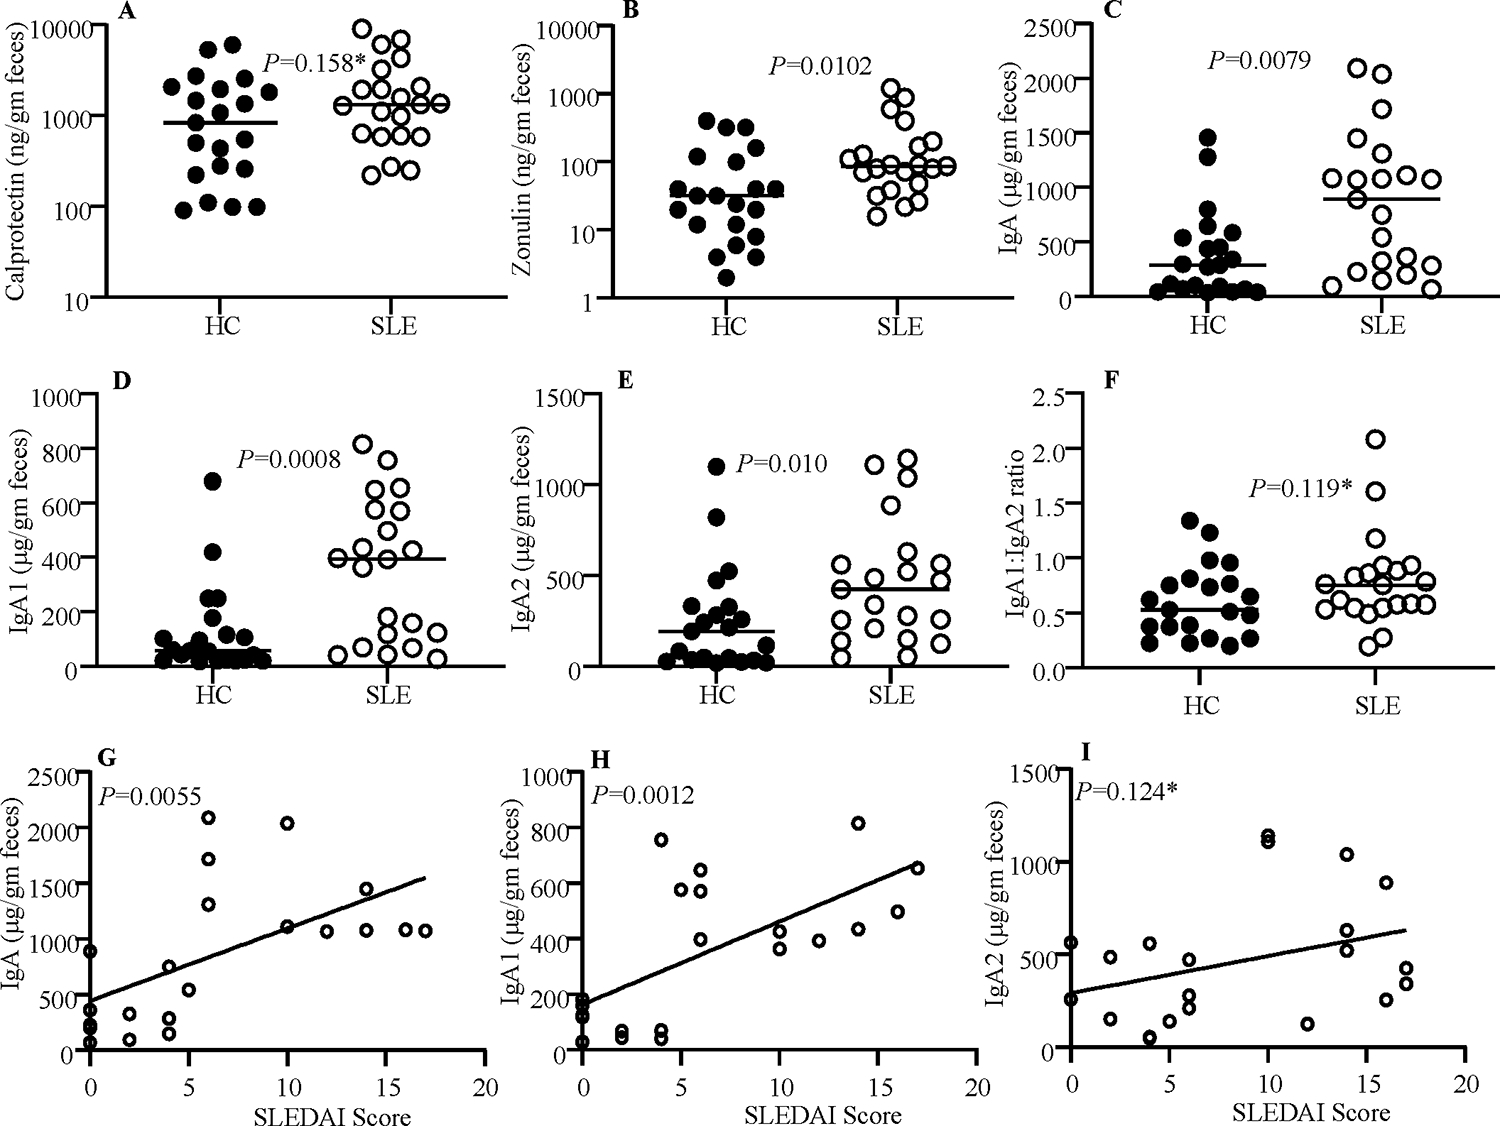
Optimally diluted PBS extracts of stool samples from HC subjects (n=21) and SLE patients (n=21) were tested for protein levels of calprotectin (A), Zonulin (B), IgA (C), IgA1 (D) and IgA2 (E) as described under materials and methods section. IgA1: 1gA2 ratios are also shown (F). P=values by Mann-Whitney test. Fecal IgA (G), IgA1 (H), and IgA2 (I) concentrations of samples from SLE patients were correlated with respective SLEDAI scores by Pearson’s correlation approach. *Not significant statistically.
3.2. Fecal IgA and its subclasses show greater nAg reactivity.
To determine if fecal IgA of SLE patients have higher nAg reactivity, dsDNA and NH reactive IgA titers of extracts prepared from stool samples were determined by ELISA. As shown in Fig. 2A, both dsDNA and NH reactive IgA titers were significantly higher in the samples of SLE patients compared to that of HCs. Further, Hep2 cell substrate-based immunofluorescence assay showed similarly higher nAg reactivity by fecal IgA of SLE patients (Fig. 2B). Examination of the nAg reactivities of IgA subclasses revealed that the dsDNA and NH reactive IgA1 and IgA2 antibody titers are higher in SLE patients compared to HCs (Fig. 2C). Importantly, differences in the dsDNA and NH reactive titers of SLE patients and HCs were more pronounced with IgA1 than IgA2. Therefore, dsDNA and NH reactive fecal IgA1: IgA2 ratios were determined. As observed in Fig. 2D, nAg reactive IgA1:IgA2 ratios were significantly higher in samples from SLE patients than that from HCs. Unlike the protein levels, nAg reactivity of fecal IgA did not show statistically significant correlation with SLEDAI scores (not shown). These results suggest that irrespective of the disease activity and the IgA abundance, fecal IgA and IgA1 of SLE patients are more nAg reactive than that of HCs. Overall, these results show that the nAg reactivity of fecal IgA is higher with SLE patient samples, and this is more pronounced with IgA1.
Figure 2: nAg reactivity of fecal IgA and its subclasses.
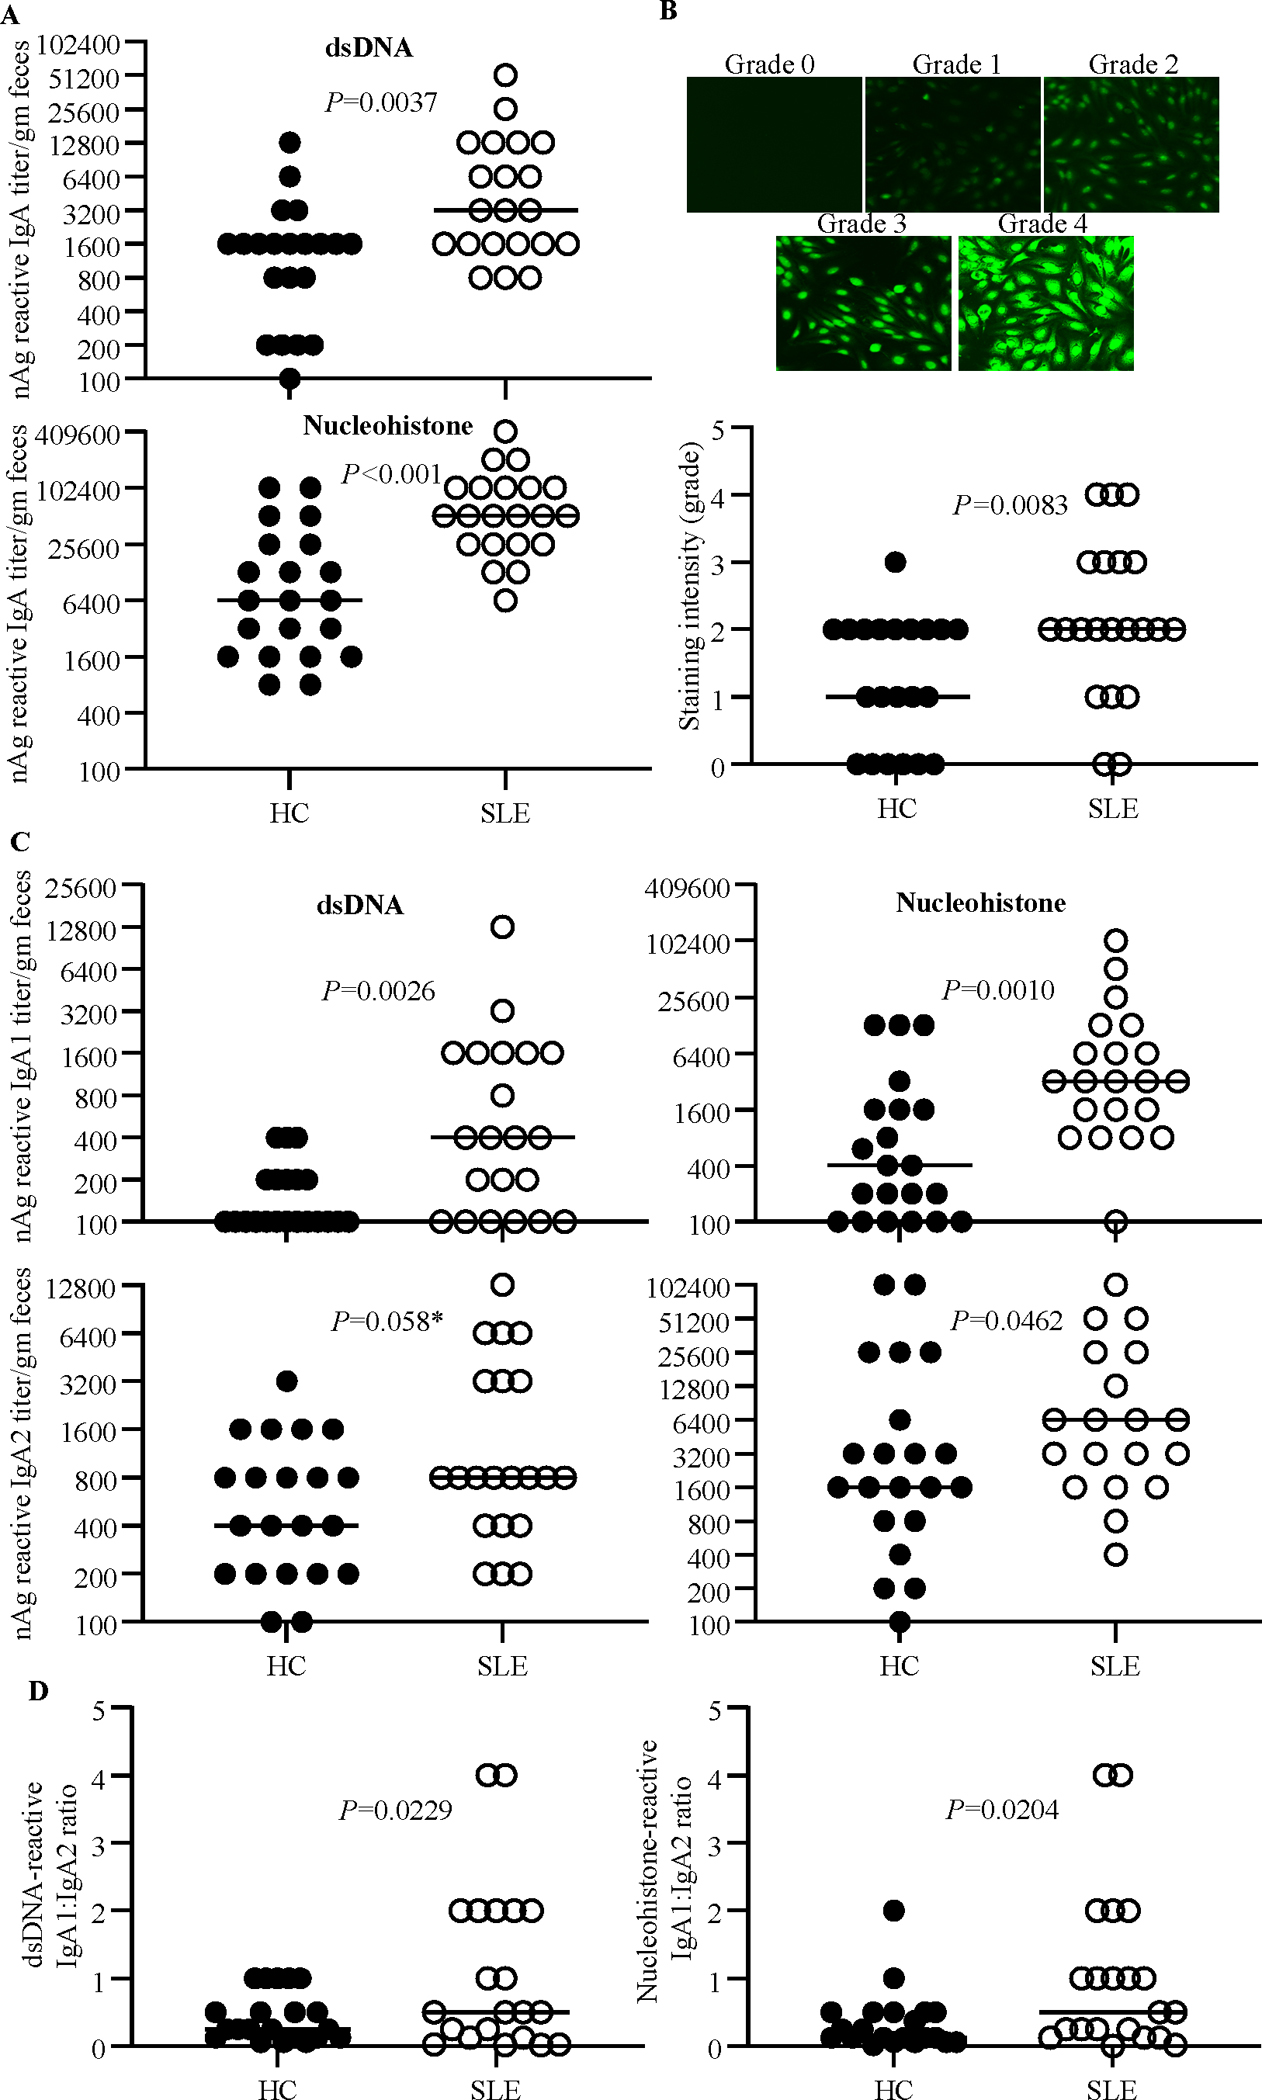
PBS extracts of stool samples from HC subjects (n=21) and SLE patients (n=21) were examined for nAg reactivity as described under the Materials and methods section. A) nAg reactivity of total IgA was determined with dsDNA and NH(nucleohistone) coated plates, 2-fold serial dilutions of the extracts, and anti-human-IgA-biotin as the secondary antibody. B) Hep-2 slides were stained using 1:40 dilution of fecal extracts and anti-human IgA-Alexa flour 488 reagent and imaged under a fluorescent microscope. Relative fluorescence intensities were graded arbitrarily on a 0–4 scale. Representative images (upper panel) and overall intensities (lower panel) are shown. C) nAg reactivity of total IgA was determined as described for panel A using anti-human-IgA1- or IgA2- biotin as the secondary antibody. D) dsDNA reactive IgA1: 1gA2 ratios are shown. P=values by Mann-Whitney test. *Not significant statistically.
3.3. Zonulin levels correlate with fecal IgA abundance and nAg reactivity.
Since the levels of Zonulin in the fecal samples were significantly higher in SLE patients compared to HCs, we examined if the abundance and nAg reactivity of fecal IgA correlate with the protein levels of this gut permeability protein in each group. Interestingly, while Zonulin levels in the fecal samples of both HC and SLE groups showed significant correlation with total IgA and IgA1 abundances (Fig. 3A) nevertheless, samples from SLE group showed an overall better correlation of Zonulin levels with both subclasses of IgA as well as total IgA levels. Importantly, while the Zonulin levels of samples from both HC and SLE groups showed significant correlation with dsDNA reactivity of total IgA, Zonulin levels of samples from SLE group, but not HC group, correlated significantly with nAg reactivity of IgA1. Overall, these observations suggest that Zonulin dependent higher gut permeability, particularly in the proximal gut, of SLE patients, and the associated pro-inflammatory events could be a critical contributing factor to the higher abundance and nAg reactivity of fecal IgA.
Figure 3: Zonulin levels correlate with the fecal IgA abundance and nAg reactivity.
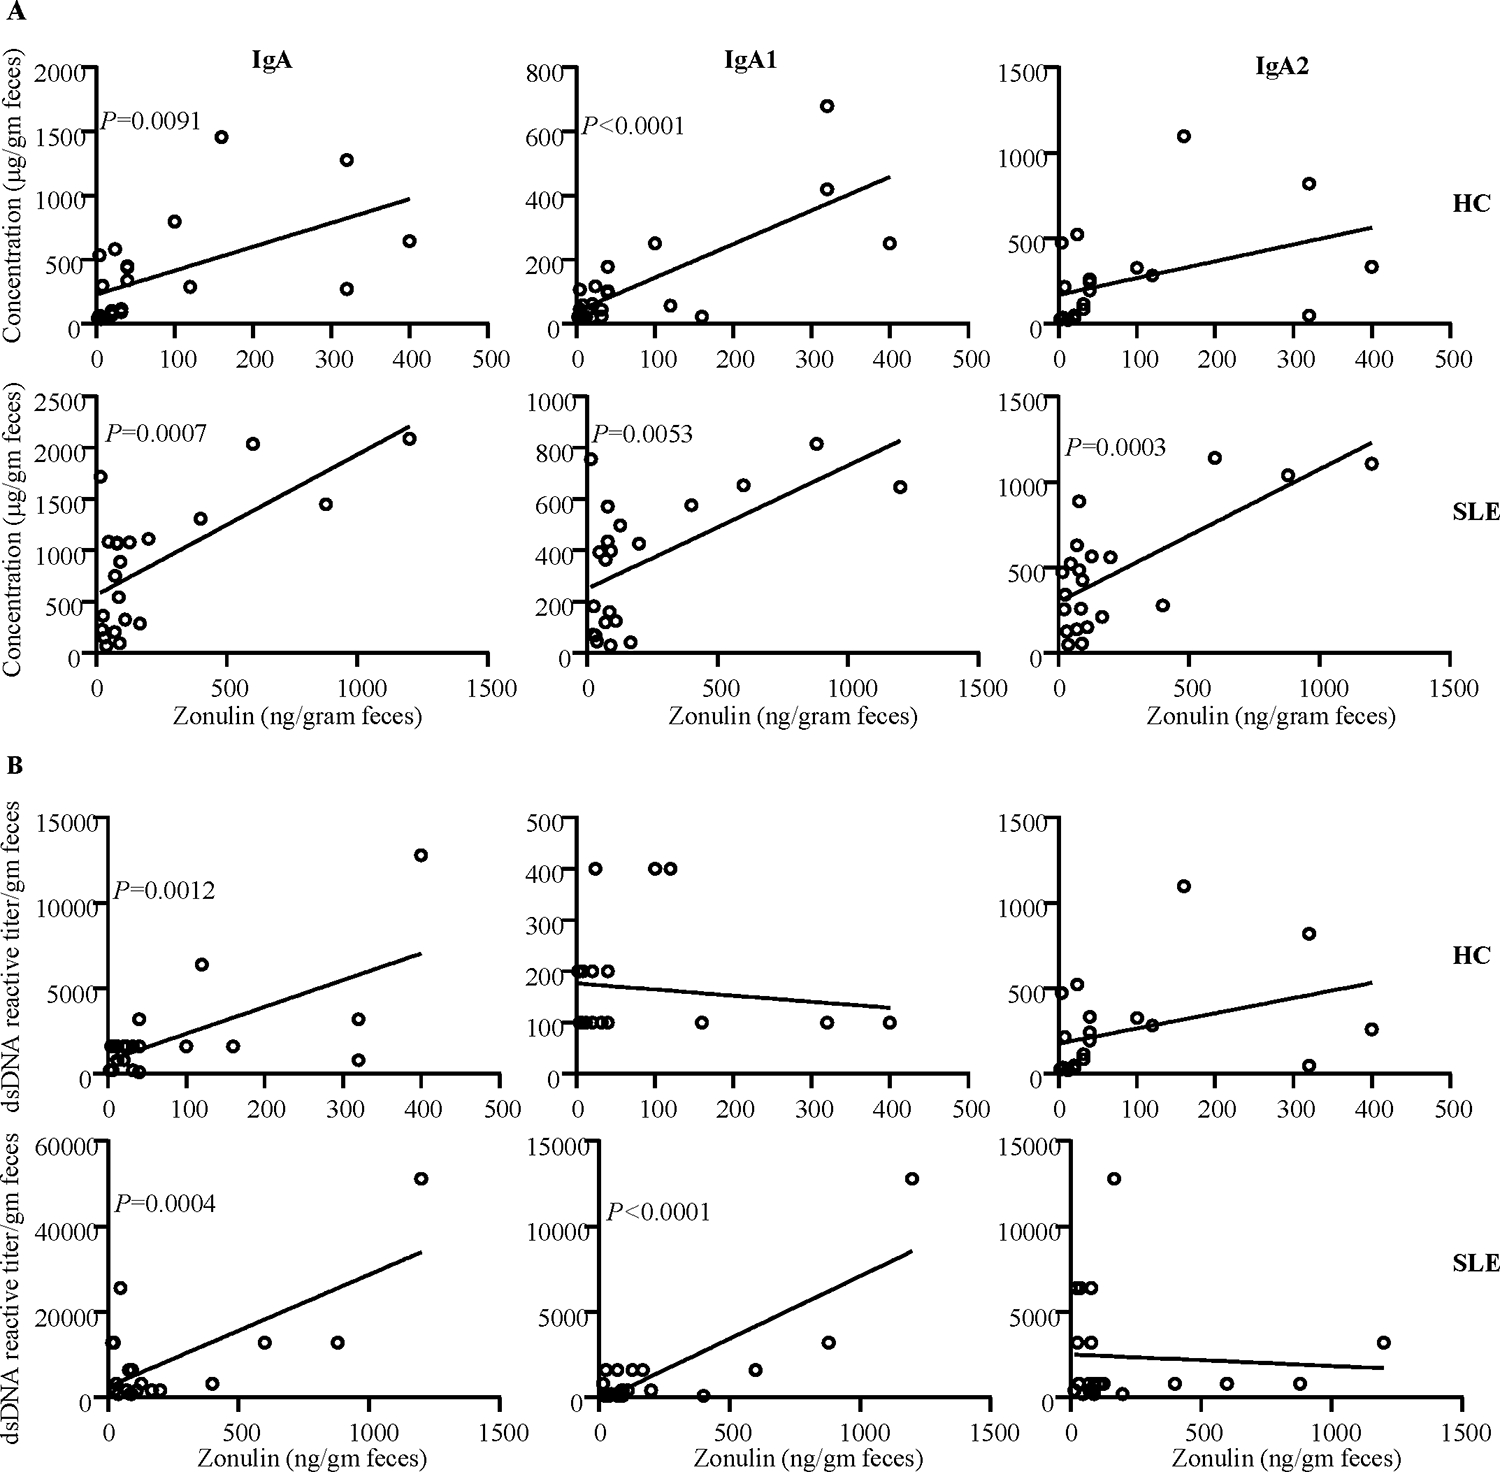
A) Fecal IgA, IgA1 and IgA2 concentrations of samples from HC subjects and SLE patients were correlated with respective fecal Zonulin concentration values by Pearson’s correlation approach. B) dsDNA reactivity titers of fecal IgA, IgA1 and IgA2 of HC subjects and SLE patients were correlated with respective fecal Zonulin concentration values by Pearson’s correlation approach.
4. Discussion
Our recent studies have shown that in a mouse model of spontaneous autoimmune lupus, pro-inflammatory phenotype of the gut mucosa at as early as juvenile age correlates with the gender bias observed in lupus-like disease[4, 5]. High levels of a pro-inflammatory factor, calprotectin were detected in the fecal samples of SLE patients by another group[12]. On the other hand, a role for the gut permeability protein Zonulin, which is produced primarily in the small intestine, in autoimmune and inflammatory conditions has also been described[13]. However, whether Zonulin is released at higher levels in the gut lumen of SLE patients is not known. Our observations that Zonulin levels are significantly higher in the fecal samples of SLE patients, suggest that SLE patients, and potentially at-risk subjects, may have higher gut permeability due to the higher levels of Zonulin protein being produced in the gut.
Pro-inflammatory events of the gut mucosa can contribute to the production and release of antibodies, IgA particularly, in the gut lumen. While a recent report has shown that fecal IgA levels are higher in SLE patients compared to HCs [12], we reported that fecal IgA of lupus-prone mouse models have higher nAg reactivity long before the clinical disease onset [6, 14]. In agreement with the previous report [12], we found that stool samples from majority of the 21 SLE patients tested in our study had higher amounts of soluble IgA than HCs. Importantly, however, we report that not only both IgA1 and IgA2 subtypes levels are higher in the fecal samples of SLE patients, but also IgA antibodies in general, and IgA1 in particular, have significantly higher nAg reactivity compared to that of HCs.
IgA produced in the human intestine is comprised of two subclasses, IgA1 and IgA2 [10]. While human serum contains predominantly IgA1, feces contains both IgA1 and IgA2 with higher amounts of the latter. This is because while plasma cells in the small intestine secrete mostly IgA1, the proportion of IgA2 production increases from the duodenum and this subclass is produced at profoundly higher levels in the colon. Although higher B cell function and antibody production occurs in SLE patients, it is not known whether IgA1 and IgA2 subtypes are produced disproportionately in the gut mucosa of SLE patients compared to HCs. Our results show that the overall abundances of IgA and its subtypes are higher in the fecal samples of most SLE patients and the IgA and IgA1 levels correlate well with the SELDAI scores. Further, IgA1:IgA2 ratio is higher in SLE patients compared to HCs suggesting a relatively higher activation of IgA producing B cells in the upper digestive tract of SLE patients, compared to the distal gut.
Autoantibody response against nucleic acids and nuclear proteins including histones is the key feature of lupus in human subjects and rodent models. Our observation that fecal IgA, both IgA1 and IgA2 subclasses, of SLE patients have higher nAg reactivity suggests that IgA response to gut microbes could be contributing to the autoimmune process in SLE. Of note, IgA produced in the gut mucosa are mostly poly-reactive and previous studies have recognized some degree of self-antigen reactivity of fecal IgA and/or B cell clones from the gut mucosa of healthy individuals [15]. Hence it was not surprising that fecal IgA of many HCs also showed nAg reactivity. Nevertheless, SLE patients have significantly higher nAg reactive fecal IgA than the HCs. Higher IgA production and nAg reactivity of fecal IgA, particularly IgA1, in SLE patients could also be possibly linked to higher gut permeability associated inflammation in SLE patients. Since IgA1 and Zonulin are produced mainly in the small intestine [13, 16], higher correlation of Zonulin levels with IgA and IgA1 abundance and their nAg reactivities in SLE patients does support this notion.
In summary, we found, for the first time, that both IgA1 and IgA2 levels are significantly higher in SLE patients compared to HCs. Most importantly, we found that fecal IgA, both IgA1 and IgA2 subclasses, of SLE patients are more nAg reactive compared to that of HC subjects. Furthermore, fecal IgA1:IgA2 abundance and nAg reactivity ratios are higher in SLE patient samples compared to that of HCs. Our observations suggest that, in addition to the higher abundance and nAg reactivity of fecal IgA and its subclasses, particularly IgA1, in association with Zonulin levels could serve as a biomarker and be indicative of the severity of systemic autoimmunity in SLE patients. In this regard, based on the correlation between fecal IgA levels and SLEDAI scores, it would be informative to determine if fecal IgA and subclass levels alter during active disease flares in SLE patients. Of note, our data shows that while the fecal IgA of lupus patients is more nAg reactive irrespective of the disease activity or the IgA protein levels, fecal IgA and IgA1 protein levels are largely indicative of the disease activity and, possibly, an inflamed nature of the gut mucosa in patients with active disease. Further, our results also suggest that higher fecal IgA protein levels in patients with higher disease activity may not necessarily translate to higher nAg reactivity.
Although additional studies using longitudinal samples from subjects who are susceptible to SLE are needed, our current observations in the context of our preclinical studies showing that nAg reactive fecal IgA appears prior to seropositivity [6, 7, 14] suggest the potential biomarker value of fecal IgA features including nAg reactivity alone or along with Zonulin levels, in predicting the ongoing autoimmune process, if any, in at-risk subjects. With respect to the potential mechanism that causes higher fecal IgA levels in SLE patients is elevated Zonulin production in their proximal gut causing higher gut permeability, microbial translocation, and pro-inflammatory immune responses to both microbial and host antigens. It is likely that this pro-inflammatory response contributes to the generation/expansion of large number of polyreactive and nAg specific B cells in the gut mucosa of SLE patients compared to HCs. As observed in our preclinical studies [6, 7, 14], it is likely that such pro-inflammatory events, auto-and cross- reactive antigen priming, and nAg reactive antibody production are initiated in the gut mucosa long before the detection of clinical stage disease and eventually spread to the systemic compartment. Validation of this notion requires systematic, long-term longitudinal studies in at-risk, first-degree relatives and assessment of progressive changes in the systemic and intestinal inflammatory features before the clinical disease onset.
Acknowledgments:
This work was supported by internal funds from MUSC, National Institutes of Health (NIH) grants R21AI136339 and R01AI138511 to CV and R21AR067459 and K24AR068406 to DK. R.G. performed experiments and reviewed the paper, DK provided clinical samples and data collected under her IRB approved protocols, and C.V. designed the study, performed the experiments, and wrote the paper. Dr. Vasu is the guarantor of this work and, as such, had full access to all the data and takes responsibility for the integrity and accuracy of the data and analysis.
Footnotes
Conflict of Interest statement: Authors do not have any conflict(s) of interest to disclose.
References:
- [1].Gualtierotti R, Biggioggero M, Penatti AE, Meroni PL. Updating on the pathogenesis of systemic lupus erythematosus. Autoimmun Rev, 2010. 10:3–7. [DOI] [PubMed] [Google Scholar]
- [2].Li L, Mohan C. Genetic basis of murine lupus nephritis. Semin Nephrol, 2007;27:12–21. [DOI] [PubMed] [Google Scholar]
- [3].Johnson BM, Gaudreau MC, Al-Gadban MM, Gudi R, Vasu C. Impact of dietary deviation on disease progression and gut microbiome composition in lupus-prone SNF1 mice. Clin Exp Immunol, 2015;181:323–37. [DOI] [PMC free article] [PubMed] [Google Scholar]
- [4].Johnson BM, Gaudreau MC, Gudi R, Brown R, Gilkeson G, Vasu C. Gut microbiota differently contributes to intestinal immune phenotype and systemic autoimmune progression in female and male lupus-prone mice. J Autoimmun, 2020;108:102420. [DOI] [PMC free article] [PubMed] [Google Scholar]
- [5].Gaudreau MC, Johnson BM, Gudi R, Al-Gadban MM, Vasu C. Gender bias in lupus: does immune response initiated in the gut mucosa have a role? Clinical and experimental immunology, 2015;180:393–407. [DOI] [PMC free article] [PubMed] [Google Scholar]
- [6].Sun W, Gudi RR, Johnson BM, Vasu C. Abundance and nuclear antigen reactivity of intestinal and fecal Immunoglobulin A in lupus-prone mice at younger ages correlate with the onset of eventual systemic autoimmunity. Sci Rep, 2020;10:14258. [DOI] [PMC free article] [PubMed] [Google Scholar]
- [7].Gudi R, Roy S, Sun W, Vasu C. Preclinical stage abundance and nuclear antigen reactivity of fecal Immunoglobulin A (IgA) varies among males and females of lupus-prone mouse models. Immunology, 2022. [DOI] [PMC free article] [PubMed] [Google Scholar]
- [8].Lerner A, Matthias T. Changes in intestinal tight junction permeability associated with industrial food additives explain the rising incidence of autoimmune disease. Autoimmun Rev, 2015;14:479–89. [DOI] [PubMed] [Google Scholar]
- [9].Manfredo Vieira S, Hiltensperger M, Kumar V, Zegarra-Ruiz D, Dehner C, Khan N et al. Translocation of a gut pathobiont drives autoimmunity in mice and humans. Science, 2018;359:1156–61. [DOI] [PMC free article] [PubMed] [Google Scholar]
- [10].Donaldson GP, Ladinsky MS, Yu KB, Sanders JG, Yoo BB, Chou WC et al. Gut microbiota utilize immunoglobulin A for mucosal colonization. Science, 2018;360:795–800. [DOI] [PMC free article] [PubMed] [Google Scholar]
- [11].Woof JM, Russell MW. Structure and function relationships in IgA. Mucosal Immunol, 2011;4:590–7. [DOI] [PubMed] [Google Scholar]
- [12].Azzouz D, Omarbekova A, Heguy A, Schwudke D, Gisch N, Rovin BH et al. Lupus nephritis is linked to disease-activity associated expansions and immunity to a gut commensal. Ann Rheum Dis, 2019;78:947–56. [DOI] [PMC free article] [PubMed] [Google Scholar]
- [13].Fasano A. Zonulin, regulation of tight junctions, and autoimmune diseases. Ann N Y Acad Sci, 2012;1258:25–33. [DOI] [PMC free article] [PubMed] [Google Scholar]
- [14].Gudi R, Roy S, Sun W, Vasu C. Preclinical stage abundance and nuclear antigen reactivity of faecal Immunoglobulin A vary among males and females of lupus-prone mouse models. Immunology, 2022;165:497–507. [DOI] [PMC free article] [PubMed] [Google Scholar]
- [15].Bunker JJ, Bendelac A. IgA Responses to Microbiota. Immunity, 2018;49:211–24. [DOI] [PMC free article] [PubMed] [Google Scholar]
- [16].Tripathi A, Lammers KM, Goldblum S, Shea-Donohue T, Netzel-Arnett S, Buzza MS et al. Identification of human zonulin, a physiological modulator of tight junctions, as prehaptoglobin-2. Proceedings of the National Academy of Sciences of the United States of America, 2009;106:16799–804. [DOI] [PMC free article] [PubMed] [Google Scholar]