Abstract
Amyotrophic lateral sclerosis (ALS) is a rare and devastating neurodegenerative disorder that is highly heterogeneous and invariably fatal. Due to the unpredictable nature of its progression, accurate tools and algorithms are needed to predict disease progression and improve patient care. To address this need, we developed and compared an extensive set of screener-learner machine learning models to accurately predict the ALS Function-Rating-Scale (ALSFRS) score reduction between 3 and 12 months, by paring 5 state-of-arts feature selection algorithms with 17 predictive models and 4 ensemble models using the publicly available Pooled Open Access Clinical Trials Database (PRO-ACT). Our experiment showed promising results with the blender-type ensemble model achieving the best prediction accuracy and highest prognostic potential.
Introduction
Amyotrophic lateral sclerosis (ALS) is a neurological disorder that is uncommon and results in a gradual weakening of motor neurons1. The root causes of the disease are not yet clearly understood, and currently, there have been only three authorized medications (Riluzole11, Endaravone12, AMX003513) that have been shown to extend survival and mildly slowing down the disease progression over the passing decade11. In current practice, the most widely used instrument for evaluating the progression of ALS is the ALS Function-Rating-Scale (ALSFRS) or its revised version, ALSFRS-R. The ALSFRS is a widely adopted questionnaire that comprises 12 questions to assess ALS disease progression in clinics, with a focus on bulbar, motor and respiratory functions such as breathing, dressing, stair-climbing, walking, swallowing, and speaking. Each question is scored between 1 to 4 with 4 being at the highest function level. ALS progression is determined by calculating the slope between the first and last ALSFRS total score for a specific period of time. It is often believed that ALS progression is linear and heterogeneous. However, an effective prognostic model is still lacking to best predict the disease trajectory, as well as distinguish between the “fast progressor” and the “slow progressor”.
To better advance the understanding of ALS, The Pooled Resource Open-Access ALS Clinical Trials (PRO-ACT)3 database was proposed and released. This database contains anonymized, individualized data from more than from 29 Phase II/III clinical trials for over 11,000 ALS patients, representing the largest aggregation of ALS clinical trial data available. It is maintained by Prize for Life Foundation9 for research purpose only. In 2015, the DREAM-Phil Bowen ALS Prediction Prize4Life Challenge was conducted using the PRO-ACT data, with the single goal of developing machine learning models to better predict disease progression, defined as the slope of the ALSFRS score between 3 and 12 months based on the patient’s initial 3 months of data. Since then, various teams have proposed multiple statistical and machine learning algorithms to improve the progression prediction (including but not limited to: regression models, including Random Forest, Bayesian trees, Nonparametric regression, support vector regression, multivariate regression, and linear regression), in combination with various approaches of feature selection (FS) and feature extraction (FE). The winning model in the competition was based on Gradient Boosted Regression Trees (GBRT) model, which was achieved by the UglyDuckling team14.
In this study, we developed and compared an extensive set of screener-learner machine learning models by pairing 5 state-of-the-arts feature selection algorithms with 17 predictive models, with the goal of further enhancing the prognostic potential using machine learning approaches. A screener-learner model combined FS algorithm with a prediction model, which have shown to often outperform the prediction model alone, as FS could effectively reduce data sparsity and noise15,16. We also explored 2 ensemble model approaches (blender and stack ensembles), which showed great promises in achieving further improvement in predicting the disease progression and survival. We finally provided explanations of the best predictive model (a blender ensemble) using the SHapley Additive exPlanations (SHAP) values to extrapolate both the marginal and interactive effects of all selected features [17].
Method
Dataset
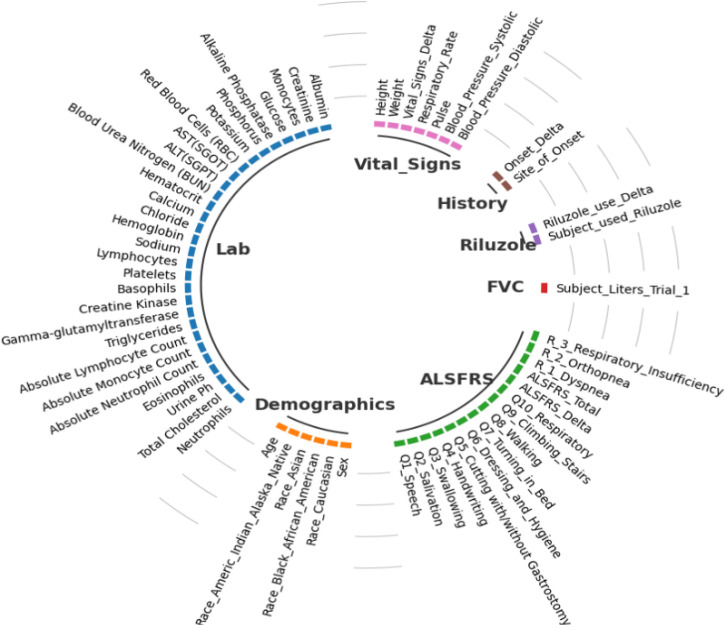
The dataset used in this study was obtained from the Pooled Resource Open-Access ALS Clinical Trials (PRO-ACT) repository, which we downloaded from the PRO-ACT website on November 1, 2022.10 This dataset includes data for more than 11,600 patients involved in 29 separate clinical trials, and it comprises 13 distinct tables containing a variety of information, including but not limited to ALSFRS questionnaire responses, laboratory data, demographics, details regarding the onset of the disease, and treatment data. Due to high data sparsity in 6 tables and to be comparable with published work, we pre-selected the remaining 7 tables for this analysis. Figure 1 provides an overview of the raw features from each of the 7 selected tables. For features with repeated measurements, we extracted 7 summary features (minimum, maximum, median, standard deviation, first and last observations, as well as the slope between the first and last observations) within the baseline time period (i.e., first 3 months). In total, we extracted 321 features. By following a “complete-set” approach, we excluded patients who had insufficient features due to missing.
Figure 1.
Raw clinical features and biomarkers in PRO-ACT
Outcome
The primary outcome of interest is disease progression, more specifically, defined as the pre-month-decline in the overall ALSFRS score (also known as the ALSFRS slope) from the 3rd to the 12th months since the observation window started, entailed in the following equation:
| (1) |
where t1 and t2 present the times (in months) of the first visit after 3 and 12 months, respectively.
Experimental Design
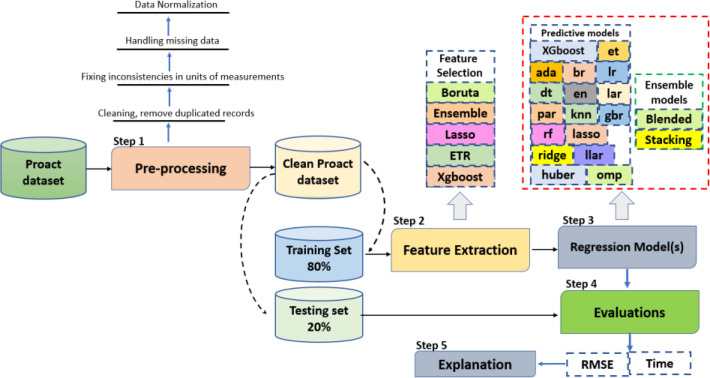
The experimental design is presented in Figure 1, which can be broken down into five steps: pre-processing, feature extraction and selection (“screener”), model development (“learner”), performance evaluation, and model interpretation.
Step 1 (Pre-processing): The preprocessing was first conducted by eliminating duplicate records and correcting inconsistencies in units of measurement. Next, we addressed missing data by discarding features with over 30% of missing values and replacing missing values in the remaining features using the single-value imputation method. Lastly, we normalized the data using the Min-Max normalization method. We then split the dataset into 80% training (2,119 patients) and 20% testing sets (530 patients). Step 2 (Feature extraction and selection, “screener”): For features with repeated measurements, we extracted 7 summary features (minimum, maximum, median, standard deviation, first and last observations, as well as the slope between the first and last observations) within the baseline time period (i.e., first 3 months). This resulted in a total of 321 initial features per patient. We then utilized five different FS algorithms to screen for the most relevant and stable features for predicting the ASLFRS slope, and they are: a) three model-specific embedded feature selection algorithms (Lasso [18], Extra Tree Regressor or ETR [19], and XGboost [20]); b) Boruta [21]; c) Ensemble [22]. In addition, we repeated each algorithm 5 times and assessed their stability using the Relative Weighted Consistency1 metric.
Step 3 (Develop predictive models and ensembles, “learner”): we explored 17 different predictive models (listed in Table 1), which can be generally categorized into: a) naïve-regression models (1); b) regularized regression models (8); c) tree-based bagging/boosting models (6); d) similarity-based models (1); e) Bayesian models (1). For models that required additional hyperparameter tuning, it was accomplished using 10-fold cross-validation within the training stage. We also utilized two model ensemble approaches: blended (i.e., voting) and stacking. We first combined the top 5 models to evaluate their performance on both the training and testing datasets, and then repeated this process with the top 10 models. Ensemble models are constructed based on the previous 17 predictive models with the best performance.
Table 1.
Predictive Models and Ensembles leaners.
| Abbreviation | Model name |
|---|---|
| Naïve regression model | |
| lr | Linear Regression |
| Regularized regression models | |
| ridge | Ridge Regression |
| lasso | Lasso Regression |
| en | Elastic Net |
| huber | Huber Regressor |
| llar | Lasso Least Angle Regression |
| lar | Least Angle Regression |
| omp | Orthogonal Matching Pursuit |
| par | Passive Aggressive Regressor |
| Tree-based bagging/boosting models | |
| dt | Decision Tree Model |
| rf | Random Forest |
| et | Extra Trees Model |
| ada | AdaBoost Model |
| gbr | Gradient Boosting Model |
| xgboost | Extreme Gradient Boosting |
| Similarity-based model | |
| knn | K Neighbors Regressor |
| Bayesian model | |
| br | Bayesian Ridge |
| Ensemble models | |
| blend | Blended Ensemble Model |
| stack | Stacking Ensemble Model |
Step 4 (Performance Evaluation): we evaluated and compared model performance using two testing metrics: a) Root Mean Square Error (RMSE) comparing the predicted slope and actual slope; and b) discriminative power of the predicted slope corresponding to true survival rate based on log-rank test: using a threshold at top 32 percentile (calibrated with true fast progressor rate), we divided the patient cohort into two distinct groups separately based on predicted slope, i.e., the “predicted fast progressor” and the “predicted slow progressor”, and compare if their survival rates are significantly different.
Step 5 (Model Explanation):
We employed SHAP (SHapley Additive exPlanations) value in the paper, which has been widely used in extrapolating marginal effects of features for machine learning models, which is model-agnostic [23]. The SHAP values evaluated how the predicted values changed by including a particular feature at certain value for each individual patient. It not only captured the global patterns of effects of each factor but can also be used to demonstrate the patient-level variations of the effects.
Results
Cohort Characteristics
The final eligible cohort contained 2,649 patients with 321 features, and Table 2 describes the basic characteristics of the ALS cohort. The average age of onset is 55 years, with a standard deviation of 11.3 years. The majority of the samples in this dataset were from patients who were identified as White/Caucasian with a percentage of 96.11% . There is a higher representation of males than females, with males accounting for 62.89% of the patients. 77.5% of patients experienced limb onset and 22.1% bulbar onset. 69% if the patients reported Riluzole use.
Table 2:
A brief descriptive statistic of the main cohort.
| Characteristic | Count (observed rate) | Characteristic | Mean (Std.) |
|---|---|---|---|
| Gender, male | 1666, (62.89 %) | Total ALSFRS (First) | 29.5 (6.14) |
| Race, White/Caucasian | 2543, (96.11%) | Total ALSFRS (Last) | 27.9 (6.64) |
| Riluzole use, yes | 1830, (69.08 %) | Age (onset) | 55 (11.03) year |
| Race, Black African American | 41 (1.54%) | Weight (first) | 72 (9.72) kg |
| Race, Asian | 16 (0.60) | FVC (Trial #1) (First) | 3.16 (1.05) liters |
| Onset, Limb | 2055, (77.50%) | Hight | 169.80 (5.514) cm |
| Onset, Limb and Bulbar | 11 (0.415) | Onset Delta | 536.16 (148) days |
| Onset, Bulbar | 583 (22.085) | FCV (Trial #1) (Last) | FCV (Trial #1) (Last) |
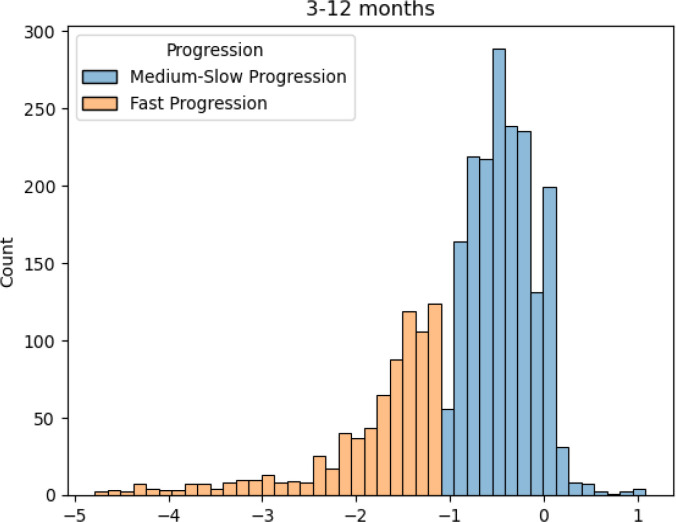
Figure 3 presents the marginal distribution of the primary outcome, i.e., ALSFRS slope between the 3rd and 12th month since trial enrollment. Using -1.1 as the threshold, we observed 1,804 (68.1%) medium-to-low progressor and 845 (31.9%) fast progressor, with a significantly wider range of slope variations among the fast progressors.
Figure 3.
ALSFRS slope distributio
Feature Selection
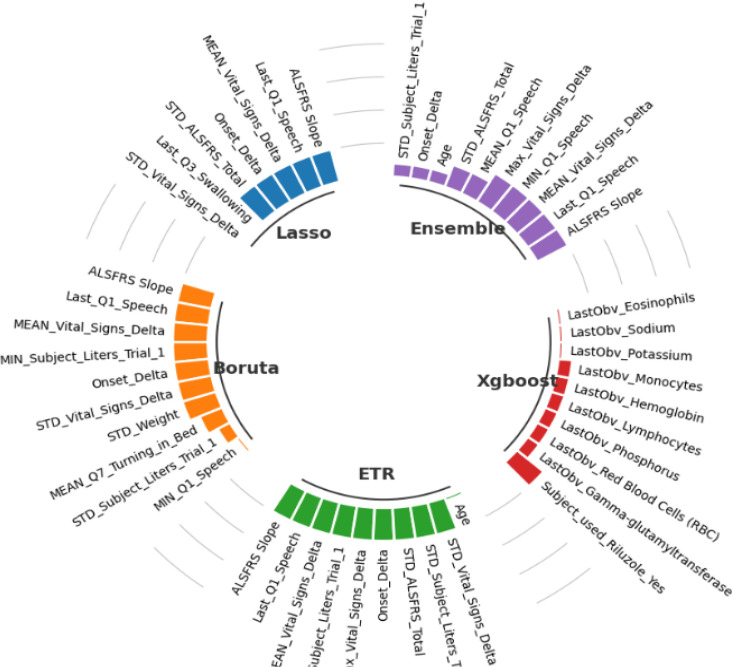
Figure 4 presents the selected features. For example, lasso algorithm selected only 7 features and eliminating 98% of the features, while the rest of the algorithms selected only 10 features. Four features were shared by all algorithms except XGboost, which were Onset Delta, ALSFRS Slope, Q1 Speech, and Vital Signs Delta. The stability of each algorithm was assessed using the Relative Weighted Consistency1 metric. Table 3 presents the stability, variance and number of selected features for each algorithm. Based on the reported results, the Lasso method has the highest stability score of 0.9246 and the lowest variance score of 0.00047, indicating that it is the most reliable algorithm with fewest number of selected features (6 ± 1). The Boruta and ETR methods have similar stability and variance scores, and both selected 10 ± 3 features. The Ensemble method has a lower stability score and a higher variance score compared to the other methods, indicating that its results may be less reliable. While, XGboost algorithm has the lowest stability score (0.3078) and the highest variance score (0.01390), which is less reliable compared to the other methods.
Figure 4.
Selected features from each algorithm.
Table 3.
Summary of feature selection algorithm ranked by stabili
| Feature selection algorithm | Stability | Variance | Number of selected features |
|---|---|---|---|
| Lasso | 0.9246 | 0.00047 | 6 ± 1 |
| Boruta | 0.9173 | 0.00046 | 10 ± 3 |
| ETR | 0.9173 | 0.00001 | 10 ± 3 |
| Ensemble | 0.7210 | 0.00210 | 10 ± 6 |
| XGboost | 0.3078 | 0.01390 | 10 ± 1 |
Finally, Lasso algorithm seems to be the most reliable algorithm in terms of selecting a small number of stable features, while the other algorithms may be more suitable if a larger number of features are desired or if there is a need for more flexibility in the selected features.
Single-Learner Models
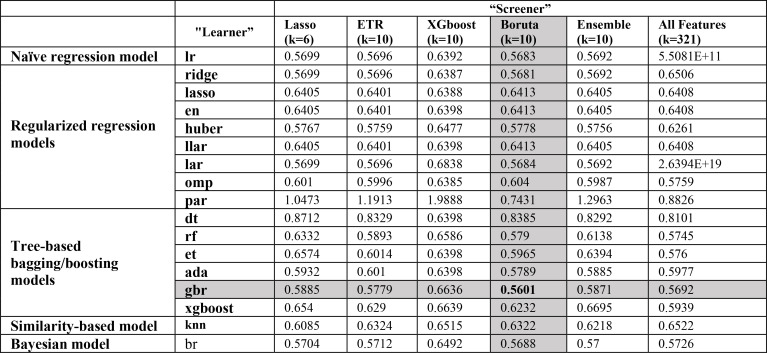
Incorporating selected features from each one of the FS algorithms as well as using all features (without feature selection), the prediction performances of the 17 models are reported in Table 4. For all regression models (Naïve regression model, Regularized regression models, Tree-based bagging/boosting models, Similarity-based model, and Bayesian model), using Boruta algorithm as a “screener” outperforms all the others. The execution time for training each model with selected features comes from Boruta algorithm is between [0.05-0.473] seconds. The best single model was gbr model with Boruta “screener” had the best performance with an RMSE of 0.5601. On average, all “learners” achieved better performance under the “screener-learner” framework, compared to using all features. The Boruta “screener” performs better than most the other FS methods for almost all predictive models, while features selected by XGboost “screener” often resulted in worse-off predictions across almost all predictive models.
Table 4.
Performance summary of predictive models.
Ensemble-Learning Models
Table 5 displays the ensemble model results we obtained. Using the blended (voting) ensemble method (blend) with the top 5 models (small blend), it outperformed all single-learner models with an RMSE of 0.5438. Blend ensemble performed better than the Stacking ensemble model (stack) with an RMSE of 0.5486. Additionally, increasing the number of ensemble members in the blend ensemble model from 5 to 10 did not result in a significant increase in testing RMSE. Additionally, increasing the number of ensemble members in the blend ensemble model from 5 to 10 did not result in a significant improvement either. In contrast, increasing the number of ensemble members in the stack ensemble showed more evident improvement in performance, with an RMSE of 0.6030 for the small stack (5 models) and an RMSE of 0.5776 for the large stack (10 models).
Table 5.
ensemble-learning models
| Type of ensemble | Number of ensemble models | Testing dataset |
|---|---|---|
| RMSE | ||
| Blended Regressor (blend) | 5 (small blend) | 0.5438 |
| 10 (large blend) | 0.5486 | |
| Stacking Regressor (Stack) | 5 (small stack) | 0.6030 |
| 10 (large stack) | 0.5776 |
Association with Survival
We also investigated the correlation between the predicted ALS slope and actual survival in the testing dataset. By matching the ratio between fast and medium-slow progressors at 68:32 (true rate), we classified patients with predicted ALS slope below 32-percentile as predicted fast progressors with the rest being predicted medium-slow progressors. The Kaplan-Meier curves for the predicted fast and medium-slow progressors are presented in Figure 6 for the best-performant single-learner model (i.e., gbr) and Figure 7 for best performant model overall (i.e., small blend ensemble). Where the x-axis representing time in months and the y-axis representing the probability of survival.
Figure 6.
Kaplan-Meier curves for predicted fast and slow progressor based individual gbr model.
Patients predicted to be a fast progressor have a significantly lower probability of survival between 6 and 12 months compared to patients with medium-slow progression as shown in Figure 6 (a). After the 12-month mark, all patients with ALS experience a similarly significant decline in their chances of survival, which eventually becomes zero as shown in Figure 6 (b). The log-rank p-values for the comparison between fast and medium-slow progression for the first 12 and 15 months based on gbr model are: 0.00751, and 0.50019, respectively.
SHAP Extrapolation
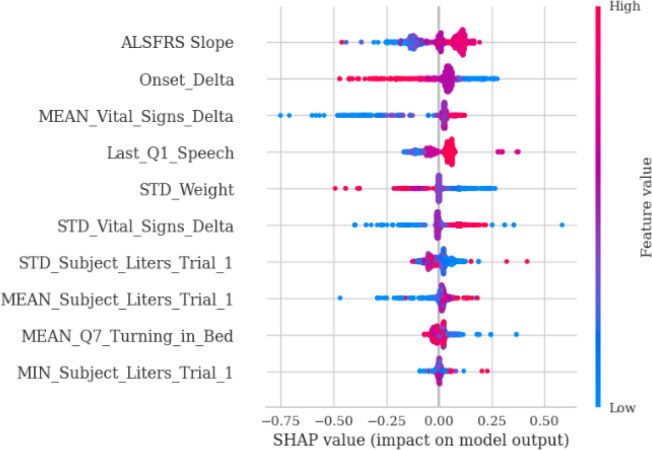
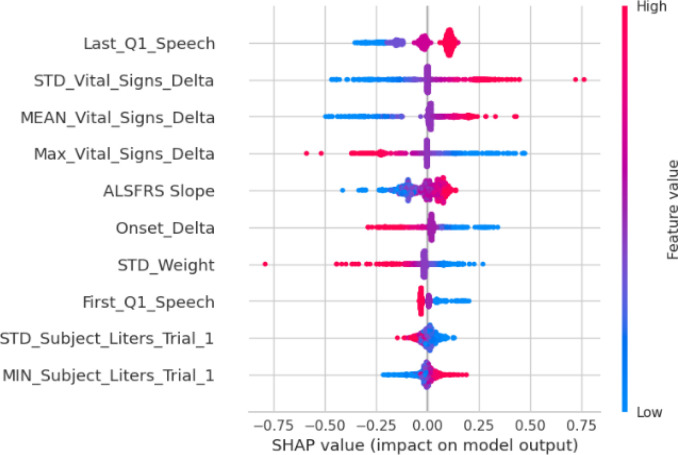
Finally, we used SHAP value to extrapolate the feature associations and identify the most important prognostic factors based on the best predictive models. Figure 8a and Figure 8b show SHAP values for the top-performant single-model (gbr) and ensemble-model (smaller blender), respectively. For both models, baseline ALSFRS slope and Onset Delta (i.e., the time between disease onset and the first time the patient was tested in a trial) have higher impact on the grb model, and both models identified a positive association between initial ALSFRS slope and ALSFRS slope after 3mth, although the blend ensemble model showed less variations. The blender ensemble model ranked Last_Q1_Speech (i.e., last ALSFRS speech score) and various summaries of Vital_Signs_Delta (i.e., time lapse between vital signs measures) as the top-most import features, while the gbr model identifies Onset_Delta showed a higher impact on the ensemble model with a negative association.
Figure 8a.
SHAP value for gbr model with selected features from Boruta algorithm.
Figure 8b.
SHAP Value analysis for the small blend ensemble model.
Discussion
All the five FS algorithms or “screeners” (LASSO, ETR, XGboost, Boruta, Ensemble) we included in the experiment not only can be used to rank feature importance but are capable of aggressively reduce feature dimension (from 321 to ≤ 10), a property sometimes referred to as “sparsity-induced”. Among them, Boruta FS algorithms demonstrated the best performance with the highest prediction accuracy while maintaining high stability, regardless of the final prediction models. The LASSO-based FS method showed the highest feature reduction rate and best stability, while the XGboost-based FS method showed the worst stability. Even if there are machine learning models that are able to perform feature selection and making predictions simultaneously (i.e., embedded models), there may still be additional gain. For example, the gbr “learner” model was able to achieve the best prediction performance when combined with Boruta “screener”.
In terms of achieving the best prediction accuracy, ensemble-learner models have shown to outperform single-learner models. The capability to accurately predict the ALS progression and stratifying between “fast progressors” and “medium-slow progressors” could potentially help neurologists to design better follow-up schedule and treatment plan tailoring to individuals predicted progression rates. Despite different rankings, we observed the following features to be persistently identified across all five “screeners” with consensus directionality which are mostly linear: a) baseline ALSFRS_slope has shown to be positively correlated with disease progression (i.e., the initial functional decline strongly predicts the future decline); b) bulbar functionality (First_Q1_Speech and Last_Q1_Speech) is more predictive of disease progression compared to other motor functions; c) observation intensity (Vital_Signs_Delta) was shown to be negatively associated with disease progression (i.e., the more frequent the vital signs got checked, the slower the progression would be, which might potentially be a reverse association); d) drastic weight change (STD_weight) was persistently shown to be positively associated with steeper ALSFRS drop; e) respiratory functional change (STD_Subject Liters) were shown to positively predict disease progression and while its reserve (MIN_Subject_Liters) were shown to negatively predict disease progression.
We recognized several limitations of the study. First, the PRO-ACT cohort might not be a suitable representation of the general population, as it may only consist of a particular group of patients or exclude specific subgroups. Hence, it is necessary to be careful when extrapolating conclusions from this dataset to the wider population.
Second, the feature space was restricted to those that were pre-selected based on expert knowledge and trial scope, which not only introduced unobserved and unmeasurable confounders and also limited the total amount of information that can be interrogated by machine learning models. Third, a significantly number of features were not useful for modeling due to high missing rates, which could be potentially due to inconsistencies in data collection approaches across different trials.
Conclusions
Our experiment has successfully demonstrated that the screener-learner machine learning model can be used to predict ALSFRS slope change using a parsimonious set of features. The predicted slope can be used to stratify between fast progressor and slow progressor, who had significantly different survival rates. This work showed great potential for building a more predictive and robust prognostic model for predicting ALS disease progression without loss of model transparency.
Acknowledgement
* Data used in the preparation of this article were obtained from the Pooled Resource Open-Access ALS Clinical Trials (PRO-ACT) Database. As such, the following organizations and individuals within the PRO-ACT Consortium contributed to the design and implementation of the PRO-ACT Database and/or provided data, but did not participate in the analysis of the data or the writing of this report:
ALS Therapy Alliance
Cytokinetics, Inc.
Amylyx Pharmaceuticals, Inc.
Knopp Biosciences
Neuraltus Pharmaceuticals, Inc.
Neurological Clinical Research Institute, MGH
Northeast ALS Consortium
Novartis
Prize4Life Israel
Regeneron Pharmaceuticals, Inc.
Sanofi
Teva Pharmaceutical Industries, Ltd.
The ALS Association
The dataset is provided by the PRO-ACT Consortium members and it is easily accessible after registration at the PRO-ACT website www.alsdatabase.org.
Figures & Tables
Figure 2.
Experimental Design.
References
- 1.Pancotti C., Birolo G., Rollo C., et al. Deep learning methods to predict amyotrophic lateral sclerosis disease progression. Sci Rep. 2022;12:13738. doi: 10.1038/s41598-022-17805-9. [DOI] [PMC free article] [PubMed] [Google Scholar]
- 2.Zach N, Ennist DL, Taylor AA, Alon H, Sherman A, Kueffner R, et al. Being PRO-ACTive: What can a Clinical Trial Database Reveal About ALS? Neurotherapeutics. 2015;12(2):417–23. doi: 10.1007/s13311-015-0336-z. PubMed Central PMCID: PMCPMC4404433. pmid:25613183. [DOI] [PMC free article] [PubMed] [Google Scholar]
- 3.Küffner R., Zach N., Norel R., et al. Crowdsourced analysis of clinical trial data to predict amyotrophic lateral sclerosis progression. Nat Biotechnol. 2015;33:51–57. doi: 10.1038/nbt.3051. https://doi.org/10.1038/nbt.3051. www.ALSDatabase.org. Accessed: March-19-2023. [DOI] [PubMed] [Google Scholar]
- 4.Sarah Nogueira and Konstantinos Sechidis and Gavin Brown, On the Stability of Feature Selection Algorithms. Journal of Machine Learning Research. 2018;18(174):1–54. [Google Scholar]
- 5.Miller RG, Mitchell JD, Moore DH. Riluzole for amyotrophic lateral sclerosis (ALS)/motor neuron disease (MND) Cochrane Database Syst Rev. 2012;3:CD001447. doi: 10.1002/14651858.CD001447.pub3. [DOI] [PMC free article] [PubMed] [Google Scholar]
- 6.Cedarbaum J. M., et al. The ALSFRS-R: A revised ALS functional rating scale that incorporates assessments of respiratory function. J. Neurol. Sci. 1999;169:13–21. doi: 10.1016/s0022-510x(99)00210-5. [DOI] [PubMed] [Google Scholar]
- 7.Natekin A., Knoll A. Gradient boosting machines, a tutorial. Frontiers in Neurorobotics. 2013;7:21. doi: 10.3389/fnbot.2013.00021. [DOI] [PMC free article] [PubMed] [Google Scholar]
- 8.PyCaret Ali M. An open source, low-code machine learning library in Python. PyCaret version 2.3.10. 2023.
- 9.The ALS Association (https://www.als.org) and The Neurological Clinical Research Institute @MGH (http://ncrinstitute.org/), Accessed: March-19-2023
- 10.Pro-ACT dataset. https://ncri1.partners.org/ProACT/Document/DisplayLatest/9. Accessed: March-19-2023.
- 11.Miller RG, Mitchell JD, Lyon M, Moore DH. Riluzole for amyotrophic lateral sclerosis (ALS)/motor neuron disease (MND) Cochrane Database Syst Rev. 2002;2:CD001447. doi: 10.1002/14651858.CD001447. doi: 10.1002/14651858.CD001447. Update in: Cochrane Database Syst Rev. 2007;(1):CD001447. PMID: 12076411. [DOI] [PubMed] [Google Scholar]
- 12.Ortiz JF, Khan SA, Salem A, Lin Z, Iqbal Z, Jahan N. Post-Marketing Experience of Edaravone in Amyotrophic Lateral Sclerosis: A Clinical Perspective and Comparison With the Clinical Trials of the Drug. Cureus. 2020 Oct 6;12(10):e10818. doi: 10.7759/cureus.10818. doi: 10.7759/cureus.10818. PMID: 33173626; PMCID: PMC7645306. [DOI] [PMC free article] [PubMed] [Google Scholar]
- 13.Paganoni Sabrina, Macklin Eric A., Hendrix Suzanne, Berry James D., Elliott Michael A., Maiser Samuel, et al. Trial of Sodium Phenylbutyrate–Taurursodiol for Amyotrophic Lateral Sclerosis. N Engl J Med. 2020;383:919–930. doi: 10.1056/NEJMoa1916945. DOI: 10.1056/NEJMoa1916945. [DOI] [PMC free article] [PubMed] [Google Scholar]
- 14.Fang Wen-Chieh, Chang Huan-Jui, Yang Chen, Yang Hsih-Te, Chiang Jung-Hsien. UglyDuckling team (2015) 〈 https://www.synapse.org/#!Synapse:syn4941689/wiki/235986〉.
- 15.Alsahaf Ahmad, Petkov Nicolai, Shenoy Vikram, Azzopardi George. “A framework for feature selection through boosting”. Expert Systems with Applications. 2022;Volume 187:115895. [Google Scholar]
- 16.Dokeroglu Tansel, Deniz Ayça, Kiziloz Hakan Ezgi. A comprehensive survey on recent metaheuristics for feature selection. Neurocomputing. 2022;Volume 494:269–296. [Google Scholar]
- 17.Lundberg Scott. SHAP (SHapley Additive exPlanations) 2019. https://github.com/slundberg/shap .
- 18.Fonti Valeria, Belitser Eduard. “Feature selection using lasso”. VU Amsterdam research paper in business analytics. 2017;30:1–25. [Google Scholar]
- 19.Mienye Ibomoiye Domor, Sun Yanxia. “A survey of ensemble learning: Concepts, algorithms, applications, and prospects”. IEEE Access. 2022;10:99129–99149. [Google Scholar]
- 20.Alsahaf Ahmad, Petkov Nicolai, Shenoy Vikram, Azzopardi George. “A framework for feature selection through boosting”. Expert Systems with Applications. 2022;187:115895. [Google Scholar]
- 21.Kursa Miron B., Rudnicki Witold R. “Feature selection with the Boruta package”. Journal of statistical software. 2010;36:1–13. [Google Scholar]
- 22.Seijo-Pardo Borja, Porto-Díaz Iago, Bolón-Canedo Verónica, Alonso-Betanzos Amparo. “Ensemble feature selection: homogeneous and heterogeneous approaches”. Knowledge-Based Systems. 2017;118:124–139. [Google Scholar]
- 23.Marcílio Wilson E., Eler Danilo M. In 2020 33rd SIBGRAPI conference on Graphics, Patterns and Images (SIBGRAPI) Ieee; 2020. “From explanations to feature selection: assessing SHAP values as feature selection mechanism”; pp. pp. 340–347. [Google Scholar]


