Abstract
The formation of biomolecular condensates mediated by a coupling of associative and segregative phase transitions plays a critical role in controlling diverse cellular functions in nature. This has inspired the use of phase transitions to design synthetic systems. While design rules of phase transitions have been established for many synthetic intrinsically disordered proteins, most efforts have focused on investigating their phase behaviors in a test tube. Here, we present a rational engineering approach to program the formation and physical properties of synthetic condensates to achieve intended cellular functions. We demonstrate this approach through targeted plasmid sequestration and transcription regulation in bacteria and modulation of a protein circuit in mammalian cells. Our approach lays the foundation for engineering designer condensates for synthetic biology applications.
INTRODUCTION
Biomolecular condensates, such as P granules1, stress granules2, play a critical role in regulating cellular behaviors. The formation of condensates is driven by phase separation coupled percolation (PSCP) of intrinsically disordered proteins (IDPs), which contain significant stretches of primary amino acid sequence lack of defined secondary structures3,4. Condensates can selectively enrich or exclude biomolecules, thereby enabling dynamic control over cellular processes3–6
Synthetic condensates built by naturally occurring IDPs fused with functional domains have been used to control cell proliferation7, reassign codons of selected mRNAs 8, and control metabolic flow9. The use of native IDPs limits programmability of phase behavior and may not yield orthogonal systems in vivo due to cross-reactivity among components of the designed condensates and components of the cellular milieu.
Extensive research has been carried out to uncover sequence heuristics that drive phase transitions of IDPs10–14. In vitro studies have demonstrated that these heuristics can be used to design synthetic IDPs (synIDPs) with programmable phase behaviors15,16. However, it remains unclear if these condensates can function, as intended, in a living cell and whether and how they can be used to program cellular behavior. Here, we demonstrate engineering functional biomolecular condensates by leveraging rules that have emerged from studies that have uncovered the driving forces for PSCP. We use these rules to construct fusions of synIDPs and functional domains to modulate the formation and physical properties of condensates, which in turn drive targeted cellular functions in bacteria and mammalian cells.
RESULTS
Design of synthetic functional condensates
We first sought to control two cellular functions in bacteria through synthetic condensates, 1) plasmid sequestration (Fig. 1a), and 2) transcriptional regulation (Fig. 1b). We hypothesized that the physical properties 11 of condensates are critical for their function3,4 (Fig. 1c & d). In particular, an exclusionary condensate that hinders molecular exchange between the dense and the dilute phases can sequester a target plasmid (Fig. 1c), whereas an inclusive condensate that allows rapid exchange of molecules with the environment can recruit transcriptional machinery for transcription regulation (Fig. 1d).
Fig. 1 |. Engineering strategy for programmable functional synthetic condensates.
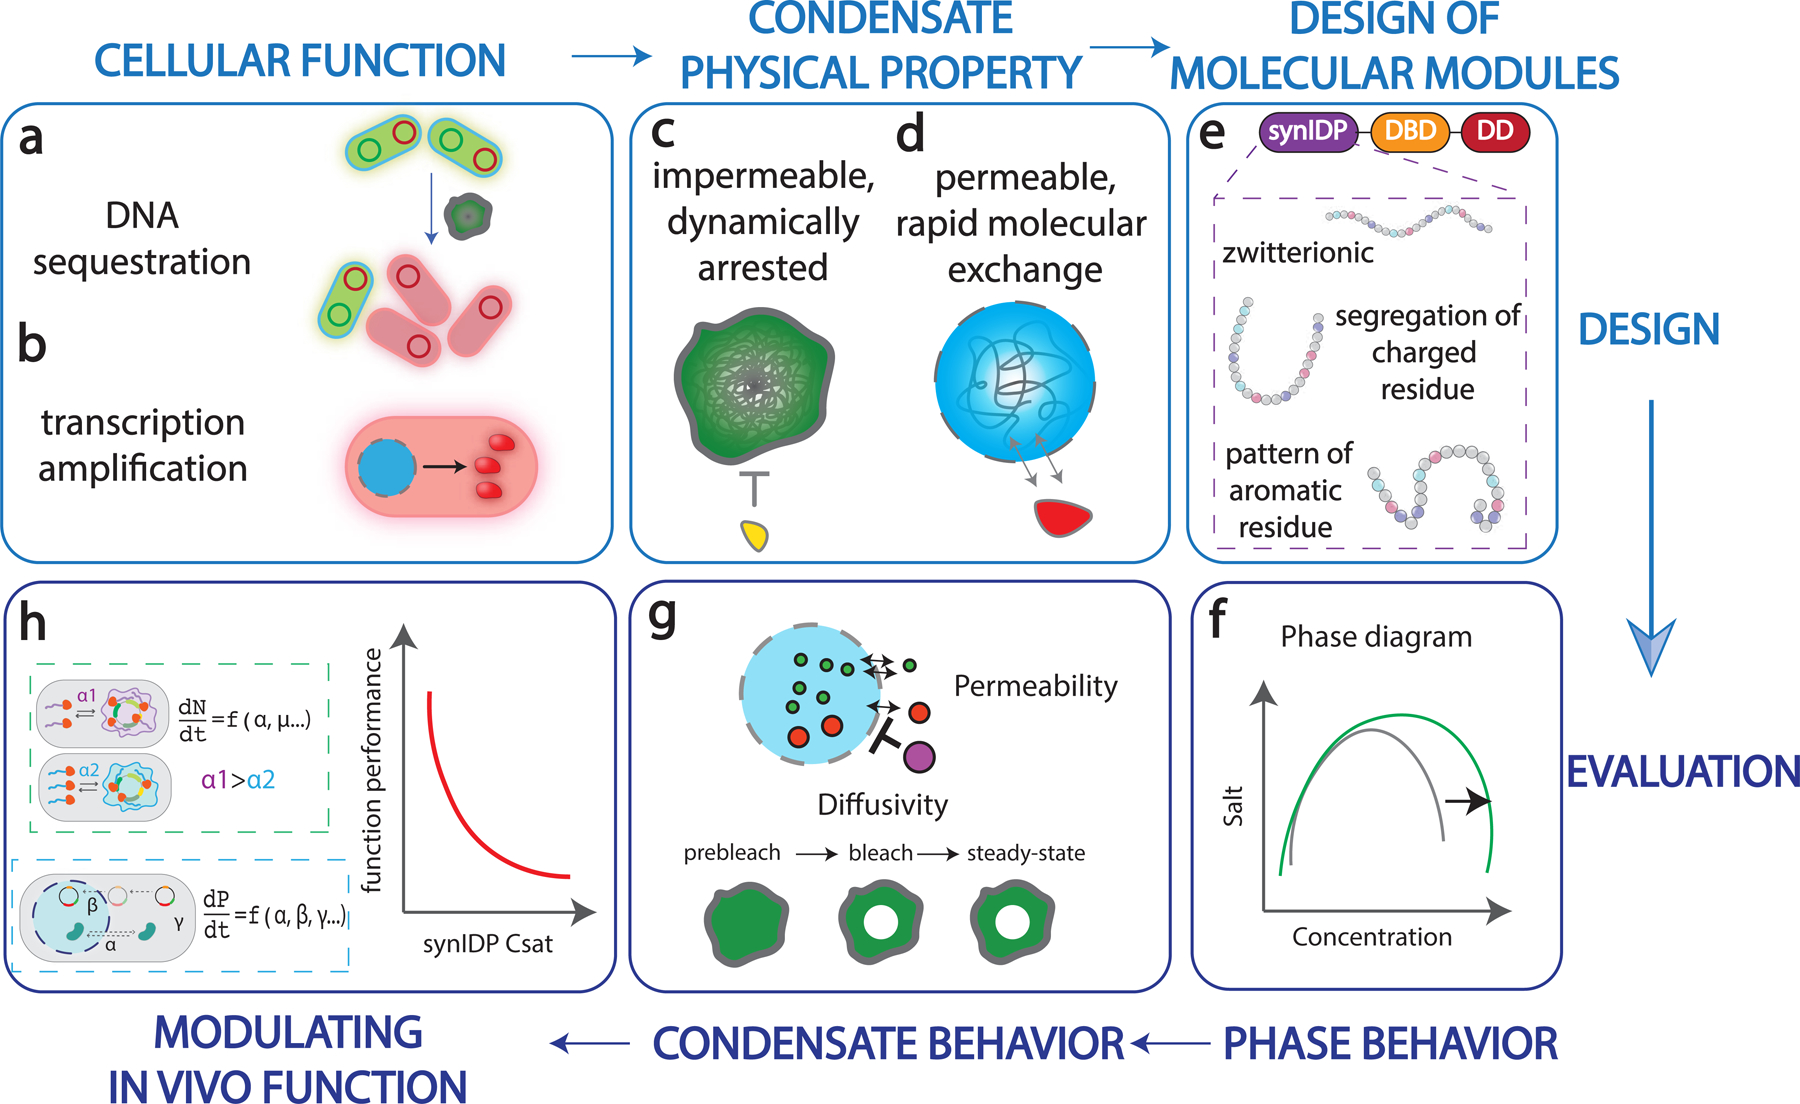
a, Condensate mediated DNA sequestration inhibits genetic materials (plasmid) from access of cellular machinery, inducing asymmetric plasmid partition.
b, Condensate mediated concentration of transcriptional machinery and target gene for transcription amplification.
c, A dynamically arrested and exclusionary condensate limits the exchange of molecules with the surrounding, thereby inhibiting a targeted functions in the cell.
d, A labile and inclusive condensate recruits and enriches key components, thereby amplifying a targeted function in the cell.
e, Design of modular protein components for the construction of synthetic condensate. The figure also summarizes characteristics of synthetic IDPs that affect different condensate properties.
f, Establishing the phase diagram based on different synIDPs and combinations of functional domains.
g, Evaluating functionally critical physical properties of synthetic condensates, including macromolecular permeability and diffusivity.
h, Computationally modeling the effects of different types of synthetic condensates on regulating cellular functions.
To create condensates with distinct physical properties, we applied the rules learned from condensates of native and synthetic IDPs13,15,17 to design synIDPs and fused them to functional protein domains (Fig. 1e). We investigated the contributions of the following factors: (i) sequence-specific variations of phase diagrams of synIDPs; (ii) composition profiles as defined by the molecular components (Fig. 1f); and (iii) the physical behaviors of the condensate formed through different molecular parts (Fig. 1g). We implemented a computational model to evaluate how these factors contribute to cellular processes (Fig. 1h), thereby identifying candidate condensates.
We selected a class of zwitterionic synIDPs, resilin-like polypeptides (RLPs), that are inspired by the Drosophila melanogaster Rec-1 resilin protein15,16. The RLPs provide the homotypic interactions that drive condensate formation. Each RLP consists of a repeating octapeptide, and the RLP with the GRGDSPYS repeat unit is designated as the wild-type (WT) sequence (RLPWT). These repetitive sequences can drive phase separation via an upper critical solution temperature (UCST) transition mechanism10,18,.
To sequester a target DNA, we used a DNA binding protein, ParB, from Caulobacter vibrioides19. ParB interacts with a parS DNA sequence to promote chromosome segregation. It is orthogonal to the existing DNA regulation machinery in E. coli, which does not contain a genomic ParB-parS system20. We fused a N-terminal deficient ParB variant (dParB) containing a helix-turn-helix DNA-binding domain21 (DBD) and a C-terminal dimerization domain (DD)22 to RLPs to create RLP-DBD and RLP-DBD-DD fusions. The DBD can interact with specific DNA sequences and thus recruit a target plasmid. Interactions through the dimerization domain can help increase the valence of cohesive motifs, also known as stickers, that enhance the driving forces for PSCP through homotypic interactions23. This interaction can provide another level of control to regulate PSCP and the physical properties of condensates.
Modular construction of synthetic condensate in E. coli
Next, we examined whether the fusions of functional domains—DBD and DD—onto the C-terminus of RLPWT with 20 octapeptide repeats 15,16 would enable condensate formation in E. coli. These constructs were fused at their C-terminus to a monomeric green fluorescent protein (mEGFP) that has minimal self-association24. Upon induction of protein expression, RLPWT-mEGFP formed distinct condensates, as did the mEGFP fusions of RLPWT-DBD and RLPWT-DBD-DD (Fig. 2a). The area fraction of condensate per cell increased in a time-dependent manner (Fig. 2b), indicating that condensate formation is concentration-dependent and occurs above a threshold of concentration that are features of PSCP25. Fusion of the DBD to RLPWT did not affect the kinetics of condensate formation or the size of RLPWT-DBD condensate relative to RLPWT alone. In contrast, the RLPWT-DBD-DD fusion showed faster condensate formation and generated the largest area fraction of condensates per cell. Neither the DBD nor DBD-DD formed distinct fluorescent condensates (Extended Data Fig. 1a). To further rule out the effect of mEGFP on condensate formation, we characterized condensate formation by RLPWT in living cells without fusing mEGFP using differential interference contrast (DIC) spectroscopy26, which enables direct observation of condensates due to their higher optical density compared to the cytosol. The condensates were observed as spherical structures by DIC microscopy (Extended Data Fig. 1b), confirming the results obtained by fluorescence microscopy .
Fig. 2 |. Formation of synthetic condensate through phase separation in living cells and in vitro.
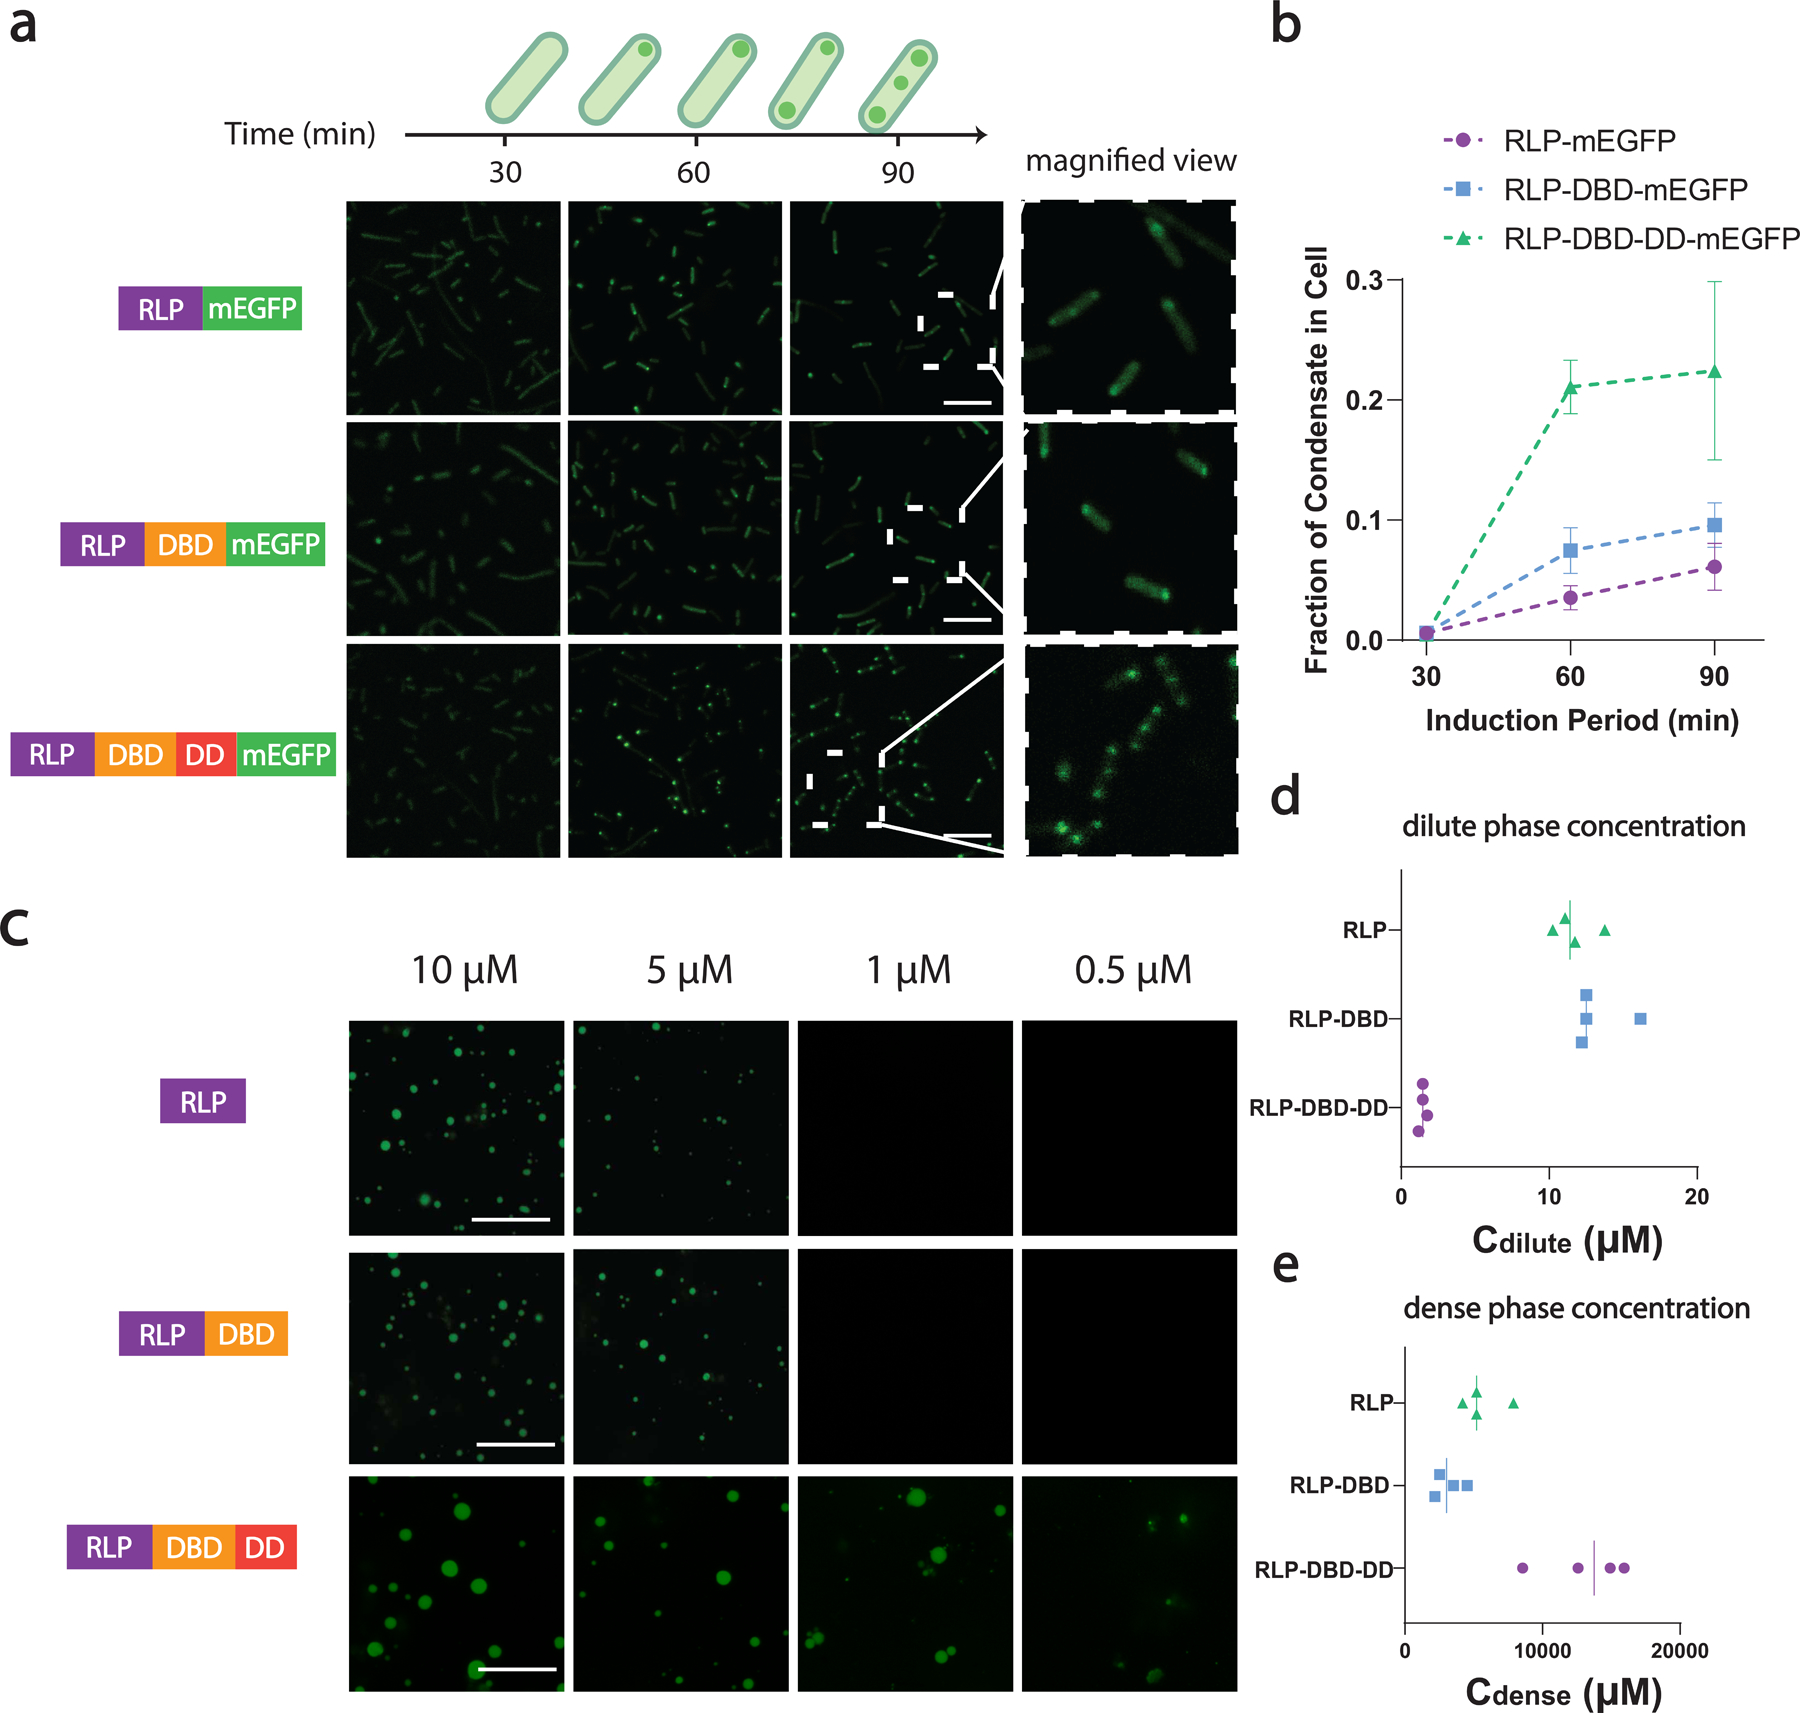
a, Confocal fluorescence images of intracellular condensate formation of RLPWT-mEGFP, RLPWT-DBD-mEGFP, RLPWT-DBD-DD-mEGFP as a function of induction time. Magnified view of cells at 90 min time point shows that different numbers and sizes of intracellular condensates were observed for different synIDP fusions. Scale bar is 10 µm.
b, Quantification of the area fraction of the condensates in cell. Area fraction is calculated as following: . The area fraction grows with induction time. Data points represent mean± SD (n>121 cells for each time point).
c, Confocal fluorescence images of purified proteins (doped with 10% of sfGFP- fused to the C-terminus of the protein) for in vitro visualization of their concentration-dependent phase separation. The samples were prepared in buffer containing 50 mM Tris, 150 mM NaCl, 10% PEG 8000, 1 mM EDTA, pH 7.2 and incubated at 37°C for 3 h before imaging. Scale bar is 10 µm.
d, Quantification of Cdilute of each construct using sedimentation assay. The protein samples were prepared at a total concentration of 30 μM and incubated as for the phase separation assay and quantified after centrifugation by analyzing the supernatant.
e, Quantification of Cdense of each construct using sedimentation assay. The protein samples were prepared at a total concentration of 30 μM and incubated as for the phase separation assay and quantified after centrifugation by removing and redissovling the dense phase pellet.
To examine if the observations in living cells were primarily due to sequence-encoded features, we expressed and purified RLPWT and its fusions with DBD and DBD-DD, and investigated their phase behavior in vitro in the low micromolar concentration range, which is considered physiologically relevant in cells27. We included polyethylene glycol (PEG 8000) as a crowding agent28 because phase separation is driven in part by depletion-mediated attractions29 that are thought to prevail in cellular environments. All the RLPWT fusions demonstrated concentration-dependent condensate formation at 37 °C in 150 mM NaCl (Fig. 2c). Further, we quantified the contribution of each domain in the synIDP fusions to phase separation using a sedimentation assay to measure the dilute and dense phase concentrations (Cdilute and Cdense). Compared with RLPWT alone, the fusion of DBD to RLPWT did not change the Cdilute (Fig. 2d) but slightly lowered Cdense (Fig. 2e). In contrast, RLPWT-DBD-DD fusion lowers the Cdilute and increases Cdense. The changes to both parameters are an order of magnitude compared to RLPWT-DBD, suggesting that the DD significantly alters the phase diagram of the RLP, presumably because of the increased cohesive interaction conferred by the DD. We next measured the intracellular protein concentration based on the calibrated fluorescence intensity of mEGFP to estimate the cellular dilute and dense phase concentrations of the phase separable proteins. The trends in the cellular dense phase and dilute phase concentrations for the different synIDP fusions were similar to those in vitro (Extended Data Fig. 1c), suggesting that the contributions of individual domains to phase separation are similar in living cells and in vitro.
Programming the homotypic interactions of phase separation
To program condensate formation and achieve tunable physical properties of the condensates using molecular rules gleaned from native IDPs, we first tested if synIDPs would respond to environmental cues as would native IDPs, such as the prion-like low complexity domains of FUS17. We evaluated the condensate formation of RLPWT using a phase separation assay (Extended Data Fig. 2a & b, Supplementary Notes- section a). We found that condensates formed by the RLPWT were sensitive to salts, cosolutes, and changes of protein concentration. Next, guided by heuristics developed for IDPs that exhibit UCST phase behavior13,14, we sought to tune the physical properties and the phase behaviors of condensates by the distribution of charged residues and aromatic residues in the synIDP sequence to create a series of synIDPs (Supplementary Table 1). First, clustering of aromatic residues should increase the interaction strength between aromatic residues, making each cluster a “super sticker”13, and should restrict the segmental mobility of synIDPs within the condensate30. Second, increasing the segregation of oppositely charged residues should enhance complementary electrostatic interactions and thus reduce the saturation concentration for condensate formation10,31. We investigated the phase behaviors of synIDPs using a sedimentation assay 32 (Extended Data Fig. 3a–f) and explored the dynamics of proteins within condensates using fluorescence recovery after photobleaching (FRAP) analysis (Extended Data Fig. 4a).
RLPWT, which features a uniform distribution of oppositely charged and aromatic residues, was selected as the reference for comparison. The variants RLPR-D and RLPR-D2 that have the sequence (GRGRSPYS)10-(GDGDSPYS)10 and (GRGRSPYS)5-(GRGDSPYS)10-(GDGDSPYS)5 enhance the segregation of oppositely charged residues, showing a lower Cdilute than the RLPWT. RLPS-Y, with the sequence (GRDGSPSS-GRGDYPYS)10 has enhanced pi-based interactions, showing a wider two-phase region compared to RLPWT, RLPR-D and RLPR-D2 (Extended Data Fig. 3). Comparing the apparent diffusion coefficients derived from FRAP (see Supplementary Methods for details), RLPR-D and RLPR-D2 exhibited similar mobility to that of RLPWT. This result indicates that the condensates formed by RLPWT, RLPR-D and RLPR-D2 allow rapid exchange of molecules with the environment.
In contrast, RLPS-Y showed arrested recovery over the time periods interrogated by FRAP (Extended Data Fig. 4a) with the smallest apparent diffusion coefficient (Extended Data Fig. 4b). To further assess the sequence-specific nature of rapid vs. arrested dynamics, we performed LaSSI simulations33 of condensates formed by RLPWT vs. RLPS-Y and calculated the mean square displacement (MSD) of RLP chains within the condensates. The MSD of the chains in the RLPS-Y condensate was much lower than that of the chains in the RLPWT condensate (Extended Data Fig. 4c). This result supports the idea that clustering of aromatic residues within linear sequences decreases chain mobility within condensates30, thus establishing a connection between sequence-encoded features and the physical properties of condensates. We further found that the RLPWT chains were more likely to exit their respective condensate than the RLPS-Y chains (Extended Data Fig. 4d), indicating a correlation between condensate chain mobility and chain exit. This observation suggests that RLPS-Y can suppress the rate of molecular exchange between the dilute and dense phases and is a promising choice to create an “exclusionary” condensate.
Lastly, the addition of DD, which enhances homotypic interactions, further reduced the apparent diffusion coefficient compared to RLPWT and RLPWT-DBD (Extended Data Fig. 4e), confirming that the dimerization domain can modulate the physical properties of the dense phase.
Programming the heterotypic interactions of phase separation
Next, we investigated how the parS containing DNA element would affect the properties of condensates formed by synIDP-dParB fusions. We found that parS containing DNA lowered the Cdilute of the RLPWT–DBD (Fig. 3a). While RLPWT–DBD remained soluble at a concentration of 500 nM in 150 NaCl, it underwent phase separation at the same condition in the presence of parS DNA (Extended Data Fig. 5a). In contrast, incubating RLPWT–DBD with a non-specific DNA did not trigger condensate formation (Extended Data Fig. 5b). 3D deconvoluted super-resolution fluorescence microscopy images (see Supplementary Methods) demonstrated that the target DNA containing parS at ~25 nM (a physiological relevant concentration of plasmid, Supplementary Notes-section b) was wrapped inside the RLPWT–DBD condensate (Fig. 3b). These results verified the ability of the synthetic condensate to sequester the target DNA and confirmed the contribution of heterotypic interactions in driving phase separation.
Fig. 3 |. Evaluations of the molecular dynamics and permeability of synthetic DNA condensates.
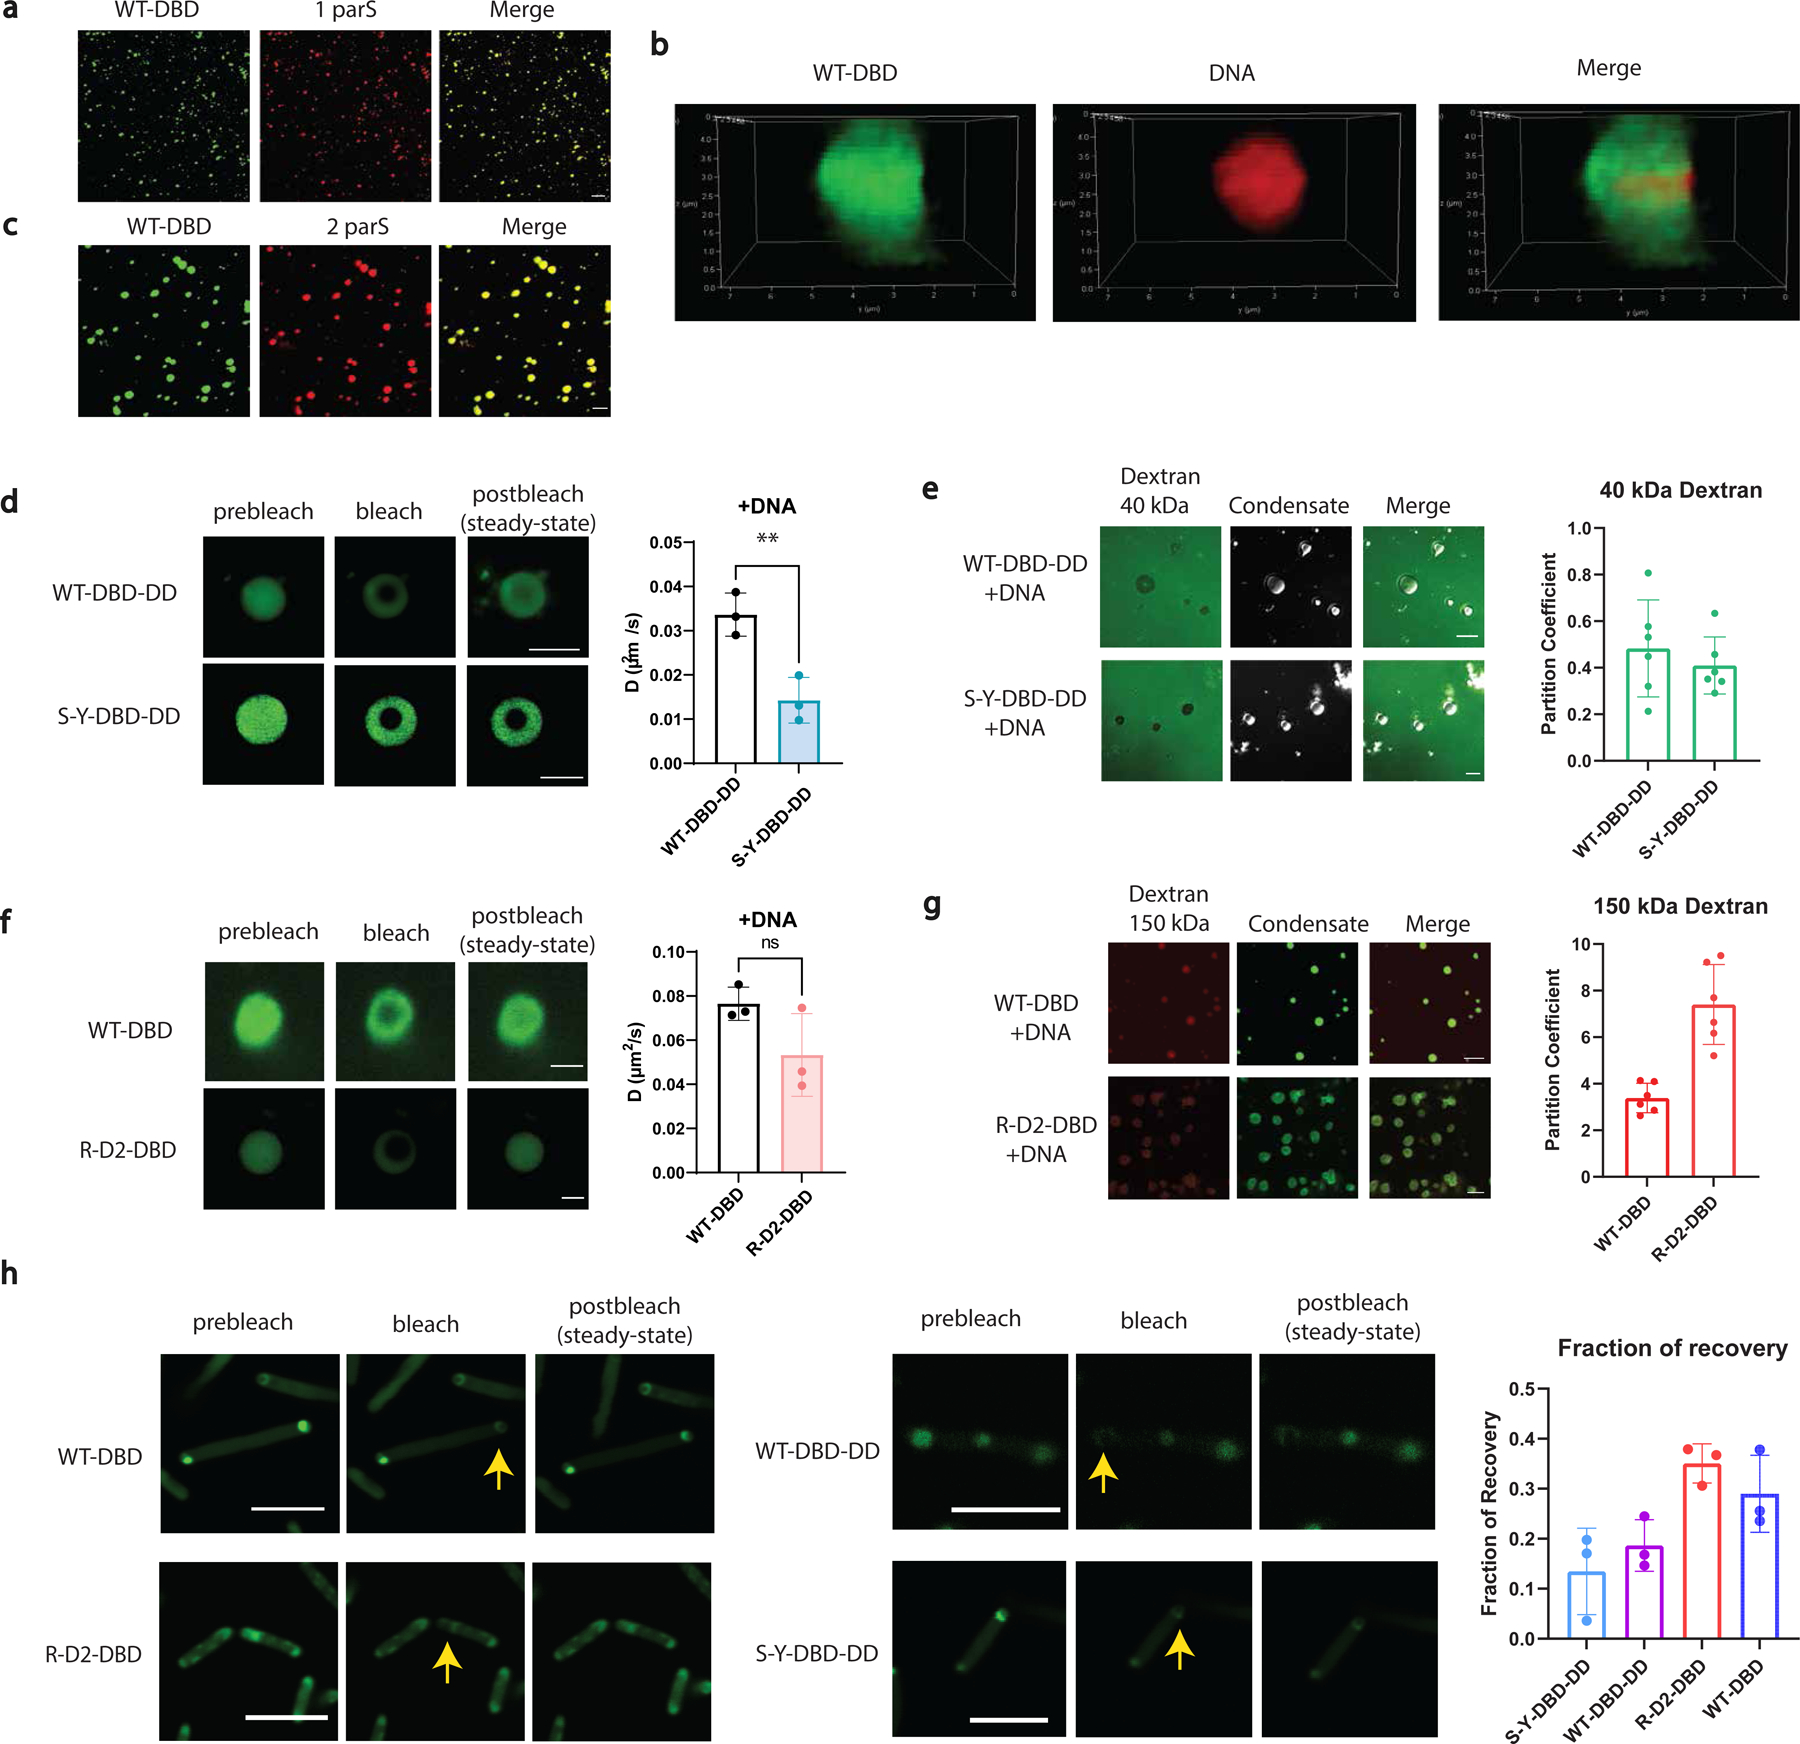
a, Condensates formed by 500 nM WT-dParB (DBD) (doped with 10% WT-DBD-sfGFP) with 10 nM DNA (cy3-labeled) containing 1 parS site. Scale bar is 10 µm. WT-DBD is labeled green (left panel). DNA is labeled red (middle panel).
b, Super-resolution images showing deconvoluted 3D construction of a single DNA condensate. WT-DBD is labeled green (left panel). DNA is labeled red (middle panel).
c, Condensates formed by 500 nM WT-DBD (doped with 10% RLPWT-DBD-sfGFP) with 10 nM Cy3-labeled DNA containing 2 parS site. Scale bar is 10 µm.
d, Representative FRAP images and derived diffusion coefficients of 500 nM synIDP-DBD-DD in the DNA condensates (doped with 10% synIDP-DBD-DD-sfGFP). Scale bar is 5 µm. n = 3 independent experiments. **, p=0.0092 by two-tailed unpaired t-test.
e, Permeability of the DNA condensates formed by RLPS-Y and RLPWT -DBD-DD-DNA to fluorescein labeled dextran 40 kDa. Both RLPS-Y and RLPWT mediated DNA condensate exclude 40 kDa dextran with a partition coefficient smaller than 1. Condensates are shown in the bright-field images in the middle. Scale bar is 10 µm. n = 6 independent experiments.
f, Representative FRAP images and derived diffusion coefficients of 500 nM synIDP-DBD in the DNA condensates (doped with 10% synIDP-DBD-sfGFP). Scale bar is 5 µm. ns, non-significant, p=0.1173 by two-tailed unpaired t-test. n = 3 independent experiments.
g, Permeability of the condensates formed by RLPWT and RLPR-D2-DBD with DNA to Antonia red labeled dextran 150 kDa. Both RLPWT and RLPRD2 mediated DNA condensates are permeable to 150 kDa dextran with a partition coefficient larger than 1. Condensates are shown in the green fluorescence channel in the middle. Scale bar is 10 µm. n = 6 independent experiments.
h, Representative FRAP images and fraction of recovery of different condensates in living cells.
Scale bar is 5 µm. n = 3 independent experiments.
Bar graph represents mean± SD
Increasing the number of parS sites on the target DNA resulted in the formation of larger condensates of RLPWT-DBD (Fig. 3c) and of RLPWT-DBD-DD (Extended Data Fig. 5a), consistent with systems that exhibit phase separation via domain-motif interactions34. We quantified the effect of titrating the number of DNA binding sites on phase behavior using a fluorescence-based sedimentation assay (see Supplementary Methods for experimental details). We doped RLPWT–DBD with RLPWT–DBD-sfGFP at a 10:1 molar ratio and added linear DNA with one or two parS sequences. Increasing the number of parS sites in the DNA decreased Cdilute of RLPWT–DBD but increased Cdense relative to the mixture that contained DNAs with one or no parS site (Extended Data Fig. 5c). These results show that the protein concentration in the dense phase can be modulated by the valence of the heterotypic partner.
Properties of synthetic condensates with DNA
We next investigated the dynamics and permeability of the synIDP-dParB condensates in the presence of target DNA. In the presence of DNA containing one copy of the parS sequence, RLPS-Y-DBD-DD exhibited a recovery plateau of the fluorescence signal and a smaller diffusion coefficient than that of RLPWT-DBD-DD (Fig. 3d). Specifically, the amount of mobile DNA in RLPS-Y-DBD-DD condensates was significantly lower than that of condensates formed by RLPWT-DBD-DD (Extended Data Fig. 5d). We further explored the permeability of these condensates using fluorescently labeled dextran. Both condensates excluded fluorescently labeled 40 kDa dextran (Fig. 3e), suggesting that the condensates can create an exclusionary environment.
We then hypothesized that constructs with reduced strengths of homotypic interactions would result in condensates that may allow unhindered molecular transport across the phase boundary. We modulated the homotypic driving force by: 1) removing the DD from the synIDP-ParB and 2) using synIDPs—specifically RLPWT and RLPR-D2—that have a lower Cdense and a higher diffusion coefficient compared to RLPS-Y. We found that condensates of RLPWT-DBD and RLPR-D2-DBD with DNA demonstrated high internal dynamics of the protein components (Fig. 3f). The recovery of the DNA component was however, still determined by the type of synIDP, as the amount of mobile DNA in RLPR-D2-DBD condensates was significantly lower than that of condensate formed by RLPWT-DBD (Extended Data Fig. 5d). There was no difference in the DNA mobility in the condensates of RLPWT-dParB with and without DD. These observations suggest that DNA mobility is only controlled by its interactions with the DBD and synIDP. Furthermore, these condensates were permeable to 150 kDa dextran (Fig. 3g). FRAP analysis of the fluorescence-labeled dextran led to a recovery fraction of ~90% (Extended Data Fig. 5e), confirming that the internal environment of these condensates allows free diffusion of molecules in and out of the condensates. We further evaluated the partitioning of Alexa488 labeled RNA polymerase (RNAP) into different condensates because of the involvements of RNAP in both target cellular functions. The partition coefficient of RNAP was ~7-fold larger for condensates formed by RLPWT-DBD and RLPR-D2-DBD as compared to the condensates formed by RLPS-Y-DBD-DD and RLPWT-DBD-DD (Extended Data Fig. 5f). This suggests that condensates with lower permeability may suppress a specific cellular function through preferential exclusion of key cellular components from the condensates.
To evaluate the behaviors of selected constructs in living cells, we then fused mEGFP to the C-terminus of RLPR-D2-DBD and RLPS-Y-DBD-DD and expressed these constructs in E. coli. They underwent time dependent condensate formation in living cells (Extended Data Fig. 5f). The condensates adapted to the shape of cytoplasmic membranes, with a concave meniscus, indicative of fluid-like behavior of the condensates. We found that the diffusion behaviors of these constructs in living cells (Fig. 3h) aligned with our observations from in vitro analysis. Although most constructs had a limited impact on cell growth (Supplementary Fig. 1a), expression of RLPR-D1-DBD-DD was drastically burdensome to cells (Supplementary Fig. 1b). Therefore, we did not select this construct for further study.
Condensates trigger asymmetric plasmid partitioning
We first examined the ability of dynamically arrested, low permeability condensates to sequester a target plasmid in E. coli. This would prevent the plasmid from accessing the replication machinery, leading to plasmid loss (Fig.4a). The ability to regulate plasmid flow is an effective strategy to modulate cellular function at the population level35,36. To this end, we encoded RLPWT-DBD-DD and the parS sequence in two different and compatible plasmids (Fig.4b). The gene encoding RLPWT-DBD-DD fusions was inserted in pET24a+ plasmid with a kanamycin (KAN) selection marker and pBR322 origin of replication. The expression of the synIDP fusions is controlled by a lac promoter that is inducible by isopropyl β-D-1-thiogalactopyranoside (IPTG). The target plasmid was constructed by inserting the parS sequence upstream of the p15A origin of replication in a pBAD 33 plasmid with a chloramphenicol (CHI) selection marker.
Fig. 4 |. Condensate mediated DNA sequestration to control gene flow.
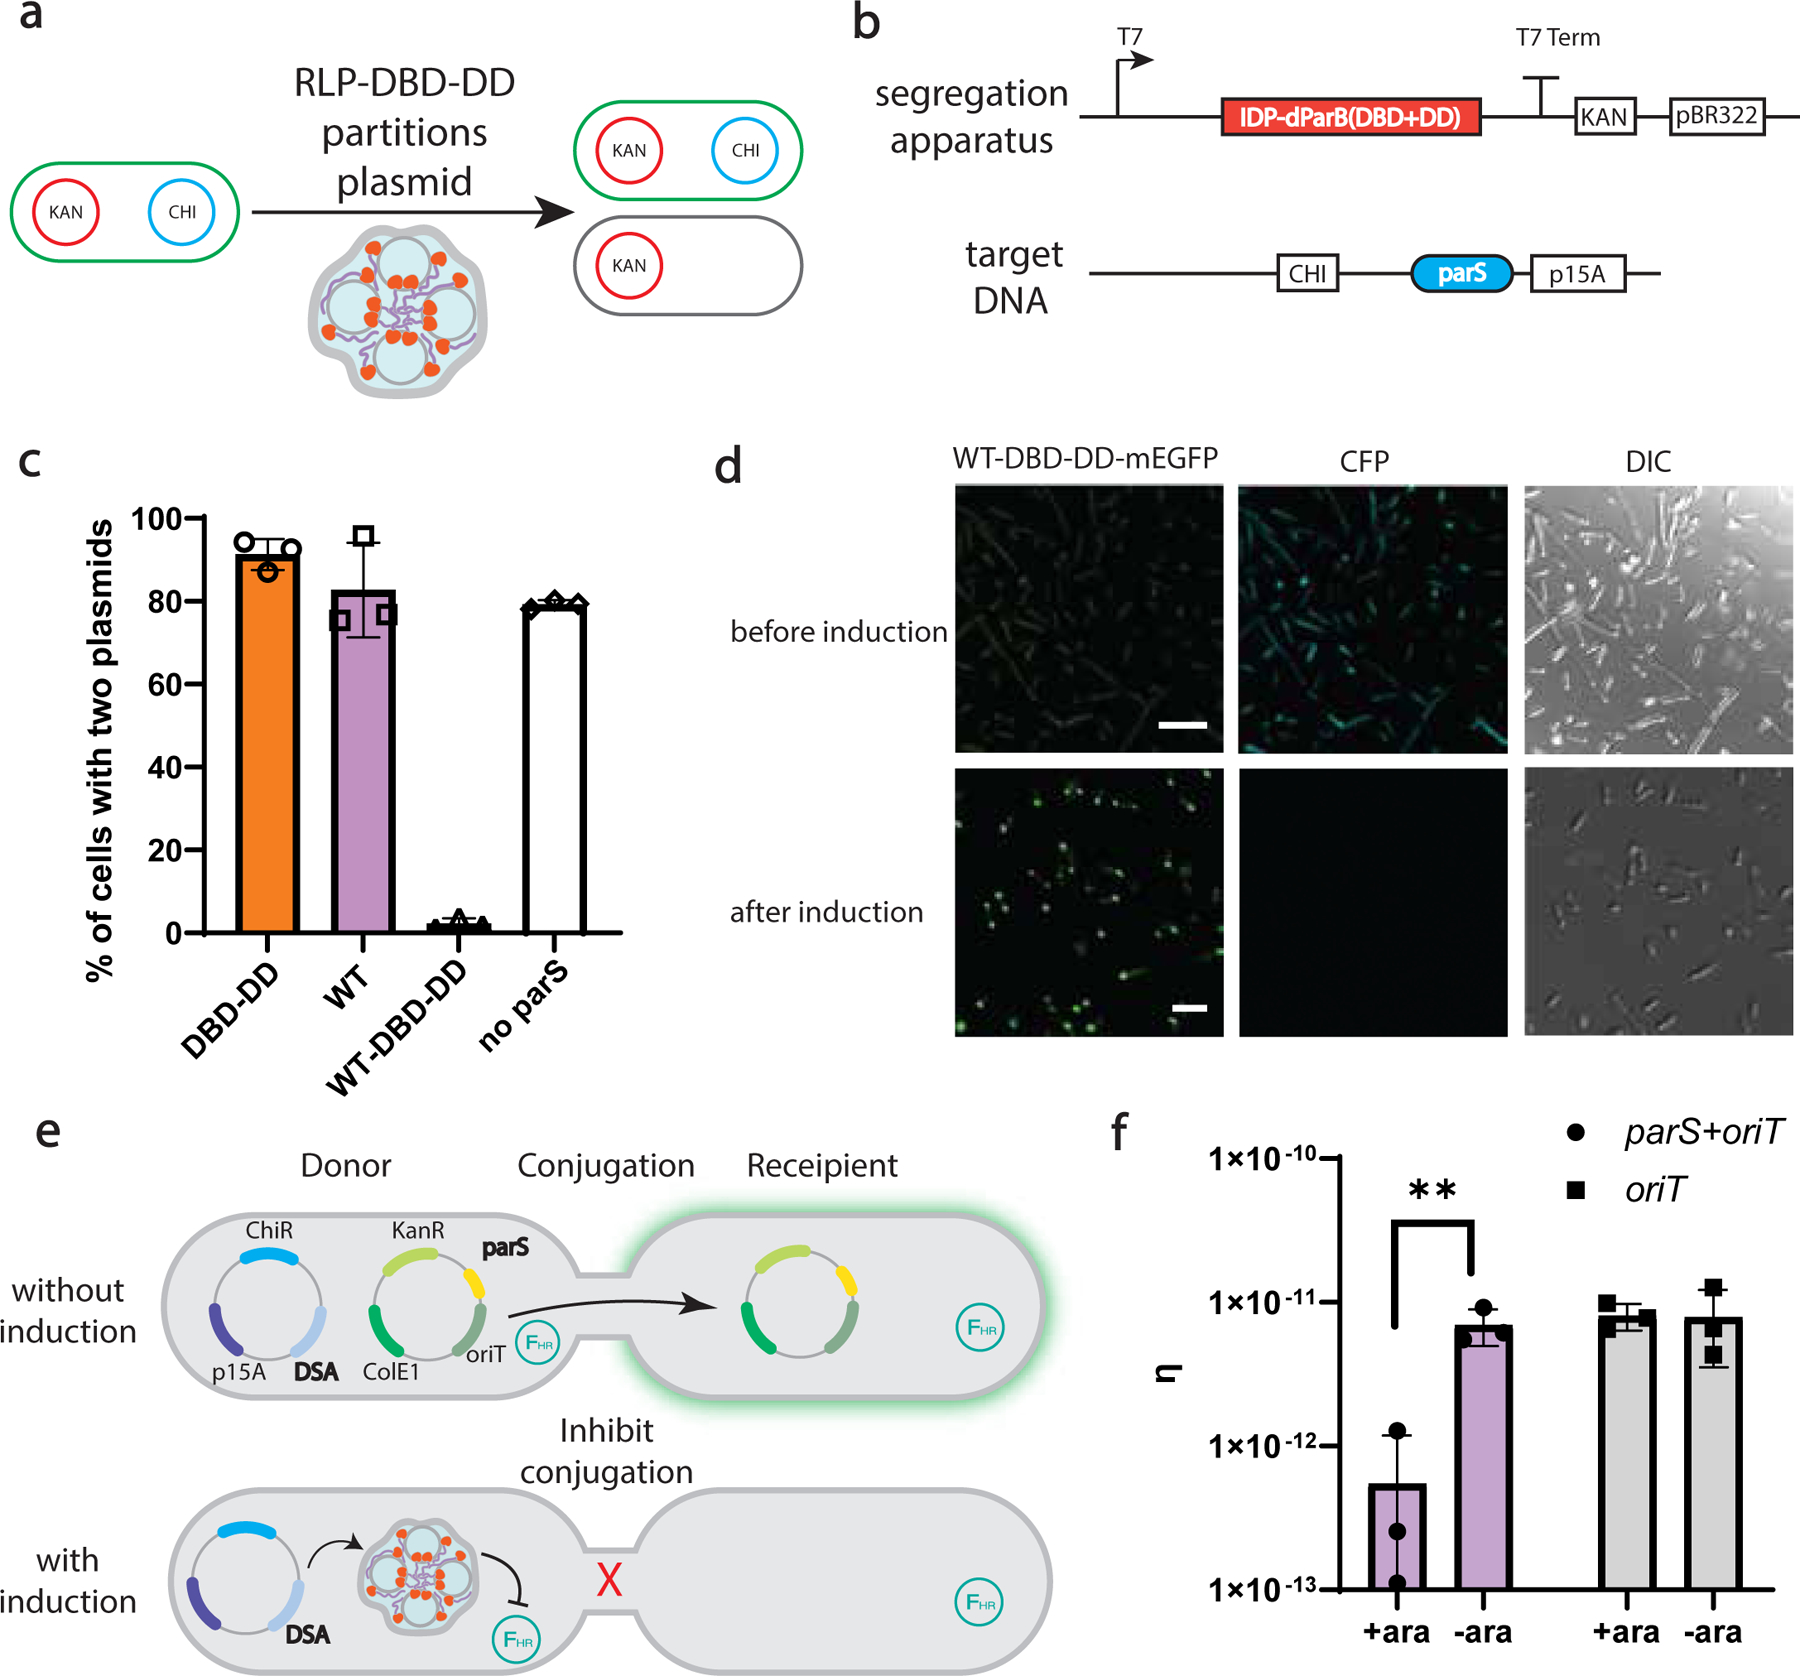
a, Programmable plasmid segregation depends on the formation of a dynamically arrested condensate. Condensate formation enables asymmetric partitioning of the target plasmid, resulting in its loss in a daughter cell.
b, Circuit design: The synIDP-DBD-DD is under the control of a lac promoter and in a plasmid with kanamycin resistance and a pBR322 ori. A target DNA containing a parS binding site is placed on a plasmid containing chloramphenicol resistance and a p15A ori.
c, The percentage of cells carrying two plasmids measured by selective plating after 5 h of induction. n = 3 independent biological repeats.
d, Sequential confocal fluorescence images of cells (before and after induction) containing the WT-DBD-DD and target gene marked by CFP. The left panel shows the mEGFP fluorescent signal from the segregation apparatus; the middle panel shows the CFP fluorescent signal from the target gene; the right panel shows DIC images of cells. Sequential lasers were set at 433 nm and 490 nm respectively for excitations. Detectors were set at 455–485 nm, 510–550 nm respectively for emissions. n=3 independent biological repeats with similar results. Scale bar is 7.5 μm.
e, Condensates sequester the mobilizable plasmid to inhibit horizontal gene transfer in the population. Target plasmid containing oriT is transferable by F helper plasmid. The induction of DNA segregation apparatus (DSA) inhibits the conjugation mediated horizontal gene transfer.
f, Comparison of conjugation efficiency based on target plasmid containing oriT or oriT and parS. n = 3 independent biological repeats. **, p=0.0059 by two-tailed unpaired t-test. Bar graph represents mean± SD.
We grew E. coli carrying the two plasmids with or without 0.5 mM IPTG, with only the RLPWT-DBD-DD plasmid being selected by kanamycin in 2x YT medium for 5 h (see Methods). Samples were then selected on kanamycin or kanamycin + chloramphenicol plates (Extended Data Fig. 6a), and showed negligible loss of the target plasmid in the absence of IPTG induction (Extended Data Fig. 6b). In contrast, induction of RLPWT-DBD-DD reduced the number of cells carrying two plasmids by more than 92% (Fig. 4c & Extended Data Fig. 6c).
We next visualized the elimination of the target plasmid by confocal fluorescence microscopy. To do so, we fused the RLPWT-DBD-DD constructs with mEGFP under the control of an IPTG-inducible lac promoter. We introduced a gene encoding the mCerulean fluorescent protein (CFP)37 under the control of a pBAD promoter into the target plasmid. When CFP was induced by arabinose while the RLPWT-DBD-DD-mEGFP fusion was not, we observed a basal and diffuse level of mEGFP fluorescence throughout the cells. Also, CFP was present in all cells (Fig. 4d). When both CFP and RLPWT-DBD-DD-mEGFP were induced for 5 h, we observed clear evidence of condensate formation by fluorescence microscopy and DIC microscopy, and the loss of the CFP signal from most cells (Fig. 4d).
We found that the condensate-mediated inhibition of plasmid replication does not require the the parS sequence and the plasmid replication origin to be in proximity. The condensate-mediated target plasmid loss was similar when we placed the parS sequence 1497 bp away from the origin of replication in the target plasmid (Extended Data Fig. 6d). This observation highlights a major difference between condensate-mediated inhibition versus local steric hindrance mediated inhibition, such as that bacterial transcriptional factors utilize local steric hindrance to inhibit the interaction between RNAP and gene38 for transcription inhibition. In contrast, condensates create a spatial compartment that sequesters the plasmid and limits its access to the cellular machinery.
We next measured plasmid segregation using condensate formed by RLPWT-DBD with dynamic-like property. A significantly higher percentage of cells containing both plasmids was observed for RLPWT-DBD compared with RLPWT-DBD-DD (Extended Data Fig. 6e). These results confirm that the lower permeability and mobility of RLPWT-DBD-DD condensates (Fig.3e) enable efficient sequestration of plasmids.
synIDP composition governs functional efficiency
To gain insights into how different synIDPs control plasmid partitioning, we developed a kinetic model to describe the modulation of plasmid dynamics by the condensate (Supplementary Notes-section c). The model accounts for the effects of condensate formation on regulating the number of cells with two plasmids. The model introduces a parameter, α, to represent how the synIDP can impact the plasmid dynamics. Specifically, α is inversely proportional to the saturation concentration of the system (i.e., Csat) for phase separation (Supplementary Text). Modeling suggests that a system with a lower Csat will achieve plasmid segregation more efficiently (Extended Data Fig. 7a).
We tested predictions from the model using synIDPs with different Cdilute (which is the same as Csat) values (Extended Data Fig. 3). Specifically, we tested the effect of RLPS-Y/V:Y/WT-DBD-DD condensates in mediating plasmid sequestration. We used 0.1 mM IPTG to induce the synIDP-DBD-DD fusions and measured plasmid sequestration. Consistent with the model prediction, cells expressing stronger drivers of phase separation such as RLPS-Y-DBD-DD, showed faster plasmid sequestration (Extended Data Fig. 7b). By fitting the model to experimental data, a calculated value of Csat was extracted based on the partitioning efficiency (Supplementary Notes- section c, Extended Data Fig. 7c). The extracted Csat values exhibited a linear correlation with the experimentally measured Cdilute values of synIDPs, suggesting the correlation between phase separation and sequestration function (Extended Data Fig. 7d).
Condensates block horizontal gene transfer
Many plasmids can be transferred between bacterial populations through conjugation, a major mechanism of horizontal gene transfer (HGT)39. We hypothesized that the synthetic condensates could suppress HGT by inhibiting conjugation and promoting plasmid loss, which has been shown to suppress maintenance of mobilizable plasmids40. To this end, we constructed a synthetic conjugation system40, which consists of a F helper plasmid (FHR) lacking a functional origin of transfer (oriT) and a mobilizable plasmid carrying an oriT and the parS site. We introduced the system into the MG1655 strain of E. coli and introduced another plasmid encoding the RLPWT-DBD-DD under control of an araC-araBad promoter.
We measured the conjugation efficiency using an established protocol39. We found that expression of RLPWT-DBD-DD reduced the conjugation efficiency by >10-fold (Fig. 4f). The inhibition did not occur for a mobilizable plasmid without the parS site (Supplementary Fig. 2a & Fig. 4f). Different synIDPs (RLPWT and RLPS-Y) led to a similar degree of conjugation inhibition (Supplementary Fig. 2b).
Condensates amplify transcription
In contrast to the exclusionary effect shown above, we next utilized dynamic and permeable condensates to co-localize target DNA and transcription machinery to enhance gene expression (Fig. 5a). We first constructed a simple kinetic model to evaluate the effects of different components on transcription amplification (Supplementary Notes- section d). The model accounts for the spatial organization of plasmid and the transcriptional machinery upon the formation of a condensate. Simulations suggest that condensates that recruit the target gene in addition to the transcriptional machinery can mostly enhance transcription (Supplementary Fig. 3a).
Fig. 5 |. Condensate mediated transcriptional amplification.
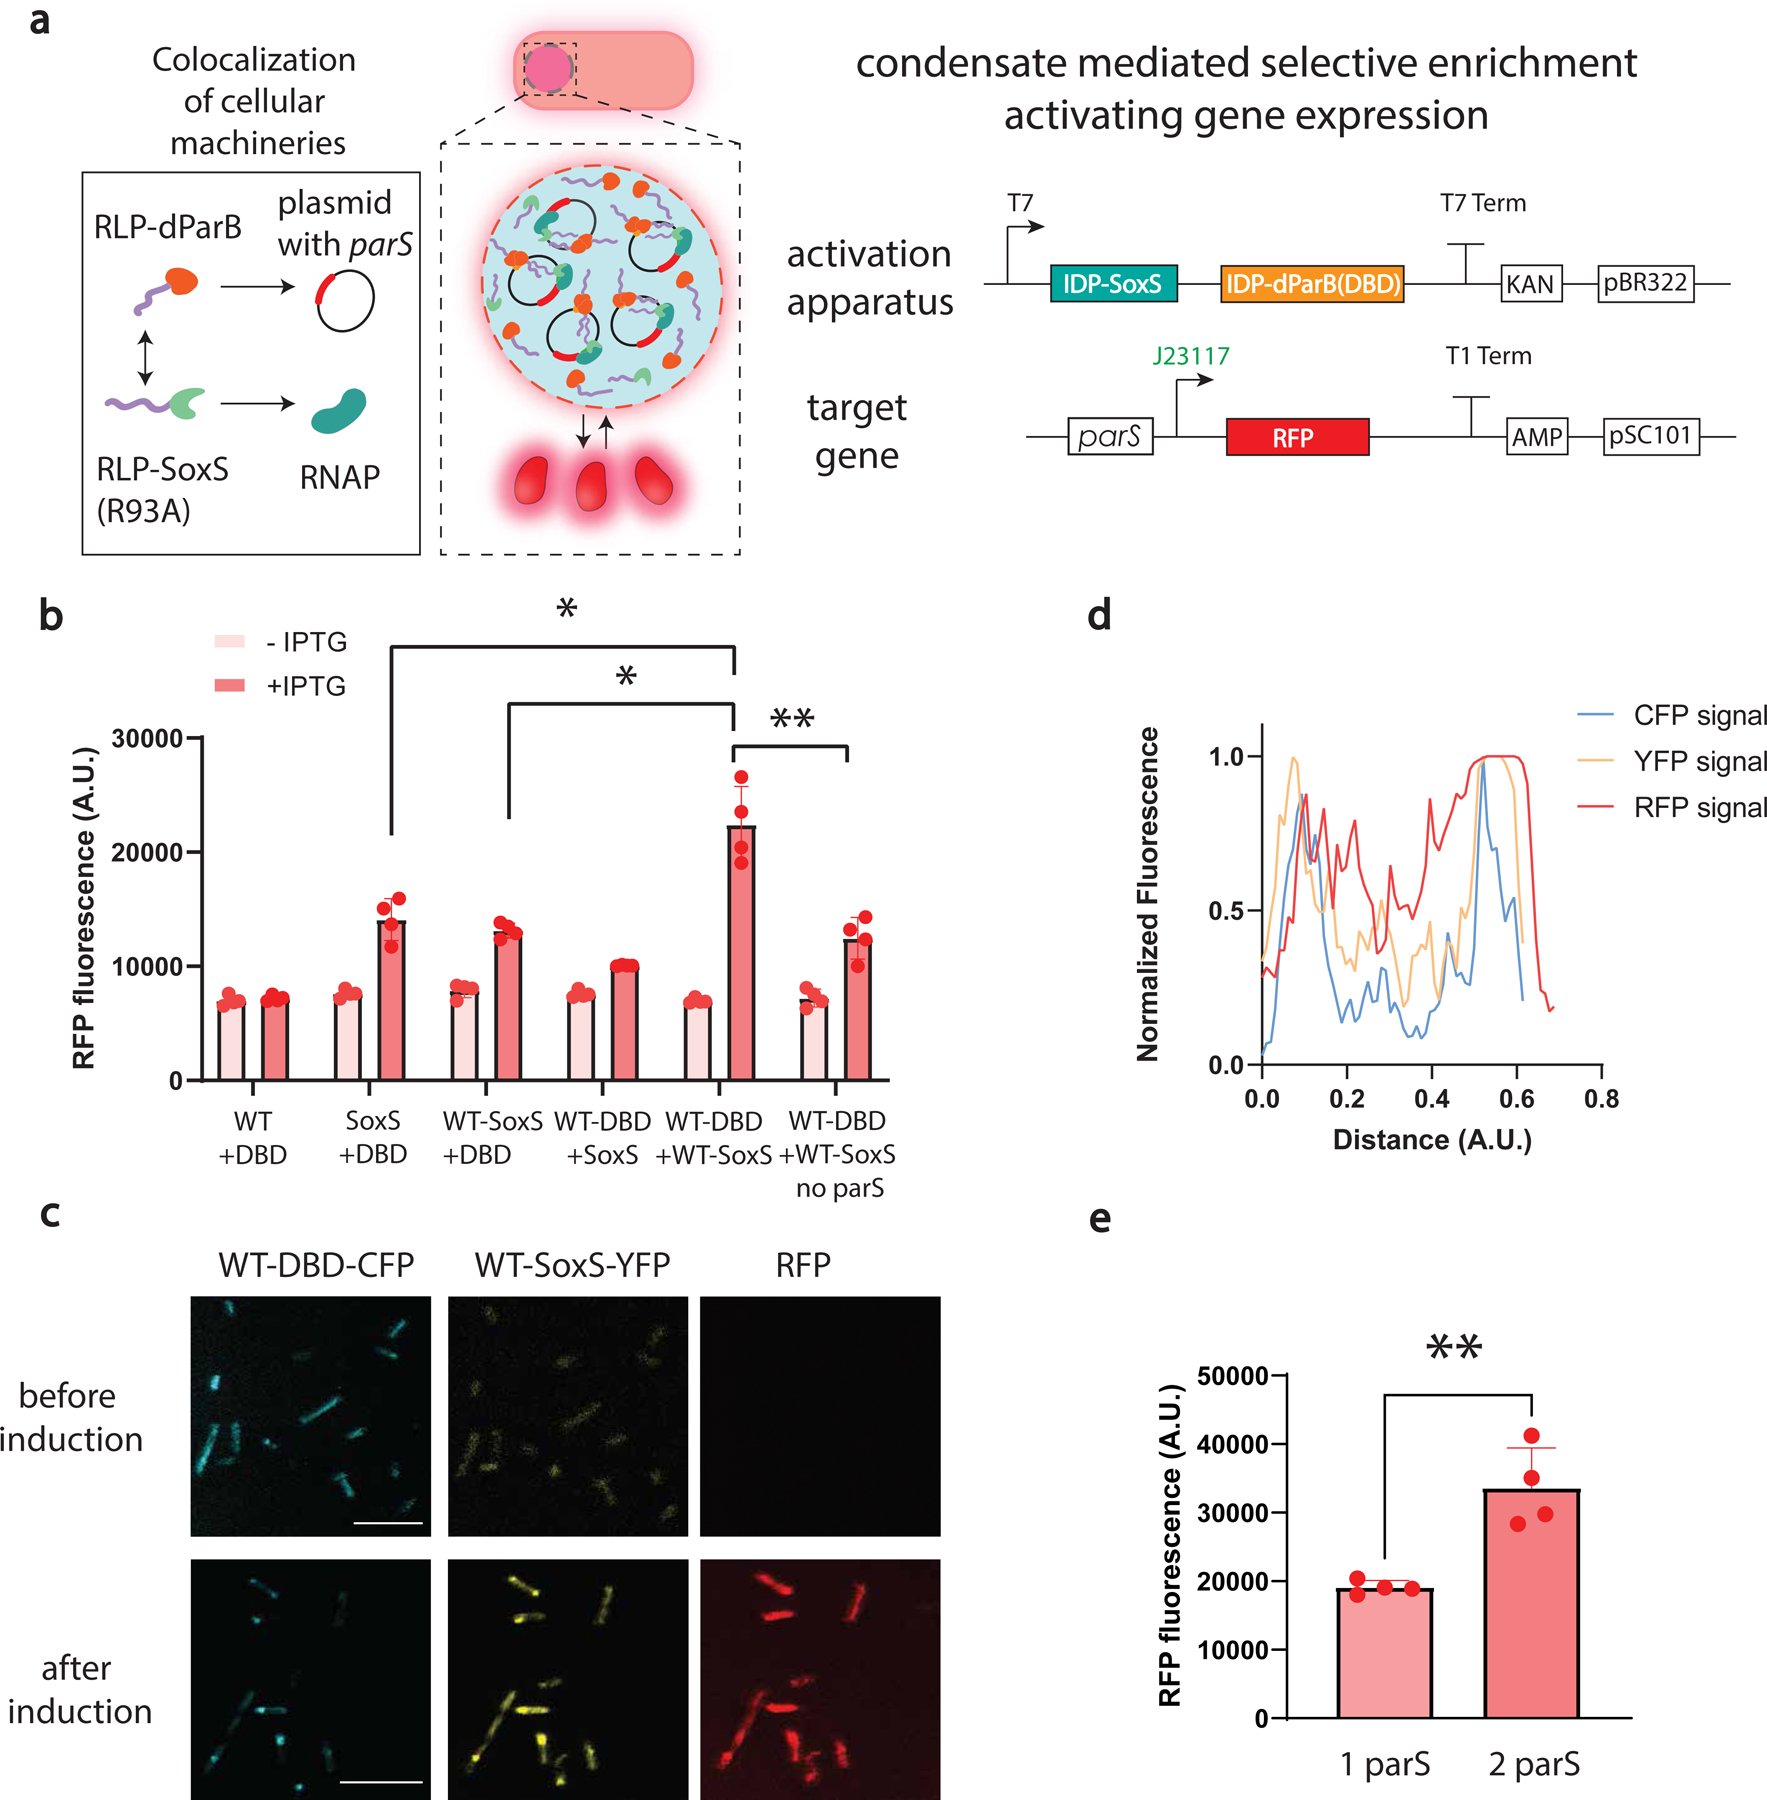
a, A dynamic condensate clusters key transcriptional machinery and plasmids, amplifying transcription because of the increased local concentrations of transcriptional activator and RNA polymerase in the condensate. Synthetic transcriptional machinery is constructed by synIDP-DBD directed condensate formation on parS sites and synIDP-SoxS (R93A) mediated recruitments of RNA polymerase to a weak promoter J23117. The synIDP-mediated condensate formation activates expression of the target gene. Expression of synIDP-dParB and synIDP-SoxS (R93A) is controlled by a T7 promoter.
b, Comparison of RFP fluorescence signal based on the combinations of different components, DBD, synIDP, SoxS (R93A) after 2h of induction of the components of the transcription activation apparatus. n = 4 independent biological repeats. *, p<0.025 and **, p<0.009 by two-tailed unpaired t-test.
c, Confocal fluorescence images of cells carrying activation apparatus (fused with fluorescent protein markers) and target gene. Sequential fluorescence images were acquired at distinct wavelengths for excitation laser and emission detector (433, 515, and 587 nm respectively for excitations, 440–475, 518–540, and 590–610 nm respectively for emission). Scale bar is 7.5 μm. n=3 independent biological repeats with similar results.
d, Normalized fluorescence signal profile over distance across the cell. Fluorescence signal of each channel was converted into gray scale and profiled across the cell.
e, Regulation of transcription performance through programming heterotypic interactions. Increasing the number of synthetic enhancer sites demonstrates significant increase of the RFP signal after 2 h of induction. n = 4 independent biological repeats. **, p<0.009 by two-tailed unpaired t-test. Bar graph represents mean± SD
To test the model predictions, we chose a mutated transcriptional activator, SoxS (SoxS(R93A)), as the functional domain to recruit the transcriptional machinery. SoxS(R93A) lacks the ability to bind a specific DNA sequence and is unable to drive strong gene expression by itself41. We created a plasmid containing a parS site followed by a constitutive promoter (BBa_J2311741) that drives limited expression of RFP. By constructing a synIDP-SoxS(R93A) fusion and a synIDP-DBD fusion as the co-activator to recruit the target gene, we hypothesized that the synthetic condensate mediated co-localization of transcriptional machinery and the target gene would enhance transcription (Fig. 5a).
We placed the different parts of the synthetic transcriptional enhancing elements under the control of the same lac promoter, which is inducible by IPTG, and compared the RFP signal output after 2 h of induction. Co-expression of RLPWT-DBD and RLPWT-SoxS(R93A) showed the strongest RFP expression (Fig. 5b). We next fused RLPWT-DBD with CFP and RLPWT-SoxS(R93A) with YFP37 and imaged cells before and after IPTG induction. After 5 h of induction, we observed distinct condensates of RLPWT-DBD-CFP and RLPWT-SoxS(R93A)-YFP with colocalized CFP and YFP signal, confirming the recruitment of both components within the condensates (Fig. 5c). The highest RFP signal coincided with the position where highest CFP and YFP signals were detected (Fig. 5d). The mean RFP fluorescence intensity inside the condensate was two-fold higher than that in the cytosol (Supplementary Fig. 3b). This result confirmed condensate-mediated transcription amplification.
Next, we assessed the impact of lowering the Cdilute of the synIDP on the rate of transcriptional activation. Using RLPR-D or RLPR-D2 as the synIDP domains for DBD and SoxS (R93A), we found a significant increase of the RFP signal within 1 h after induction compared with the constructs based on RLPWT (Supplementary Fig. 3c). However, we observed negligible difference in the level of RFP expression between RLPR-D and RLPR-D2 based constructs. We also investigated whether the correlation between physical properties of the condensate and function held for this application. We used RLPWT-DBD-DD, which was designed to be impermeable (Fig. 3d), as the component to recruit transcriptional machinery. This construct slightly decreased the RFP signal (Supplementary Fig. 3d), likely due to its impermeable nature limiting the accessibility of transcriptional machinery.
As the inclusion of an additional parS binding site increased the amount of RLPWT-DBD that partitioned into the condensates (Extended Data Fig. 5c), we incorporated two parS sites on the target plasmid and indeed led to a two-fold increase in the RFP signal compared with a plasmid containing a single parS site (Fig. 5e). Moving the parS site 2686 bp away from the promoter did not cause a significant change in the RFP signal compared with a target plasmid with parS next to the promoter. Thus, the amplification of gene expression likely resulted from the formation of condensates rather than local interactions within components of the condensate (Supplementary Fig. 3e).
Finally, to compare condensate-mediated transcription activation with conventional lock-and-key interaction-mediated transcription activation, we fused dParB (DBD) with SoxS (R93A) to make a synthetic transcription activator to mimic the lock-and-key interaction dependent transcription activation. We encoded dParB (DBD)-SoxS (R93A) into the plasmid regulated by the lac promoter. After 2 h of induction by IPTG, we observed a ~2-fold increase in the RFP signal (Supplementary Fig. 3f), which was slightly lower than that of condensate mediated activation. Moving the parS site 2686 bp away from the promoter eliminated RFP activation (Supplementary Fig. 3f). This observation indicates the importance of localized interactions for lock-and-key-mediated transcription activation compared with the negligible effect of binding site localization in condensate-mediated transcription.
Condensates modulate protein activity in mammalian cells
Next, we examined the generality of our approach for engineering functional condensates in mammalian cells, by focusing on using the sequestration function of synthetic condensates to regulate a protein circuit. Protein-level circuits, in which a protein directly regulates the activity of another protein, represent an alternative strategy of cellular control42.
We first created a reporter protein containing a Citrine fluorescent protein fused with a dihydrofolate reductase (DHFR) degron42, which mediates the degradation of its fusion partner by chaperone-dependent proteasomal degradation43. To modulate its activity, the Czipper part of an antiparallel leucine zipper44 was fused at the N-terminal of the reporter protein as an interaction domain, which enables specific interaction with Nzipper. To achieve targeted sequestration, we synthesized a mammalian codon-optimized RLPS-Y as the synIDP domain to drive the formation of synthetic condensate. The synIDP was fused with Nzipper as the hetero-oligomerization domain to mediate the recruitment of the target protein into the condensates (Fig. 6a). We hypothesized that the recruitment of the reporter protein, Czipper-Citrine-DHFR, into condensates of RLPS-Y-Nzipper would protect the reporter protein from degradation (Fig. 6b).
Fig. 6 |. Condensate mediated regulation of protein activity in mammalian cell.
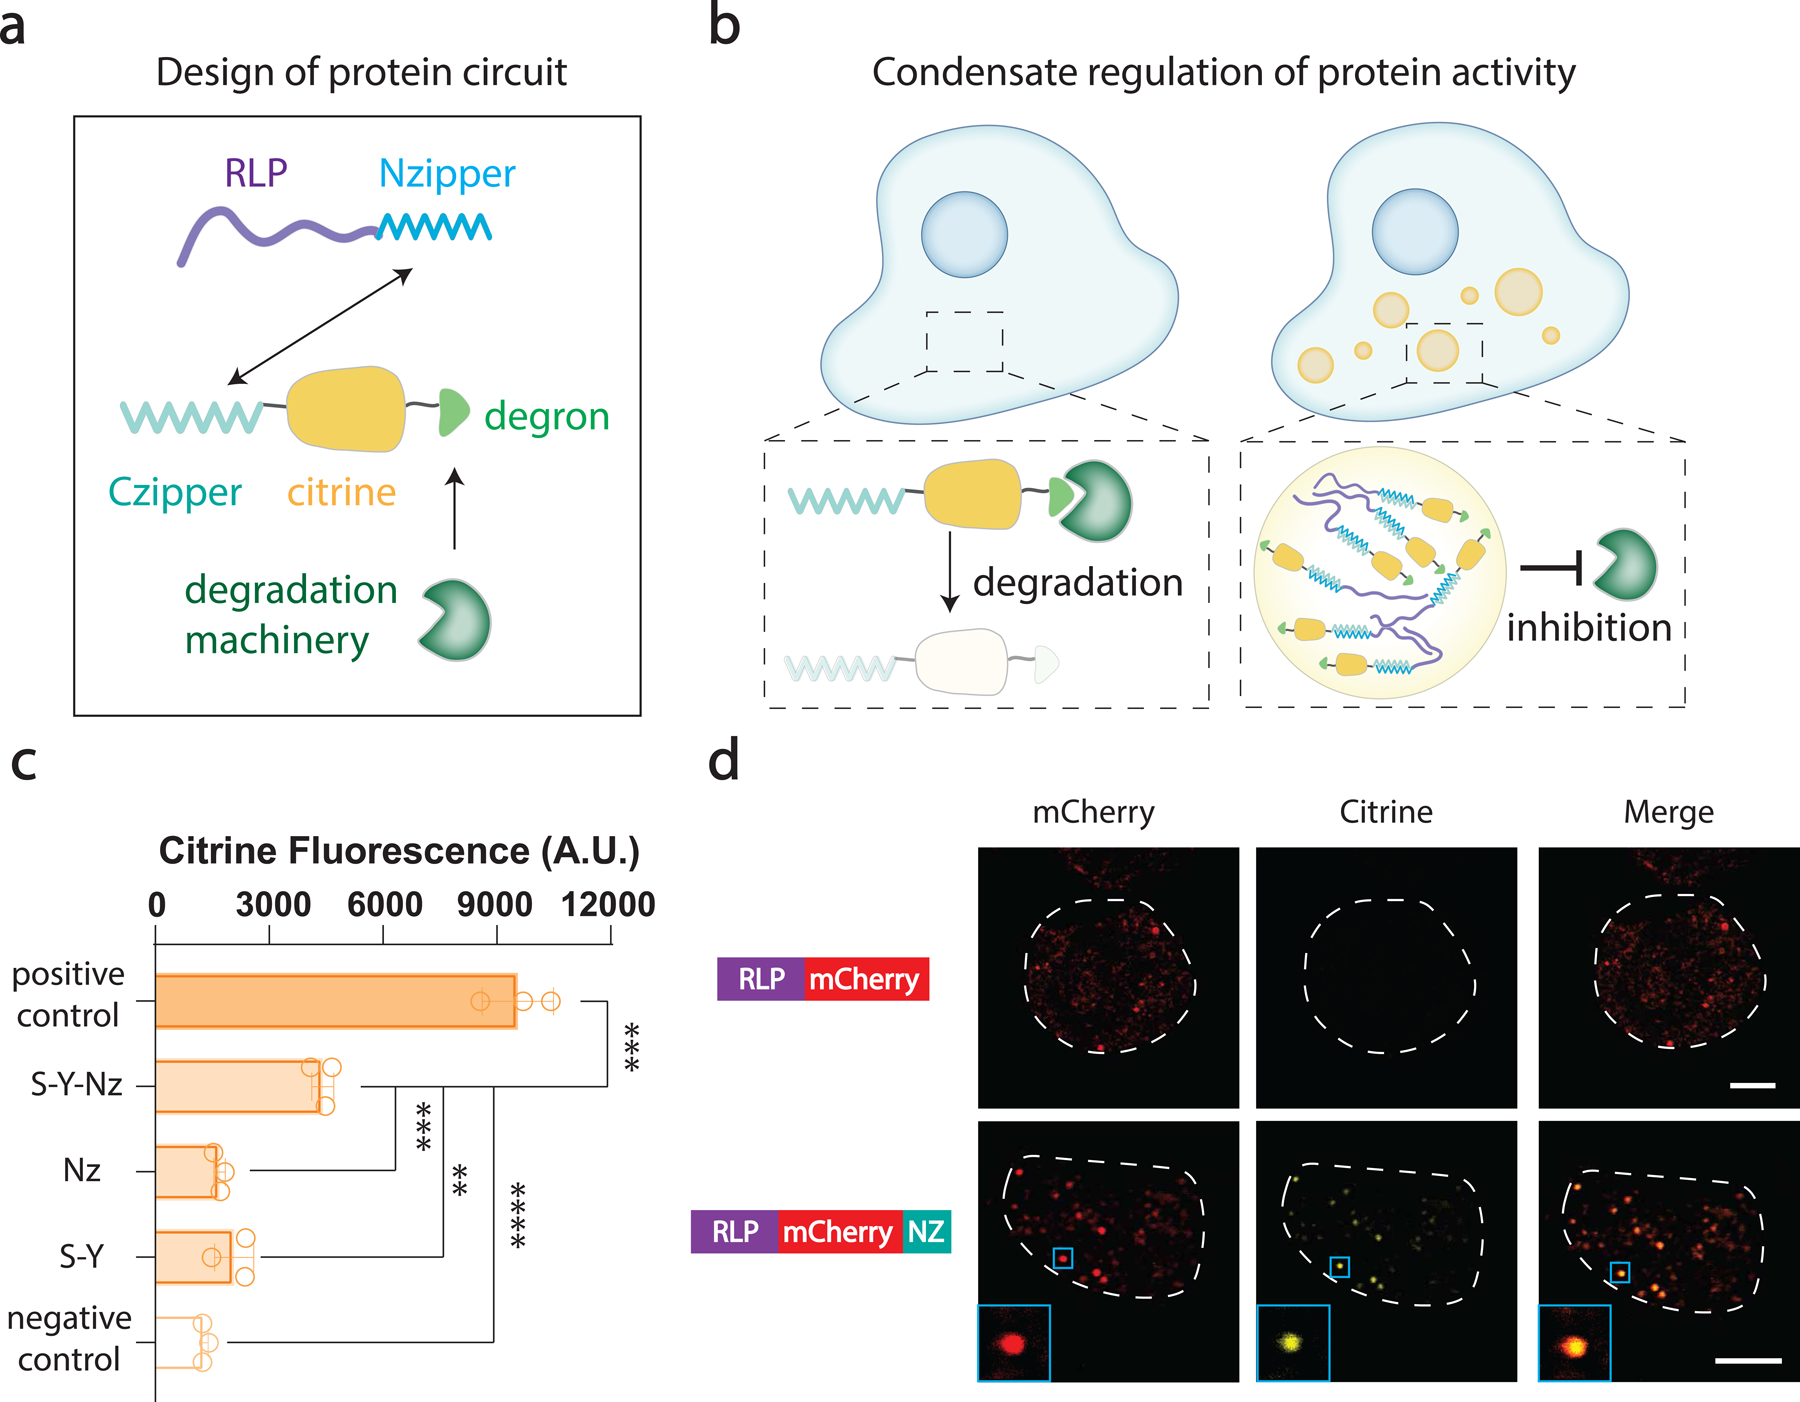
a, A synIDP capable of mediating the formation of dynamically arrested condensate was implemented for targeted protein sequestration in mammalian cell. A synIDP-Nzipper fusion was implemented to recruit Citrine fused with Czipper and DHFR degron (Czipper-Citrine-DHFR) into the synthetic condensate. The DHFR degron is targeted by the cellular degradation machinery.
b, Condensate formation excludes the degradation machinery from the target protein, thereby restoring citrine fluorescence signal.
c, Flow cytometry analysis of Citrine fluorescence after 48 h of transfection. Cells were transfected with a plasmid encoding Czipper-Citrine-DHFR and a plasmid encoding RLPS-Y-Nzipper or Nzipper alone or RLPS-Y alone. Positive control was cells transfected with Czipper-Citrine-DHFR plasmid with addition of TMP. Negative control was cells transfected with only Czipper-Citrine-DHFR plasmid. n = 3 independent biological repeats. **, p=0.0024, ***, p<0.001 and ****, p<0.0001 by a two-tailed unpair t-test. Bar graph represents mean± SD.
d, Super-resolution confocal fluorescence images of HEK293 cells carrying plasmids containing different constructs with Czipper-Citrine-DHFR plasmid. For Citrine detection, the excitation wavelength was set at 516 nm with a detector range at 520–565 nm and a stimulated emission depletion laser at 592 nm. For mCherry detection, the excitation wavelength was set at 588 nm with a detector range at 590–650 nm and a stimulated emission depletion lasers set at 660 nm. Scale bar is 5 μm. n=4 independent biological repeats with similar results.
We co-transfected HEK293 cells with a plasmid encoding the reporter protein, Czipper-Citrine-DHFR, under a constitutive phosphoglycerate kinase 1 (PGK) promoter45 and a plasmid encoding different components of the synthetic condensate under a constitutive cytomegalovirus (CMV) promoter46. We quantified the single-cell Citrine fluorescence after 48 h of transfection. As a positive control, we treated cells containing only the Czipper-Citrine-DHFR plasmid with trimethoprim (TMP), which inhibits the reporter protein from degradation by stabilizing the DHFR degron42. As a negative control, we used cells containing only the Czipper-Citrine-DHFR plasmid which should show maximum degradation of the reporter protein. We observed that cells that only expressed the RLPS-Y or Nzipper showed no significant difference in the Citrine fluorescence comparing with the negative control. This indicates that RLPS-Y condensate could not recruit the Czipper-Citrine-DHFR fusion. Conversely, while the Nzipper can bind the Czipper-Citrine-DHFR fusion, binding of the two halves of the leucine zipper does not by itself prevent Citrine degradation. In contrast, only cells expressing RLPS-Y-Nzipper and the reporter protein enabled partial restoration of the fluorescence signal by around 25% (Fig. 6c). Transfection of RLPS-Y-Nzipper led to a limited decrease in cell viability (Extended Data Fig. 8a).
To visually confirm that the restoration of Citrine fluorescence occurs via its sequestration within the synIDP condensate, we fused mCherry to the RLPS-Y-Nzipper to examine whether it colocalizes with Czipper-Citrine-DHFR in the condensates. Super-resolution fluorescence microscopy showed co-localization of the fluorescence signals of the reporter protein and the RLPS-Y–mediated condensates only in the construct containing the Nzipper domain (Fig. 6d). We also found a time-dependent and hence expression-level dependent formation of condensates, suggesting a phase separation-mediated process (Extended Data Fig. 8b). FRAP analysis showed that the dynamically arrested nature of the RLPS-Y condensate was maintained in mammalian cells; the target protein, Czipper-Citrine-DHFR, also showed a recovery plateau, confirming that sequestration was facilitated by stalled molecular exchange with the dilute phase (Extended Data Fig. 8c). Finally, we controlled the protein expression level by controlling the amount of plasmids transfected42. We transfected the cells with the same amount of reporter protein plasmid and different amounts of plasmid encoding RLPS-Y-mCherry-Nzipper and measured the Citrine fluorescence level after 48 h. A dose-dependent increase in the fluorescence signal was observed from single-cell measurements and from the confocal images but limited citrine fluorescence signal was observed in the cytoplasm (Extended Data Fig. 8d), confirming that the restoration of Citrine signal was mediated by the synthetic condensates.
DISCUSSION
Our work illustrates how genetically encoded synIDPs capable of undergoing responsive phase transitions can be utilized for the design of functional condensates in living cells. We showed that synIDPs with tunable sequence composition allow rational design of their phase behaviors and physical properties of the condensates, which endow the synthetic condensates with programmable functions for specific applications in living cells. We also demonstrated that the judicious choice of protein-protein and protein-DNA interaction domains can tune the interplay between homotypic and heterotypic interactions as drivers of phase separation and modulators of the physical properties of the condensates, which, in turn, can dictate different cellular functions. Parameters that govern the formation and properties of the synthetic condensates include the sequence-encoded saturation concentrations of synIDPs, influence of additional interaction motif for homotypic interaction and heterotypic interaction, and the physical properties of the condensate such as its molecular diffusivity and permeability. By demonstrating how modulating these properties of synthetic condensates can control different cellular functions, this study goes beyond our previous studies that used sequence heuristics only to program the phase diagram of synIDPs15,16.
In contrast to lock-and-key type interactions47, condensate formation creates a spatially distinct intracellular compartmentalization. This helps isolate the interior of condensates from the coexisting cellular milieu, a feature enabled by the presence of a condensate interface. As demonstrated in the application on condensate-mediated plasmid partitioning and modulation of protein activity, the synthetic condensate can provide an exclusionary environment, thereby regulating cellular functions through selective retention of functional components.
Condensate formation can also increase the local concentration of molecules of interest above their concentration in the cytosol. We used this feature to recruit plasmids of interest and key components of the transcriptional machinery into the condensate to amplify transcription. We found that the condensates provide a confined environment that selectively enriches plasmids and transcriptional machinery within condensate and thereby boosts the efficiency of gene transcription. We note that our approach is likely generalizable and will enable diverse cellular functions that benefit from preferential spatial localization of molecules.
METHODS
Confocal fluorescence imaging of cells
Plasmids with gene of interests were transformed into BL21(DE3) (NEB) or BL21 (DE3)-AI One Shot (ThermoFisher), which were plated on corresponding selection plates and grown overnight. A single colony was picked and cultured in 5 mL of 2x YT media with 45 mg/mL kanamycin containing 0.4% glucose to repress basal protein expression. After 16 h at 37°C (@200 rpm), the cells were diluted at a ratio of 1:100 in 2x YT media with 45 mg/mL kanamycin and cultured for an additional 3 h. The cells were then diluted with 2x YT media with 45 mg/mL kanamycin to an optical density at 600 nm (OD600) of 0.2 and induced with 1 mM IPTG (for BL21(DE3)-AI, 0.2% arabinose was added along with 1mM IPTG). This time point was set as zero. Before imaging, cells were pelleted and diluted into PBS. Images were taken at room temperature by a Leica TCS SP5 (Leica) confocal fluorescence microscope with a 40X 1.25–0.75 oil immersion objective for confocal images. Magnified view was taken under the same condition with a 63X 1.30 glycerol immersion objective. The confocal imaging procedure is the same as described in the phase separation assay in the Supplementary Information.
Asymmetric plasmid partitioning assay
E. coli BL21(A1) strain (ThermoFisher) containing a plasmid encoding the functional components with a kanamycin resistance gene, and the target plasmid with a chloramphenicol resistance gene was grown overnight at 37°C (@200 rpm) in 2x YT medium (with 0.4% glucose) containing both kanamycin (45 mg/L) and chloramphenicol (25 mg/L). The cells were then diluted at a ratio of 1:100 into 2x YT medium containing only kanamycin (45 mg/L). After 1 h of growth at 37 ºC, the cells were induced with 0.5 mM IPTG and 0.2% (w/v) arabinose. This time point was set as zero. Starting from this time point, the E. coli. culture was sampled at 1 h, 3 h and 5 h by diluting the culture into 2x YT medium at dilution ratios of 1:5000, 1:10000, 1:50000, and 1:100000. 10μL of the diluted culture were plated onto two different plates, a plate with only kanamycin (indicating the total number of living cells), and another plate with both kanamycin and chloramphenicol (indicating the number of progenitor cells). The selection plates were then incubated at 37°C overnight (~14 h). The number of colonies that were larger than 0.5 mm on each plate were counted and the total CFUs were calculated by accounting for the dilution ratio. The partitioning ratio was calculated based on the CFU counts of progenitor cells divided by the CFU counts of total live cells.
Engineered conjugation platform to evaluate the efficiency of horizontal gene transfer
For the preparation of the donor strain culture, plasmids encoding the DNA segregation apparatus in pBad 33.1 (p15A ori, Chl resistance) and a mobilizable plasmid with/without parS (ColE1 ori, Kan resistance) were transformed into TSS competent MG 1655 strain (containing the F helper plasmid), which was then grown in 5 mL of 2x YT medium (with 0.4% w/v glucose) containing kanamycin (45 mg/L) and chloramphenicol (25 mg/L) for 16 h at 37 °C. For preparation of the recipient strain culture, the E. coli. MG1655 strain with an ampicillin resistance gene that is integrated into its chromosome 40 was inoculated in 5 mL of 2 x YT medium containing ampicillin (100 mg/L) and cultured for 16 h at 37 °C. The OD600 was then measured for the donor and recipient culture, and both cultures were then diluted to an OD600 of 0.4. 500 µL of each diluted culture was then resuspended into 2x YT medium without the addition of antibiotics. Mixtures were incubated at 25°C for 3 h without shaking to allow conjugation. Measurements of OD600 of the cell mixture before and after conjugation were compared to confirm limited cellular growth.
To quantify conjugation efficiency, the amounts of recipient (R), donor (D), and transconjugants (T) were quantified through selective plating. For recipient, the cultures were diluted 1:1000000 and 1:5000000 into 2x YT medium and plated onto plate containing ampicillin (100 mg/L). For donor, the cultures were diluted 1:100000 and 1:500000 into 2x YT medium and plated onto a plate containing chloramphenicol (25mg/L) and kanamycin (45 mg/L) or only a chloramphenicol plate (due to limited growth, we did not observe difference between the cell counts by these two plates). For transconjugants, the cultures were diluted by 1:10, 1:50, 1:100, 1:500 and plated onto a plate containing ampicillin (100 mg/L) and kanamycin (45 mg/L). The plates were incubated at 37°C overnight (14 h) and the total CFUs were quantified as described in the previous section. The conjugation efficiency (η) was calculated by η= Y/(RTΔt) 39, where, R, D and T are the colony forming unit (c.f.u.) counts of recipients, donors and transconjugants and Δt is the conjugation period.
Cell fluorescence quantification for condensate mediated transcription amplification
E. Coli. BL21(A1) strain (ThermoFisher) containing both the transcription amplification apparatus plasmid (ColE1 ori, kanamycin resistance) and the target plasmid (pSC101 ori, ampicillin resistance) was grown overnight at 37°C (@200 rpm) in 5 mL of 2x YT medium with 0.4% glucose, kanamycin (45 mg/L) and ampicillin (100 mg/L). The cells were then diluted 1:100 into 3 mL of 2x YT medium containing kanamycin (45 mg/L) and ampicillin (100 mg/L). After 1 h of growth, the cells were induced with 0.5 mM IPTG and 0.2% (w/v) arabinose. This time point was set as zero. Starting from this time point, the E. coli culture was sampled at the time point specified in the manuscript by pelleting 200 μL of cell culture, followed by washing the cell pellet with PBS for three cycles and were finally resuspended into 200 μL of PBS in a 96 well-plate with a #1.5H glass bottom (Cellvis). The fluorescence of mRFP was measured on a microplate reader (Infinite 200 Tecan) with an excitation wavelength of 584 nm and emission wavelength of 610 nm.
Regulation of protein circuits in mammalian cells
HEK293 cells were maintained in Expi293™ Expression Medium (ThermoFisher) and cultured under standard conditions as stated in the Expi293 User Guide (ThermoFisher). Cells were seeded at 2.5×10⁶ viable cells/mL and cultured overnight. After 22 h, the cells were diluted back to 1×10⁶ viable cells/mL and transfected with plasmid constructs in a total of 1.2 µg (0.5 µg of plasmid encoding reporter protein and 0.7 µg of plasmid encoding synIDP-fusions) using ExpiFectamine™ 293 Transfection Kit (ThermoFisher) in a 96 Deep Square Well covered by a sealing film. Two days after transfection, cells were prepared for analysis by removing the culture medium and washed the cells with Hank’s balanced salt solution (HBSS) and placed onto a 35 mm No. 1.5 coverslip Glass Bottom dish (MATTEK) for confocal imaging or put into a round bottom polystyrene FACS tubes (Stellar Scientific) for flow cytometry analysis.
LaSSI Simulations
Simulations were performed using LaSSI, a lattice-based Monte Carlo engine33. Monte Carlo moves are accepted or rejected based on the Metropolis-Hastings criterion so that the probability of accepting a move is equal to min(1, exp(−βΔE)), where β = 1 / kT. Here, kT is the simulation temperature and ΔE is the change in total system energy associated with the attempted move. Total system energies were calculated using a nearest neighbor model and previously derived interaction parameters14. For each variant and simulation temperature, 200 distinct chain molecules comprised of 160 beads each were placed in a cubic lattice with length 120 lattice units. Previous calibrations have shown that the numbers of molecules used in these simulations are adequate to avoid problems due to finite size effects. The simulations were allowed to equilibrate such that the chains formed a single condensate with a coexisting dilute phase before any analysis was performed. Given our interest in the dynamics of the condensate chains, we limited the Monte Carlo move set to local moves and snake moves, eliminating non-physical moves that are part of the total set of moves. The mean square displacement (MSD) of chains in the condensate was calculated by tracking the distance moved by the center of mass of each chain after 2.5 × 10⁷ total system Monte Carlo moves. Only chains within with the condensate were included in this analysis. The distances were averaged for each simulation to calculate a final MSD. For each set of conditions, 5 independent simulations were performed, and the calculated MSD values were essentially identical across replicates.
To determine the likelihood that a chain exits the condensate, we first count the number of chains in the condensate at some initial time. We then count how many of these chains are still in the condensate and how many have entered the dilute phase after 5×10⁹ Monte Carlo moves. For each chain that stays in the condensate, we increment cdense by 1 and for each chain that enters the dilute phase, we increment cdilute by 1. We then re-perform this analysis throughout the entire simulation, incrementing cdense and cdilute as we go. Lastly, we calculate the desired parameter by taking cdilute / (cdilute + cdense).
Molecular Biology and Cloning
Construction of bacterial expression vectors
Construction of repetitive IDP and fusion constructs-
The gene for each synIDP motif was propagated 5 times/10 times in silico using a previously developed algorithm to decrease the degree of repetition in the DNA sequence48. The DNA sequence output of repetitive IDPs was then manually codon optimized using Integrated DNA technologies (IDT) codon optimization server (this step limited the length of gBlocks synthesis due to repetitive DNA sequences). The optimized sequences of synIDPs and fusion partners were synthesized by IDT with Gibson assembly overhangs for insertion into our in-house-modified pet24a+ vector. To construct 20 repeats of the synthetic IDP or other fusion partners (i.e. dParB, sfGFP, CFP, mEGFP, 6-HIS tag, HIS-SUMO tag, SoxS (R93A)), recursive directional ligation was performed based on previous protocols49. In short, BseRI and BgII (NEB) were used to create the C-terminal fragment; AcuI and BgII (NEB) were used to create N-terminal fragment. The gene fragments were then ligated together with Quick Ligation Kit (NEB).
Construction of plasmid containing cis-acting parS-
parS sequences with desired overhangs matching the restriction enzyme cut sites were synthesized as ssDNAs (IDT) and annealed together before ligation. pBad 33.1 (addgene #36267) was used for cloning. To add parS sequences near the ori, pBad 33.1 was cut by NsiI and ClaI (NEB) and gel purified. To add parS sequences near the transcription start site, pBad 33.1 was cut by XmaI and XbaI (NEB) and gel-purified. The annealed parS with overhang was ligated onto the pBad 33.1 with Quick Ligation Kit (NEB). To add two parS sites, the plasmid was linearized through Q5 hot start PCR master mix (NEB) and the dsDNA oligos were blunt end ligated onto the linearized plasmid with Quick Blunting kit (NEB) and Quick ligation kit (NEB). To modify pBad 33.1 with fluorescent reporter protein, the fluorescent protein was extracted from pET24+ by restriction enzyme digestion with XbaI and HindIII, and pBad 33.1 was also digested with XbaI and HindIII (NEB) and gel purified. Then the two fragments were then ligated together with the Quick Ligation Kit (NEB). To add parS as targeting sequence on the transmissible plasmid, primers were designed to incorporate parS sequence to linearize the transmissible plasmid by Q5 hot start master mix (NEB) and the product was gel purified. The linearized plasmid was 5’-phosphorylated by Quick Blunting Kit (NEB) and ligated with Quick Ligation Kit (NEB). To add parS as a synthetic enhancer for transcriptional activation, primers were designed to incorporate parS sequence to linearize pJF076Sa (addgene #113322) by Q5 hot start master mix (NEB) and the product was gel purified. The linearized plasmid was 5’-phosphorylated by Quick Blunting Kit (NEB) and ligated with Quick Ligation Kit (NEB).
Construction of dual-expression plasmid for cooperativity dependent transcription amplification-
To make a dual-expression plasmid, our in-house pET-dual plasmid containing the gene of interest was amplified by PCR to add XhoI and HindIII cutting sites with Q5® Hot Start High-Fidelity 2X Master Mix (NEB). The amplified gene fragment and the same vector with the other gene of interest were cut by XhoI and HindIII (NEB) and gel purified. The amplified gene fragment was then ligated into the vector by Quick Ligation Kit (NEB).
Construction of plasmids for mammalian cell experiments-
Reporter protein plasmid was obtained from Addgene (#116060). Plasmid expressing protein regulating elements was modified based on pcDNA 3.1-mCherry (#128744). Sequences containing Czipper, RLPS-Y and Nzipper were codon optimized to Homo sapiens and ordered as gBlocks fragments from IDT and cloned onto reporter protein plasmid and pcDNA 3.1 through Gibson assembly using HiFi DNA Assembly Master Mix (NEB). Control sequences were amplified from RLPS-Y-mCherry-Nzipper using Q5 hot start master mix (NEB) and the linearized plasmids were 5’-phosphorylated by Quick Blunting Kit (NEB) and ligated with Quick Ligation Kit (NEB).
All the constructed plasmids were transformed into NEB 5-alpha (NEB) to propagate, mini-prepared by QIAprep Spin Miniprep Kit (QIAGEN) and sequenced by Sanger Sequencing (Genewiz).
Expression and purification of recombinant proteins
Expression-
The Bacterial vector containing the gene of interest (synIDP-6HIS, synIDP-FP-6HIS,synIDP-dParB-sfGFP, 6HIS-SUMO-synIDP-dParB) was transformed into BL21(DE3) and plated onto kanamycin selection plate as instructed by the NEB protocols. An individual colony was inoculated into 5 mL of 2x YT medium (supplemented with 0.2% glucose) and grown overnight (15–16 h) at 37°C in a shaker incubator (@200 rpm). Cultures were then inoculated into 1L 2x YT medium with 45 mg/L of kanamycin. Inoculated cells were grown at 37°C in a shaker incubator (@200 rpm) till the OD at 600 nm reached ~0.5, which typically takes over 4–6 h. Cells were then induced with IPTG at a final concentration of 0.5 mM. Induced cells were grown overnight for an additional 15 h.
Purification of synIDP-6HIS, synIDP-dParB-6HIS and synIDP-FP-6HIS-
Cell pellets were harvested by centrifuging cultures at 3500 x g for 20 min at 4°C and resuspended in 40 mL of cell lysis buffer (50 mM Tris-HCl, 500 mM NaCl, 8 M urea, pH at 7.2). Resuspended cells were lysed through a total of 2 min sonication (10 s of sonication followed by 40 s of rest) at an intensity of 75% in an ice-bucket. 125 U of benzonase nuclease (Millipore Sigma) were added into the cell lysates and incubated for 30 min in a warm water bath at 37°C before going through centrifugation at 37°C at 20000 x g for 20 min to remove insoluble cell debris. One tablet of cOmplete™ Protease Inhibitor Cocktail (Roche) per liter of culture was then added into the supernatant before going through immobilized metal affinity chromatography (IMAC) under denaturing conditions following a standard protocol50. The purity of the proteins was verified with 4–20% gradient Tris-HCl (Biorad) SDS-PAGE stained with Simply Blue SafeStain (Thermo Fisher Scientific). The concentration of the eluted protein was measured by A280 and translated to molar concentration using corresponding extinction coefficients. The final concentration of the protein before dialysis was adjusted to around 100–150 μM and dialyzed in a 10 KDa membrane (SnakeSkin, Thermo Fisher Scientific) against protein storage buffer (50 mM Tris-HCl, 500 mM NaCl, 1 mM EDTA, 5% glycerol with pH at 7.2). The dialysis buffer was changed 3 times in a total period of 6 h at room temperature. Aggregates were discarded and the concentration of purified proteins was adjusted again to 100–150 μM using storage buffer and Amicon Ultra-15 Centrifugal Filter Units (Millipore Sigma) before aliquoted into PCR tubes (Thermo Fisher Scientific). The purified protein was then flash frozen in liquid nitrogen and stored at −80°C.
Purification of 6HIS-SUMO-synIDP-dParB-
6His-SUMO tag was applied to purify constructs containing dParB protein to help the proteins remain soluble at high-concentration in the cell. Protocols of purification before/including HIS-purification remain the same as previous section. The purified 6HIS-SUMO-synIDP-dParB was concentrated to around 100 μM and adjusted into a SUMO cleavage buffer (50mM Tris-HCl, 125 mM NaCl, 2 mM DTT, 2M Urea) using Amicon™ Ultra-15 Centrifugal Filter Units (MilliporeSigma). 20 U HIS-SUMO protease (MilliporeSigma) was applied to remove the SUMO tag by incubating at 37°C for 2 hr. The synIDP-dParB protein was then obtained through a standard IMAC purification protocol and went through the same dialysis protocol as described in the previous section.
Phase separation assay
Phase separation assay was applied to evaluate the phase behavior of proteins in different solution conditions in vitro51. Dilution buffer (50 mM Tris-HCl, 1 mM EDTA, pH 7.2) and salt buffer (50 mM Tris-HCl, 500 mM NaCl, 1 mM EDTA, 10% PEG, pH 7.2) were applied to adjust the final concentrations of salt and purified protein. The percentage of PEG was adjusted through the dilution buffer to have a final concentration of 10%, providing a crowding environment to mimic cellular environments27. For fluorescence imaging, 10 % of fluorescently labeled proteins were mixed with the sample. A 35 mm Dish with No. 1.5 coverslip (Mattek) or 368 well-plate with No. 1.5 cover glass (Cellvis) was applied for sample imaging on Leica SP8. Typically, after preparation, the sample was incubated on the dish for 3 h at 37°C before imaging, allowing the condensates to fuse and wet the bottom of the glass. Leica STED SP8 (Leica) with 93X 1.20 (glycerol immersion objective) was applied with WILL power source set at 70%. Constant excitation laser with energy of 1% at wavelength (485 nm for sfGFP, 550 nm for Cy3) and emission detector range (490–510 nm for sfGFP, 560–580 nm for Cy3) were applied for imaging to ensure reproducibility. Voltage gains were adjusted to prevent oversaturation. Images were taken in a sequential manner for each channel to prevent crosstalk. We found that the absolute difference of Z value at which the images were taken between different trails should be within a value of 15 µm, ensuring the observed condensates are the ones just above the glass bottom.
Fluorescent recovery of photobleaching (FRAP) analysis
Phase separated condensates with the same preparation protocols as shown in the previous section were used for FRAP analysis. Leica TCS SP8 (Leica) with 63X 1.20 (water immersion objective) was used with the FRAP wizard module in the Leica LAS AF. The Zoom function was used to focus on a specific condensate and the defined ROI was set with a fixed radius of 0.5 µm for all trails. For FRAP analysis in living cells, bacterial cells were seeded onto low-melting agar as shown previously52 before taking the measurements. 488/543 laser intensity was adjusted to 100% for bleaching with the same setup intensity of the argon energy laser (15%). The data was analyzed through the built-in FRAP module. The fraction of recovery was extracted based on the recovery plateau and the apparent diffusion coefficient was extracted based on a single-exponential model53.
Sedimentation assay
Sedimentation assay was used to measure the binodals of different synIDPs as described previously54. Briefly, protein samples were prepared at a total concentration of 30 μM described in phase separation assay. After 3 hr of incubation at 37°C, the dilute phase and dense phase were separated through centrifugation. A total sample volume of at least 2 mL is needed to allow the observation of a dense phase pellet. The dilute phase concentration (Cdilute) was directly measured on a Nanodrop Microvolume spectrophotometers (Fisher Scientific) at by the absorbanceat A280 and the concentration calculated from the extinction coefficient. 2 μL of the separated dense phase was removed using a positive displacement pipette (RAININ) and diluted into 18 μL of buffer containing same concentration of salt as the sample with addition of 6 M urea. Different dilution ratios were applied to ensure the measurement accuracy. The dense phase concentration (Cdense) was then measured by 280 nm absorbance measurement on the Nanodrop and calculated based on the dilution ratio and the extinction coefficient.
Fluorescence based sedimentation assay
Protein-DNA condensates were prepared with 500 nM of RLPWT-DBD (containing 10% RLPWT-DBD-sfGFP) and 25 nM of DNA containing different number of parS sites as described in phase separation assay. After 3 hr of incubation at 37°C, the dilute phase and dense phase were separated through centrifugation. The dilute phase fluorescence was directly measured through Nanodrop 3300 fluorospectrometer (Fisher Scientific) by blue light source and the measured emission intensity at 512 nm was extracted for quantification. For measuring the dense phase fluorescence, 1 μL of the dense phase was removed using a positive displacement pipette (RAININ) and diluted into 49 μL of buffer (50 mM Tris, 500 mM NaCl, pH 7.2). The sample was warmed to 37°C for 20 min to promote the dissolution of the dense phase before taking a measurement. The reported fluorescence signal was not converted back by the dilution ratio.
Super-resolution imaging of single condensate
Single-condensate super-resolution 3D images were acquired by Leica SP8 with Stimulated Emission Depletion (STED) microscope. A 93X 1.3 objective (glycerol immersion) with motorized correction collar (for STED) WD 0.3mm was used for super-resolution imaging. At constant 50 % WILL laser power, a constant excitation wavelength (485 nm for sfGFP, 550 nm for cy3) with the power intensity at 2 % and 1 % and emission detector range (490–510 nm for sfGFP, 560–580 nm for cy3) were used for imaging with STED depletion laser 592 nm powering at 70 % and 660 nm powered at 50 %. Images were taken in a sequential manner for each channel. Once the top and bottom boundary was confirmed, the Z-stack was set for maximum number of steps to obtain the 3D images. The imaging resolution was optimized to avoid saturated pixels. To deconvolute the 3D construction of the condensate, images from each channel were processed with classic maximum likelihood estimation (CMLE) algorithm in Huygens Professional by SVI. The refractive index of the imaging sample medium was considered to be equal to water (1.338) for image processing.
Evaluations of cellular fitness
E. coli. BL21(A1) strain (ThermoFisher) containing a plasmid encoding the synIDP-dParB fusion under control of the lac operon was grown for 16 hrs at 37°C (@200 rpm) in 5 mL of 2x YT medium (with 0.4% glucose) containing kanamycin (45 mg/L). The optical density at 600 nm (OD600) of the cell culture was then adjusted by dilution with a final OD at around 0.1 in a 200 µL M9 minimum medium containing kanamycin (45 mg/L) with or without 0.2% arabinose and 0.5 mM IPTG. The cultures were then transferred into a 96-well plate with No. 1.5 cover glass (Cellvis) and sealed with microplate sealing tape (ThermoFisher). The OD600 of the induced or non-induced cultures was tracked overnight at 37 °C.
Flow cytometry analysis
Cells were prepared as above and subjected to analysis by BD FACSCanto-II Cytometer. BD FACSDiva software was used for both data acquisition and analysis. All events were plotted on an FSC-A vs SSC-A bivariate pseudocolor dot plot to exclude debris and to gate on healthy cells (P1 gate). Doublet discrimination was performed hierarchically on P1 population by first plotting SSC-W vs SSC-H followed by FSC-W vs FSC-H. Single cells were then analyzed for citrine expression by plotting Citrine area signal (log scale) against autofluorescence (log scale). Positive control was utilized to set the threshold for gating Citrine+ population. Percentages of Citrine+ cells along with the mean and median fluorescence intensities (MFIs) for Citrine+ population were analyzed. The mean fluorescence intensity per cell was used as the data point. A sample workflow is shown in Supplementary Fig. 4.
Extended Data
Extended Data Fig 1. Evaluation of the effects of protein domain on condensate formation in cell.
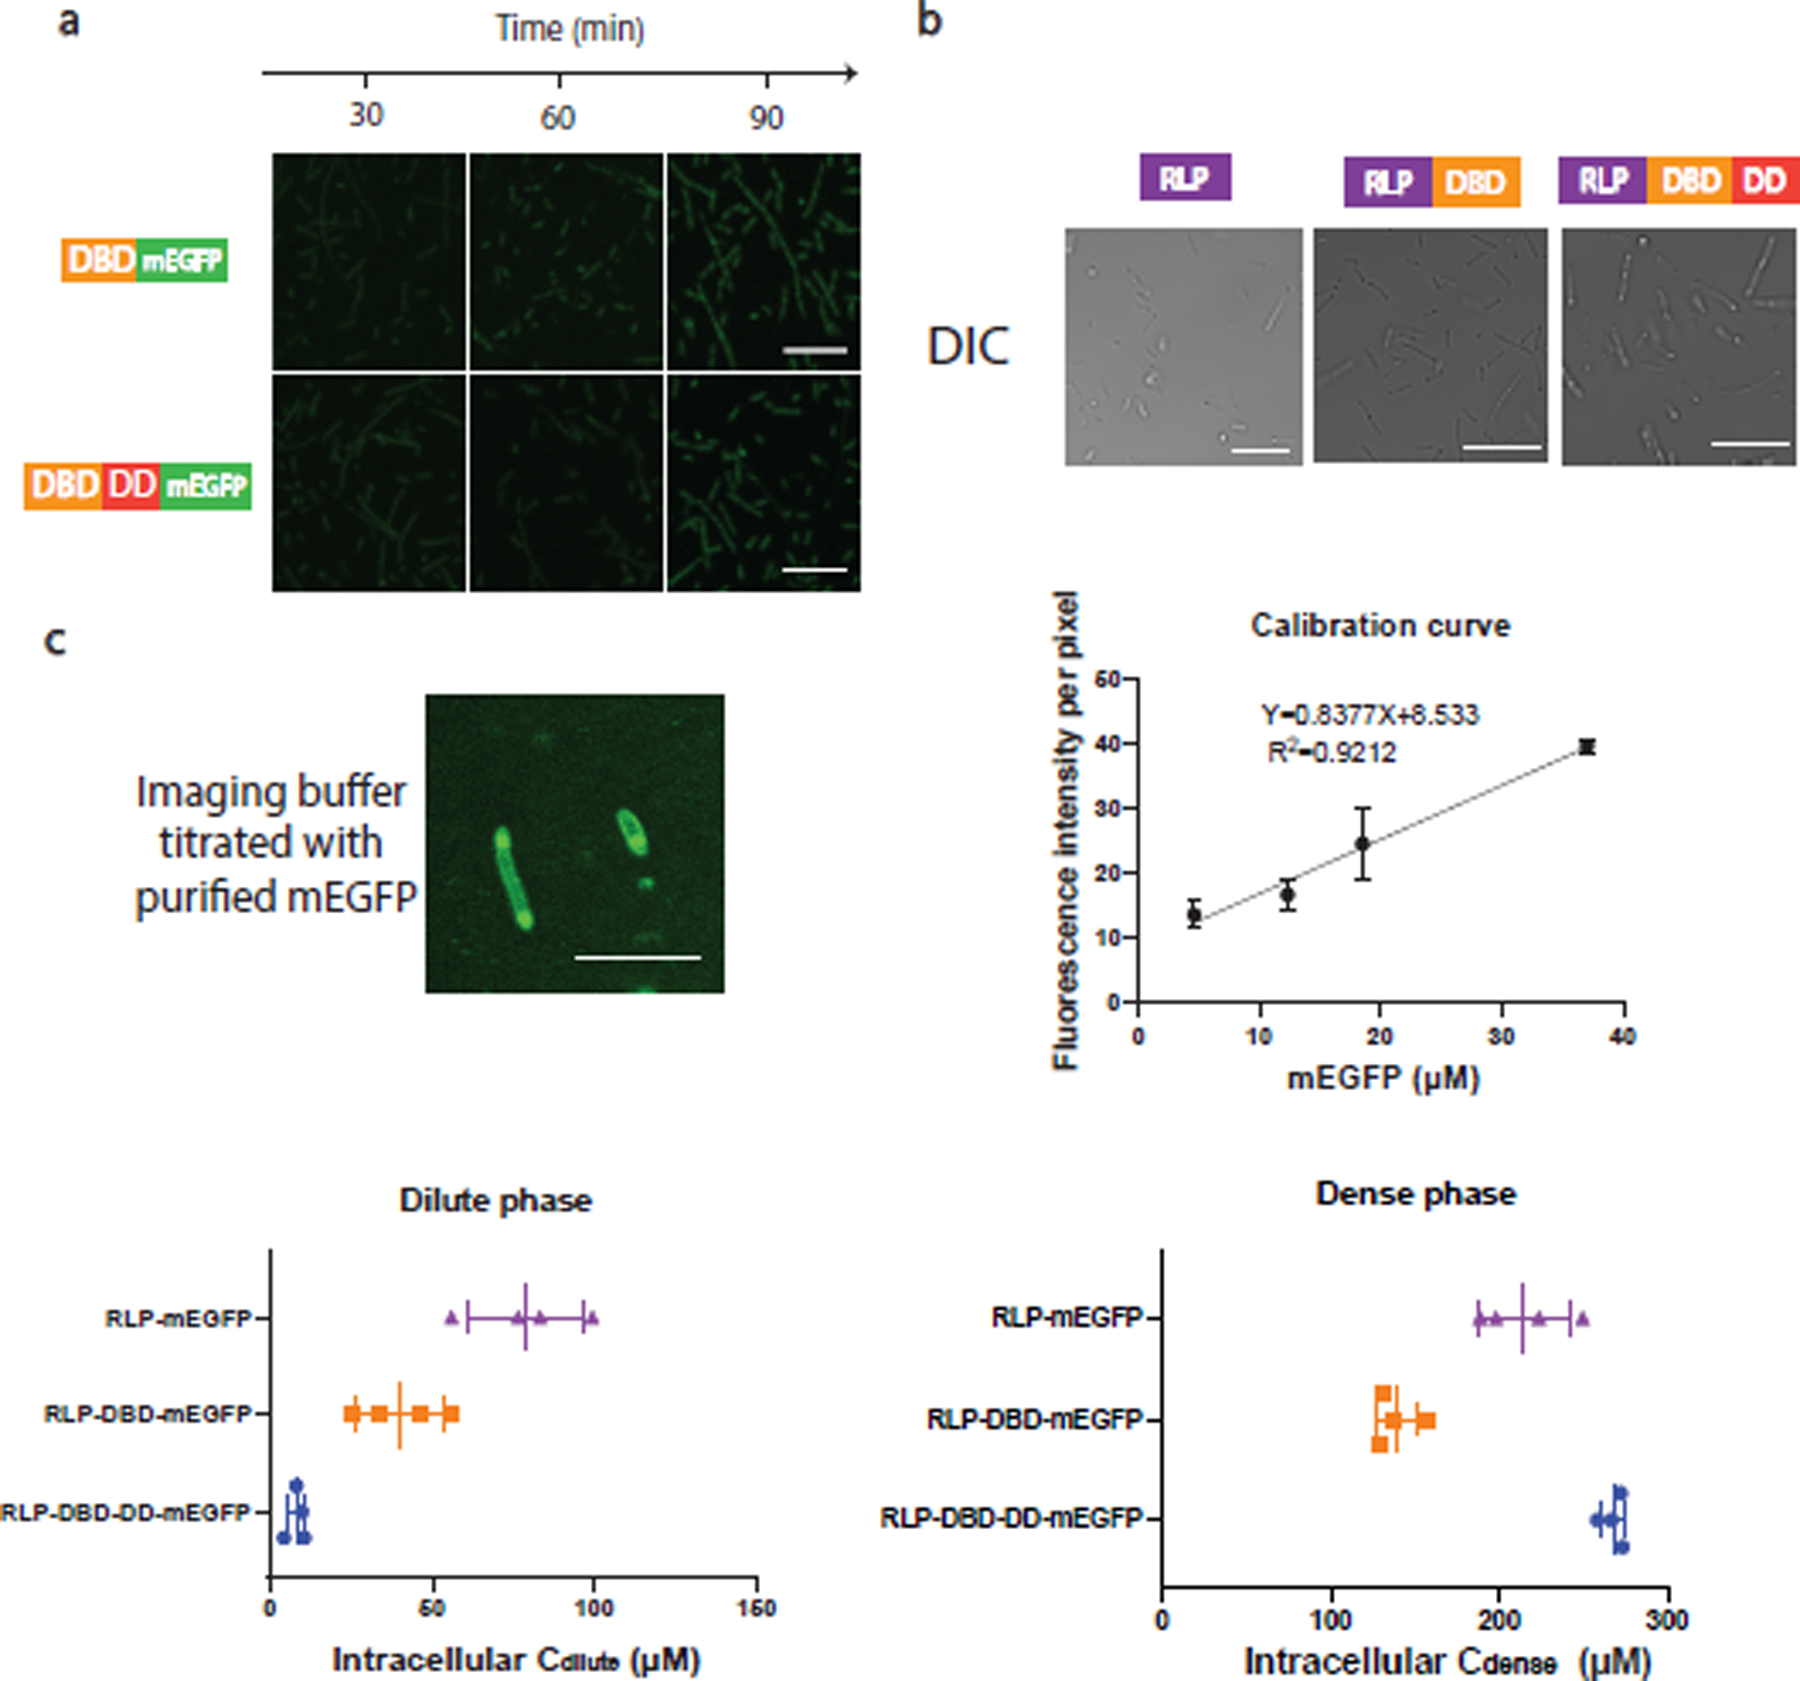
a, Confocal fluorescence images of cells containing dParB DNA binding domain (DBD) (126–254)-mEGFP fusion and dParB DNA binding domain and dimerization domain (DBD-DD) (126–304)-mEGFP fusion. Neither of the constructs were able to show distinct puncta in cell. n=3 independent biological repeats with similar results. Scale bar is 10 μm.
b, Confocal differential interference channel (DIC) images for the evaluations of condensate formation in cells containing constructs expressing RLPWT, RLPWT-DBD, RLPWT-DBD-DD after 1 h of induction. n=3 independent biological repeats with similar results.
c, Estimation of intracellular protein concentrations by purified mEGFP protein. To establish a calibration curve, different concentrations of purified mEGFP protein were titrated into the cellular sample as shown in the top left panel to obtain an accurate calibration at the imaging Z coordinate. Because of the significant difference between the dense phase and the dilute phase, to prevent oversaturation of fluorescence signal while capable of obtaining accurate fluorescence intensity measurement, the energy of the WLL laser, the percentage of the intensity of the excitation laser, the detector range and pin hole size were tuned to cover the fluorescence signal of the dense and the dilute phase. If the dense phase signal is oversaturated or the dilute phase signal is similar to the non-fluorescence background sample, then the tuning process would start again until the range is covered. The background fluorescence intensity per pixel was analyzed by LAS X built-in module. The fluorescence intensity corresponding to different concentrations of purified mEGFP was utilized to construct the calibration curve (top right panel), which is utilized to estimate the intracellular protein concentration. The estimated intracellular dilute and dense phase concentration are shown in the bottom panel. Scale bar is 2.5 μm. n = 4 biologically independent samples. Error bar represents standard deviation.
Extended Data Fig 2. Phase separation assay investigations of resilin-like polypeptide in response to various biochemical conditions.
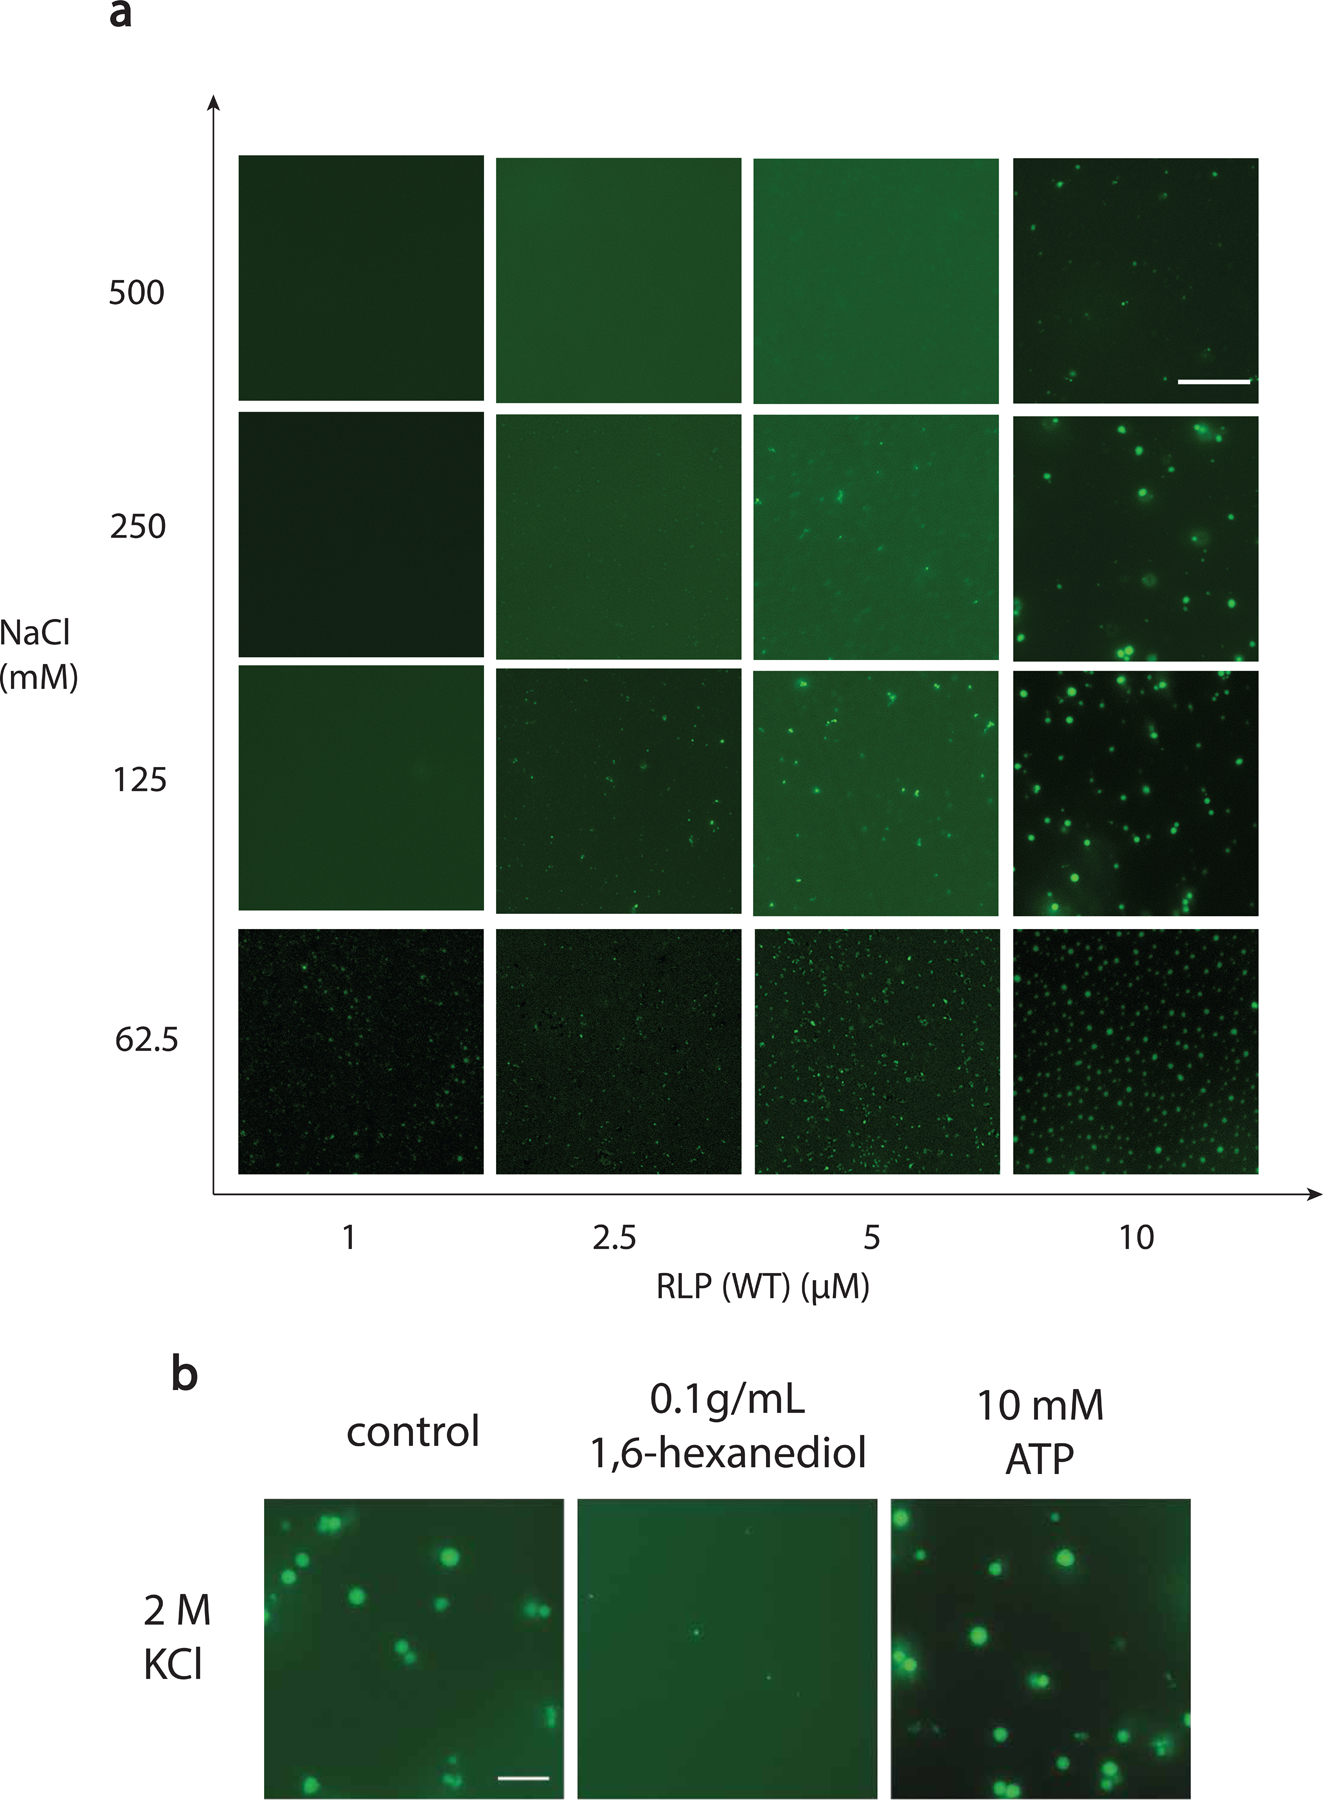
a, Salt-dependent and concentration-dependent formation of condensate based on different concentrations of RLPWT ([GRGDSPYS]20) (with 10% RLPWT-sfGFP) in 50 mM Tris with different concentrations of NaCl at pH 7.2, confirming its salt-sensitivity and the contribution of electrostatic interaction in condensate formation. Scale bar is 10 μm. n=3 independent biological repeats with similar results.
b, Evaluation of responsive phase behavior using 5 μM of RLPWT ([GRGDSPYS]20) (with 10% RLPWT-sfGFP) in 50 mM Tris and 2M KCl at pH 7.2. Reentrant condensate formation at high-salt condition using 2M KCl, indicating the contribution of hydrophobic residues to the condensate formation. Treating the condensate with hydrophobic molecule 1,6-hexanediol, which is known to disrupt non-ionic interactions in condensate74, dissolves the condensate. In the meantime, treating the condensate with adenosine triphosphate (ATP), which is known to disrupt electrostatic interaction in the condensate, shows no effect on condensate integrity. The above results confirmed the contributions of non-ionic residues to condensate stability. Overall, the biochemical tests demonstrated that synIDPs can also be modulated by various biochemical cues just as its native orthologs. Scale bar is 10 μm. n=3 independent biological repeats with similar results.
Extended Data Fig 3. Characterization of rationally designed synIDPs based on modifications of the WT RLP sequence [GRGDSPYS]20 using sedimentation assay and fluorescent recovery after photobleaching.
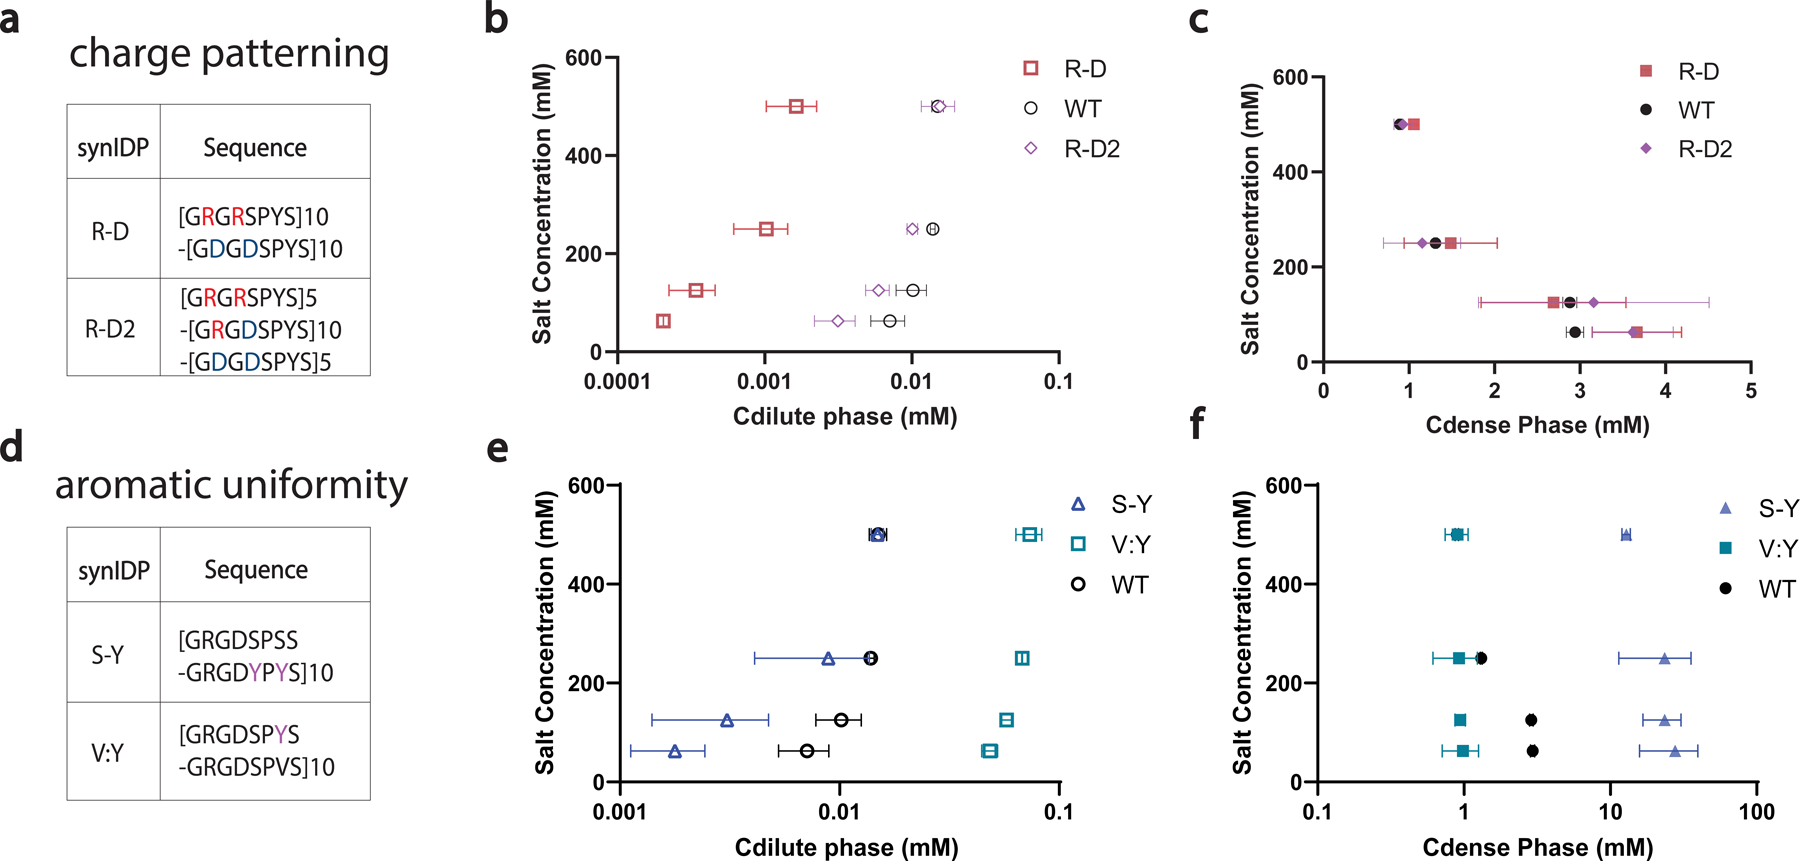
a, Designs of synIDPs by repatterning the charge residues.20 Charged residues are segregated into individual repetitive motif as shown in the sequences GRGRSPYS/GDGDSPYS.
b, c, Sedimentation assay evaluation of the dilute phase concentration(Cdilute) and the dense phase concentration (Cdense) of the designed synIDPs. The segregation of charged residues increases the phase separation propensity with lowered left binodal; in the meantime, no significant change of the dense phase concentration was observed. Above results suggested that enhanced electrostatic interaction by segregation of the oppositely charged residues in a zwitterionic IDP can promote phase separation propensity.
d, Designs of synIDPs by varying the uniformity and the quantity of the aromatic residues23,24. For changing the uniformity of the aromatic residues, tyrosine (Y) residues are clustered into a single motif by exchanging with the spacer residue serine (S) as shown in the sequences GRGDSPSS/GRGDYPYS. For reducing the number of aromatic residues, 50% of tyrosine is substituted by valine (V).
e, f, Evaluation of the dilute phase concentration (Cdilute) and the dense phase concentration (Cdense) of the designed IDPs by sedimentation assay. Cluster of aromatic residues enhances both phase separation propensity and the dense phase concentration. Decreasing the number of tyrosine residues decreases both phase separation propensity and the dense phase concentration. Above results demonstrated that pi-based interactions can modulate both phase separation propensity and dense phase property. n=3 different experiments. Mean ± SD.
Extended Data Fig 4. FRAP and computational analysis of condensates formed by synIDPs.
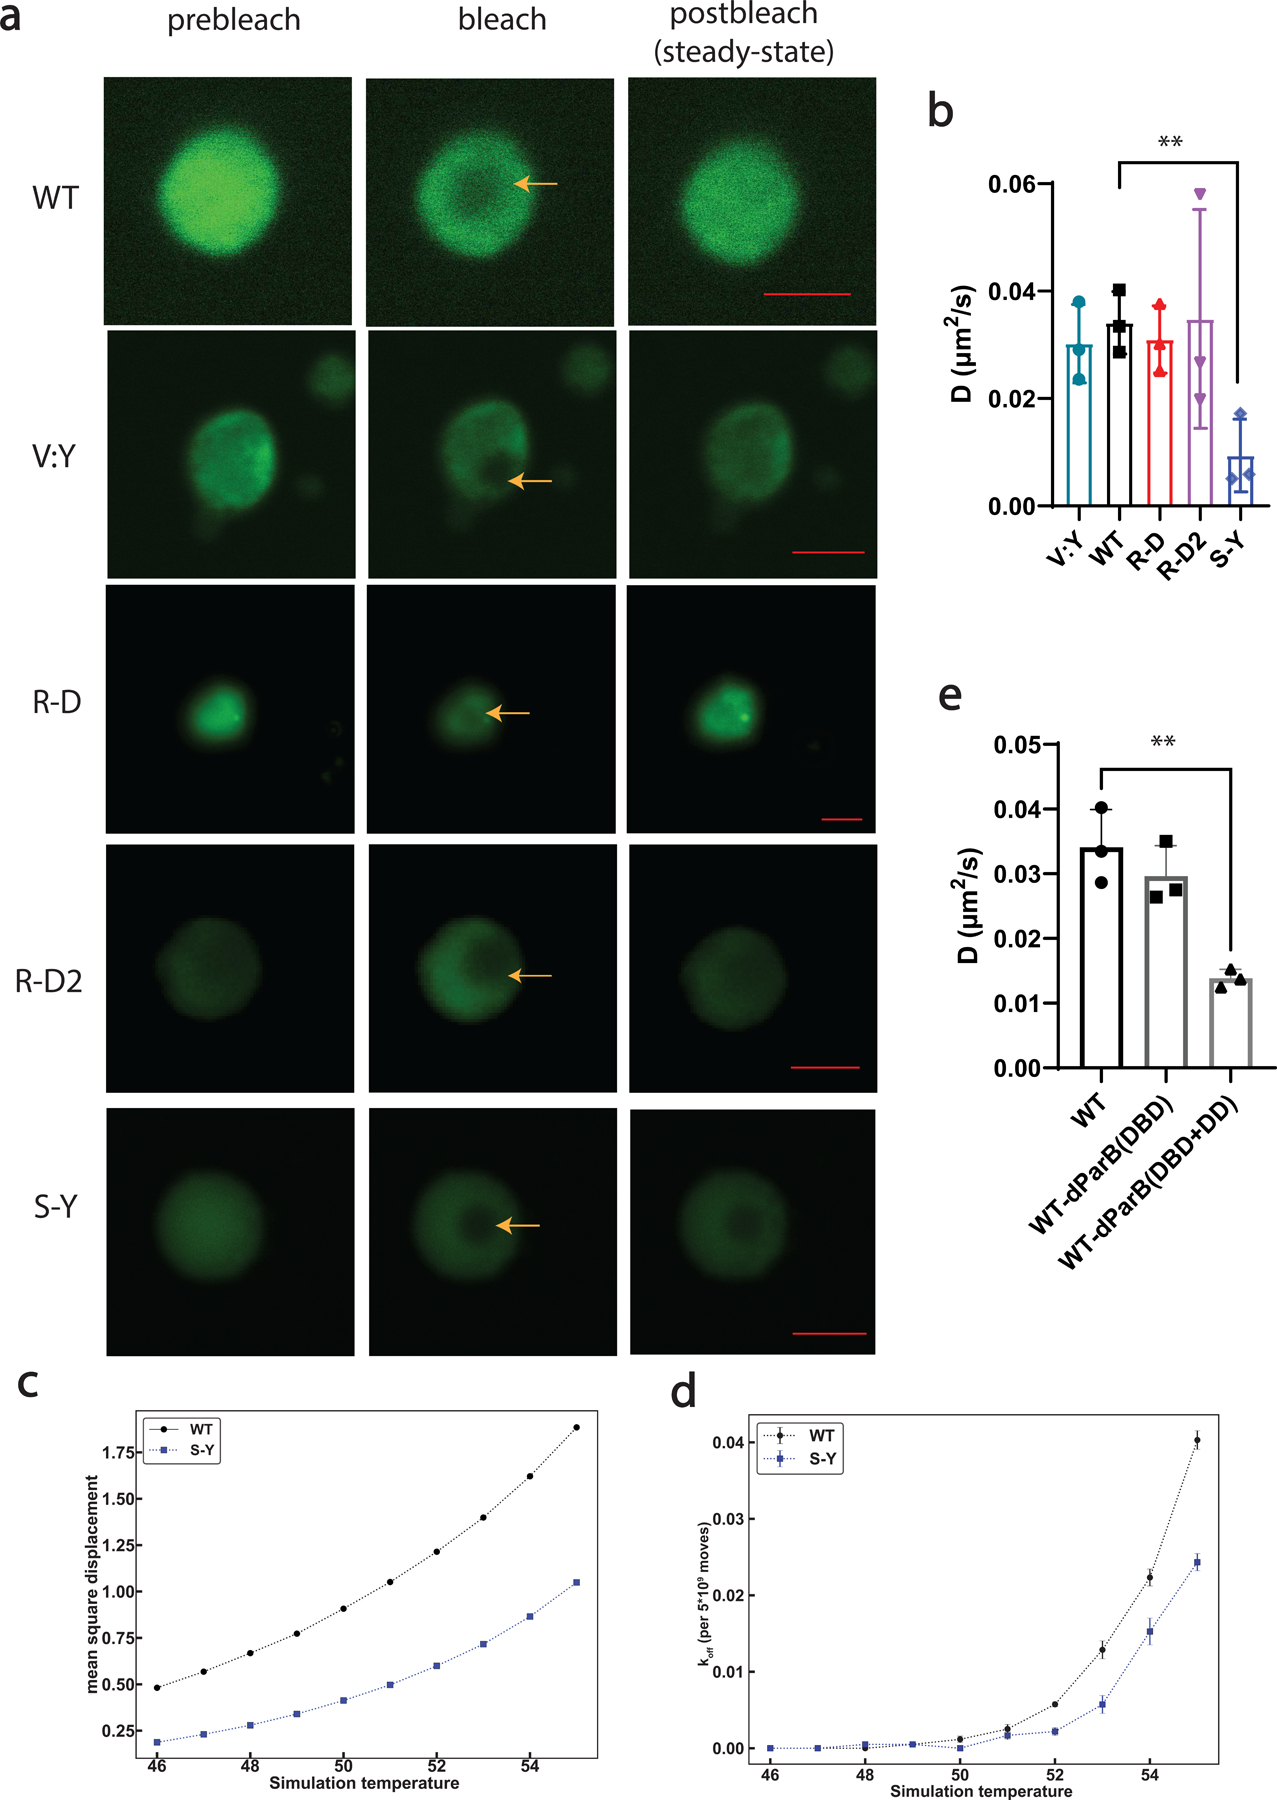
Proteins was prepared at 50 µM (in buffer containing 50 mM Tris, 125 mM NaCl, pH 7.2) to ensure all the samples have visible condensates.
a, FRAP images and recovery curves of condensates formed by different types of synIDPs (doped with 10% of sfGFP labeled IDPs). Scale bar is 5 μm.
b, Comparison of derived apparent diffusion coefficients of condensates formed by different artificial IDPs based on recovery curve fitted by single exponential fitting equation and the corresponding bleaching area75.
c, Mean square displacement (MSD) values of chains in WT (black) or S-Y (blue) condensates. MSD values are in square lattice units per total system Monte Carlo moves. Standard errors from the mean across 5 independent simulations are smaller than the marker sizes.
d, Evaluation of the likelihood for a chain to exit the condensates after Monte Carlo moves by comparing the amounts of chain still in the condensates with the amounts of chain moving out of the condensates.
e, Comparison of derived apparent diffusion coefficients of condensates formed by different protein components. n = 3 independent experiments. Bar graph represents mean ± SD. *, p<0.025; **, p<0.006 by a two-tailed unpair t-test.
Extended Data Fig 5. Evaluation of heterotypic driving force on the formation of DNA condensate and the partition of RNAP into the DNA condensate.
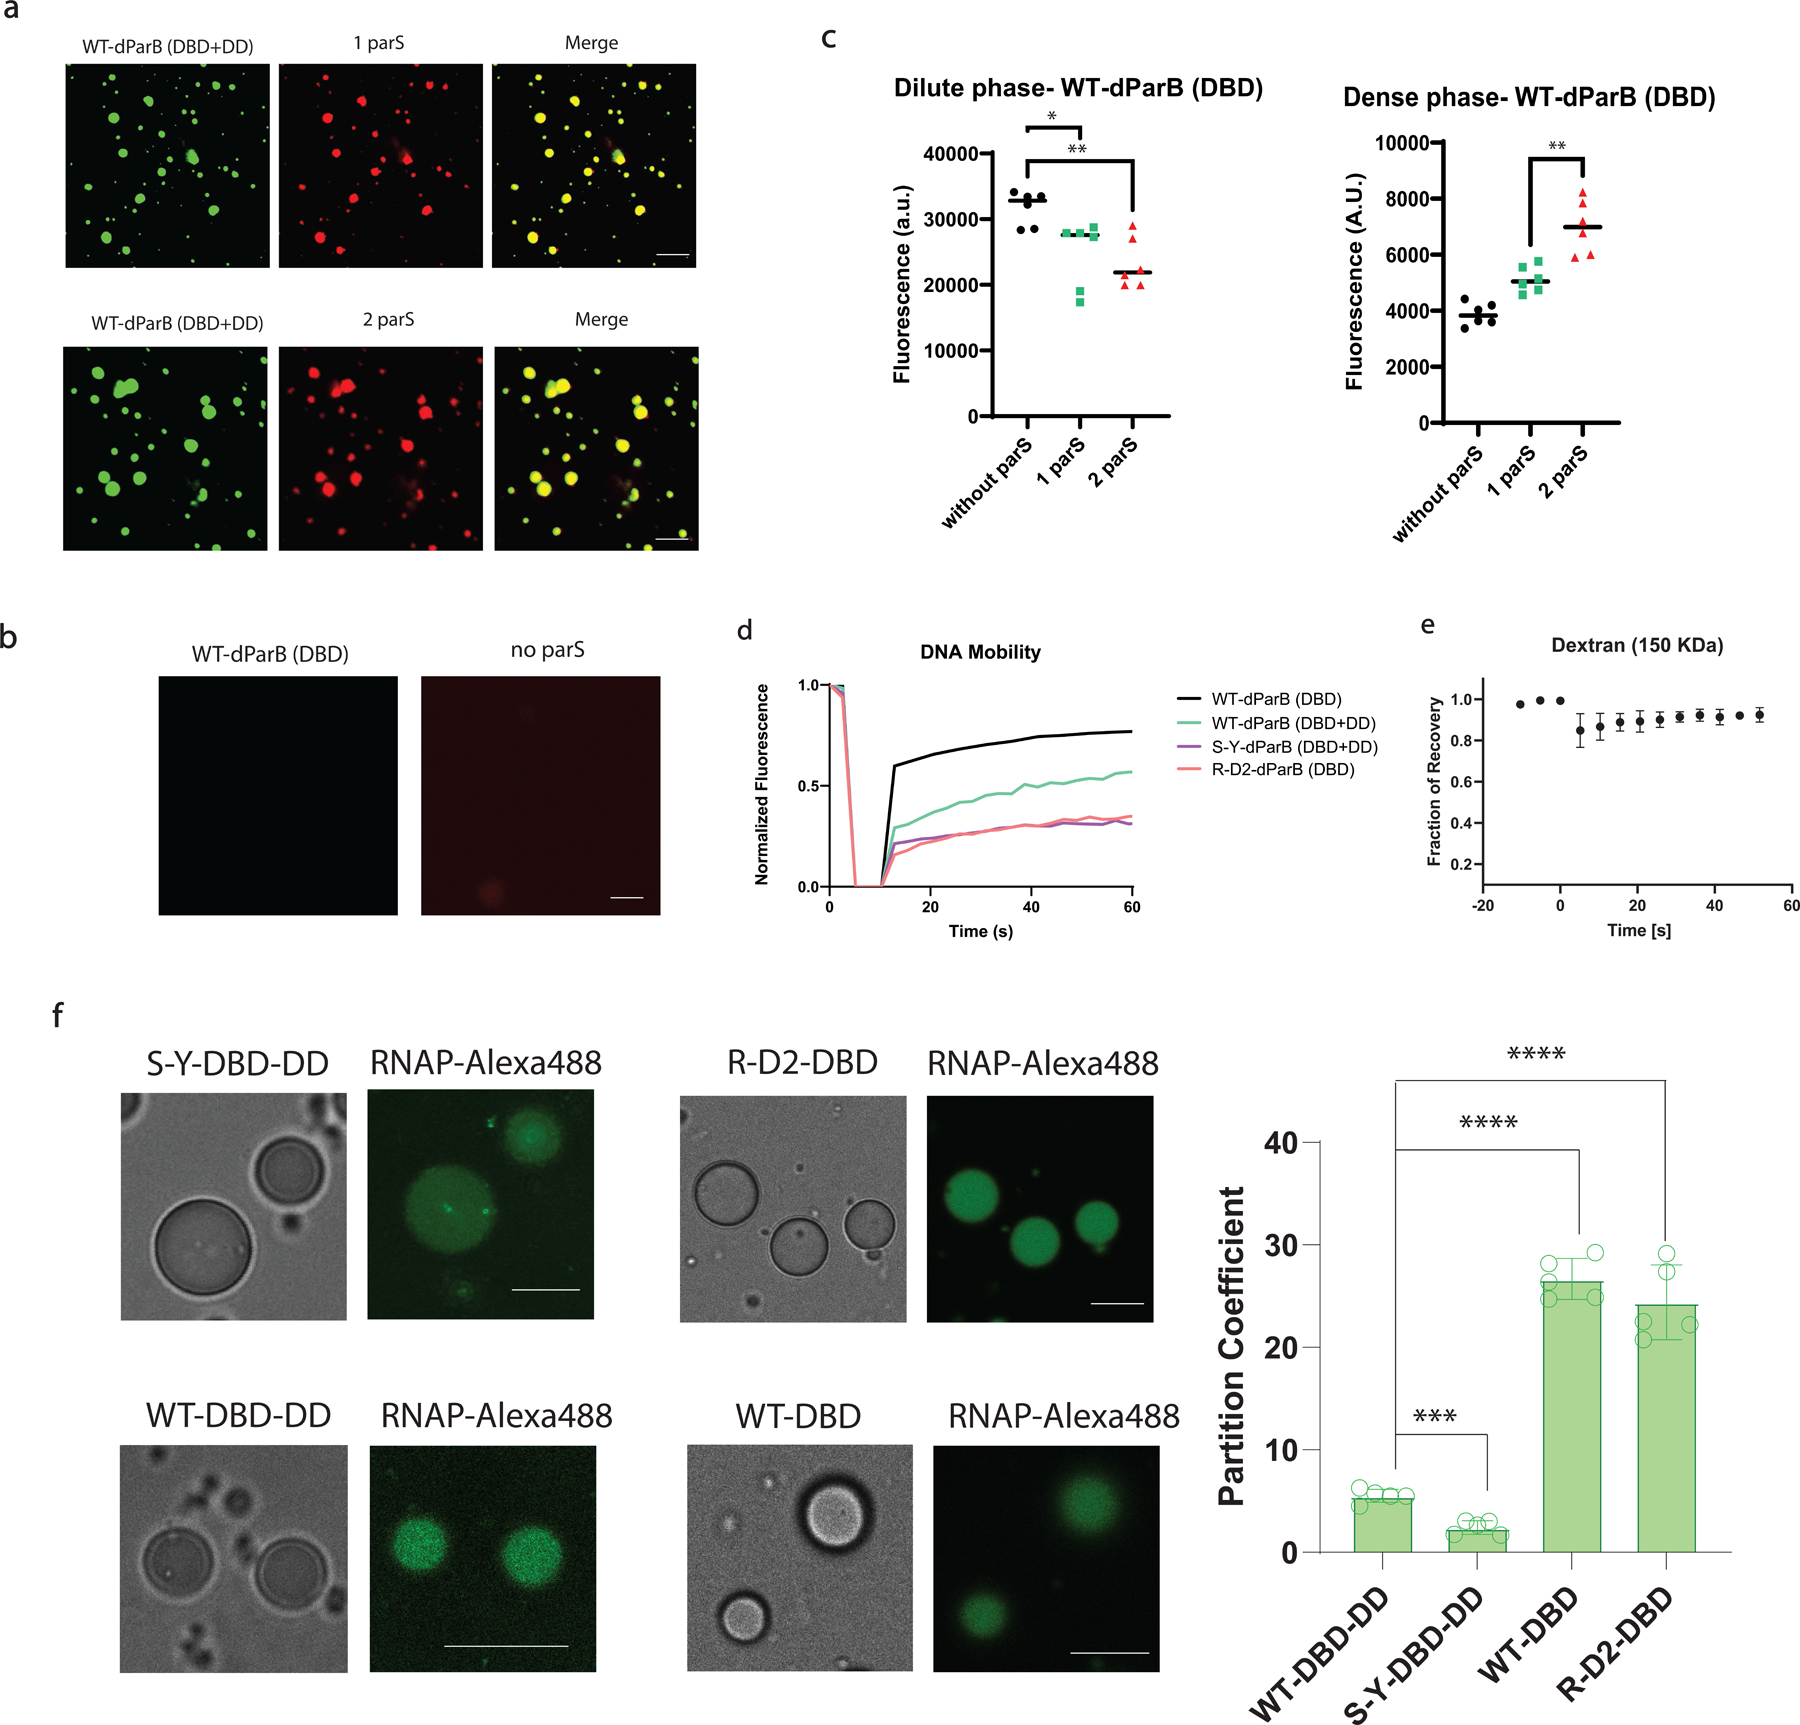
a, DNA condensate constituted by 500 nM of RLPWT-DBD-DD (doped with 10% RLPWT-DBD-DD -sfGFP) and 25 nM cy3-DNA containing one or two parS sites. Scale bar is 10 μm.
b, Mixture of 500 nM of RLPWT-DBD (doped with 10% RLPWT-DBD-sfGFP) and 25 nM cy3-DNA containing no parS site did not result the formation of condensate. Scale bar is 10 μm.
c, Fluorescence based sedimentation assay measurements of the dilute/dense phase concentrations of RLPWT-DBD (doped with 10% RLPWT-DBD-sfGFP) in the presence of 25 nM DNA with different number of parS binding sites. For measuring the dilute phase, the fluorescence was directly quantified from the supernatant after sedimentation (see Supplementary Methods). For measuring the dense phase, 1 µL of the dense phase was extracted and dissolved into 49 µL buffer before taking the measurements. n=6 independent experiments. *, p=0.0134; **, p=0.0012; **, p=0.0015 by a two-tailed unpair t-test. Error bar represents standard deviation.
d, Normalized fluorescence recovery curve of DNA channel based on the DNA condensate formed by different components. For evaluation of the mobility of cy3-DNA, the protein component was not doped with sfGFP labeled protein.
e, Normalized fluorescence recovery curve of Dextran (150 KDa) channel based on the DNA condensate formed in Fig 3g. n=3 independent experiments. Data point represents mean ± SD.
f, Evaluation of partition coefficient of Alexa488-labeled T7 RNAP into different DNA condensates containing 1 µM of RLP-dParB and 25 nM of DNA containing one parS site. n=5 independent experiments. Bar graph represents mean ± SD. ****, p<0.0001; ***, p<0.0005 by a two-tailed unpair t-test
Extended Data Fig 6. Evaluation of condensate mediated plasmid partition.
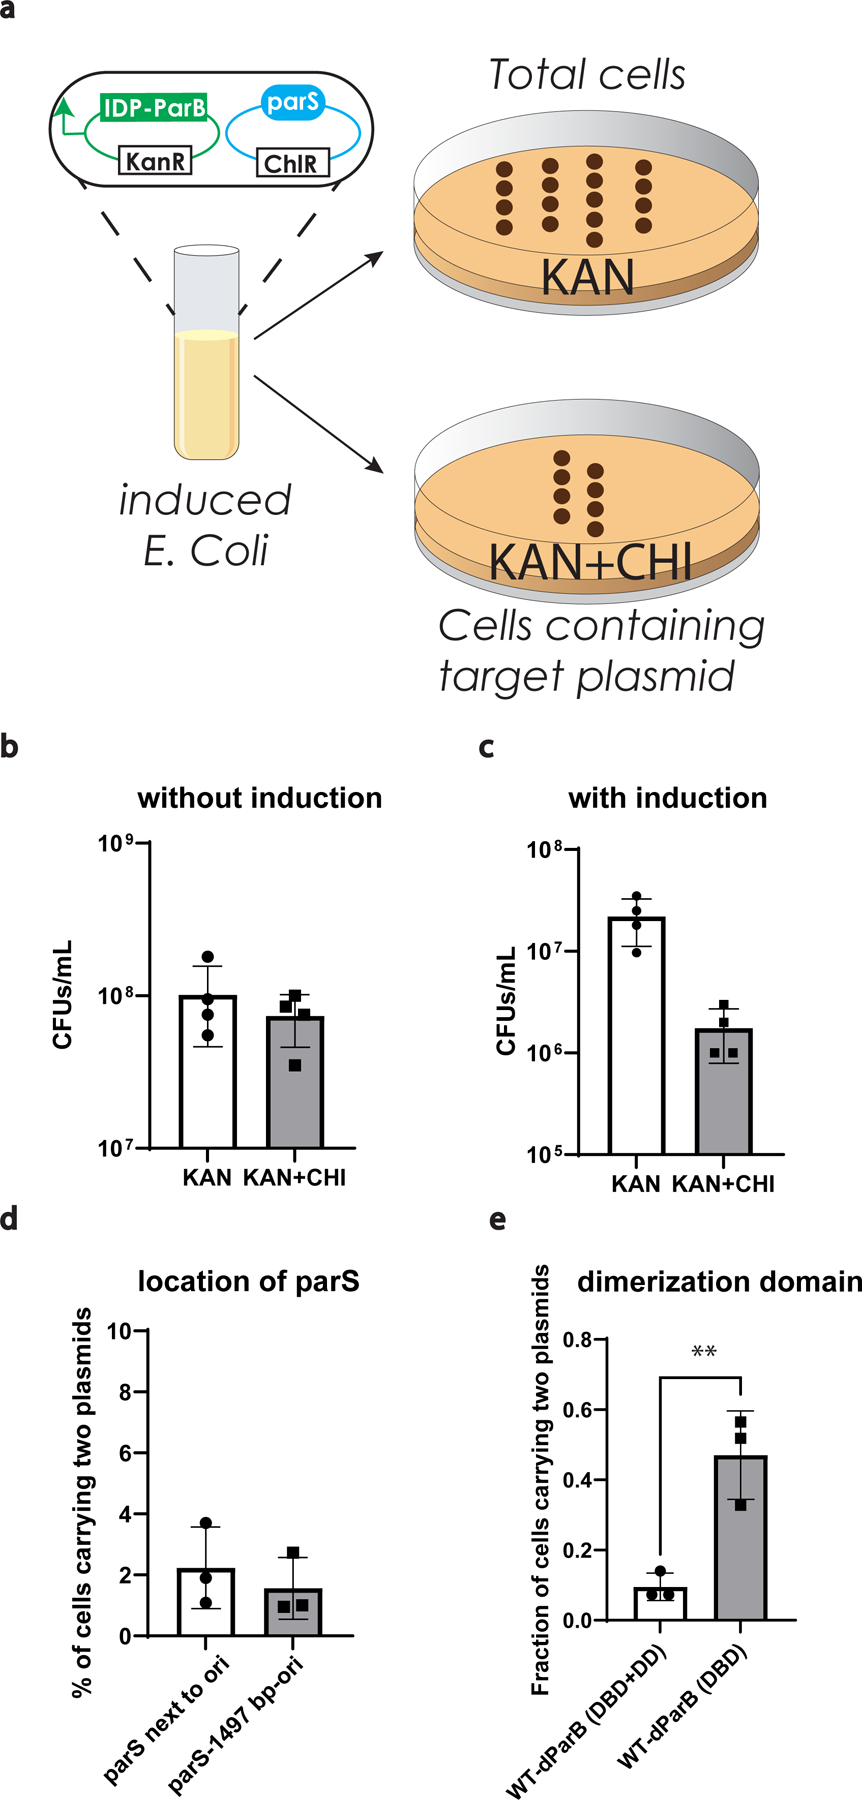
a, Experimental procedure to measure plasmid loss.
b, c, Evaluation of change of total cell counts based on different testing conditions under the selection of kanamycin or kanamycin and chloramphenicol after 5 h of growth with/without induction. n=4 biologically independent samples. Bar graph represents mean ± SD.
d, Comparison of change of fraction of cells carrying both plasmids based on the location of the parS site after 5 h of induction with 0.5 mM IPTG. n=3 biologically independent samples. Bar graph represents mean ± SD.
e, Evaluation of the contribution of dimerization domain on modulating the fraction of cells carrying two plasmids after 90 min of induction with 0.5 mM IPTG. n=3 biologically independent samples. **, p=0.0079 by a two-tailed unpair t-test. Bar graph represents mean ± SD.
Extended Data Fig. 7. Modulation of cellular functions using synIDPs with different phase behaviors.
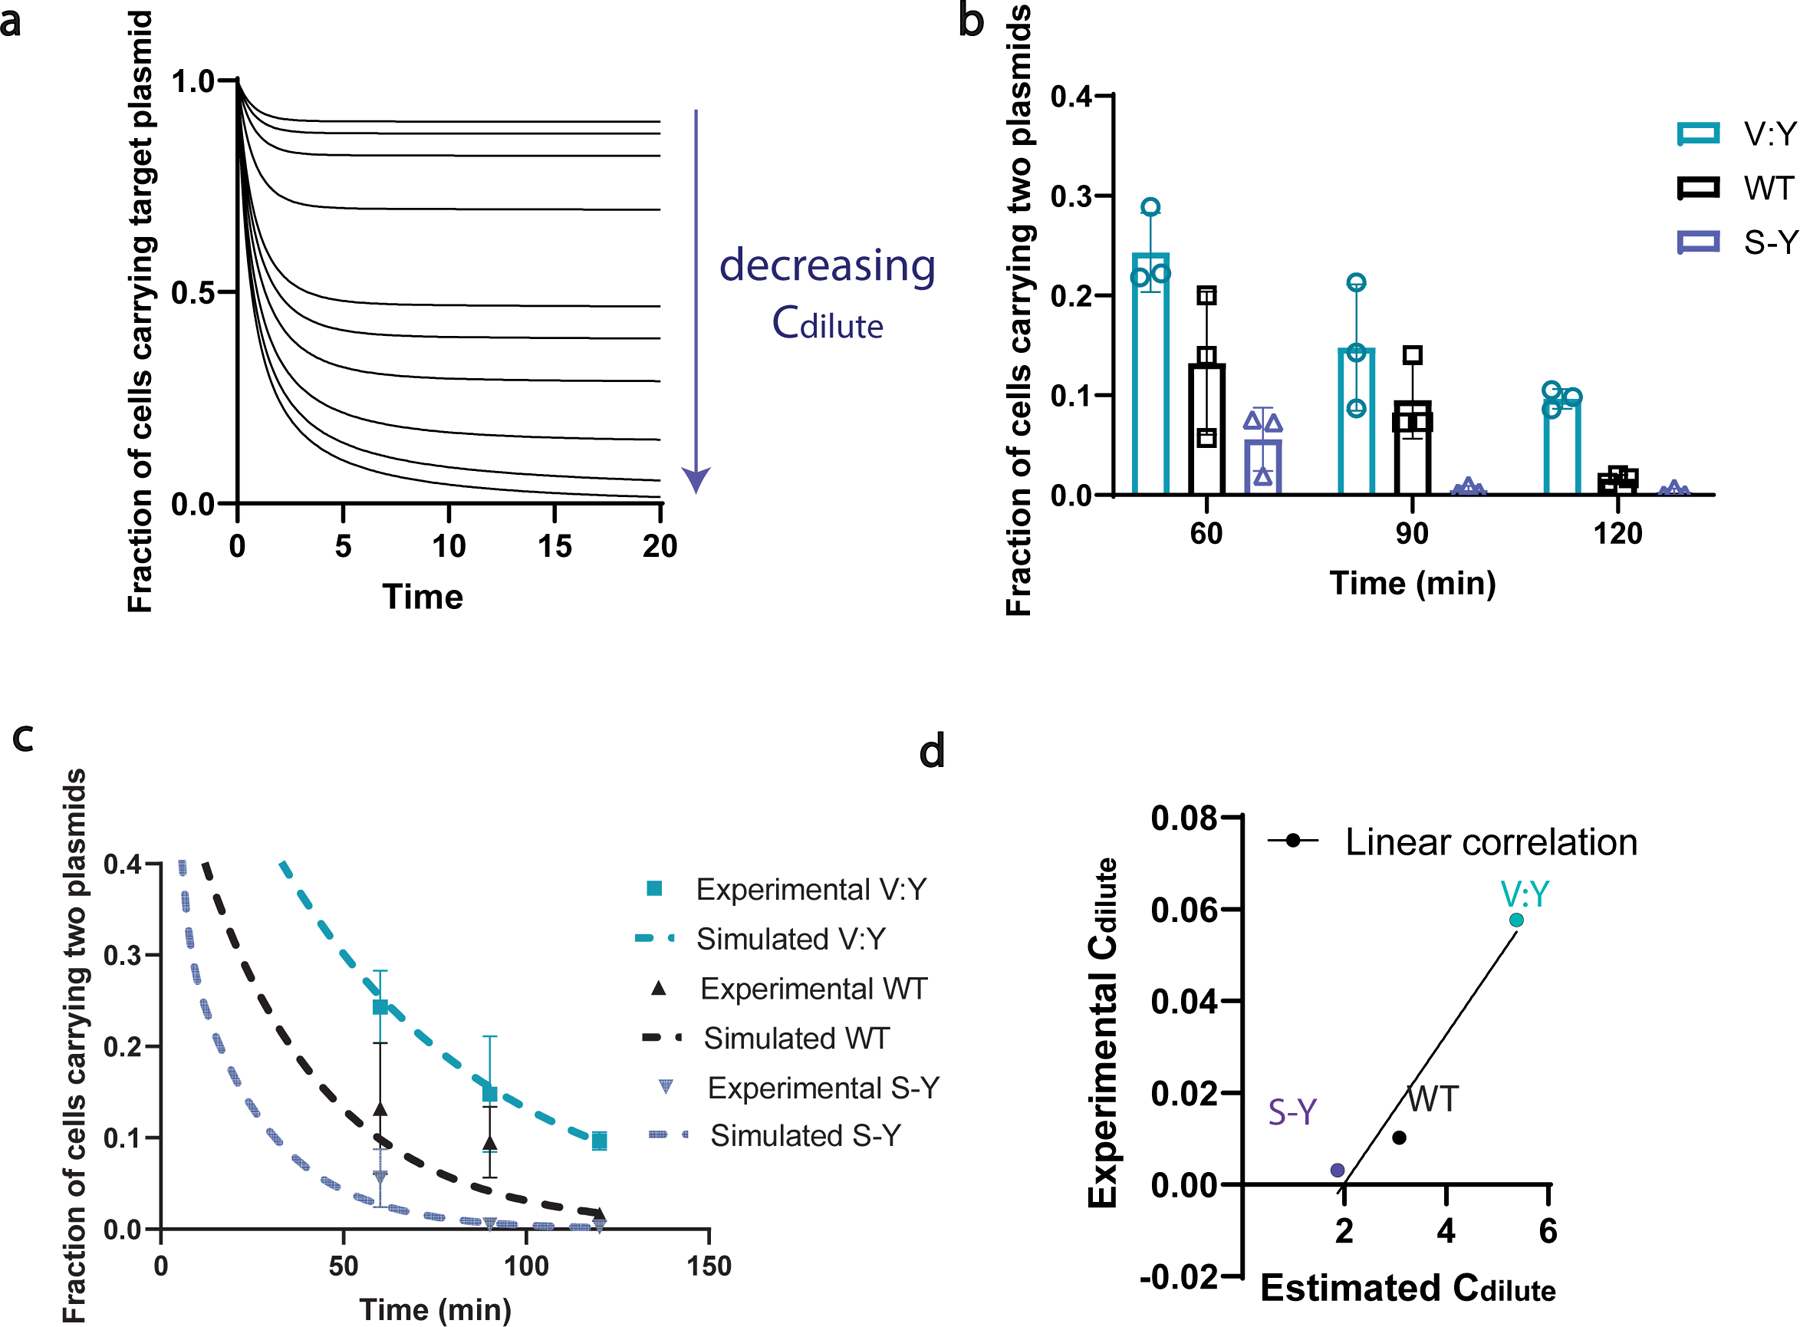
a, Computational simulation demonstrates the influences of the critical concentration of phase separation on plasmid partition efficiency. Enhancing plasmid partition follows the trend of decreasing critical concentration for phase separation.
b, Effects of different synIDP-DBD-DD constructs on asymmetric plasmid partition at different time points after induction with IPTG induction level at 0.1 mM IPTG and 0.2 % arabinose by evaluating the fraction of progenitor cells (the amount of cells carries both plasmids). n=3 biologically independent samples. Bar graph represents mean ± SD.
c, Experimental data fitted ODE models of different synIDP-DBD-DD constructs on asymmetric plasmid partition at different time points after induction with IPTG induction level at 0.1 mM IPTG and 0.2 % arabinose. n=3 biologically independent samples.
d, Correlation between experimental evaluated biochemical property of IDP (concentration at dilute phase) and simulated β value (an artificial value indicating the effects of phase separation on asymmetric plasmid partition). Black line is the linear fit of the data with an R-square value of 0.846.
Extended Data Fig. 8. Evaluation of phase separation on modulating protein activity in mammalian cells.
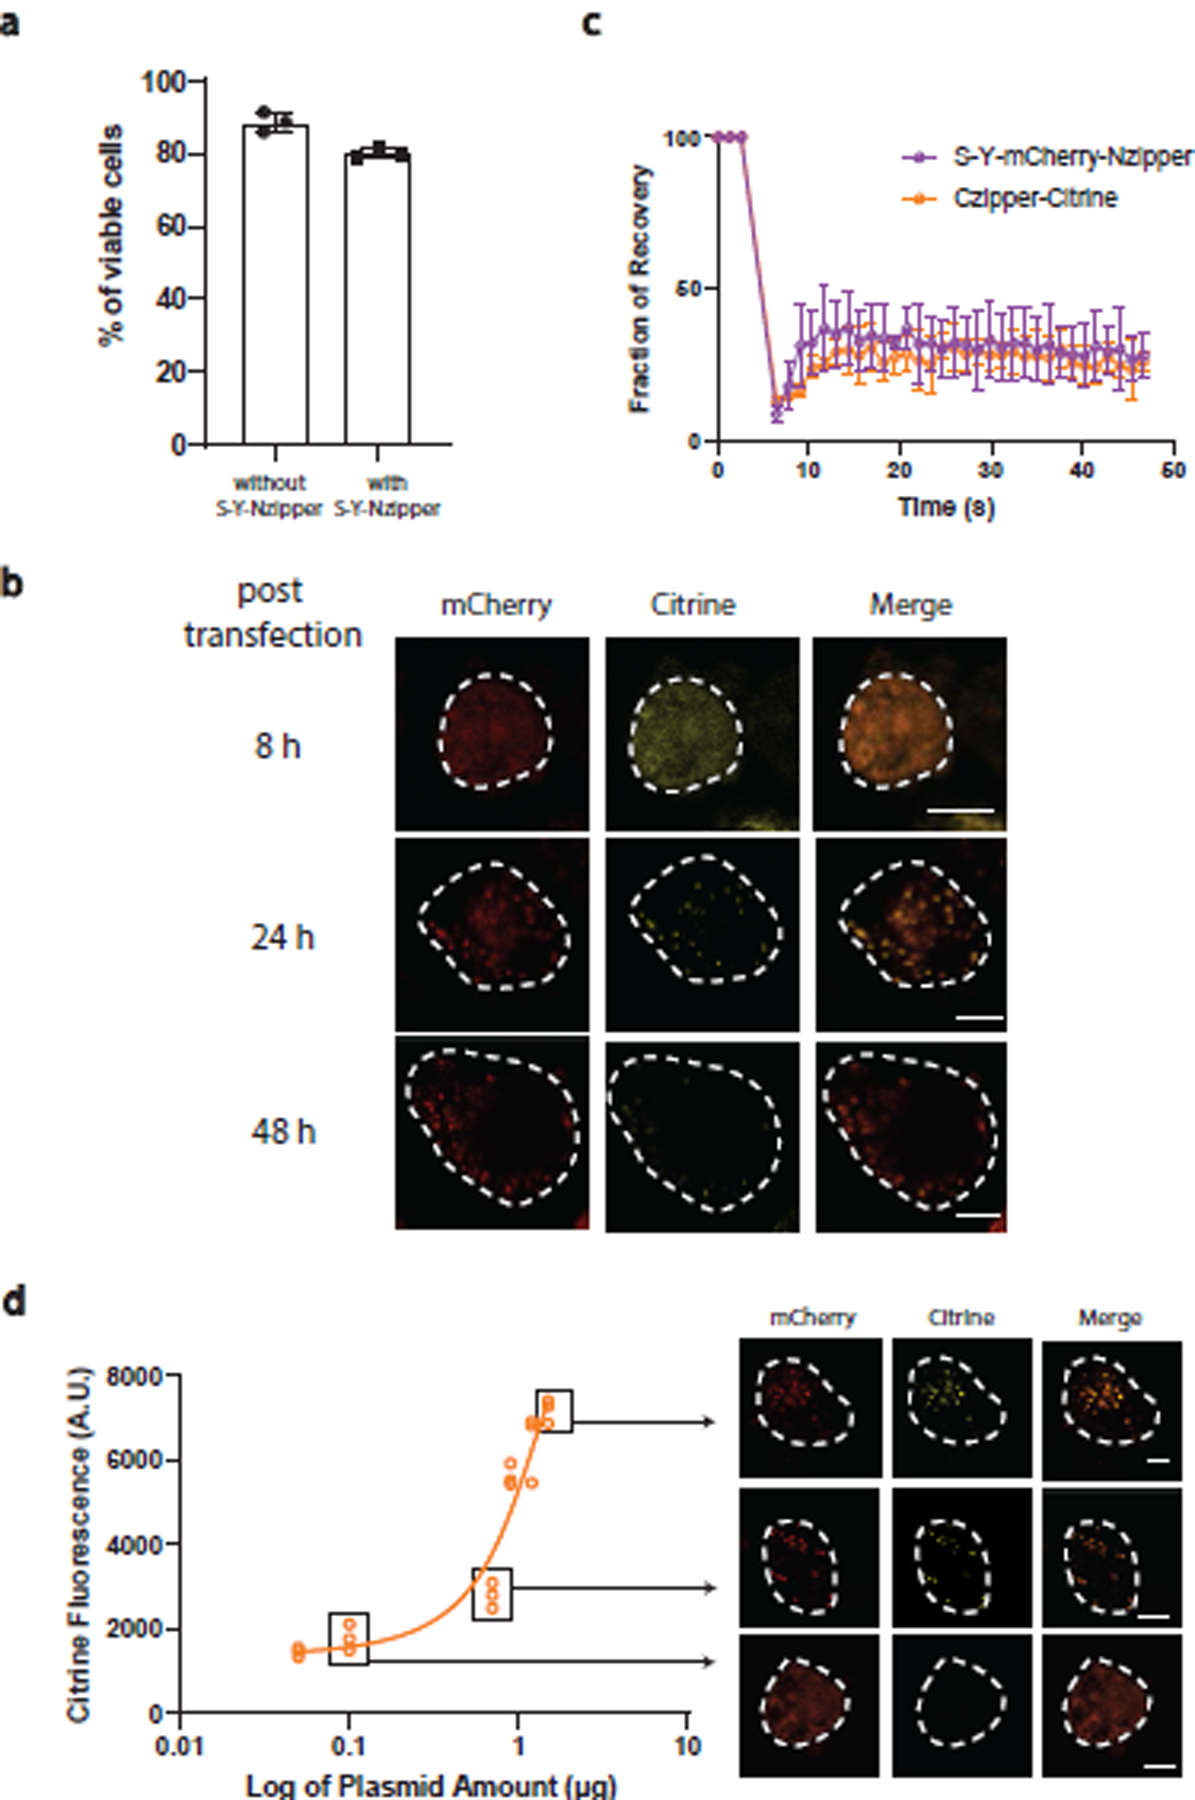
a, Evaluation of cell viability with or without the transfection of plasmid containing RLPS-Y-Nzipper after 48 h of transfection. n=3 biologically independent samples. Bar graph represents mean ± SD.
b, Time-dependent formation of synthetic condensates and recruitment of reporter protein.
c, FRAP analysis of RLPS-Y-mCherry-Nzipper and Czipper-Citrine-DHFR within condensates in HEK293 cells. n=3 independent experiments. Data point represents mean ± SD.
d, Dose-dependent modulation of protein activity. Cells was transfected with different amounts of plasmid containing RLPS-Y-mCherry-Nzipper and 0.5 µg of plasmid containing Czipper-Citrine-DHFR. Right panel shows representative confocal images after 48 h of transfection.
Supplementary Material
ACKNOWLEDGEMENTS
We thank Duke Light Microscopy core facility for experimental support. We are grateful to T. Wang at Duke University, and C. Roden and A. Gladfelter at UNC Chapel Hill for helpful discussions. J.S. acknowledges the support of the NSF through a graduate research fellowship (DGE-2139754). This work was supported by the Air Force Office of Scientific Research (FA9550-20-1-0241 to L.Y, A.C, R.V.P.) and by the NIH (MIRA R35GM127042 to A.C.; R01EB029466 to L.Y.)
Footnotes
Code availability
The simulation and data analysis codes used in this study are deposited at GitHub at https://github.com/youlab/Programmable-Synthetic-Condensates and https://github.com/Pappulab/LASSI
COMPETING INTERESTS STATEMENT
The authors declare no competing interesting for this work.
Data availability
All data supporting the findings of this work are provided within the manuscript and its related source data.
REFERENCES
- 1.Brangwynne CP et al. Germline P Granules Are Liquid Droplets That Localize by Controlled Dissolution/Condensation. Science 324, 1729–1732 (2009). [DOI] [PubMed] [Google Scholar]
- 2.Molliex A et al. Phase Separation by Low Complexity Domains Promotes Stress Granule Assembly and Drives Pathological Fibrillization. Cell 163, 123–133 (2015). [DOI] [PMC free article] [PubMed] [Google Scholar]
- 3.Lyon AS, Peeples WB & Rosen MK A framework for understanding the functions of biomolecular condensates across scales. Nature Reviews Molecular Cell Biology 22, 215–235 (2021). [DOI] [PMC free article] [PubMed] [Google Scholar]
- 4.Tsang B, Pritišanac I, Scherer SW, Moses AM & Forman-Kay JD Phase Separation as a Missing Mechanism for Interpretation of Disease Mutations. Cell 183, 1742–1756 (2020). [DOI] [PubMed] [Google Scholar]
- 5.Roden Christine A. et al. Double-stranded RNA drives SARS-CoV-2 nucleocapsid protein to undergo phase separation at specific temperatures. Nucleic Acids Research 50, 8168–8192 (2022). [DOI] [PMC free article] [PubMed] [Google Scholar]
- 6.Roden C & Gladfelter AS RNA contributions to the form and function of biomolecular condensates. Nature Reviews Molecular Cell Biology 22, 183–195 (2021). [DOI] [PMC free article] [PubMed] [Google Scholar]
- 7.Garabedian MV et al. Designer membraneless organelles sequester native factors for control of cell behavior. Nature Chemical Biology (2021). [DOI] [PMC free article] [PubMed]
- 8.Reinkemeier CD, Girona GE & Lemke EA Designer membraneless organelles enable codon reassignment of selected mRNAs in eukaryotes. Science 363, eaaw2644 (2019). [DOI] [PMC free article] [PubMed] [Google Scholar]
- 9.Zhao EM et al. Light-based control of metabolic flux through assembly of synthetic organelles. Nature Chemical Biology 15, 589–597 (2019). [DOI] [PMC free article] [PubMed] [Google Scholar]
- 10.Das RK & Pappu RV Conformations of intrinsically disordered proteins are influenced by linear sequence distributions of oppositely charged residues. Proceedings of the National Academy of Sciences 110, 13392–13397 (2013). [DOI] [PMC free article] [PubMed] [Google Scholar]
- 11.Wei M-T et al. Phase behaviour of disordered proteins underlying low density and high permeability of liquid organelles. Nature Chemistry 9, 1118–1125 (2017). [DOI] [PMC free article] [PubMed] [Google Scholar]
- 12.Wang J et al. A Molecular Grammar Governing the Driving Forces for Phase Separation of Prion-like RNA Binding Proteins. Cell 174, 688–699.e16 (2018). [DOI] [PMC free article] [PubMed] [Google Scholar]
- 13.Martin EW et al. Valence and patterning of aromatic residues determine the phase behavior of prion-like domains. Science 367, 694–699 (2020). [DOI] [PMC free article] [PubMed] [Google Scholar]
- 14.Bremer A et al. Deciphering how naturally occurring sequence features impact the phase behaviours of disordered prion-like domains. Nature Chemistry 14, 196–207 (2022). [DOI] [PMC free article] [PubMed] [Google Scholar]
- 15.Dzuricky M, Rogers BA, Shahid A, Cremer PS & Chilkoti A De novo engineering of intracellular condensates using artificial disordered proteins. Nature Chemistry 12, 814–825 (2020). [DOI] [PMC free article] [PubMed] [Google Scholar]
- 16.Quiroz FG & Chilkoti A Sequence heuristics to encode phase behaviour in intrinsically disordered protein polymers. Nature Materials 14, 1164–1171 (2015). [DOI] [PMC free article] [PubMed] [Google Scholar]
- 17.Patel A et al. A Liquid-to-Solid Phase Transition of the ALS Protein FUS Accelerated by Disease Mutation. Cell 162, 1066–1077 (2015). [DOI] [PubMed] [Google Scholar]
- 18.Zhou H-X & Pang X Electrostatic Interactions in Protein Structure, Folding, Binding, and Condensation. Chemical Reviews 118, 1691–1741 (2018). [DOI] [PMC free article] [PubMed] [Google Scholar]
- 19.Jalal ASB et al. Diversification of DNA-Binding Specificity by Permissive and Specificity-Switching Mutations in the ParB/Noc Protein Family. Cell Reports 32, 107928 (2020). [DOI] [PMC free article] [PubMed] [Google Scholar]
- 20.Livny J, Yamaichi Y & Waldor MK Distribution of Centromere-Like parS Sites in Bacteria: Insights from Comparative Genomics. Journal of Bacteriology 189, 8693–8703 (2007). [DOI] [PMC free article] [PubMed] [Google Scholar]
- 21.Schumacher MA & Funnell BE Structures of ParB bound to DNA reveal mechanism of partition complex formation. Nature 438, 516–519 (2005). [DOI] [PubMed] [Google Scholar]
- 22.Chen B-W, Lin M-H, Chu C-H, Hsu C-E & Sun Y-J Insights into ParB spreading from the complex structure of Spo0J and parS. Proceedings of the National Academy of Sciences 112, 6613–6618 (2015). [DOI] [PMC free article] [PubMed] [Google Scholar]
- 23.Osorio-Valeriano M et al. The CTPase activity of ParB determines the size and dynamics of prokaryotic DNA partition complexes. Molecular Cell 81, 3992–4007.e10 (2021). [DOI] [PubMed] [Google Scholar]
- 24.Zacharias DA, Violin JD, Newton AC & Tsien RY Partitioning of Lipid-Modified Monomeric GFPs into Membrane Microdomains of Live Cells. Science 296, 913–916 (2002). [DOI] [PubMed] [Google Scholar]
- 25.Choi J-M, Holehouse AS & Pappu RV Physical Principles Underlying the Complex Biology of Intracellular Phase Transitions. Annual Review of Biophysics 49, 107–133 (2020). [DOI] [PMC free article] [PubMed] [Google Scholar]
- 26.Allen R & David G The Zeiss-Nomarski differential interference equipment for transmitted-light microscopy. Zeitschrift fur wissenschaftliche Mikroskopie und mikroskopische Technik 69, 193–221 (1969). [PubMed] [Google Scholar]
- 27.Alberti S, Gladfelter A & Mittag T Considerations and Challenges in Studying Liquid-Liquid Phase Separation and Biomolecular Condensates. Cell 176, 419–434 (2019). [DOI] [PMC free article] [PubMed] [Google Scholar]
- 28.Boija A et al. Transcription Factors Activate Genes through the Phase-Separation Capacity of Their Activation Domains. Cell 175, 1842–1855.e16 (2018). [DOI] [PMC free article] [PubMed] [Google Scholar]
- 29.Marenduzzo D, Finan K & Cook PR The depletion attraction: an underappreciated force driving cellular organization. Journal of Cell Biology 175, 681–686 (2006). [DOI] [PMC free article] [PubMed] [Google Scholar]
- 30.Holehouse AS, Ginell GM, Griffith D & Böke E Clustering of Aromatic Residues in Prion-like Domains Can Tune the Formation, State, and Organization of Biomolecular Condensates. Biochemistry 60, 3566–3581 (2021). [DOI] [PMC free article] [PubMed] [Google Scholar]
- 31.Lin Y-H & Chan HS Phase separation and single-chain compactness of charged disordered proteins are strongly correlated. Biophysical Journal 112, 2043–2046 (2017). [DOI] [PMC free article] [PubMed] [Google Scholar]
- 32.Milkovic NM & Mittag T Determination of protein phase diagrams by centrifugation. in Intrinsically Disordered Proteins 685–702 (Springer, 2020). [DOI] [PubMed] [Google Scholar]
- 33.Choi J-M, Dar F & Pappu RV LASSI: A lattice model for simulating phase transitions of multivalent proteins. PLOS Computational Biology 15, e1007028 (2019). [DOI] [PMC free article] [PubMed] [Google Scholar]
- 34.Banani SF et al. Compositional Control of Phase-Separated Cellular Bodies. Cell 166, 651–663 (2016). [DOI] [PMC free article] [PubMed] [Google Scholar]
- 35.Molinari S et al. A synthetic system for asymmetric cell division in Escherichia coli. Nature Chemical Biology 15, 917–924 (2019). [DOI] [PMC free article] [PubMed] [Google Scholar]
- 36.Lin D-W et al. Construction of intracellular asymmetry and asymmetric division in Escherichia coli. Nature Communications 12, 888 (2021). [DOI] [PMC free article] [PubMed] [Google Scholar]
- 37.Cox RS, Dunlop MJ & Elowitz MB A synthetic three-color scaffold for monitoring genetic regulation and noise. Journal of Biological Engineering 4, 10 (2010). [DOI] [PMC free article] [PubMed] [Google Scholar]
- 38.Browning DF & Busby SJW The regulation of bacterial transcription initiation. Nature Reviews Microbiology 2, 57–65 (2004). [DOI] [PubMed] [Google Scholar]
- 39.Lopatkin AJ et al. Antibiotics as a selective driver for conjugation dynamics. Nature Microbiology 1, 16044 (2016). [DOI] [PMC free article] [PubMed] [Google Scholar]
- 40.Lopatkin AJ et al. Persistence and reversal of plasmid-mediated antibiotic resistance. Nature Communications 8, 1689 (2017). [DOI] [PMC free article] [PubMed] [Google Scholar]
- 41.Dong C, Fontana J, Patel A, Carothers JM & Zalatan JG Synthetic CRISPR-Cas gene activators for transcriptional reprogramming in bacteria. Nature Communications 9, 2489 (2018). [DOI] [PMC free article] [PubMed] [Google Scholar]
- 42.Gao XJ, Chong LS, Kim MS & Elowitz MB Programmable protein circuits in living cells. Science 361, 1252–1258 (2018). [DOI] [PMC free article] [PubMed] [Google Scholar]
- 43.Kampmeyer C et al. Disease-linked mutations cause exposure of a protein quality control degron. Structure 30, 1245–1253.e5 (2022). [DOI] [PubMed] [Google Scholar]
- 44.Ghosh I, Hamilton AD & Regan L Antiparallel Leucine Zipper-Directed Protein Reassembly: Application to the Green Fluorescent Protein. Journal of the American Chemical Society 122, 5658–5659 (2000). [Google Scholar]
- 45.Singer-Sam J et al. Sequence of the promoter region of the gene for human X-linked 3-phosphoglycerate kinase. Gene 32, 409–417 (1984). [DOI] [PubMed] [Google Scholar]
- 46.Kleaveland B, Shi CY, Stefano J & Bartel DP A Network of Noncoding Regulatory RNAs Acts in the Mammalian Brain. Cell 174, 350–362.e17 (2018). [DOI] [PMC free article] [PubMed] [Google Scholar]
- 47.Lichtenthaler FW 100 years “Schlüssel‐Schloss‐Prinzip”: what made Emil Fischer use this analogy? Angewandte Chemie International Edition in English 33, 2364–2374 (1995). [Google Scholar]
- 48.Tang NC & Chilkoti A Combinatorial codon scrambling enables scalable gene synthesis and amplification of repetitive proteins. Nature Materials 15, 419–424 (2016). [DOI] [PMC free article] [PubMed] [Google Scholar]
- 49.McDaniel JR, MacKay JA, Quiroz FG & Chilkoti A Recursive Directional Ligation by Plasmid Reconstruction Allows Rapid and Seamless Cloning of Oligomeric Genes. Biomacromolecules 11, 944–952 (2010). [DOI] [PMC free article] [PubMed] [Google Scholar]
- 50.Block H et al. Immobilized-metal affinity chromatography (IMAC): a review. Methods in enzymology 463, 439–473 (2009). [DOI] [PubMed] [Google Scholar]
- 51.Alberti S et al. A User’s Guide for Phase Separation Assays with Purified Proteins. Journal of Molecular Biology 430, 4806–4820 (2018). [DOI] [PMC free article] [PubMed] [Google Scholar]
- 52.Young JW et al. Measuring single-cell gene expression dynamics in bacteria using fluorescence time-lapse microscopy. Nature Protocols 7, 80–88 (2012). [DOI] [PMC free article] [PubMed] [Google Scholar]
- 53.Taylor NO, Wei M-T, Stone HA & Brangwynne CP Quantifying Dynamics in Phase-Separated Condensates Using Fluorescence Recovery after Photobleaching. Biophysical Journal 117, 1285–1300 (2019). [DOI] [PMC free article] [PubMed] [Google Scholar]
- 54.Peran I, Martin EW & Mittag T Walking Along a Protein Phase Diagram to Determine Coexistence Points by Static Light Scattering. in Intrinsically Disordered Proteins 715–730 (Springer, 2020). [DOI] [PubMed] [Google Scholar]
Associated Data
This section collects any data citations, data availability statements, or supplementary materials included in this article.
Supplementary Materials
Data Availability Statement
All data supporting the findings of this work are provided within the manuscript and its related source data.


