

Abstract
Background:
Regulatory flexibility (RF) involves three distinct components of self-regulation (i.e., context sensitivity, repertoire, and feedback responsiveness). Subgroups based on differences in RF have been identified in a general sample and are differentially associated with symptoms of anxiety and depression. However, potential RF profiles have not been examined in substance use. This study aimed to identify RF subtypes in individuals with alcohol use disorder (AUD) and examine their associations with psychosocial outcomes (i.e., depression, anxiety, and stress) and delay discounting (a core feature of addiction).
Methods:
Individuals (n=200) with an Alcohol Use Disorders Identification Test score of >=16 (mean=24.12 (±6.92)) were recruited from Amazon Mechanical Turk (mean=37.26 years old (±11.41); 94 (47%) women). Participants completed the Context Sensitivity Index, the Flexible Regulation of Emotional Expression Scale, and the Coping Flexibility Scale to assess RF. Further, participants completed an Adjusting Amount Delay Discounting Task and the Depression, Anxiety, and Stress Scale (DASS-21). Latent profile analyses (LPA) were used to identify patterns in RF deficits. Kruskal–Wallis and Dunn’s tests were performed to examine differences in discounting rates and symptoms of depression, anxiety, and stress across RF profiles.
Results:
The LPA revealed a 2-profile characterization, including 1) context sensitive regulators (CSR; n=39) and 2) moderate flexibility regulators (MFR; n=161). CSR demonstrated significantly lower symptoms of depression (p=.004), anxiety (p<.001), and stress (p<.001) compared to MFR. CSR also displayed significantly lower AUDIT scores (p=.031).
Conclusions:
Findings illustrate that among individuals with moderate-severe AUD, those high in context sensitivity coupled with moderate abilities in repertoire and feedback responsiveness have fewer symptoms of depression, anxiety, and stress. Together, context sensitivity may be an important and protective component of RF amongst individuals with AUD.
Keywords: Alcohol Use Disorder, Regulatory Flexibility, Emotion Regulation, Delay Discounting
Introduction
Alcohol use disorder (AUD) imposes a significant global burden on public health (World Health Organization, 2018). In 2020 in the United States, 28.5 million individuals aged 12 and older had an AUD diagnosis in the past year (SAMHSA, 2021). Additionally, only a small percentage of individuals with AUD receive treatment yearly (SAMHSA, 2021). While efficacious treatments for AUD exist, significant room for improvement remains. Post-treatment relapse rates following psychotherapy often exceed 60% (Maisto et al., 2018; Nguyen et al., 2020) and medication assisted treatment is minimally efficacious (Rösner et al., 2010). These poor treatment outcomes may be partly due to the considerable heterogeneity in AUD diagnosis.
This heterogeneity in AUD diagnosis is illustrated via the DSM criteria. The DSM-5 AUD criteria include 11 symptoms, of which two are required for a diagnosis, resulting in over 2,000 possible AUD presentations (Lane & Sher, 2015). Thus, AUD diagnosis and categorization by severity is an imprecise method to inform treatment. Many treatments for AUD were designed to reduce substance use (Tiffany et al., 2012) or target disorder sequelae (Martin et al., 2014), rather than modulate the core features of the disorder (e.g., immediacy bias), potentially limiting treatment effectiveness (Bickel et al., 2020). Indeed, the challenge of diagnostic heterogeneity is not limited to AUD but has also been identified in common AUD comorbidities including depression (Goldberg, 2011) and anxiety (Nandi et al., 2009). The Research Domain Criteria (RDoC; Insel et al., 2010) framework conceptualizes psychopathology in the context of neurobehavioral functioning, as opposed to the symptom-based clustering of current diagnostic approaches. Investigating transdiagnostic factors such as emotion regulation (Sun et al., 2017) and reward valuation (i.e., delay discounting; Levitt et al., 2022) may allow for a more nuanced, personalized understanding of AUD.
Regulatory flexibility (RF) is a three-component sequential process by which individuals self-regulate their emotions (Bonanno & Burton, 2013; Chen & Bonanno, 2021). Specifically, RF consists of context sensitivity, repertoire, and feedback responsiveness. First, context sensitivity refers broadly to an individual’s ability to consider contextual factors in their environment that may be important in choosing a regulatory strategy (i.e., attunement to situational demands) (Bonanno et al., 2020; Bonanno & Burton, 2013; Chen & Bonanno, 2021). For example, individuals with depression have been shown to be insensitive to positive stimuli and show preference for negative cues (Dell’Acqua et al., 2023). Second, repertoire captures the array of emotion regulation/coping strategies an individual can implement (Bonanno & Burton, 2013; Burton & Bonanno, 2016; Chen & Bonanno, 2021; Cheng et al., 2014). Finally, feedback responsiveness pertains to an individual’s ability to assess the effectiveness of their chosen regulatory strategy, discontinue an ineffective strategy, and switch to a new strategy (Bonanno & Burton, 2013; Chen & Bonanno, 2021; Kato, 2012).
Better abilities in RF components are associated with improved psychological outcomes, including depression (Lenzo et al., 2021; Rodin et al., 2017), anxiety (Fresco et al., 2006; Lenzo et al., 2021), posttraumatic stress disorder (Levy-Gigi et al., 2020; Rodin et al., 2017) and substance use (Roos & Witkiewitz, 2016; Witkiewitz et al., 2018). Additionally, while most studies on flexibility have focused on individual components of RF, Chen and Bonanno (2021) also found support for their combined benefit by examining subtypes of RF. However, subtypes of the RF components among alcohol users have yet to be examined. Identifying RF subgroups based on differential individual-level utilization of RF components and potential relationships with core disorder features could provide a more nuanced understanding of an individual's regulatory impairment and help personalize treatment approaches.
One behavioral process with considerable evidence as a core process of substance use disorder (SUD), including AUD, is delay discounting (Bickel et al., 2020), or the preference for immediate rewards at the expense of greater rewards in the future. Higher rates of delay discounting are associated across the continuum of SUD pathology, including initiation of use (Audrain-McGovern et al., 2009), severity of use (Albein-Urios et al., 2012; MacKillop et al., 2010), and treatment outcomes (Coughlin et al., 2020; Washio et al., 2011). Moreover, among individuals who use substances, higher rates of delay discounting are associated with poorer health behaviors (Snider et al., 2019). However, the potential relationships between delay discounting and regulatory flexibility in AUD are poorly understood. As such, a deeper understanding of self-regulation skills and delay discounting in individuals with AUD could inform ways to improve current interventions and develop novel AUD interventions.
This study aimed to extend the findings of Chen and Bonanno (2021) by investigating patterns of RF abilities in a sample of individuals meeting the criteria for AUD. Specifically, we explored whether latent profiles defined by differences in RF exist among individuals with AUD and investigated differences in psychosocial outcomes (i.e., depression, anxiety, and stress) and delay discounting.
Methods
Participants
Participants (N = 496) were recruited from Amazon Mechanical Turk (MTurk; https://www.mturk.com/), an online crowdsourcing platform where individuals can complete Human Intelligence Tasks (HITs) in exchange for monetary compensation. To be included in this study, participants were required to endorse harmful alcohol use as indicated by an Alcohol Use Disorder Identification Test score (AUDIT; Saunders et al., 1993) of >=16 (Babor et al., 2001). Participants were paid $2.50 for completing the HIT. The Institutional Review Board at Virginia Polytechnic and State University approved this study. Consent was implied through the completion and submission of the HIT.
Measures
Demographic data including age, ethnicity, education level, gender, income, and race were collected. Additionally, an adjusting amount delay discounting task was administered. Finally, self-report questionnaires were utilized to assess RF, alcohol use severity, and symptoms of depression, anxiety, and stress.
Behavioral Economics Measures
Adjusting Amount Delay Discounting Task (Du et al., 2002).
In this task, participants chose between obtaining a hypothetical smaller, but immediate monetary reward ($500 initial), or a larger, but delayed reward ($1000). Specifically, participants were required to make successive choices between the two rewards across seven randomized delays (1 day, 1 week, 1 month, 3 months, 1 year, 5 years, and 25 years). The smaller reward was titrated - up or down - based on the pattern of choices across six trials until reaching an indifference amount - which represents the value that the smaller, immediate and larger, delayed rewards are approximately equal. These indifference amounts were plotted for each delay to generate a discounting curve using Mazur’s hyperbolic discounting function (Mazur, 1987):
In this, represents the immediate reward’s subjective value, represents the objective, full-magnitude value, represents the time delay to the reward receipt, and represents an index of the discounting function (higher value, higher discounting). All values were natural log transformed to normalize the data and stabilize the variance.
Clinical Measures
Alcohol Use Disorders Identification Test (AUDIT; Saunders et al., 1993).
The AUDIT is a 10-item self-report questionnaire that assesses alcohol consumption, drinking behaviors, and the presence and severity of alcohol-related problems. Scores range from 0-40, with a score of 16 or greater indicative of a likely moderate-severe alcohol use disorder (Babor et al., 2001; Scoring the AUDIT, n.d.).
Depression Anxiety Stress Scale (DASS-21; Henry & Crawford, 2005).
The DASS-21 is a 21-item self-report questionnaire designed to assess the presence and severity of symptoms of depression, anxiety, and stress. Specifically, participants rated over the past week how much each statement applied to them (0 = did not apply to me at all, 3 = applied to me very much or, most of the time). The depression subscale consists of items such as, “I felt I wasn’t worth much as a person”. Cutoff scores for mild, moderate, and severe depression are 9, 13, and 20, respectively. The anxiety scale consists of items such as, “I was worried about situations in which I might panic and make a fool of myself”. Cutoff scores for mild, moderate, and severe anxiety are 7, 9, and 14, respectively. Finally, the stress subscale consists of items such as, “I tended to over-react to situations”. Cutoff scores for mild, moderate, and severe stress are 14, 18, and 25, respectively. Consistent with procedures used in the original validation of the DASS-21 (Henry & Crawford, 2005) and Chen and Bonanno (2021), to obtain anxiety, depression, and stress subscale scores, the items in each subscale were summed and then multiplied by two. Doubling the subscale scores has been previously shown to be equivalent to the full DASS and makes the results more clinically interpretable, as the clinical cutoff scores are based on the longer version of the DASS (Lovibond et al., 1995).
Regulatory Flexibility Measures
The Context Sensitivity Index (CSI; Bonanno et al., 2020).
The CSI is a validated 20-item self-report questionnaire that captures how attuned a respondent is to situational demands. Specifically, the CSI asks respondents to evaluate a hypothetical situation that might occur in everyday life, on a 7-point Likert Scale (1 = not at all; 7 = very much), for perceived self-control, urgency, threat, and cooperation. For example, how urgently do you need to react if, “You take a medicine, and it makes you nauseous. Your doctor tells you that it is not serious and that you just have to “wait it out”. In the present study, consistent with (Chen & Bonanno, 2021), an overall context sensitivity score was derived by summing the 20-items. The CSI was found to be reliable between studies and is validated against behavioral measures of cue sensitivity (Bonanno et al., 2020) and has high external validity.
The Flexible Regulation of Emotional Expression Scale (FREE; Burton & Bonanno, 2016).
The FREE Scale is a validated 16-item self-report questionnaire that captures the degree to which a respondent can enhance and suppress their expression of emotion in different positive and negative situations (1 = unable; 6 = very able). Items include situations such as, “Your friend is telling you about what a terrible day they had”. The FREE Scale is associated with other measures of emotion regulation, symptoms of psychopathology, and regulatory abilities (Burton & Bonanno, 2016). In the present study, consistent with (Chen & Bonanno, 2021), items were summed to calculate an overall emotion regulation repertoire score.
The Coping Flexibility Scale (CFS; Kato, 2012).
The CFS is a validated 10-item self-report measure that assesses feedback responsiveness. Specifically, participants are asked to rate how well (1 = not applicable, 4 = very applicable) they can stop using an ineffective coping strategy (i.e., evaluate coping) and switch to an alternative coping strategy (i.e., adaptive coping). Evaluative coping consists of items such as, “I only use certain ways to cope with stress” while adaptive coping consists of items such as, “when I haven’t coped with a stressful situation well, I use other ways to cope with that situation”. The CFS was demonstrated to have high internal consistency (Cronbach’s alpha ~.90), as well as good convergent and discriminant validity. Further, improved psychological outcomes were associated with higher CFS scores (i.e., the ability to evaluate and adapt coping techniques; Kato, 2012). In the present study, consistent with Chen & Bonanno (2021) the evaluative and adaptive subscales were summed to reflect a total feedback responsiveness score.
Data Quality
While MTurk has been shown to be a reliable platform for conducting online behavioral research, recent findings have highlighted a reduction in data quality of psychological studies collected on the platform (Chmielewski & Kucker, 2020). Fortunately, several methods to improve data quality have been identified (Craft et al., 2022). To enhance the quality of data in this study individuals were required to 1) live in in the United States; 2) have a HIT approval rating >= 95% (Athamneh et al., 2019); and 3) pass a reCAPTCHA to prevent automated responding. Additionally, individuals had to provide systematic delay discounting rates, identified post hoc (Johnson & Bickel, 2008). In this study, 296 individuals provided nonsystematic discounting and were excluded from the analyses. Therefore, the final sample comprised 200 individuals.
Statistical Analyses
Statistical analyses were conducted in R version 4.2.1 (R Core Team, 2022). To conduct the LPA, the R packages tidyLPA (Rosenberg et al. 2018) and MClust (Scrucca et al., 2016) were utilized. Demographics, clinical symptoms (i.e., alcohol use severity, depression, anxiety, and stress), delay discounting rates, and RF variables (i.e., context sensitivity, repertoire, and feedback responsiveness) are summarized using means (standard deviations) and frequency (percentage) where appropriate.
In order to identify latent profiles of the flexibility components, a latent profile analysis was conducted using total context sensitivity, emotion regulation repertoire, and feedback responsiveness scores. We used standardized scores (z-scores) of all RF constructs included in the latent profile analysis. In our analysis, we tested the following four model forms. Model 1 constrained the variances to be equal across classes and the relationships between the variables are not estimated (i.e., the covariances are constrained to zero). Model 2 allows for a free estimation of the variances across classes (variances = varying) while constraining the covariances to zero. In Model 3, both the variances and covariances are constrained to be equal across profiles. Model 6 allows for a free estimation of both variances and covariances across profiles. We selected models 1-3 as they are parsimonious and included Model 6 to consider the presence of a more complex structure. Note, models 4 (i.e., varying means, varying variances, and equal covariances) and 5 (i.e., varying means, equal variances, and varying covariances) cannot be tested using MClust and tidyLPA.
To identify the ideal number of profiles, we opted to use the BIC as a goodness of fit measure because the BIC is model selection consistent. Models with a class prevalence of less than 5% were not considered to limit model solution instability (Nylund-Gibson & Choi, 2018) and replicability issues (Morovati, 2014). Finally, the interpretability of the classes was considered in choosing the best class number. We also report the entropy, and bootstrap likelihood ratio test (BLRT). Note that in general, a better fit is indicated by lower BIC values, higher entropy - that is, enhanced precision in assigning participants to a latent profile (Wang et al., 2017) - and, a significant BLRT for n profiles (p < .05; i.e., n profiles improve the model over n − 1 profiles).
Following the latent profile analyses, Kruskal–Wallis tests were performed to examine differences between the regulatory classes across discounting rates and symptoms of depression, anxiety, and stress. Additionally, an exhaustive search of the model space was performed to explore additional covariates (i.e., age, gender, race, ethnicity, education, employment, and income). The model with the lowest BIC was selected as the optimal model. If applicable, for each significant Kruskal-Wallis test (Kruskal & Wallis, 1952), Dunn’s Test (Dunn, 1964) was conducted to determine which independent groups were statistically different. To adjust for multiple comparisons to reduce the likelihood of Type I error, we implemented the Benjamini-Hochberg (B-H) method (Benjamini & Hochberg, 1995). We also conducted Pearson correlations to investigate the relationships between each RF measure and delay discounting as well as levels of depression, anxiety, and stress.
Results
Sample demographics and characteristics (i.e., discounting rates and clinical symptoms) are shown in Table 1. Overall, the sample was on average 37.3 years old (range: 22-69), with 47% women, 91.5% White, and 89% not Hispanic or Latinx. The sample had a mean AUDIT score of 24.1.
Table 1.
Sample characteristics and demographics (N = 200)
| Sample Demographics | Frequency (%) / mean (SD) |
|---|---|
| Age a | 37.3 (11.41) |
| Gender – Woman b | 94 (47.0) |
| Race b | |
| American Indian or Alaskan Native | 2 (1.0) |
| Asian | 2 (1.0) |
| Black or African American | 6 (3.0) |
| White | 183 (91.5) |
| Multiracial | 6 (3.0) |
| Prefer not to answer | 1 (0.5) |
| Ethnicity - Hispanic or Latinx b | 22 (11.0) |
| Education b | |
| High School diploma/GED | 5 (2.5) |
| Some college/Associate degree (junior college) | 7 (3.5) |
| Bachelor's degree | 135 (67.5) |
| Master's, Doctorate, Professional (MD, JD, DDS, etc.) | 53 (26.5) |
| Employment b | |
| Employed Full-time | 194 (97.0) |
| Employed Part-time | 6 (3.0) |
| Income b | |
| $10,000 through $29,999 | 21 (10.5) |
| $30,000 through $49,999 | 52 (26.0) |
| $50,000 through $69,999 | 41 (20.5) |
| $70,000 through $89,999 | 44 (22.0) |
| $90,000 through $109,999 | 20 (10.0) |
| $110,000 though $139,999 | 10 (5.0) |
| $140,000 through $179,999 | 5 (2.5) |
| $180,000 through $199,999 | 4 (2.0) |
| $200,000 and greater | 3 (1.5) |
| Sample Characteristics | mean (SD) |
| AUDIT | 24.12 (6.92) |
| Delay Discounting | −3.21 (2.84) |
| Depression, Anxiety, and Stress Scale (DASS-21) | |
| Depression | 18.96 (9.12) |
| Anxiety | 22.29 (10.54) |
| Stress | 22.41 (9.98) |
| Regulatory Flexibility | |
| Context Sensitivity Index (Context Sensitivity) | 83.11 (9.39) |
| The Flexible Regulation of Emotional Expression Scale (Repertoire) | 69.99 (10.88) |
| The Coping Flexibility Scale (Feedback Responsiveness) | 27.48 (3.73) |
mean (SD)
frequency (%)
Latent Profile Analysis
Model performances, including BIC, entropy, BLRT, and % smallest classes, are detailed in Table 2. Overall, the strongest fitting model was the 2-profile characterization model 6, which specifies freely estimated variances and equal covariance across classes. Specifically, this model had the lowest BIC, over 5% of the sample in the smallest class, entropy values over 0.76, indicating correct assignment in at least 90% of cases (Wang et al., 2017), and a significant BLRT, indicating that the 2-profile characterization was better than the 1-profile characterization. Overall, the profiles included: 1) context sensitive regulators (CSR; n = 39) and 2) moderate flexibility regulators (MFR; n = 161). The standardized group means for the 2-profile characterization across context sensitivity, repertoire, and feedback responsiveness are shown in Figure 1. Among the profiles, significant differences were observed for race (p = .040), education (p < .001), and employment (p = .015). Of note, gender was not significantly different (p = .952; Supplement Table 1). Significant differences in total AUDIT scores between the profiles were observed (p = .031; Supplement Table 2) and significant differences between profiles in AUDIT item-level responses among the profiles were noted (Supplement Table 2).
Table 2.
Exploratory Latent Profile Analyses Model Fit Indices
| N Classes | BIC | Entropy | BLRT p | % Smallest |
|---|---|---|---|---|
| Model 1: Equal variances; zero covariances | ||||
| 1 | 1731.51 | 1 | - | |
| 2 | 1699.21 | 0.65 | 0.01 | 30.5 |
| 3 | 1515.22 | 0.76 | 0.01 | 7 |
| 4 | 1505.51 | 0.82 | 0.01 | 7 |
| 5 | 1518.28 | 0.85 | 0.15 | 2.5 |
| 6 | 1534.86 | 0.81 | 0.51 | 2.5 |
| Model 2: Varying variances; zero covariances | ||||
| 1 | 1731.51 | 1 | - | |
| 2 | 1514.6 | 0.76 | 0.01 | 16 |
| 3 | 1471.48 | 0.81 | 0.01 | 7 |
| 4 | 1482.56 | 0.8 | 0.03 | 7 |
| 5 | 1478.55 | 0.83 | 0.01 | 2.5 |
| 6 | 1508.54 | 0.83 | 0.92 | 2.5 |
| Model 3: Equal variances; equal covariances | ||||
| 1 | 1677.49 | 1 | - | |
| 2 | 1477.16 | 1 | 0.01 | 7 |
| 3 | 1474.87 | 0.95 | 0.01 | 7 |
| 4 | 1492.81 | 0.74 | 0.65 | 7 |
| 5 | 1514.01 | 0.55 | 0.99 | 7 |
| 6 | 1535.33 | 0.46 | 0.97 | 6 |
| Model 6: Varying variances, varying covariance | ||||
| 1 | 1677.49 | 1 | - | |
| 2 | 1463.62 | 0.78 | 0.01 | 19.5 |
| 3 | 1481.48 | 0.74 | 0.06 | 7 |
| 4 | 1516.46 | 0.78 | 0.58 | 7 |
| 5 | 1537.54 | 0.78 | 0.06 | |
| 6 | 1575.44 | 0.8 | 0.62 | 7 |
Note: BIC = sample-size-adjusted Bayesian information criterion; BLRT = bootstrapped likelihood ratio test; % smallest = percentage of participants in the smallest group. Bolded line indicates the best profile solution based on BIC, BLRT, % smallest, and interpretability.
Figure 1. Regulatory flexibility profiles (2-profile solution).

Standardized group means of context sensitivity, repertoire, and feedback responsiveness of the latent profile analysis three-profile solution. Note: CSR = context sensitive regulators; MFR = moderate flexibility regulators.
We also explored the model with the second best fit. The 3-profile solution in model 2 (freely estimated variances across classes and covariance constrained to zero) exhibited slightly higher entropy than the 2-profile solution in model 6, a significant BLRT (indicating the 3-profile solution was better than the 2-profile solution), and the smallest profile had over 5% of the sample. However, the model had a slightly higher BIC than the 2-profile solution of model 6. Ultimately, we chose the 2-profile solution due to the lower BIC; however, we felt the strong statistical fit exhibited by the 3-profile solution merited exploration of this model (see Supplement Tables 3-7 and Supplemental Figures 1 and 2).
Delay Discounting, Depression, Anxiety, and Stress Associations
We examined differences amongst the three latent profiles across delay discounting rate , depression, anxiety, and stress symptoms. Significant differences across profiles (see Table 3) were found for symptoms of depression (H(1) = 8.80, p = .004), anxiety (H(1) = 16.78, p < .001), and stress (H(1) = 13.00, p < .001). To adjust for multiple comparisons, the B-H method (Benjamini & Hochberg, 1995) was implemented with the four pairwise comparison tests that were conducted. Overall, CSR had significantly lower symptoms of depression (mdn = 16.00 [6.00, 22.00]) compared to MFR (mdn = 20.00 [16.00, 26.00]), lower symptoms of anxiety (mdn = 16.00 [4.00, 25.00]) compared to MFR (mdn = 26.00 [20.00, 32.00]), and lower symptoms of stress (mdn = 18.00 [12.00, 24.00]) compared to MFR (mdn = 24.00 [20.00, 30.00]). Additionally, while CSR exhibited lower delay discounting rates compared to MFR, this difference was not significant (H(1) = 2.94, p = .086). Figure 2 displays means and standard errors of delay discounting rate, depression, anxiety, and stress by profile. Correlations between each RF measure and delay discounting as well as levels of depression, anxiety, and stress were non-significant (Bonferroni adjusted ps>0.760).
Table 3.
Kruskal–Wallis tests and medians (interquartile ranges) of discounting, depression, anxiety, and stress by profile (2-profile solution)
| Profile | Unadjusted p-value |
Adjusted p-value |
||
|---|---|---|---|---|
| CSR | MFR | |||
| Delay Discounting | −3.84 [−5.22, −2.08] | −2.67 [−4.72, −0.91] | .086 | .086 |
| Depression | 16.00 [6.00, 22.00] | 20.00 [16.00, 26.00] | .003 | .004 |
| Anxiety | 16.00 [4.00, 25.00] | 26.00 [20.00, 32.00] | <.001 | <.001 |
| Stress | 18.00 [12.00, 24.00] | 24.00 [20.00, 30.00] | <.001 | <.001 |
Note: Depression, anxiety, and stress symptoms as measured by the DASS-21; CSR = context sensitive regulators; MFR = moderate flexibility regulators.
Figure 2. 2-Profile associations with delay discounting and psychopathology symptoms.
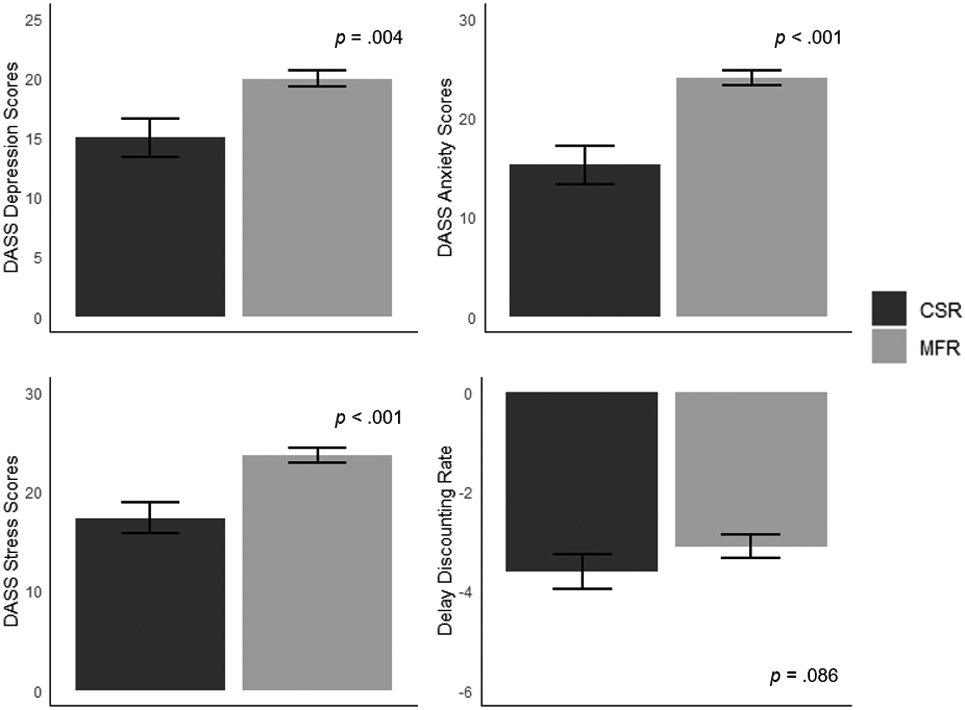
Relationship between RF profiles and delay discounting, and symptoms of depression, anxiety, and stress (as measured by the DASS-21). Note: CSR = context sensitive regulators; MFR = moderate flexibility regulators.
Discussion
Latent Profile Analysis
This study investigated latent profiles of three components of RF (i.e., context sensitivity, repertoire, and feedback responsiveness) amongst individuals with AUD. Our results revealed a 2-profile characterization. Specifically, RF profiles included 1) context sensitive regulators (CSF; 19.5%) and 2) moderate flexibility regulators (MFR; 80.5%). CSR exhibited high ability in context sensitivity with moderate abilities in repertoire and feedback responsiveness while MFR exhibited moderate abilities across all three RF components.
The present study’s findings contrast the four-profile characterization identified amongst a general sample by Chen and Bonanno. Specifically, Chen and Bonanno found the following regulatory profiles: 1) high-flexibility regulators (HFR); 2) medium flexibility regulators (MFR); 3) context-insensitive regulators (CIR); and 4) feedback irresponsive regulators (FIR). We did not identify a subtype of regulators who demonstrated high abilities across all RF domains. This difference likely reflects the clinical nature of our sample (i.e., we examined individuals with AUD compared to a general sample in Chen and Bonanno). Similarly to Chen and Bonanno, we identified a profile with moderate abilities across all three domains. This is consistent with the literature that shows individuals with AUD exhibit difficulties in coping (Cavicchioli et al., 2018; Metzger et al., 2017). Further, enhancing coping abilities (Hendershot et al., 2011; Roos et al., 2017) as well as utilizing a broader array of coping techniques (Roos & Witkiewitz, 2016; Witkiewitz et al., 2018) is related to improved outcomes post-treatment (e.g., lower relapse risk). Interestingly, our 2-profile characterization revealed a subtype of regulators high in context sensitivity, a group Chen and Bonanno did not observe. Individuals in the CSR profile exhibited significantly lower symptoms of anxiety, depression, and stress. These findings are consistent with extant literature demonstrating the particular importance of context sensitivity (Bonanno et al., 2020; Bonanno & Burton, 2013; Chen & Bonanno, 2021; Cheng et al., 2014).
Associations with Depression, Anxiety, and Stress
This study also examined associations between regulatory subtypes and symptoms of depression, anxiety, and stress. We observed significantly higher depression scores among MFR (median score = 20 [moderate]) compared to CSR (median score = 16 [moderate]). Further, we report significant differences in anxiety and stress scores. Specifically, MFR had significantly higher anxiety (median score = 26 [extremely severe]) and stress (median score 24 [moderate]) scores than CSR (median anxiety score = 16 [severe]; median stress score = 18 [mild]). These findings are consistent with extant literature that suggests individuals with lower context sensitivity have greater symptoms of depression (for review, see Bylsma et al., 2008) as well as other symptoms of psychopathology (i.e., stress and anxiety; Bonanno et al., 2020). Given regulatory flexibility is a sequential process, less ability in context sensitivity may hinder an individual’s ability to develop a wide array of emotion regulation strategies, access a wide repertoire, or engage in feedback responsiveness. Altogether, the present findings suggest that high context sensitivity coupled with moderate repertoire and feedback responsiveness is associated with the lower comorbid psychiatric symptomatology amongst individuals with AUD, consistent with findings emphasizing the particular importance of context sensitivity in contributing to improved psychopathological outcomes (Aldao, 2013; Bonanno & Burton, 2013; Cheng et al., 2014). Further research on regulatory flexibility profiles within other SUDs and at varying stages of SUD/AUD recovery is warranted to elucidate the differences in psychiatric symptomatology.
Demographic and Alcohol Use Differences by Profile
Our investigation identified several demographic differences among profiles, with individuals in the CSR group reporting a lower level of education, higher part-time employment, and higher proportion identifying as Black or African American. Of note, gender differences among regulatory profiles were not observed. The present finding contrasts with a previous study that found women displayed higher repertoire and context sensitivity relative to men (Goubet & Chrysikou, 2019). This divergence in findings could be attributed to the lack of statistically significant differences in gender among the profiles in the present study. Additionally, the present study investigated RF in a more clinically relevant sample of individuals with AUD (mean age ~37) while Goubet and colleagues conducted their investigation in a sample of university students (mean age ~19). Gender differences have been observed in a variety of factors in AUD; for example, in quantity of use (White, 2020), health outcomes (White, 2020), and neuropsychological functioning (Squeglia et al., 2011) and future research into potential gender-specific regulatory profiles in AUD is warranted.
Statistically significant differences in AUDIT scores between profiles were observed, with individuals in the CSR group having lower scores relative to the MFR group. Additionally, several differences in individual AUDIT score items were observed based on profile classification (see Supplement Table 2). Specifically, CSR exhibited significantly lower scores for items reflecting severe impairment (i.e., failing to meet responsibilities due to drinking, memory loss, requiring alcohol in the morning) compared to MFR. This finding reinforces the heterogeneous nature of AUD and highlights that potentially clinically relevant individual differences in AUD criteria may be hidden by current diagnostic classification. Thus, the present findings support the importance of investigating precise, identifiable constructs of mental health disorders, as highlighted by the RDoC criteria (Insel et al., 2010).
Clinical Implications
Overall, while the CSR regulator subtype profile met the same AUD criteria, they had less comorbid psychopathology compared to MFR. Note that CSR not only exhibited high context sensitivity, but also exhibited moderate repertoire and feedback responsiveness abilities. In other words, CSR did not display a deficit in repertoire or feedback responsiveness. Prior literature has found that having a broader coping repertoire, or consistently using a broader array of coping skills rather than relying on fewer coping skills, was related to improved treatment outcomes (Roos & Witkiewitz, 2016; Witkiewitz et al., 2018). Further, many standard AUD treatments aim to enhance coping skills (e.g., cognitive behavioral therapy; Magill & Ray, 2009). This study’s findings suggest that individuals with AUD who have both moderate repertoire and feedback responsiveness might benefit from improving context sensitivity rather than solely adding additional coping skills. Together, targeting these differences across groups may be a pathway to treating individuals with more severe mental health symptoms. Further, these findings support that an individualized approach to addiction research may better inform personalized, precision treatment. Future research examining whether context sensitivity is protective against distinctly low abilities in repertoire and feedback responsiveness may be informative.
Supplemental Latent Profile Analysis
In the interest of rigor, we also examined the model with the second best fit, which identified a 3-profile characterization (see Supplemental Table 3 - 7 and Supplemental Figure 1 and 2). Similar to the 2-profile solution, we identified a CSR group. While the CSR group was smaller in proportion (7% of sample) compared to CSR in the 3-profile solution, they also displayed significantly lower depression, anxiety, and stress symptoms compared to the other two profiles. Notably, the CSR in the 3-profile solution also displayed significantly lower delay discounting compared to the other two profiles. Specifically, the median CSR value was −4.99, while the other two groups displayed median values greater than −3. Prior research has demonstrated that values higher than −4.3118 are typical of SUD treatment-seeking samples and rate-dependent treatment effects (Bickel et al., 2014; Dwyer et al., 2023). Similar directional differences in delay discounting were also observed in the 2-profile characterization, although these differences were not statistically significant following p-value adjustment.
A robust literature highlights the etiological and mechanistic role of delay discounting in AUD and delay discounting is also broadly associated with psychopathology (for a review see, Amlung et al., 2019). The competing neurobehavioral decision systems theory (CNDS) has identified delay discounting as an index of the relative balance between executive and impulsive neural systems (Bickel et al., 2015), where higher levels of delay discounting may result in decision-making conducive to immediate reinforcement at the expense of longer-term, greater reinforcement in the future. Flexible self-regulation requires executive processes including monitoring goals, motivation, and planning. That individuals with higher discounting rates might also have lower abilities in context sensitivity suggest they may be more locked into rigid behavioral patterns and unable to access a broader repertoire of regulatory skills or appropriately monitor and adapt their chosen strategies, consistent with the CNDS theory. Future investigation of the relationship between delay discounting, coping, and regulatory flexibility is warranted.
Limitations
Several potential limitations of this study should be acknowledged. First, the results of this online study may not be generalizable to in-person samples. However, prior work has shown concordance between research conducted online and in-lab. Moreover, this study’s online, remote design may have facilitated research participation for individuals who are uninterested or unable to participate in in-person research. Second, participants in this study were primarily white and non-Hispanic; therefore, whether these findings generalize to more diverse samples remain unknown. Third, this study assessed repertoire by examining an individual’s ability to both up- and down-regulate their emotional expression. Other methods for evaluating repertoire have also been utilized, such as the quantity of regulatory strategies an individual relies on (Cheng et al., 2014; Roos & Witkiewitz, 2016; Witkiewitz et al., 2018). Future research would benefit from examining flexibility subtypes with other approaches to evaluate repertoire. Fourth, the profiles and associations characterized in this study were limited to individuals with AUD. Future work investigating emotion regulation profiles across the spectrum of alcohol use (e.g., social drinking or mild AUD) would further enhance understanding of AUD. Lastly, the cross-sectional study design limits our ability to characterize the relationship between subtypes of RF with delay discounting and symptoms of depression, anxiety, and stress over time. In this, the identification of RF subtypes can serve as the groundwork for intervention and longitudinal studies for AUD treatment.
Conclusions
This study extended the findings of Chen and Bonanno (2021) and found, amongst individuals with AUD, 1) latent profiles of regulatory flexibility (i.e., context sensitivity, repertoire, and feedback responsiveness) and 2) associations between subtypes of regulators and symptoms of depression, anxiety, and stress. We found two profiles of regulators (i.e., context sensitive regulators and moderate flexibility regulators), with CSR exhibiting significantly lower symptoms of depression, anxiety, and stress. Overall, the findings highlight the potential importance of enhanced context sensitivity coupled with adequate repertoire and feedback responsiveness in contributing to improved functioning amongst individuals with AUD.
Supplementary Material
Funding:
This study was supported by NIAAA R01AA027381 and the Fralin Biomedical Research Institute at VTC. The funders had no role other than financial support.
Footnotes
All authors contributed in a significant way and all authors have read and approved the final manuscript.
Declaration of Interests: Although the following activities/relationships do not create a conflict of interest pertaining to this manuscript, in the interest of full disclosure, Dr. Bickel would like to report the following: W. K. Bickel is a principal of HealthSim, LLC; BEAM Diagnostics, Inc.; and Red 5 Group, LLC. In addition, he serves on the scientific advisory board for Sober Grid, Inc.; and Ria Health; serves as a consultant for Boehringer Ingelheim International and Lumanity; and works on a project supported by Indivior, Inc.
References
- Albein-Urios N, Martinez-González JM, Lozano O, Clark L, & Verdejo-García A (2012). Comparison of impulsivity and working memory in cocaine addiction and pathological gambling: Implications for cocaine-induced neurotoxicity. Drug and Alcohol Dependence, 126(1-2), 1–6. 10.1016/j.drugalcdep.2012.03.008 [DOI] [PubMed] [Google Scholar]
- Aldao A (2013). The Future of Emotion Regulation Research: Capturing Context. Perspectives on Psychological Science: A Journal of the Association for Psychological Science, 8(2), 155–172. 10.1177/1745691612459518 [DOI] [PubMed] [Google Scholar]
- Amlung M, Marsden E, Holshausen K, Morris V, Patel H, Vedelago L, Naish KR, Reed DD, & McCabe RE (2019). Delay Discounting as a Transdiagnostic Process in Psychiatric Disorders: A Meta-analysis. JAMA Psychiatry . 10.1001/jamapsychiatry.2019.2102 [DOI] [PMC free article] [PubMed] [Google Scholar]
- Athamneh LN, Stein JS, & Bickel WK (2019). Narrative theory III: Evolutionary narratives addressing mating motives change discounting and tobacco valuation. Experimental and Clinical Psychopharmacology. 10.1037/pha0000315 [DOI] [PMC free article] [PubMed] [Google Scholar]
- Audrain-McGovern J, Rodriguez D, Epstein LH, Cuevas J, Rodgers K, & Wileyto EP (2009). Does delay discounting play an etiological role in smoking or is it a consequence of smoking? Drug and Alcohol Dependence, 103(3), 99–106. 10.1016/j.drugalcdep.2008.12.019 [DOI] [PMC free article] [PubMed] [Google Scholar]
- Babor TF, Higgins-Biddle JC, Saunders JB, & Monteiro MG (2001). The Alcohol Use Disorders Identification Test Guidelines for Use in Primary Care, 2nd edition. World Health Organization. http://apps.who.int/iris/bitstream/handle/10665/67205/WHO_MSD_MSB_01.6a.pdf;jsessionid=D6AB692BE0C0BE59F2CE71B98A54C170?sequence=1 [Google Scholar]
- Benjamini Y, & Hochberg Y (1995). Controlling the false discovery rate: A practical and powerful approach to multiple testing. Journal of the Royal Statistical Society, 57(1), 289–300. 10.1111/j.2517-6161.1995.tb02031.x [DOI] [Google Scholar]
- Bickel WK, Athamneh LN, Snider SE, Craft WH, DeHart WB, Kaplan BA, & Basso JC (2020). Reinforcer Pathology: Implications for Substance Abuse Intervention. In de Wit H & Jentsch JD (Eds.), Recent Advances in Research on Impulsivity and Impulsive Behaviors (pp. 139–162). Springer International Publishing. 10.1007/7854_2020_145 [DOI] [PubMed] [Google Scholar]
- Bickel WK, Landes RD, Kurth-Nelson Z, & Redish AD (2014). A Quantitative Signature of Self-Control Repair: Rate-Dependent Effects of Successful Addiction Treatment. Clinical Psychological Science, 2(6), 685–695. 10.1177/2167702614528162 [DOI] [PMC free article] [PubMed] [Google Scholar]
- Bickel WK, Quisenberry AJ, Moody L, & Wilson AG (2015). Therapeutic Opportunities for Self-Control Repair in Addiction and Related Disorders: Change and the Limits of Change in Trans-Disease Processes. Clinical Psychological Science, 3(1), 140–153. 10.1177/2167702614541260 [DOI] [PMC free article] [PubMed] [Google Scholar]
- Bonanno GA, & Burton CL (2013). Regulatory Flexibility: An Individual Differences Perspective on Coping and Emotion Regulation. Perspectives on Psychological Science: A Journal of the Association for Psychological Science, 8(6), 591–612. 10.1177/1745691613504116 [DOI] [PubMed] [Google Scholar]
- Bonanno GA, Maccallum F, Malgaroli M, & Hou WK (2020). The Context Sensitivity Index (CSI): Measuring the Ability to Identify the Presence and Absence of Stressor Context Cues. Assessment, 27(2), 261–273. 10.1177/1073191118820131 [DOI] [PubMed] [Google Scholar]
- Burton CL, & Bonanno GA (2016). Measuring ability to enhance and suppress emotional expression: The Flexible Regulation of Emotional Expression (FREE) Scale. Psychological Assessment, 28(8), 929–941. 10.1037/pas0000231 [DOI] [PubMed] [Google Scholar]
- Bylsma LM, Morris BH, & Rottenberg J (2008). A meta-analysis of emotional reactivity in major depressive disorder. Clinical Psychology Review, 28(4), 676–691. 10.1016/j.cpr.2007.10.001 [DOI] [PubMed] [Google Scholar]
- Cavicchioli M, Vassena G, Movalli M, & Maffei C (2018). Addictive behaviors in alcohol use disorder: dysregulation of reward processing systems and maladaptive coping strategies. Journal of Addictive Diseases, 37(3-4), 173–184. 10.1080/10550887.2019.1643211 [DOI] [PubMed] [Google Scholar]
- Cheng C, Lau H-PB, & Chan M-PS (2014). Coping flexibility and psychological adjustment to stressful life changes: a meta-analytic review. Psychological Bulletin, 140(6), 1582–1607. 10.1037/a0037913 [DOI] [PubMed] [Google Scholar]
- Chen S, & Bonanno GA (2021). Components of Emotion Regulation Flexibility: Linking Latent Profiles to Depressive and Anxious Symptoms. Clinical Psychological Science, 9(2), 236–251. 10.1177/2167702620956972 [DOI] [Google Scholar]
- Chmielewski M, & Kucker SC (2020). An MTurk Crisis? Shifts in Data Quality and the Impact on Study Results. Social Psychological and Personality Science, 11(4), 464–473. 10.1177/1948550619875149 [DOI] [Google Scholar]
- Coughlin LN, Tegge AN, Sheffer CE, & Bickel WK (2020). A Machine-Learning Approach to Predicting Smoking Cessation Treatment Outcomes. Nicotine & Tobacco Research: Official Journal of the Society for Research on Nicotine and Tobacco, 22(3), 415–422. 10.1093/ntr/nty259 [DOI] [PMC free article] [PubMed] [Google Scholar]
- Craft WH, Tegge AN, Freitas-Lemos R, Tomlinson DC, & Bickel WK (2022). Are poor quality data just random responses?: A crowdsourced study of delay discounting in alcohol use disorder. Experimental and Clinical Psychopharmacology. 10.1037/pha0000549 [DOI] [PMC free article] [PubMed] [Google Scholar]
- Dell’Acqua C, Palomba D, Patron E, & Messerotti Benvenuti S (2023). Rethinking the risk for depression using the RDoC: A psychophysiological perspective. Frontiers in Psychology, 14, 1108275. 10.3389/fpsyg.2023.1108275 [DOI] [PMC free article] [PubMed] [Google Scholar]
- Dunn OJ (1964). Multiple Comparisons Using Rank Sums. Technometrics: A Journal of Statistics for the Physical, Chemical, and Engineering Sciences, 6(3), 241–252. 10.1080/00401706.1964.10490181 [DOI] [Google Scholar]
- Du W, Green L, & Myerson J (2002). Cross-Cultural Comparisons of Discounting Delayed and Probabilistic Rewards. The Psychological Record, 52(4), 479–492. 10.1007/BF03395199 [DOI] [Google Scholar]
- Dwyer CL, Craft WH, Tegge AN, Yeh Y-H, & Bickel WK (2023). Utility of the 5-trial adjusting delay task in screening for high delay discounting rates: A cohort study of individuals reporting harmful alcohol and tobacco use. Experimental and Clinical Psychopharmacology. 10.1037/pha0000623 [DOI] [PMC free article] [PubMed] [Google Scholar]
- Fresco DM, Williams NL, & Nugent NR (2006). Flexibility and Negative Affect: Examining the Associations of Explanatory Flexibility and Coping Flexibility to Each Other and to Depression and Anxiety. Cognitive Therapy and Research, 30(2), 201–210. 10.1007/s10608-006-9019-8 [DOI] [Google Scholar]
- Goldberg D (2011). The heterogeneity of “major depression”. World Psychiatry: Official Journal of the World Psychiatric Association , 10(3), 226–228. 10.1002/j.2051-5545.2011.tb00061.x [DOI] [PMC free article] [PubMed] [Google Scholar]
- Goubet KE, & Chrysikou EG (2019). Emotion Regulation Flexibility: Gender Differences in Context Sensitivity and Repertoire. Frontiers in Psychology, 10, 935. 10.3389/fpsyg.2019.00935 [DOI] [PMC free article] [PubMed] [Google Scholar]
- Hendershot CS, Witkiewitz K, George WH, & Marlatt GA (2011). Relapse prevention for addictive behaviors. Substance Abuse Treatment, Prevention, and Policy, 6, 17. 10.1186/1747-597X-6-17 [DOI] [PMC free article] [PubMed] [Google Scholar]
- Henry JD, & Crawford JR (2005). The short-form version of the Depression Anxiety Stress Scales (DASS-21): construct validity and normative data in a large non-clinical sample. The British Journal of Clinical Psychology / the British Psychological Society, 44(Pt 2), 227–239. 10.1348/014466505X29657 [DOI] [PubMed] [Google Scholar]
- Insel T, Cuthbert B, Garvey M, Heinssen R, Pine DS, Quinn K, Sanislow C, & Wang P (2010). Research domain criteria (RDoC): toward a new classification framework for research on mental disorders. The American Journal of Psychiatry, 167(7), 748–751. 10.1176/appi.ajp.2010.09091379 [DOI] [PubMed] [Google Scholar]
- Johnson MW, & Bickel WK (2008). An algorithm for identifying nonsystematic delay-discounting data. Experimental and Clinical Psychopharmacology, 16(3), 264–274. 10.1037/1064-1297.16.3.264 [DOI] [PMC free article] [PubMed] [Google Scholar]
- Kato T (2012). Development of the Coping Flexibility Scale: evidence for the coping flexibility hypothesis. Journal of Counseling Psychology, 59(2), 262–273. 10.1037/a0027770 [DOI] [PubMed] [Google Scholar]
- Kruskal WH, & Wallis WA (1952). Use of Ranks in One-Criterion Variance Analysis. Journal of the American Statistical Association, 47(260), 583–621. 10.1080/01621459.1952.10483441 [DOI] [Google Scholar]
- Lane SP, & Sher KJ (2015). Limits of Current Approaches to Diagnosis Severity Based on Criterion Counts: An Example with DSM-5 Alcohol Use Disorder. Clinical Psychological Science, 3(6), 819–835. 10.1177/2167702614553026 [DOI] [PMC free article] [PubMed] [Google Scholar]
- Lenzo V, Quattropani MC, Sardella A, Martino G, & Bonanno GA (2021). Depression, Anxiety, and Stress Among Healthcare Workers During the COVID-19 Outbreak and Relationships With Expressive Flexibility and Context Sensitivity. Frontiers in Psychology, 12, 623033. 10.3389/fpsyg.2021.623033 [DOI] [PMC free article] [PubMed] [Google Scholar]
- Levitt EE, Oshri A, Amlung M, Ray LA, Sanchez-Roige S, Palmer AA, & MacKillop J (2022). Evaluation of delay discounting as a transdiagnostic research domain criteria indicator in 1388 general community adults. Psychological Medicine, 1–9. 10.1017/S0033291721005110 [DOI] [PMC free article] [PubMed] [Google Scholar]
- Levy-Gigi E, Donner R, & Bonanno GA (2020). Free Your Mind: Emotional Expressive Flexibility Moderates the Effect of Stress on Post-Traumatic Stress Disorder Symptoms. International Journal of Molecular Sciences, 21(15). 10.3390/ijms21155355 [DOI] [PMC free article] [PubMed] [Google Scholar]
- Lovibond HS, Lovibond FP, & Psychology Foundation of Australia. (1995). Manual for the depression anxiety stress scales. Psychology Foundation of Australia. https://www.worldcat.org/title/manual-for-the-depression-anxiety-stress-scales/oclc/222009504 [Google Scholar]
- MacKillop J, Miranda R Jr, Monti PM, Ray LA, Murphy JG, Rohsenow DJ, McGeary JE, Swift RM, Tidey JW, & Gwaltney CJ (2010). Alcohol demand, delayed reward discounting, and craving in relation to drinking and alcohol use disorders. Journal of Abnormal Psychology, 119(1), 106–114. 10.1037/a0017513 [DOI] [PMC free article] [PubMed] [Google Scholar]
- Magill M, & Ray LA (2009). Cognitive-behavioral treatment with adult alcohol and illicit drug users: a meta-analysis of randomized controlled trials. Journal of Studies on Alcohol and Drugs, 70(4), 516–527. 10.15288/jsad.2009.70.516 [DOI] [PMC free article] [PubMed] [Google Scholar]
- Maisto SA, Hallgren KA, Roos CR, & Witkiewitz K (2018). Course of remission from and relapse to heavy drinking following outpatient treatment of alcohol use disorder. Drug and Alcohol Dependence, 187, 319–326. 10.1016/j.drugalcdep.2018.03.011 [DOI] [PMC free article] [PubMed] [Google Scholar]
- Martin CS, Langenbucher JW, Chung T, & Sher KJ (2014). Truth or consequences in the diagnosis of substance use disorders. Addiction , 109(11), 1773–1778. 10.1111/add.12615 [DOI] [PMC free article] [PubMed] [Google Scholar]
- Mazur JE (1987). An adjusting procedure for studying delayed reinforcement. The Effect of Delay and of Intervening Events on Reinforcement Value., 344, 55–73. https://psycnet.apa.org/fulltext/1986-98701-003.pdf [Google Scholar]
- Metzger IW, Blevins C, Calhoun CD, Ritchwood TD, Gilmore AK, Stewart R, & Bountress KE (2017). An examination of the impact of maladaptive coping on the association between stressor type and alcohol use in college. Journal of American College Health: J of ACH, 65(8), 534–541. 10.1080/07448481.2017.1351445 [DOI] [PMC free article] [PubMed] [Google Scholar]
- Morovati D (2014). The Intersection of Sample Size, Number of Indicators, and Class Enumeration in LCA: A Monte Carlo Study (Nylund-Gibson K (Ed.)) [Doctor of Philosophy, University of California Santa Barbara; ]. https://escholarship.org/content/qt2w28x9g8/qt2w28x9g8_noSplash_7962cbda50e458c578704544185108b1.pdf [Google Scholar]
- Nandi A, Beard JR, & Galea S (2009). Epidemiologic heterogeneity of common mood and anxiety disorders over the lifecourse in the general population: a systematic review. BMC Psychiatry, 9, 31. 10.1186/1471-244X-9-31 [DOI] [PMC free article] [PubMed] [Google Scholar]
- Nguyen L-C, Durazzo TC, Dwyer CL, Rauch AA, Humphreys K, Williams LM, & Padula CB (2020). Predicting relapse after alcohol use disorder treatment in a high-risk cohort: The roles of anhedonia and smoking. Journal of Psychiatric Research, 126, 1–7. 10.1016/j.jpsychires.2020.04.003 [DOI] [PMC free article] [PubMed] [Google Scholar]
- Nylund-Gibson K, & Choi AY (2018). Ten frequently asked questions about latent class analysis. Translational Issues in Psychological Science, 4(4), 440–461. 10.1037/tps0000176 [DOI] [Google Scholar]
- R Core Team. (2022). R: A Language and Environment for Statistical Computing. https://www.R-project.org/
- Rodin R, Bonanno GA, Rahman N, Kouri NA, Bryant RA, Marmar CR, & Brown AD (2017). Expressive flexibility in combat veterans with posttraumatic stress disorder and depression. Journal of Affective Disorders, 207, 236–241. 10.1016/j.jad.2016.09.027 [DOI] [PubMed] [Google Scholar]
- Roos CR, Maisto SA, & Witkiewitz K (2017). Coping mediates the effects of cognitive-behavioral therapy for alcohol use disorder among out-patient clients in Project MATCH when dependence severity is high. Addiction , 112(9), 1547–1557. 10.1111/add.13841 [DOI] [PMC free article] [PubMed] [Google Scholar]
- Roos CR, & Witkiewitz K (2016). Adding tools to the toolbox: The role of coping repertoire in alcohol treatment. Journal of Consulting and Clinical Psychology, 84(7), 599–611. 10.1037/ccp0000102 [DOI] [PMC free article] [PubMed] [Google Scholar]
- Rösner S, Hackl-Herrwerth A, Leucht S, Lehert P, Vecchi S, & Soyka M (2010). Acamprosate for alcohol dependence. Cochrane Database of Systematic Reviews , 9, CD004332. 10.1002/14651858.CD004332.pub2 [DOI] [PMC free article] [PubMed] [Google Scholar]
- SAMHSA. (2021). 2020 NSDUH Annual National Report.
- Saunders JB, Aasland OG, Babor TF, de la Fuente JR, & Grant M (1993). Development of the Alcohol Use Disorders Identification Test (AUDIT): WHO Collaborative Project on Early Detection of Persons with Harmful Alcohol Consumption--II. Addiction , 88(6), 791–804. 10.1111/j.1360-0443.1993.tb02093.x [DOI] [PubMed] [Google Scholar]
- Scoring the AUDIT. (n.d.). Retrieved July 20, 2022, from https://auditscreen.org/about/scoring-audit/
- Scrucca L, Fop M, Murphy TB, & Raftery AE (2016). mclust 5: clustering, classification and density estimation using Gaussian finite mixture models. In The R Journal (Vol. 8, Issue 1, pp. 289–317). 10.32614/RJ-2016-021 [DOI] [PMC free article] [PubMed] [Google Scholar]
- Snider SE, DeHart WB, Epstein LH, & Bickel WK (2019). Does delay discounting predict maladaptive health and financial behaviors in smokers? Health Psychology: Official Journal of the Division of Health Psychology, American Psychological Association, 38(1), 21–28. 10.1037/hea0000695 [DOI] [PMC free article] [PubMed] [Google Scholar]
- Squeglia LM, Schweinsburg AD, Pulido C, & Tapert SF (2011). Adolescent binge drinking linked to abnormal spatial working memory brain activation: differential gender effects. Alcoholism, Clinical and Experimental Research, 35(10), 1831–1841. 10.1111/j.1530-0277.2011.01527.x [DOI] [PMC free article] [PubMed] [Google Scholar]
- Sun M, Vinograd M, Miller GA, & Craske MG (2017). Research Domain Criteria (RDoC) and emotion regulation. In Essau CA (Ed.), Emotion regulation and psychopathology in children and adolescents , (pp (Vol. 464, pp. 79–110). Oxford University Press, xvi. 10.1093/med:psych/9780198765844.003.0005 [DOI] [Google Scholar]
- Tiffany ST, Friedman L, Greenfield SF, Hasin DS, & Jackson R (2012). Beyond drug use: a systematic consideration of other outcomes in evaluations of treatments for substance use disorders. Addiction , 107(4), 709–718. 10.1111/j.1360-0443.2011.03581.x [DOI] [PMC free article] [PubMed] [Google Scholar]
- Wang M-C, Deng Q, Bi X, Ye H, & Yang W (2017). Performance of the entropy as an index of classification accuracy in latent profile analysis: A Monte Carlo simulation study. Acta Psychologica Sinica, 49(11), 1473–1482. 10.3724/SP.J.1041.2017.01473 [DOI] [Google Scholar]
- Washio Y, Higgins ST, Heil SH, McKerchar TL, Badger GJ, Skelly JM, & Dantona RL (2011). Delay discounting is associated with treatment response among cocaine-dependent outpatients. Experimental and Clinical Psychopharmacology, 19(3), 243–248. 10.1037/a0023617 [DOI] [PMC free article] [PubMed] [Google Scholar]
- White AM (2020). Gender Differences in the Epidemiology of Alcohol Use and Related Harms in the United States. Alcohol Research: Current Reviews, 40(2), 01. 10.35946/arcr.v40.2.01 [DOI] [PMC free article] [PubMed] [Google Scholar]
- Witkiewitz K, Roos CR, Tofighi D, & Van Horn ML (2018). Broad Coping Repertoire Mediates the Effect of the Combined Behavioral Intervention on Alcohol Outcomes in the COMBINE Study: An Application of Latent Class Mediation. Journal of Studies on Alcohol and Drugs, 79(2), 199–207. 10.15288/jsad.2018.79.199 [DOI] [PMC free article] [PubMed] [Google Scholar]
- World Health Organization. (2018). Global status report on alcohol and health 2018.
Associated Data
This section collects any data citations, data availability statements, or supplementary materials included in this article.