

Visual Abstract

Keywords: cell and transport physiology; distal tubule; electrolytes; genetic renal disease; ion transport; fluid, electrolyte, and acid–base disorders; kidney biology and physiology
Abstract
Significance Statement
In the kidney, the B1 H+-ATPase subunit is mostly expressed in intercalated cells (IC). Its importance in acid-secreting type A ICs is evident in patients with inborn distal renal tubular acidosis and ATP6V1B1 mutations. However, the protein is also highly expressed in alkali-secreting non–type A ICs where its function is incompletely understood. We demonstrate in Atp6v1b1 knock out mice that the B1 subunit is critical for the renal response to defend against alkalosis during an alkali load or chronic furosemide treatment. These findings highlight the importance of non–type A ICs in maintaining acid–base balance in response to metabolic challenges or commonly used diuretics.
Background
Non–type A ICs in the collecting duct system express the luminal Cl−/HCO3− exchanger pendrin and apical and/or basolateral H+-ATPases containing the B1 subunit isoform. Non–type A ICs excrete bicarbonate during metabolic alkalosis. Mutations in the B1 subunit (ATP6V1B1) cause distal renal tubular acidosis due to its role in acid secretory type A ICs. The function of B1 in non–type A ICs has remained elusive.
Methods
We examined the responses of Atp6v1b1−/− and Atp6v1b1+/+ mice to an alkali load and to chronic treatment with furosemide.
Results
An alkali load or 1 week of furosemide resulted in a more pronounced hypokalemic alkalosis in male ATP6v1b1−/− versus Atp6v1b1+/+ mice that could not be compensated by respiration. Total pendrin expression and activity in non–type A ICs of ex vivo microperfused cortical collecting ducts were reduced, and β2-adrenergic stimulation of pendrin activity was blunted in ATP6v1b1−/− mice. Basolateral H+-ATPase activity was strongly reduced, although the basolateral expression of the B2 isoform was increased. Ligation assays for H+-ATPase subunits indicated impaired assembly of V0 and V1 H+-ATPase domains. During chronic furosemide treatment, ATP6v1b1−/− mice also showed polyuria and hyperchloremia versus Atp6v1b1+/+. The expression of pendrin, the water channel AQP2, and subunits of the epithelial sodium channel ENaC were reduced.
Conclusions
Our data demonstrate a critical role of H+-ATPases in non–type A ICs function protecting against alkalosis and reveal a hitherto unrecognized need of basolateral B1 isoform for a proper H+-ATPase complexes assembly and ability to be stimulated.
Introduction
The final urinary secretion of acid or base equivalents is fine-tuned by intercalated cells (IC) along the connecting tubule (CNT) and collecting duct (CD) and involves the action of vacuolar H+-ATPases (H+-ATPases) and several Cl−/HCO3− exchangers. At least two types of ICs exist: type A and type B.1–3 The existence of a third type (non-A non-B IC) has been proposed2,4; however, the functional significance of this subtype has not been clarified. Type A ICs secrete protons via an apically located H+-ATPase5 functionally coupled to the basolateral Cl−/HCO3− exchanger AE1 releasing bicarbonate into blood. Non–type A ICs (type B ICs and non–type A–non–type B ICs) express the Cl−/HCO3− exchanger pendrin apically and the H+-ATPases on the apical and/or basolateral membrane and functionally reverse these processes, thus secreting bicarbonate.3,6 Thus, non–type A ICs mediate the excretion of an alkali load during alkalosis.2,3 Furthermore, a role of non–type A ICs in transcellular chloride reabsorption via pendrin has been extensively demonstrated.7–13
The H+-ATPase comprised at least 13 subunits. Among those, the B subunit plays an essential role in H+-ATPase function. This subunit is part of the peripheral catalytic V1 domain and exists in two highly homologous isoforms: B1 and B2.14 The B2 subunit is ubiquitous and mainly mediates the acidification of intracellular organelles. The B1 subunit, on the contrary, has been identified in a limited number of tissues, often in cells where plasma membrane H+-ATPases mediate proton extrusion. The B1 subunit is expressed in specialized cells of the epididymis,15–17 the vas deferens, the ciliary body of the eye,18 in the inner ear,19 the thick ascending limb of the loop of Henle, and in all subtypes of ICs in the kidney.17,20,21
Mutations in the gene encoding the B1 subunit (ATP6V1B1) cause distal renal tubular acidosis (dRTA) in man, characterized by the inability of the distal nephron to appropriately acidify the urine.19,22 A mouse model deficient for the Atp6v1b1 gene showed impaired H+ secretion by type A ICs in the CD.23,24 Moreover, in the absence of the B1 subunit, the B2 subunit is upregulated in type A ICs and assumes a more apical localization.25 Nevertheless, apical pumps containing the B2 instead of the B1 isoform fail to be stimulated by acidosis or angiotensin II.25,26 These findings demonstrate the importance of the B1 subunit as a part of the apical H+-ATPase complex for normal type A ICs function. However, the function of H+-ATPases containing the B1 subunit in non–type A ICs has remained elusive to date.
Basolateral H+-ATPases in non–type A ICs are thought to be important for H+ secretion into blood during alkalosis. Alkalosis causes hypertrophy of non–type A ICs with amplification of the basolateral plasma membrane and the insertion of proton pumps into this membrane.3 Thus, ICs respond to metabolic alkalosis by increasing bicarbonate secretion via pendrin activation and enhancement of proton absorption by the H+-ATPase across the basolateral membrane of type B IC.
In non–type A ICs, H+-ATPases are thought to be the main energizer of transport functions and to act in series with pendrin (PDS).27 PDS is expressed exclusively in the apical membrane of non–type A ICs in the distal convoluted tubule, CNT, and cortical collecting duct (CCD).28 Its abundance, localization, and presence have been linked to non–type A IC functions, such as bicarbonate secretion and chloride absorption.6,7,9,11,12,29 However, pendrin deficient mice are not spontaneously alkalotic but fail to excrete bicarbonate or to maintain BP when challenged with an alkali load under the form of the combination of the aldosterone analog deoxycorticosterone acetate (DOCA) and NaHCO3 application or during dietary NaCl restriction.12,30
Here, we used a mouse model lacking the B1 subunit (Atp6v1b1−/−) to test for a role of H+-ATPases containing the B1 isoform in the function of non–type A ICs. Our data demonstrate that B1 subunit is critical for normal basolateral pump assembly and non–type A ICs function in the defense against alkalosis caused by two different conditions.
Methods
Animals
All experiments were performed using age-matched male Atp6v1b1 wildtype (Atp6v1b1+/+) and Atp6v1b1 knockout (Atp6v1b1−/−) littermate mice (3–4 months old), genotyped as previously described.31 All experiments were performed according to Swiss Animal Welfare laws and were approved by the local veterinary authority (Veterinäramt Zürich) under license number ZH134/2020.
Metabolic Study
Atp6v1b1+/+ and Atp6v1b1-/- were housed in metabolic cages (Tecniplast, Buguggiate, VA, Italy). Mice were given deionized water ad libitum and were fed with a standard powdered laboratory chow (Kliba Nafag, Augst, Switzerland) in the first 2 days. Mice were allowed to adapt to metabolic cages for 1 day. Then, one 24-hour urine sample was collected under light mineral oil with thymol as preservative in the urine collector to determine daily urinary parameters. For DOCA/NaHCO3 treatment, drinking water was changed to 0.28 M NaHCO3, 2% sucrose solution, and mice received one intraperitoneal injection of 2 mg DOCA in 50 µl dimethyl sulfoxide (DMSO) at the beginning of the 4 days of treatment. For the chronic furosemide treatment, mice were intraperitoneally injected every 12 hours during 7 days with 20 mg/kg body weight furosemide dissolved in a solution of DMSO/saline (50/50 v/v). Body weight, food and water intake, and urine excretion were daily monitored. At the day of sacrifice, retro-orbital blood samples were taken under light isoflurane anesthesia. Then, animals were deeply anesthetized for plasma and kidneys sampling.
Analytic Procedures
Blood pH, pCO2, and electrolytes were measured with a blood–gas analyzer (Epoc blood gas analysis system, Siemens, Germany). Urinary pH was measured with a pHmeter (Metrohm AG, Zofingen, Switzerland). Creatinine, phosphate, ammonium, and calcium were measured on an UniCel DxC 800 Synchron Clinical System Automat (Beckman Coulter GmbH, Germany).
Whole-Body Plethysmography
Respiratory function was assessed in awake and unrestrained mice using a whole-body plethysmograph (Buxco, Winchester, United Kingdom).32 Animals were placed in chambers and allowed to adapt to their new environment for 30 minutes followed by 30-minute recording of breathing in normal atmosphere (air). The experiment was conducted on animals fed with a normal diet or after 4 days of treatment with DOCA/HCO3−.
Microperfusion Studies
The composition of the various solutions is presented in Supplemental Table 9. In nominally Na+-free solutions, Na+ was isosmotically replaced with N-methyl-D-glucamine (NMDG+). Cl−-free solutions contained equimolar gluconate as a replacement for Cl−. We compensated for Ca2+ chelated by Cl− substitutes by increasing total Ca2+ concentration from 2 to 7.5 mM in Cl−-free solutions.
Tubule Isolation
For the isolation of tubules, mice were deeply anesthetized with Xylazine/Ketamine i.p. Both kidneys were removed and cut into thin coronal slices for tubule dissection. CCDs were isolated from corticomedullary rays at 6°C in the dissection solution (solution A table) under a dissecting microscope with sharpened forceps.
Intracellular pH Measurement in Isolated CCDs
Microperfusion experiments were conducted, as previously described.33 In brief, dissected CCDs were transferred to the bath chamber on the stage of an inverted spinning disc microscope (IX81, Olympus, Japan). The average tubule length exposed to bath fluid was limited to 300 µm to prevent motion of the tubule. Intracellular pH in CCD cells was assessed with imaging-based, dual-excitation wavelength fluorescence microscopy with the use of the fluorescent probe 2′,7′-Bis-(2-carboxyethyl)-5-(and-6)-carboxyfluorescein, acetoxymethyl ester (BCECF-AM, Invitrogen). Tubules were loaded for 20 minutes at 37°C with 5 µM of the BCECF-AM added to the peritubular fluid. The loading solution was then washed out to remove all non–de-esterified dye by initiation of bath flow, and the tubule was equilibrated with a dye-free bath solution for 10 minutes. Bath solution was warmed to 37°C by water jacket immediately upstream to the chamber.
Intracellular dye was excited alternatively every 2 seconds at 434 and 494 nm with a MT fluorescence light source (150 W Xenon/Mercury mixed gas burner), including a light guide and coupling to the disk scan Unit (Olympus, Japan). Emitted light was collected through a dichroic mirror, passed through a 530 nm filter, and focused onto an EM-CCD camera (Hamamatsu, Japan) connected to a computer. The measured light intensities were digitized with the CellM&CellR imaging hardware system (Olympus, Japan) for further analysis. For each tubule, 1–4 non–type A ICs were analyzed, and the mean gray level was measured. Intracellular dye was calibrated at the end of each experiment using the high (K+)-nigericin technique. Tubules were perfused and bathed with a HEPES-buffered, 90 mM K+ solution (Supplemental Table 9 solution B), containing 10 μM of the K+/H+ exchanger nigericin (Sigma-Aldrich, Buchs, Switzerland). Four different calibration solutions, titrated with Tris to pH 5, 6, 7, and 8, were used.
Intrinsic Buffering Capacity Determination
The intrinsic buffering capacity (βi) of CCD cells was determined, as reported previously,34 using a 40 mM NH4Cl basolateral pulse to acidify cells (Supplemental Table 9, solution C and solution D). To exclude HCO3−/CO2 as a buffering component and block Na+-dependent pHi regulatory mechanisms, Na+-free, HEPES-buffered solutions were used in the perfusate; the bath contained 1 mM amiloride (to inhibit Na+/H+ exchangers), and bath and perfusate also contained 100 μm Sch28080 (to block H+/K+-ATPases) and 200 nM concanamycin A (to block H+-ATPases). Addition of 40 mm NH4Cl to the bath induced an increase followed by a decrease in pHi. The pKa of ammonium (9.03) was used to calculate the intracellular NH4+ concentration when cell acidification plateaued. βi was calculated as the ratio of the change in intracellular NH4+ concentration to the change in pHi. Therefore, we determined the correlation between intracellular pH and βi, which was (980.4–133.5 pHinitial) in non–type A ICs from Atp6v1b1+/+ and (138.3–18.06 pHinitial) in non–type A ICs from Atp6v1b1−/− mice (Supplemental Figure 1).
Calculation of Base and Proton Flux Values
Base flux (Jbase) values (in pmol/min/mm) were calculated using the following equation: Jbase or JH+=dpHi/dt×βtotal×V, where dpHi/dt is the initial rate of change in pHi (in pH units/min), βtotal is the buffering capacity (in mM/pH unit/L), and V is the cell volume (in nl). In the presence of CO2/HCO3−, βtotal is equal to βi+2.3×(HCO3−)i, where (HCO3−)i is intracellular HCO3− concentration, calculated as follows: (HCO3−)i=0.03PCO2×10(pHi−6.10), with the assumption that intracellular PCO2 equals extracellular PCO2 (37 mm Hg). In the absence of CO2/HCO3−, βtotal is equal to βi. V was calculated by determining the volume of the non–type A ICs (depending on the shape of the cells, either a sphere volume formula 4/3πR3 or an ellipsoid one 4/3πabc, where b and c were assumed to be identical, was used). A positive value of Jbase indicates a net base influx.
Pendrin Activity Measurements
Two sodium-free solutions were used, differing in their chloride concentration (Supplemental Table 9 solutions E and F). All solutions were adjusted to pH 7.40 and continuously bubbled with 95% O2/5% CO2. The tubule was loaded with BCECF-AM in a control NaCl solution for 15 minutes, as described above. Then, the tubule was bathed with the Cl−-free solution and perfused with the Cl−-containing solution during the equilibration period. During the fluorescence recording, the Cl−-containing solution was delivered to the perfusion pipette via a chamber under an inert gas (N2 pressure around 1 bar) connected through a manual six-way valve. With this system, opening of the valve instantaneously activated the flow of one solution. Most of the fluid delivered to the pipette exited the rear of the pipette system through a drain port at a rate of 4 ml/min. This method resulted in a smooth and complete exchange of the luminal solution in <3–4 seconds. After 1-minute recording, luminal fluid was instantaneously replaced by the corresponding Cl−-free solution for 1 minute.
For the experiments in the absence and presence of peritubular isoproterenol, pendrin activity was first assess in the absence of isoproterenol, as described above, using solutions E and F. Afterward, the tubule was equilibrated 2 minutes in the peritubular presence of 1 µM isoproterenol, and pendrin activity was again measured on the same cells.
H+-ATPase Activity Measurements in Non–Type A IC
After loading with BCECF-AM, pendrin activity was assessed on CCDs to identify non–type A IC. Then, the tubules were bathed and perfused 10 minutes in a NaHCO3−–free solution (Supplemental Table 9 solution G) in the luminal presence of 200 nM concanamycin (Sigma-Aldrich, St. Louis, MO), an H+-ATPase inhibitor and 100 µM Sch28080 (Tocris, Biosciences, United Kingdom) and an H+/K+-ATPase inhibitor to inhibit H+ exit at the luminal side of the cells. Fluorescence recording was initiated for 2 minutes, and the bath solution was changed to a solution containing 20 mM NH4Cl (Supplemental Table 9 solution H) during 2 minutes that elicited a rapid intracellular alkalinization, followed by a sharp acidification. After the acidification reached a plateau, NH4Cl was removed from the bath (Supplemental Table 9 solution G) to further acidify cells and initiate direct H+ excretion with a maximum rate. All measurements were performed at maximum rate for the determination of H+-ATPase activity, which was measured on non–type A ICs (i.e., pendrin activity positive cells).
Immunohistochemistry
Four-day alkali-loaded Atp6v1b1+/+ and Atp6v1b1−/− mice were anesthetized with ketamine/xylazine i.p. and perfused through the left heart ventricle or renal artery with a prefixative solution (1000 U/ml heparin, 0.2% procaine–HCl, 3.2% CaCl2, and 0.18% NaCl) followed by the fixative 3% paraformaldehyde in PBS/PBS. After incubation in paraformaldehyde/PBS for 1 hour, kidneys were placed overnight in 32% sucrose/PBS and subsequently embedded in optimal cutting temperature Embedding Matrix (Cell Path, Newtown, Wales, the United Kingdom) and frozen in liquid propane. Cryosections of 1 μm were mounted on slides (Superfrost Plus, Thermo Scientific). Autofluorescence from free aldehyde sites was quenched by incubating slides in a 50 mM NH4Cl/PBS solution for 20 minutes. Sections were then treated with 1% SDS/PBS for 5 minutes, washed with PBS, and blocked with 1% BSA/PBS. After blocking, sections were incubated with primary antibodies (Supplemental Table 10) diluted in 1% BSA in PBS for incubation overnight at 4°C. Then, samples were washed three times with PBS and incubated with the secondary antibodies (donkey anti-rabbit 594, donkey anti-guinea pig 488, and donkey anti-goat pig 647 [Molecular Probes] at 1:1000 and 4′,6-diamidino-2-phenylindole at 1:1000) during 2 hours at room temperature. After three consecutive washing steps with PBS, coverslips were mounted with glycergel (DakoCytomation, Baar, Switzerland). Sections were visualized with a Leica DMR microscope equipped with a Leica DFC320 camera (Leica microsystems, Germany). Images were transferred using the Leica TFC Twain 6.1.0 program and processed using Adobe Photoshop.
Proximity Ligation Assay
In situ ligation between A and a4 subunits and E and a4 subunits, respectively, was performed on 1 μm thick kidney cryosections from Atp6v1b1+/+ Atp6v1b1−/− mice following the manufacturers' protocol (Duolink in situ proximity ligation assay anti-rabbit plus, Sigma-Aldrich, St. Louis, MO). In brief, 1 μm sections were first incubated 20 minutes in a 50 mM NH4Cl-PBS solution and then 5 minutes in a 1% SDS/PBS solution for cell permeabilization. Then, nonspecific epitopes were blocked in the blocking solution 1 hour at 37°C in a humid chamber. The primary antibodies for pendrin (guinea pig anti-pendrin), a4 (rabbit anti-a4), and E (mouse anti-E) were added to the first section and pendrin (guinea pig anti-pendrin), a4 (rabbit anti-a4), and A (mouse anti-A) to the second section (Supplemental Table 10) and incubated overnight in a humid chamber at 4°C. The next day, the in situ ligation was performed using probes specific to mouse and rabbit antibodies (Plus and Minus probes). After the ligation and amplification steps, the slides were mounted with the Duolink mounting medium, including 4′,6-diamidino-2-phenylindole dye.
Pictures acquisition was performed using a SP8 upright Falcon confocal microscope (Leica microsystems, Germany). Images were processed and assembled using Adobe Photoshop. For each kidney, at least ten images were acquired. Ligation between a4 and E and a4 and A was visualized by red dots. For a4-E reaction red dots at the basolateral membranes of pendrin-positive cells were counted and data plotted.
Immunoblotting
Total membrane fractions were prepared from 4 days of DOCA/NaHCO3-treated Atp6v1b1+/+ and Atp6v1b1−/− mouse kidneys. Frozen kidneys were homogenized in an ice–cold K-HEPES buffer (200 mM mannitol, 80 mM HEPES, 41 mM KOH, pH 7.5) containing a protease inhibitor mix (Complete Mini, Roche Diagnostics, Germany) at a final concentration of 1 tablet in a volume of 10 ml solution. Samples were centrifuged at 2000 rpm for 20 minutes at 4°C. Subsequently, the supernatant was transferred to a new tube and centrifuged at 41,000 rpm for 1 hour at 4°C. The resultant pellet was resuspended in K-HEPES buffer containing protease inhibitors.
Up to 50 μg of total membrane proteins were solubilized in Laemmli loading buffer containing 10% dithiothreitol and separated on 8%–10% polyacrylamide gels. For immunoblotting, proteins were transferred electrophoretically to polyvinylidene fluoride membranes (Immobilon-P, Millipore Corp., Bedford, MA). Total protein was quantified using the Revert Total Protein Stains for Western Blot Normalization assay and an Odyssey Imaging system following the manufacturers' protocol (LI-COR Biosciences, NE). After blocking with 5% milk powder in PBS for 60 minutes, blots were incubated with primary antibodies (see Supplemental Table 10) overnight at 4°C. After washing and blocking with 5% milk powder for 60 minutes, membranes were incubated for 2 hours at room temperature with secondary goat anti-rabbit or donkey anti-mouse antibodies 1:5000 linked to alkaline phosphatase (Promega, Madison, WI). The protein signal was detected with the appropriate substrate (Millipore Corp, Bedford, MA) using the LAS 4000 image analyzer system (Fujifilm Life Science). All images were analyzed using ImageJ to calculate the protein of interest/total protein ratio.
Statistics
Data are shown as means± SEM. Comparisons between experimental conditions were performed using nonparametric ANOVA (Kruskal–Wallis test) or one-way ANOVA of variance with the Bonferroni test. P values of ≤0.05 were considered to indicate statistical significance.
Results
Absence of the B1 Subunit Enhances Susceptibility to Metabolic Alkalosis
To test for a role of the B1 subunit in non–type A ICs, we induced metabolic alkalosis using the aldosterone analog desoxycorticosterone with NaHCO3 to the drinking water.30 Although Atp6v1b1−/− mice do not have any differences in acid–base blood parameters under baseline conditions,23,35 alkali loading resulted in significantly higher blood bicarbonate levels in Atp6v1b1−/− mice than in their control littermates (Figure 1B and Supplemental Table 1). Metabolic alkalosis was associated with hypochloremia and significantly lower potassium levels in Atp6v1b1−/− mice (Figure 1, C and D, and Supplemental Tables 1 and 2). Atp6v1b1−/− showed respiratory compensation with a decreased minute volume during the alkali load (Figure 1E). Before the alkali load, urine pH of Atp6v1b1−/− mice was significantly more alkaline (Figure 1F and Supplemental Table 2). Alkali loading increased urine pH to a similar extent in Atp6v1b1−/− and Atp6v1b1+/+ mice (Figure 1F and Supplemental Table 2).
Figure 1.
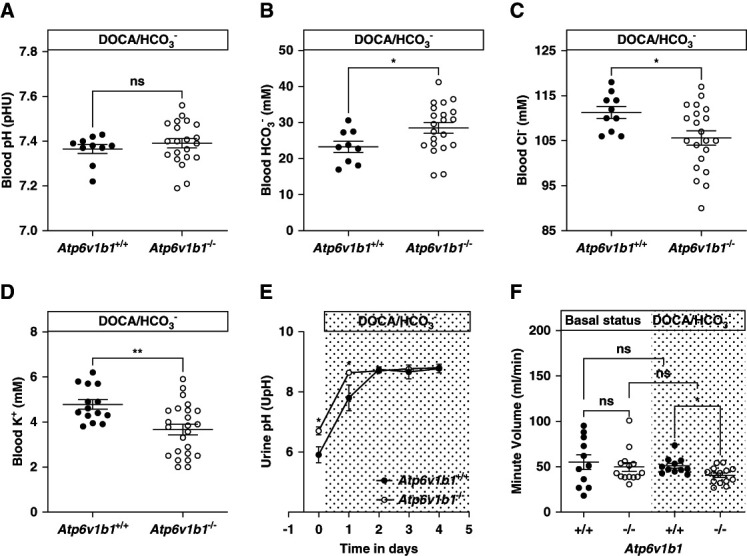
Metabolic parameters of Atp6v1b1+/+ and Atp6v1b1−/− male mice under 4 days of DOCA/NaHCO3 treatment. After 4 days of DOCA/NaHCO3 treatment, Atp6v1b1−/− mice exhibit (A) no difference in blood pH, (B) increased HCO3− level, (C) hypochloremia, and (D) hypokalemia. (E) The respiratory minute volume (ml/min) in Atp6v1b1−/− mice was similar to Atp6v1b1+/+ mice under basal conditions (2.00±0.21 [14] versus 1.91±0.31 [11]) but significantly lower after 4 days of DOCA/NaHCO3 treatment (1.49±0.09 [14] versus 1.60±0.10 [11]). (F) Urinary pH before and during the alkali load in Atp6v1b1+/+ and Atp6v1b1−/− mice. Values are mean±SEM. Statistical significance was assessed by the unpaired t test. *P ≤ 0.05, **P ≤ 0.01. DOCA, deoxycorticosterone acetate.
Chronic treatment with loop diuretics, such as furosemide, can cause hypokalemic metabolic alkalosis.36,37 Atp6v1b1−/− mice treated with furosemide for 7 days higher blood bicarbonate levels, lower chloride, and lower potassium levels compared with their littermate Atp6v1b1+/+ mice (Figure 2 and Supplemental Table 3). During the chronic phase, they did not decrease their urine pH below 6 and exhibited a more alkaline urine and a urinary chloride loss at the end of the treatment as a steady state (Figure 2 and Supplemental Table 3). Moreover, Atp6v1b1−/− mice developed more pronounced diuresis, whereas creatinine clearance was not different between genotypes (Supplemental Table 3).
Figure 2.
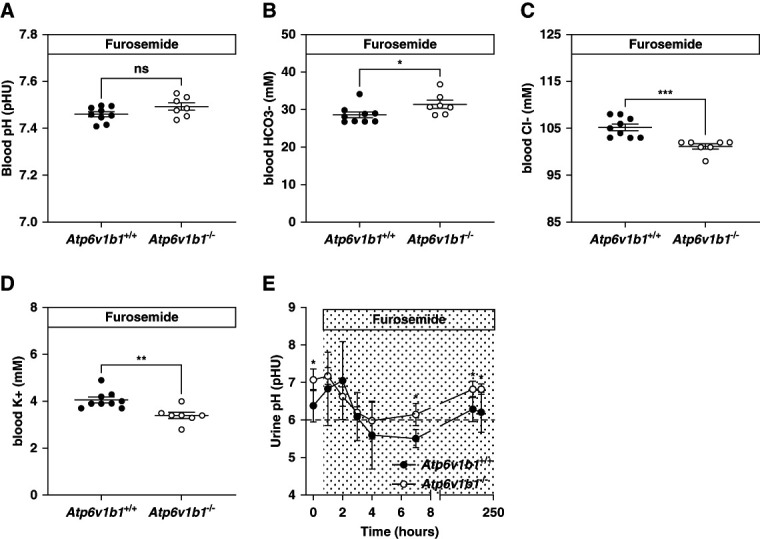
Metabolic parameters of Atp6v1b1+/+ and Atp6v1b1−/− male mice under chronic furosemide treatment. After 7 days of furosemide treatment, Atp6v1b1−/− mice exhibit (A) no difference in blood pH, (B) increased HCO3− level, (C) hypochloremia, and (D) hypokalemia. (E). Urinary pH evolution before and during the furosemide treatment in Atp6v1b1+/+ and Atp6v1b1−/− mice. Values are as mean±SEM. Statistical significance was assessed by the unpaired t test. *P ≤ 0.05, **P ≤ 0.01, ***P ≤ 0.001 versus Atp6v1b1+/+ mice.
Thus, in the absence of the B1 H+-ATPase subunit, mice are more susceptible to metabolic alkalosis suggesting an important role of the multimeric H+-ATPase protein in the clearance of alkali.
Pendrin Expression and Activity Depends on B1-Containing H+-ATPases
Under alkali loading with bicarbonate or furosemide, total pendrin protein expression was lower in Atp6v1b1−/− mice (Figure 3, A and B). Pendrin was found in the CNT and CCD localized toward the apical pole in a subpopulation of ICs both in Atp6v1b1+/+ and Atp6v1b1−/− mouse kidneys (Figure 4A). Thus, the total abundance of pendrin was reduced, but its apical localization was preserved.
Figure 3.
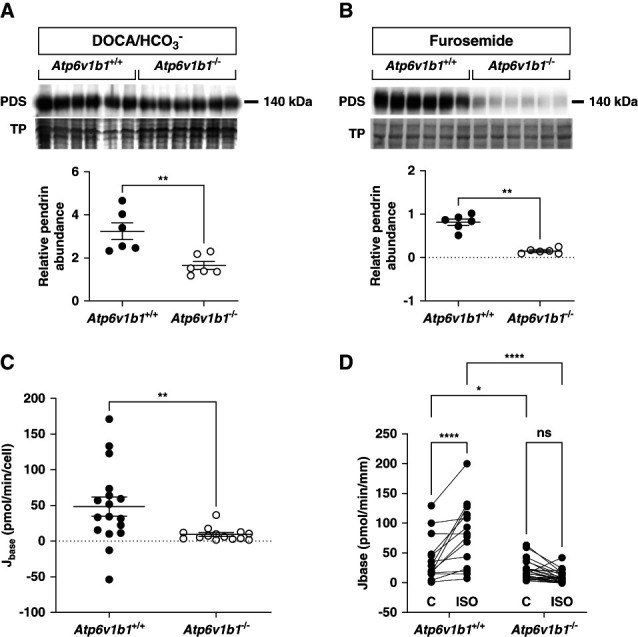
Pendrin expression and activity in non–type A ICs from alkali-loaded Atp6v1b1+/+ and Atp6v1b1−/− male mice. (A and B) Pendrin abundance was reduced in kidney tissue from 4 days DOCA/NaHCO3 or chronic furosemide-treated Atp6v1b1−/− mice compared with Atp6v1b1+/+ mice. (C) Apical base flux (Jbase) related to pendrin activity was reduced in the ex vivo microperfused CCD from DOCA/NaHCO3-treated Atp6v1b1−/− mice. (D) Base flux (Jbase) related to pendrin activity was measured before and after adding 1 µM isoproterenol (ISO) to the peritubular bath solution of ex vivo microperfused CCDs from 4 days DOCA/HCO3−-treated Atp6v1b1+/+ and Atp6v1b1−/− mice. Values are as mean±SEM. Statistical significance was assessed by the unpaired t test. *P ≤ 0.05, **P ≤ 0.01, ****P ≤ 0.0001. CCD, cortical collecting duct; IC, intercalated cell.
Figure 4.
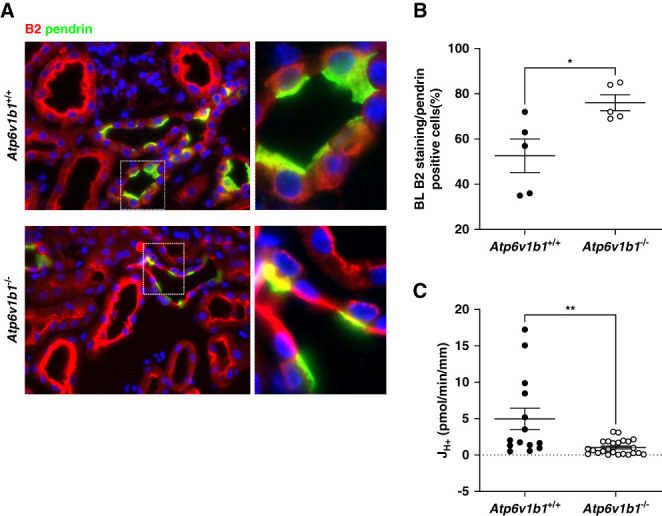
Basolateral B2 H+-ATPase subunit and H+-ATPase activity in non–type A ICs from alkali-loaded Atp6v1b1+/+ and Atp6v1b1−/− male mice. (A) Representative fluorescence images of pendrin (green) and B2 (red) stainings in kidney sections from 4 days DOCA/HCO3−-treated Atp6v1b1+/+ and Atp6v1b−/− mice showing CNTs. The B2 H+-ATPase subunit was found mostly in the cytosol of non–type A ICs in kidneys of Atp6v1b1+/+ animals, whereas a more pronounced B2 staining at the basolateral side was observed in non–type A ICs of Atp6v1b1−/− mice. (B) Quantification of B2 staining at the basolateral side of non–type A ICs (pendrin-positive cells). B2 was significantly more localized at the basolateral side of non–type A ICs in Atp6v1b1−/− mice. (C) Proton flux (JH+) related to basolateral H+-ATPase activity was reduced in the ex vivo microperfused CCD from DOCA/NaHCO3-treated Atp6v1b1−/− mice. Values are as mean±SEM. Statistical significance was assessed by the unpaired t test. *P ≤ 0.05, **P ≤ 0.01, ****P ≤ 0.0001. CNT, connecting tubule.
Next, we measured pendrin activity in isolated microperfused CCDs from alkali-loaded mice. We could not directly compare the rate of alkalinization between cells from wildtype and knockout tissues as intracellular buffering capacity, and cell volumes were unexpectedly and drastically reduced in non–type A ICs from Atp6v1b1−/− mice (Supplemental Figure 1 and Supplemental Table 4). We calculated base flux (Jbase) considering intracellular buffering power and cell volume. Pendrin activity was reduced by more than 80% in non–type A ICs from Atp6v1b1−/− mice compared with Atp6v1b1+/+ littermates (Figure 3C and Supplemental Table 4).
Pendrin Activity is No Longer Stimulated by cAMP in the Absence of the B1 Subunit
Pendrin activity is stimulated by β2-adrenergic–dependent formation of cAMP in the CCD.38–40 We therefore investigated the effect of the β2-adrenergic agonist isoproterenol. Base flux related to pendrin activity was reduced in non–type A IC from Atp6v1b1−/− mice. Application of isoproterenol to the basolateral side of non–type A ICs strongly stimulated Jbase in CCDs from Atp6v1b1+/+ mice, while it had little effect in non–type A ICs from Atp6v1b1−/− mice (Figure 3D and Supplemental Table 5).
H+-ATPase Activity is Decreased at the Basolateral Side of Non–Type A ICs Despite an Increased Basolateral Accumulation of the B2 Subunit
The absence of the B1 subunit in type A ICs is partly compensated by enhanced abundance of the B2 isoform, which however fails to support stimulation of H+-ATPase activity by acidosis or angiotensin II.22,23,25,26 Immunohistochemistry on kidneys from alkali-loaded mice showed diffuse staining for the B2 subunit toward the basolateral membrane of pendrin-positive ICs in Atp6v1b1+/+ and a stronger and more pronounced basolateral B2 staining in pendrin-positive ICs in Atp6v1b1−/− mice (Figure 4, A and B, and Supplemental Table 6). Thus, we assessed whether basolateral H+-ATPase activity, necessary for proton reabsorption and bicarbonate secretion by non–type A IC, is affected by Atp6v1b1 gene deletion. Non–type A ICs were functionally identified in microperfused CCDs by first measuring pendrin activity. Then, we examined basolateral H+-ATPase activity by measuring the rate of alkalinization after acidification of the cells by a basolateral ammonium chloride pulse in pendrin-positive cells and calculated H+ fluxes, considering cell volume and intracellular buffering power (Supplemental Figure 1 and Supplemental Table 5). H+ fluxes (JH+) were reduced in non–type A ICs from Atp6v1b1−/− mice (Figure 4C and Supplemental Table 7). Immunoblotting of the a4, A, and B2 subunits in kidneys from either DOCA/HCO3− or furosemide-treated Atp6v1b1+/+ and Atp6v1b1−/− mice showed no difference in gross abundance of these subunits (Figure 5).
Figure 5.
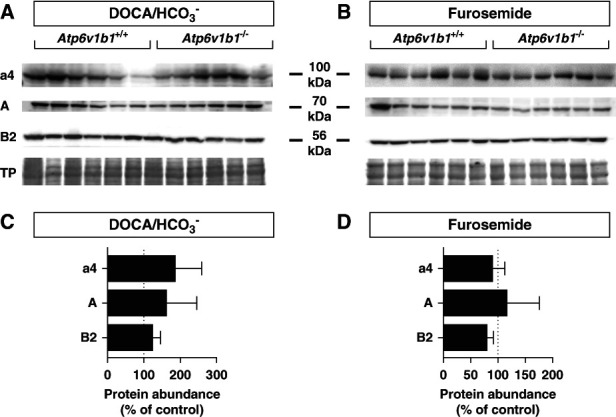
Expression of H+-ATPase subunits in alkali-loaded Atp6v1b1+/+ and Atp6v1b1−/− male mice kidneys. Western blot analysis of the a4, A, and B2 subunits of H+-ATPase subunits in membrane fractions from (A) DOCA/HCO3−-loaded or (B) furosemide-treated Atp6v1b1+/+ and Atp6v1b1−/− mice. (C and D) Quantification of relative protein abundance of each subunit normalized to total protein (TP) abundance and expressed as percentage from wildtype animals. No significant difference was observed between groups, n=6/genotype and treatment.
The Multimeric H+-ATPase is Not Fully Assembled in Non–Type A ICs Lacking the B1 Subunit
To further examine the abundance, localization, and assembly of H+-ATPases in the CNT and CCD, we performed immunostaining against the a4, A, and E subunits. The a4 subunit belongs to the membrane bound V0 domain, whereas the A subunit forms part of the cytosolic V1 domain.5 E is also part of the V1 domain and helps forming the stalk connecting to the V0 domain.5 In kidneys from alkali-loaded Atp6v1b1+/+ mice, antibodies against the a4, A, or E subunits clearly labeled the basolateral membrane of pendrin-positive ICs (Figure 6), as described previously.41–44 In the CCD of Atp6v1b1−/− mice, staining for the membrane bound a4 subunit was preserved at the basolateral membrane of pendrin-positive ICs (Figure 6, A and B). By contrast, the A and E subunits showed mostly a diffuse and cytoplasmic or a clear apical staining and were almost absent from the basolateral side (Figure 6, C–F).
Figure 6.

Immunolocalization of H+-ATPases subunits at the basolateral side of non–type A ICs from 4 days of DOCA/HCO3−-treated Atp6v1b1+/+ and Atp6v1b1−/− male mice. Pendrin protein was stained in green to identify non–type A ICs and nuclei in blue (4',6-diamidino-2-phenylindole). (A and B) The V0 domain a4 subunit (red) was preserved at the apical and basolateral membranes of non–type A ICs in Atp6v1b1−/− mice. (C and D) The staining for the V1 domain A subunit (red) was less intense at the basolateral membrane of non–type A ICs from Atp6v1b1−/− mice compared with their littermate controls. (E and F) The V0–V1 stalk E subunit (red) was present both at the apical and basolateral side of non–type A ICs from Atp6v1b1+/+ mice but not detectable at the basolateral side of non–type A ICs in kidney sections from Atp6v1b1−/− mice. All images show CCDs. Original magnification ×400.
To test whether weak staining of A and E subunits at the basolateral side of pendrin-positive cells would be associated with reduced assembly of the multimeric H+-ATPase, we performed in situ proximity ligation assay for the a4 subunit as representative of the V0 domain with either the A or the E subunits parts of the V1 domain. The number of dots, representative of the assembly of the multimeric H+-ATPase, at the basolateral side of pendrin-positive ICs was drastically reduced in kidneys from Atp6v1b1−/− mice (Figure 7, Supplemental Figure 2, and Supplemental Table 8). Similarly, we found also reduced accumulation of dots at the apical side of pendrin-negative cells in the CNT/CDD in kidneys from Atp6v1b1−/− mice consistent with the previously reported defect in apical H+-ATPase assembly in the absence of B1 subunits (Supplemental Figure 3).45
Figure 7.
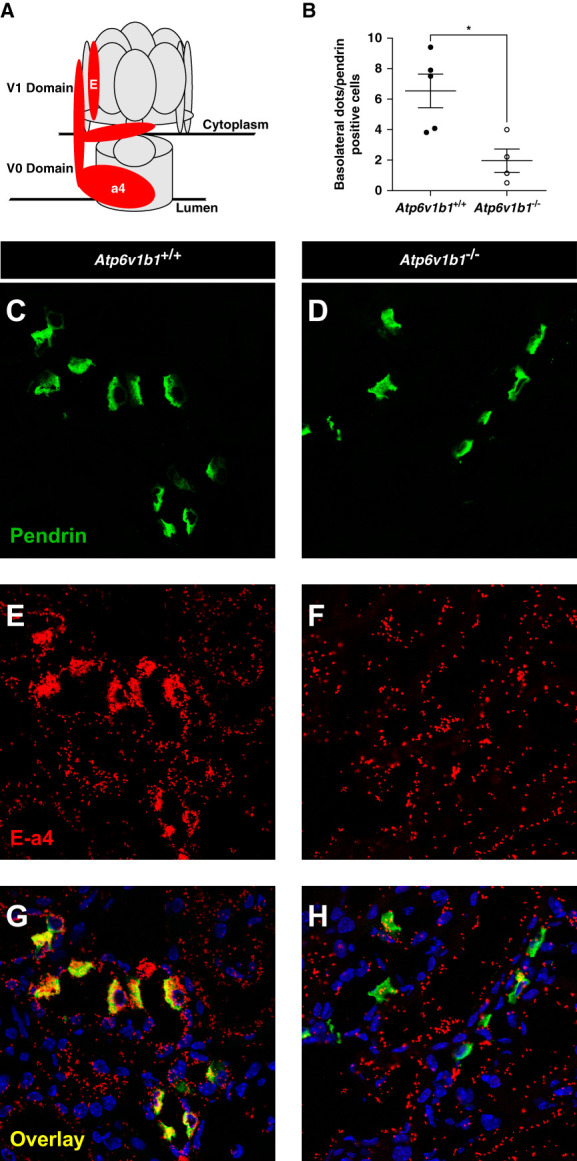
Quantification of basolateral H+-ATPase assembly in non–type A ICs from 4 days of DOCA/HCO3−-treated Atp6v1b1+/+ and Atp6v1b1−/− male mice. (A) Structure and spatial representation of the multimeric H+-ATPase protein. a4 and E subunits are highlighted in red. (B) Quantification results of the assembly of a4 and E subunits at the basolateral side of non–type A ICs. (C and D) Pendrin protein was stained in green to identify non–type A ICs. (E and F) The in situ proximity ligation assay was performed between the V0 subunit a4 and the stalk subunit E. Ligation between the two subunits was identified by red dots. (G and H) Overlay stainings in kidney sections from 4 days of DOCA/HCO3−-treated Atp6v1b1 littermate mice; pendrin (green), in situ proximity ligation between a4 and E (red), nuclei (blue). Values are as mean±SEM. Statistical significance was assessed by the unpaired t test. *P ≤ 0.05 versus Atp6v1b1+/+.
Discussion
H+-ATPases are expressed in all types of renal epithelial cells.5 However, in the kidney, the B1 subunit isoform is almost exclusively expressed in ICs with only low abundance also in the thick ascending limb and the distal convoluted tubule.20,21,46 However, the function of B1 isoform in non–type A ICs has remained incompletely understood.11 We show here that this isoform plays an essential role in the assembly of the basolateral pump, the function and regulation of pendrin, and the renal defense against metabolic alkalosis associated with two different conditions. Non–type A ICs are important for two tightly linked functions, the secretion of bicarbonate during alkalosis, and the transcellular reabsorption of chloride to maintain NaCl and extracellular volume homeostasis. Both functions require the regulated activity of the apical chloride/bicarbonate exchanger pendrin that acts in concert with several other apical proteins, including cystic fibrosis transmembrane conductance regulator (CFTR), to maintain bicarbonate secretion or the Na+-dependent chloride/bicarbonate exchanger (NDCBE) to allow net chloride absorption.47–49 Non–type A ICs may exist in at least two distinct states or forms: type B ICs and non–type A–non–type B ICs, which may be either truly distinct cell types or only different (functional) states of the same cell type with intermediate phenotypes and functions. In type B ICs, all H+-ATPases are localized to the basolateral side while in non–type A–non–type B ICs at the luminal side. Type B ICs would serve mostly the secretion of bicarbonate and the reabsorption of protons (while also reabsorbing chloride), while non–type A–non–type B ICs would mostly reabsorb chloride without any effects on acid–base balance. The presence of the NDCBE reabsorbing the secreted bicarbonate together with sodium in exchange for chloride adds further complexity. To the best of our knowledge, no data are available on the immunolocalization of this protein in kidney and whether it localizes to all type B and non–type A–non–type B ICs or only a subset. The coupling of NDCBE and pendrin activity has been suggested to occur at 1:2 stoichiometry when chloride absorption via this tandem is prioritized. Whether this is also true for states when bicarbonate secretion is increased, remains to be resolved. It should be also noted that many cells expressing pendrin show H+-ATPase label on apical and basolateral poles suggesting that additional intermediate states of these cell types may exist. Pharmacological evidence suggests that net chloride absorption by non–type A ICs is mainly energized by basolateral H+-ATPases.27 Our data clearly show that basolateral H+-ATPases that contain B1 subunits play a critical role in apical chloride/bicarbonate exchanger function and regulation and that this is important for secreting bicarbonate under conditions associated with metabolic alkalosis. Most of this apical chloride/bicarbonate exchanger activity in non–type A ICs is likely due to pendrin.29,50,51 Our experiments in microperfused CCDs demonstrate that this is relevant at least for all cell subtypes that rely on basolateral H+-ATPases in this segment, that is, type B ICs and those cells that express pendrin and proton pumps on both poles. Because we have previously shown that also apical H+-ATPases complexes in type A ICs require the B1 subunit, we speculate that also pendrin-expressing cells with only apical H+-ATPases may be affected by the defect. Thus, our model predicts that the absence of B1 reduces CO2 secretion and chloride absorption by non–type A ICs, also in the CNT that was not accessible to our microperfusion studies.
We used two different paradigms to induce metabolic alkalosis, the well-established DOCA/HCO3− treatment, and chronic treatment with furosemide.29,30 In both conditions, mice lacking the B1 subunit developed more pronounced hypokalemic metabolic alkalosis, a phenotype also observed in Pds−/−.30 Similarly, alkali-loaded mice lacking Cftr fail to stimulate pendrin and develop alkalosis.47,48 Like in Cftr-deficient mice,52 mice lacking the B1 subunit show altered respiration possibly helping to counter regulate metabolic alkalosis.
Metabolic alkalosis in Atp6v1b1−/− mice is likely due to the failure of non–type A ICs to excrete adequate amounts of bicarbonate into urine as both the apical Cl/HCO3 exchanger and the basolateral H+-ATPase activities are defective. In the absence of the B1 subunit, the expression of the B2 subunit of the H+-ATPase is increased at the basolateral side of non–type A ICs in Atp6v1b1−/− mice. A similar upregulation of B2 abundance and membrane localization has been described in type A ICs, lacking the B1 isoform.25,53 Here, we show for the first time that B2 can be targeted also to the basolateral side of non–type A ICs. However, the B2 isoform is not sufficient to allow basolateral H+-ATPase assembly and function. The assembly of the cytosolic V1 domain, including the A and E subunits with the membrane-associated V0 domain containing the a4 subunit, is largely decreased at the basolateral side of non–type A ICs, demonstrating that the B1 isoform is essential for a complete assembly of the multimeric protein, as previously hypothesized by Vedovelli et al.53 The failure of basolateral H+-ATPases to fully assemble affects also on the abundance of the apical chloride/bicarbonate exchanger pendrin, which is reduced. This reduction observed in total kidney lysates may reflect either the lower relative number of non–type A ICs and/or also lower expression per cell. The latter may be suggested by the reduced functional activity of pendrin. Moreover, also the stimulation of pendrin activity by cAMP is abolished in non–type A ICs lacking B1 explaining why Atp6v1b1−/− mice fail to respond to alkali loads. The molecular mechanism underlying this failure remains elusive but might include also reduced the expression of CFTR.
Two findings in the Atp6v1b1−/− mice are of interest: hypokalemia and more alkaline urine at baseline. In Pds−/− mice, alkaline urine is common and some models do also develop hypokalemia, suggesting that both features are linked to impaired non–type A ICs function. Hypokalemia can be caused both by shifts between extracellular and intracellular space or by renal potassium losses. Patients with dRTA due to ATP6V1B1 mutations as well as the Atp6v1b1−/− mice have renal potassium loss that has at least partly be attributed to excessive potassium secretion by the type A ICs apical BKCa channel.11 Similarly, more alkaline urine at baseline reflects primarily reduced type A ICs function. However, both Atp6v1b1+/+ and Atp6v1b1−/− during alkali loading alkalinized urine to the same extent; in B1-deficient mice, the plateau was even reached earlier. The kidney has several mechanisms to defend against alkalosis that include reduced ammoniagenesis, enhanced secretion of bicarbonate by the CD system, and a threshold of the proximal tubule to reabsorb bicarbonate that is set around 28 mmol/L. We speculate that in the absence of B1 H+-ATPase–dependent bicarbonate secretion by the CD, the proximal tubule threshold becomes important to limit the rise in blood bicarbonate, and this interpretation is supported by the blood bicarbonate levels of 28.5 mmol/L in the Atp6v1b1b−/− mice. Thus, urinary alkalinization in B1-deficient mice may instead reflect nonreabsorbed bicarbonate while in wildtype animals may be due to active secretion by the CD.
Impaired non–type A ICs function caused by the absence of the B1 isoform may also have clinical implications. Chronic treatment with diuretics, such as furosemide, can cause hypokalemic metabolic alkalosis.36,37,54 Chronic furosemide treatment causes in Atp6v1b1−/− mice a more severe alkalosis than in Atp6v1b1+/+ littermates. Gueutin et al. showed that in Atp6v1b1−/− mice, reduced pendrin activity causes the activation of the renin–angiotensin–aldosterone system.11 Similarly, our findings highlight the predominant role of non–type A ICs in maintaining water and NaCl homeostasis.11,55–57 The reduction in pendrin expression together with the likely defect in H+-ATPase activity as seen in the DOCA/HCO3− model explains the more pronounced alkalosis. Although extremely rare, the association of severe alkalosis with primary dRTA or Pendred syndrome has been reported in infants treated with thiazide diuretics.58–60
Overt or subclinical alkalosis can occur in different settings, such as in hypocapnia due to hyperventilation, after gastrointestinal acid losses with or without volume depletion, after a meal and stimulation of gastric acid secretion (“alkaline tide”), metabolism of mostly plant-based diets, use of diuretics such as thiazides or loop diuretics, iatric alkali prescription, or over the counter use of alkalinizing agents. Proton pump-driven expression and activity of pendrin and type B ICs will contribute to reestablishing acid–base balance under these conditions. Our animal model recapitulates only some conditions listed above; however, we address two different situations. The first model reflects the conditions of primary alkali loading, while the furosemide treatment represents a more complex situation characterized by renal distal salt and water losses, initial volume contraction with hypokalemia, stimulation of distal acid excretion, and compensatory changes in proximal tubule metabolism and transport causing metabolic alkalosis. Considering the widespread use of diuretics, our findings may have clinical implications in patients with impaired IC functions.
In summary, our data reveal a critical role of basolateral H+-ATPases in non–type A ICs and demonstrate that the B1 H+-ATPase subunit is required for normal pump assembly and function. The disruption of basolateral pumps impairs apical chloride/bicarbonate exchanger activity activity, stimulation, and pendrin expression, leading to more pronounced metabolic alkalosis.
Supplementary Material
Acknowledgments
We thank Dr. Stephen Gluck, CA, and Dr. Johannes Loffing, University of Zurich, Switzerland, for providing various antibodies. We also acknowledge support from the ZIRP Core facility for rodent physiology and the Zurich Center for microscopy and Image analysis. We particularly thank Dominik Hänni for his expertise and help in establishing the quantification of Proximity Ligation Assay experiments. We thank Prof. Pascal Houillier, Paris, France, for fruitful discussions.
Disclosures
C.A. Wagner reports Honoraria: Advicenne, Kyowa Kirin, and Medice; and Other Interests or Relationships: Bayer AG. All remaining authors have nothing to disclose.
Funding
This work was supported by a grant from the Swiss National Science foundation (212308) to C.A. Wagner.
Author Contributions
Conceptualization: Soline Bourgeois, Andrew Hall, Carsten A. Wagner.
Data curation: Soline Bourgeois.
Formal analysis: Soline Bourgeois, Jana Kovacikova.
Funding acquisition: Carsten A. Wagner.
Investigation: Carla Bettoni, Soline Bourgeois, Milica Bugarski, Nicole Gehring, Jana Kovacikova.
Project administration: Carsten A. Wagner.
Resources: Carsten A. Wagner.
Supervision: Carsten A. Wagner.
Validation: Soline Bourgeois.
Writing – original draft: Soline Bourgeois, Carsten A. Wagner.
Writing – review & editing: Carla Bettoni, Milica Bugarski, Nicole Gehring, Andrew Hall, Jana Kovacikova, Carsten A. Wagner.
Data Sharing Statement
All data is included in the manuscript and/or supporting information.
Supplemental Material
This article contains the following supplemental material online at http://links.lww.com/JSN/E550.
Supplemental Table 1. Blood parameters from Atp6v1b1+/+ and Atp6v1b1−/− male mice treated with DOCA/NaHCO3 for 4 days.
Supplemental Table 2. Metabolic and urine parameters from control, 2, and 4 days of DOCA/NaHCO3-treated Atp6v1b1+/+ and Atp6v1b1−/− male mice.
Supplemental Table 3. Blood and urine values Atp6v1b1+/+ and Atp6v1b1−/− male mice at the end of the 9-day furosemide treatment.
Supplemental Table 4. Measured and calculated parameters used to determine pendrin activity in non–type A ICs in microperfused CCDs from Atp6v1b1+/+ and Atp6v1b1−/− male mice after 4 days of DOCA/HCO3 loading.
Supplemental Table 5. Measured and calculated parameters used to determine pendrin activity in non–type A ICs in microperfused CCDs from Atp6v1b1+/+ and Atp6v1b1−/− male mice after 4 days of DOCA/HCO3 loading in the absence and the presence of 1 μM basolateral isoproterenol.
Supplemental Table 6. Atp6v1b2 (B2) H+-ATPase subunit staining at the basolateral side of pendrin-positive cells in kidneys from Atp6v1b1+/+ and Atp6v1b1−/− male mice after 4 days of DOCA/HCO3 loading.
Supplemental Table 7. Measured and calculated parameters used to determine H+-ATPase activity in non–type A ICs in microperfused CCDs from Atp6v1b1+/+ and Atp6v1b1−/− male mice after 4 days of DOCA/HCO3 loading.
Supplemental Table 8. In situ ligation Atp6v0a4—Atp6V1E H+-ATPase subunits assay at the basolateral side of pendrin-positive cells in kidneys from Atp6v1b1+/+ and Atp6v1b1−/− male mice after 4 days of DOCA/HCO3 loading.
Supplemental Table 9. Composition of microperfusion solutions.
Supplemental Table 10. Primary antibodies used in this study.
Supplemental Figure 1. Relationship between buffering power and pHi in CCD cells from 4 days of DOCA/HCO3−-treated Atp6v1b1+/+ and Atp6v1b1−/− male mice.
Supplemental Figure 2. Assembly of H+-ATPase a4 and A subunits detected by the in situ proximity ligation assay in non–type A ICs from 4 days of DOCA/HCO3−-treated Atp6v1b1+/+ and Atp6v1b1−/− male mice.
Supplemental Figure 3. Assembly of H+-ATPase a4 and E subunits detected by the in situ proximity ligation assay in type A ICs from 4 days of DOCA/HCO3−-treated Atp6v1b1+/+ and Atp6v1b1−/− male mice.
References
- 1.Alper SL, Natale J, Gluck S, Lodish HF, Brown D. Subtypes of intercalated cells in rat kidney collecting duct defined by antibodies against erythroid band 3 and renal vacuolar H+-ATPase. Proc Natl Acad Sci U S A. 1989;86(14):5429–5433. doi: 10.1073/pnas.86.14.5429 [DOI] [PMC free article] [PubMed] [Google Scholar]
- 2.Kim J, Kim YH, Cha JH, Tisher CC, Madsen KM. Intercalated cell subtypes in connecting tubule and cortical collecting duct of rat and mouse. J Am Soc Nephrol. 1999;10(1):1–12. doi: 10.1681/ASN.V1011 [DOI] [PubMed] [Google Scholar]
- 3.Schuster VL. Function and regulation of collecting duct intercalated cells. Annu Rev Physiol. 1993;55:267–288. doi: 10.1146/annurev.ph.55.030193.001411 [DOI] [PubMed] [Google Scholar]
- 4.Teng-umnuay P, Verlander JW, Yuan W, Tisher CC, Madsen KM. Identification of distinct subpopulations of intercalated cells in the mouse collecting duct. J Am Soc Nephrol. 1996;7(2):260–274. doi: 10.1681/ASN.V72260 [DOI] [PubMed] [Google Scholar]
- 5.Wagner CA, Finberg KE, Breton S, Marshansky V, Brown D, Geibel JP. Renal vacuolar H+-ATPase. Physiol Rev. 2004;84(4):1263–1314. doi: 10.1152/physrev.00045.2003 [DOI] [PubMed] [Google Scholar]
- 6.Wagner CA Finberg KE Stehberger PA, et al. Regulation of the expression of the Cl-/anion exchanger pendrin in mouse kidney by acid-base status. Kidney Int. 2002;62(6):2109–2117. doi: 10.1046/j.1523-1755.2002.00671.x [DOI] [PubMed] [Google Scholar]
- 7.Quentin F Chambrey R Trinh-Trang-Tan MM, et al. The Cl−/HCO3− exchanger pendrin in the rat kidney is regulated in response to chronic alterations in chloride balance. Am J Physiol Renal Physiol. 2004;287(6):F1179–F1188. doi: 10.1152/ajprenal.00211.2004 [DOI] [PubMed] [Google Scholar]
- 8.Vallet M Picard N Loffing-Cueni D, et al. Pendrin regulation in mouse kidney primarily is chloride-dependent. J Am Soc Nephrol. 2006;17(8):2153–2163. doi: 10.1681/ASN.2005101054 [DOI] [PubMed] [Google Scholar]
- 9.Trepiccione F Soukaseum C Baudrie V, et al. Acute genetic ablation of pendrin lowers blood pressure in mice. Nephrol Dial Transplant. 2017;32(7):1137–1145. doi: 10.1093/ndt/gfw393 [DOI] [PMC free article] [PubMed] [Google Scholar]
- 10.Jacques T Picard N Miller RL, et al. Overexpression of pendrin in intercalated cells produces chloride-sensitive hypertension. J Am Soc Nephrol. 2013;24(7):1104–1113. doi: 10.1681/ASN.2012080787 [DOI] [PMC free article] [PubMed] [Google Scholar]
- 11.Gueutin V Vallet M Jayat M, et al. Renal beta-intercalated cells maintain body fluid and electrolyte balance. J Clin Invest. 2013;123(10):4219–4231. doi: 10.1172/JCI63492 [DOI] [PMC free article] [PubMed] [Google Scholar]
- 12.Wall SM Kim YH Stanley L, et al. NaCl restriction upregulates renal Slc26a4 through subcellular redistribution: role in Cl- conservation. Hypertension. 2004;44(6):982–987. doi: 10.1161/01.HYP.0000145863.96091.89 [DOI] [PubMed] [Google Scholar]
- 13.Wall SM, Verlander JW, Romero CA. The renal physiology of pendrin-positive intercalated cells. Physiol Rev. 2020;100(3):1119–1147. doi: 10.1152/physrev.00011.2019 [DOI] [PMC free article] [PubMed] [Google Scholar]
- 14.van Hille B, Richener H, Schmid P, Puettner I, Green JR, Bilbe G. Heterogeneity of vacuolar H(+)-ATPase: differential expression of two human subunit B isoforms. Biochem J. 1994;303(Pt 1):191–198. doi: 10.1042/bj3030191 [DOI] [PMC free article] [PubMed] [Google Scholar]
- 15.Breton S, Smith PJ, Lui B, Brown D. Acidification of the male reproductive tract by a proton pumping (H+)-ATPase. Nat Med. 1996;2(4):470–472. doi: 10.1038/nm0496-470 [DOI] [PubMed] [Google Scholar]
- 16.Brown D, Lui B, Gluck S, Sabolic I. A plasma membrane proton ATPase in specialized cells of rat epididymis. Am J Physiol. 1992;263(4 Pt 1):C913–C916. doi: 10.1152/ajpcell.1992.263.4.C913 [DOI] [PubMed] [Google Scholar]
- 17.Finberg KE, Wagner CA, Stehberger PA, Geibel JP, Lifton RP. Molecular cloning and characterization of Atp6v1b1, the murine vacuolar H+ -ATPase B1-subunit. Gene. 2003;318:25–34. doi: 10.1016/s0378-1119(03)00790-x [DOI] [PubMed] [Google Scholar]
- 18.Wax MB Saito I Tenkova T, et al. Vacuolar H+-ATPase in ocular ciliary epithelium. Proc Natl Acad Sci U S A. 1997;94(13):6752–6757. doi: 10.1073/pnas.94.13.6752 [DOI] [PMC free article] [PubMed] [Google Scholar]
- 19.Karet FE Finberg KE Nelson RD, et al. Mutations in the gene encoding B1 subunit of H+-ATPase cause renal tubular acidosis with sensorineural deafness. Nat Genet. 1999;21(1):84–90. doi: 10.1038/5022 [DOI] [PubMed] [Google Scholar]
- 20.Nelson RD, Guo XL, Masood K, Brown D, Kalkbrenner M, Gluck S. Selectively amplified expression of an isoform of the vacuolar H(+)-ATPase 56-kilodalton subunit in renal intercalated cells. Proc Natl Acad Sci U S A. 1992;89(8):3541–3545. doi: 10.1073/pnas.89.8.3541 [DOI] [PMC free article] [PubMed] [Google Scholar]
- 21.Frische S Chambrey R Trepiccione F, et al. H(+)-ATPase B1 subunit localizes to thick ascending limb and distal convoluted tubule of rodent and human kidney. Am J Physiol Renal Physiol. 2018;315(3):F429–F444. doi: 10.1152/ajprenal.00539.2017 [DOI] [PMC free article] [PubMed] [Google Scholar]
- 22.Wagner CA, Unwin R, Lopez-Garcia SC, Kleta R, Bockenhauer D, Walsh S. The pathophysiology of distal renal tubular acidosis. Nat Rev Nephrol. 2023;19(6):384–400. doi: 10.1038/s41581-023-00699-9 [DOI] [PubMed] [Google Scholar]
- 23.Finberg KE Wagner CA Bailey MA, et al. The B1-subunit of the H(+) ATPase is required for maximal urinary acidification. Proc Natl Acad Sci U S A. 2005;102(38):13616–13621. doi: 10.1073/pnas.0506769102 [DOI] [PMC free article] [PubMed] [Google Scholar]
- 24.Kovacikova J Winter C Loffing-Cueni D, et al. The connecting tubule is the main site of the furosemide-induced urinary acidification by the vacuolar H+-ATPase. Kidney Int. 2006;70(10):1706–1716. doi: 10.1038/sj.ki.5001851 [DOI] [PubMed] [Google Scholar]
- 25.Paunescu TG Russo LM Da Silva N, et al. Compensatory membrane expression of the V-ATPase B2 subunit isoform in renal medullary intercalated cells of B1-deficient mice. Am J Physiol Renal Physiol. 2007;293(6):F1915–F1926. doi: 10.1152/ajprenal.00160.2007 [DOI] [PubMed] [Google Scholar]
- 26.Rothenberger F, Velic A, Stehberger PA, Kovacikova J, Wagner CA. Angiotensin II stimulates vacuolar H+ -ATPase activity in renal acid-secretory intercalated cells from the outer medullary collecting duct. J Am Soc Nephrol. 2007;18(7):2085–2093. doi: 10.1681/ASN.2006070753 [DOI] [PubMed] [Google Scholar]
- 27.Chambrey R Kurth I Peti-Peterdi J, et al. Renal intercalated cells are rather energized by a proton than a sodium pump. Proc Natl Acad Sci U S A. 2013;110(19):7928–7933. doi: 10.1073/pnas.1221496110 [DOI] [PMC free article] [PubMed] [Google Scholar]
- 28.Wall SM Hassell KA Royaux IE, et al. Localization of pendrin in mouse kidney. Am J Physiol Renal Physiol. 2003;284(1):F229–F241. doi: 10.1152/ajprenal.00147.2002 [DOI] [PubMed] [Google Scholar]
- 29.Royaux IE Wall SM Karniski LP, et al. Pendrin, encoded by the Pendred syndrome gene, resides in the apical region of renal intercalated cells and mediates bicarbonate secretion. Proc Natl Acad Sci U S A. 2001;98(7):4221–4226. doi: 10.1073/pnas.071516798 [DOI] [PMC free article] [PubMed] [Google Scholar]
- 30.Verlander JW Hassell KA Royaux IE, et al. Deoxycorticosterone upregulates PDS (Slc26a4) in mouse kidney: role of pendrin in mineralocorticoid-induced hypertension. Hypertension. 2003;42(3):356–362. doi: 10.1161/01.HYP.0000088321.67254.B7 [DOI] [PubMed] [Google Scholar]
- 31.Bourgeois S, Bettoni C, Baron S, Wagner CA. Haploinsufficiency of the mouse Atp6v1b1 gene leads to a mild acid-base disturbance with implications for kidney stone disease. Cell Physiol Biochem. 2018;47(3):1095–1107. doi: 10.1159/000490186 [DOI] [PubMed] [Google Scholar]
- 32.Kampik NB, Gehring N, Schnitzbauer U, Hennings JC, Hübner CA, Wagner CA. The murine Cl⁻/HCO⁻₃ exchanger Ae3 (Slc4a3) is not required for acid-base balance but is involved in magnesium handling by the kidney. Cell Physiol Biochem. 2014;34(5):1566–1577. doi: 10.1159/000366360 [DOI] [PubMed] [Google Scholar]
- 33.Bourgeois S, Bounoure L, Mouro-Chanteloup I, Colin Y, Brown D, Wagner CA. The ammonia transporter RhCG modulates urinary acidification by interacting with the vacuolar proton-ATPases in renal intercalated cells. Kidney Int. 2018;93(2):390–402. doi: 10.1016/j.kint.2017.07.027 [DOI] [PMC free article] [PubMed] [Google Scholar]
- 34.Milton AE, Weiner ID. Regulation of B-type intercalated cell apical anion exchange activity by CO2/HCO3. Am J Physiol. 1998;274(6):F1086–F1094. doi: 10.1152/ajprenal.1998.274.6.F1086 [DOI] [PubMed] [Google Scholar]
- 35.Bourgeois S Bounoure L Christensen EI, et al. Haploinsufficiency of the ammonia transporter Rhcg predisposes to chronic acidosis: Rhcg is critical for apical and basolateral ammonia transport in the mouse collecting duct. J Biol Chem. 2013;288(8):5518–5529. doi: 10.1074/jbc.M112.441782 [DOI] [PMC free article] [PubMed] [Google Scholar]
- 36.Arumugham VB, Shahin MH. Therapeutic Uses of Diuretic Agents. StatPearls; 2021. [PubMed] [Google Scholar]
- 37.Huxel C, Raja A, Ollivierre-Lawrence MD. Loop Diuretics. StatPearls; 2021. [PubMed] [Google Scholar]
- 38.Azroyan A Morla L Crambert G, et al. Regulation of pendrin by cAMP: possible involvement in beta-adrenergic-dependent NaCl retention. Am J Physiol Renal Physiol. 2012;302(9):F1180–F1187. doi: 10.1152/ajprenal.00403.2011 [DOI] [PubMed] [Google Scholar]
- 39.Thumova M Pech V Froehlich O, et al. Pendrin protein abundance in the kidney is regulated by nitric oxide and cAMP. Am J Physiol Renal Physiol. 2012;303(6):F812–F820. doi: 10.1152/ajprenal.00577.2011 [DOI] [PMC free article] [PubMed] [Google Scholar]
- 40.Berg P, Svendsen SL, Sorensen MV, Schreiber R, Kunzelmann K, Leipziger J. The molecular mechanism of CFTR- and secretin-dependent renal bicarbonate excretion. J Physiol. 2021;599(12):3003–3011. doi: 10.1113/JP281285 [DOI] [PubMed] [Google Scholar]
- 41.Bastani B, Purcell H, Hemken P, Trigg D, Gluck S. Expression and distribution of renal vacuolar proton-translocating adenosine triphosphatase in response to chronic acid and alkali loads in the rat. J Clin Invest. 1991;88(1):126–136. doi: 10.1172/JCI115268 [DOI] [PMC free article] [PubMed] [Google Scholar]
- 42.Kim J, Welch WJ, Cannon JK, Tisher CC, Madsen KM. Immunocytochemical response of type A and type B intercalated cells to increased sodium chloride delivery. Am J Physiol. 1992;262(2 Pt 2):F288–F302. doi: 10.1152/ajprenal.1992.262.2.F288 [DOI] [PubMed] [Google Scholar]
- 43.Stehberger PA Schulz N Finberg KE, et al. Localization and regulation of the ATP6V0A4 (a4) vacuolar H+-ATPase subunit defective in an inherited form of distal renal tubular acidosis. J Am Soc Nephrol. 2003;14(12):3027–3038. doi: 10.1097/01.asn.0000099375.74789.ab [DOI] [PubMed] [Google Scholar]
- 44.Verlander JW, Madsen KM, Galla JH, Luke RG, Tisher CC. Response of intercalated cells to chloride depletion metabolic alkalosis. Am J Physiol. 1992;262(2 Pt 2):F309–F319. doi: 10.1152/ajprenal.1992.262.2.F309 [DOI] [PubMed] [Google Scholar]
- 45.Paunescu TG, Da Silva N, Marshansky V, McKee M, Breton S, Brown D. Expression of the 56-kDa B2 subunit isoform of the vacuolar H(+)-ATPase in proton-secreting cells of the kidney and epididymis. Am J Physiol Cell Physiol. 2004;287(1):C149–C162. doi: 10.1152/ajpcell.00464.2003 [DOI] [PubMed] [Google Scholar]
- 46.Miller RL Zhang P Smith M, et al. V-ATPase B1-subunit promoter drives expression of EGFP in intercalated cells of kidney, clear cells of epididymis and airway cells of lung in transgenic mice. Am J Physiol Cell Physiol. 2005;288(5):C1134–C1144. doi: 10.1152/ajpcell.00084.2004 [DOI] [PubMed] [Google Scholar]
- 47.Berg P, Svendsen SL, Hoang TTL, Praetorius HA, Sorensen MV, Leipziger J. Impaired renal HCO3 (-) secretion in CFTR deficient mice causes metabolic alkalosis during chronic base-loading. Acta Physiol (Oxf). 2021;231(3):e13591. doi: 10.1111/apha.13591 [DOI] [PubMed] [Google Scholar]
- 48.Berg P Svendsen SL Sorensen MV, et al. Impaired renal HCO(3)(-) excretion in cystic fibrosis. J Am Soc Nephrol. 2020;31(8):1711–1727. doi: 10.1681/ASN.2020010053 [DOI] [PMC free article] [PubMed] [Google Scholar]
- 49.Leviel F Hübner CA Houillier P, et al. The Na+-dependent chloride-bicarbonate exchanger SLC4A8 mediates an electroneutral Na+ reabsorption process in the renal cortical collecting ducts of mice. J Clin Invest. 2010;120(5):1627–1635. doi: 10.1172/JCI40145 [DOI] [PMC free article] [PubMed] [Google Scholar]
- 50.Emmons C, Kurtz I. Functional characterization of three intercalated cell subtypes in the rabbit outer cortical collecting duct. J Clin Invest. 1994;93(1):417–423. doi: 10.1172/JCI116976 [DOI] [PMC free article] [PubMed] [Google Scholar]
- 51.Emmons C. Transport characteristics of the apical anion exchanger of rabbit cortical collecting duct beta-cells. Am J Physiol. 1999;276(4):F635–F643. doi: 10.1152/ajprenal.1999.276.4.F635 [DOI] [PubMed] [Google Scholar]
- 52.Berg P, Andersen JF, Sorensen MV, Wang T, Malte H, Leipziger J. Alkalosis-induced hypoventilation in cystic fibrosis: the importance of efficient renal adaptation. Proc Natl Acad Sci U S A. 2022;119(8):2022. doi: 10.1073/pnas.2116836119 [DOI] [PMC free article] [PubMed] [Google Scholar]
- 53.Vedovelli L Rothermel JT Finberg KE, et al. Altered V-ATPase expression in renal intercalated cells isolated from B1 subunit-deficient mice by fluorescence-activated cell sorting. Am J Physiol Renal Physiol. 2013;304(5):F522–F532. doi: 10.1152/ajprenal.00394.2012 [DOI] [PMC free article] [PubMed] [Google Scholar]
- 54.Oh SW, Han SY. Loop diuretics in clinical practice. Electrolyte Blood Press. 2015;13(1):17–21. doi: 10.5049/EBP.2015.13.1.17 [DOI] [PMC free article] [PubMed] [Google Scholar]
- 55.Cil O, Haggie PM, Phuan PW, Tan JA, Verkman AS. Small-molecule inhibitors of pendrin potentiate the diuretic action of furosemide. J Am Soc Nephrol. 2016;27(12):3706–3714. doi: 10.1681/ASN.2015121312 [DOI] [PMC free article] [PubMed] [Google Scholar]
- 56.Soleimani M Barone S Xu J, et al. Double knockout of pendrin and Na-Cl cotransporter (NCC) causes severe salt wasting, volume depletion, and renal failure. Proc Natl Acad Sci U S A. 2012;109(33):13368–13373. doi: 10.1073/pnas.1202671109 [DOI] [PMC free article] [PubMed] [Google Scholar]
- 57.Wall SM. Regulation of blood pressure and salt balance by pendrin-positive intercalated cells: donald seldin lecture 2020. Hypertension. 2022;79(4):706–716. doi: 10.1161/HYPERTENSIONAHA.121.16492 [DOI] [PMC free article] [PubMed] [Google Scholar]
- 58.Hymes LC, Warshaw BL. Renal tubular acidosis in a patient with recurrent metabolic alkalosis. Pediatrics. 1983;72(2):207–210. doi: 10.1542/peds.72.2.207 [DOI] [PubMed] [Google Scholar]
- 59.Lucaccioni L Coccolini E Dozza A, et al. Severe metabolic alkalosis due to diuretic treatment in a patient with distal renal tubular acidosis: a rare association. Acta Biomed. 2019;90(2):348–352. doi: 10.23750/abm.v90i2.6886 [DOI] [PMC free article] [PubMed] [Google Scholar]
- 60.Pela I, Bigozzi M, Bianchi B. Profound hypokalemia and hypochloremic metabolic alkalosis during thiazide therapy in a child with Pendred syndrome. Clin Nephrol. 2008;69(6):450–453. doi: 10.5414/cnp69450 [DOI] [PubMed] [Google Scholar]
Associated Data
This section collects any data citations, data availability statements, or supplementary materials included in this article.
Data Availability Statement
All data is included in the manuscript and/or supporting information.