Abstract
In this paper, texture calculations are used to validate the realism of a physical anthropomorphic phantom for digital breast tomosynthesis. The texture features were compared against clinical mammography data. Three groups of features (grey-level histogram, co-occurrence, and run-length) were considered. The features were analyzed over a broad range of technique settings (kV and mAs). These calculations were done in the central slice of the reconstruction as well as the synthetic 2D mammogram. For each feature, the clinical data were binned into strata based on the compressed breast thickness. It was demonstrated that the clinical features vary by thickness. To evaluate the realism of the phantom, each feature was compared against clinical data in the same thickness stratum. For the purpose of this paper, a feature was considered to be realistic if it was within the middle 95% of the statistical distribution of clinical values. In the reconstruction, most features were found to exhibit realism; specifically, all 12 grey-level histogram features, four out of seven co-occurrence features, and three out of seven run-length features. The realism of most features was robust to changes in the technique settings. However, in the synthetic 2D mammogram, fewer features were found to exhibit realism. In conclusion, this paper provides a validation of the textural realism of the phantom in the reconstruction, and shows that there is less realism in the synthetic 2D mammogram. We identify the features that should be considered to refine the design of the phantom in future work.
Keywords: Digital Breast Tomosynthesis, Anthropomorphic Phantom, Texture Feature Analysis, Image Acquisition, Image Reconstruction, Synthetic 2D Mammogram
1. INTRODUCTION
Many medical centers have adopted digital breast tomosynthesis (DBT), or “3D mammography”, for breast cancer screening exams. The DBT reconstruction is interpreted in combination with either a standard 2D digital mammography (DM) image or a synthetic 2D mammogram1–8 derived from the 3D data set. Studies have shown that the use of 3D/2D imaging in combination offers benefits over conventional DM.9–12 One benefit is an increase in the cancer detection rate, particularly among invasive cancers. In addition, Sharpe et al. found that there is a reduction in the recall rate for women of all breast densities, and that the reduction is most significant in women with heterogeneously dense breasts and extremely dense breasts.12
Zuckerman et al. analyzed how the cancer detection rate and the recall rate are impacted by replacing the DM image with a synthetic 2D mammogram.5,6 The authors demonstrated that these rates are effectively unaltered, and concluded that synthetic 2D imaging is an acceptable technique for minimizing the radiation dose of screening. Studies have shown that the appearance of a synthetic 2D image differs from a DM image.6,8 For example, some lesions such as spiculated masses and architectural distortions may be portrayed with better conspicuity in the synthetic 2D image. A drawback of synthetic 2D imaging is that there may be more pronounced blurring due to patient motion, since the scan time of DBT is longer than DM. Also, there are artifacts not seen in a DM image, such as streaking around metal clips and pseudocalcifications (e.g., random noise fluctuations that are portrayed as calcifications).
The purpose of this paper was to evaluate the texture features in a physical anthropomorphic phantom for DBT. There were 26 features considered in this study, including grey-level histogram, co-occurrence, and run-length features. These calculations were done in both the reconstruction and the synthetic 2D mammogram. To validate the clinical realism of the phantom, the features were compared against clinical data. We also analyzed whether the features are sensitive to varying the acquisition parameters that control the x-ray energy (kV) and the amount of radiation emitted (mAs).
2. METHODS
2.1. Anthropomorphic Phantom and Image Acquisition
The anthropomorphic phantom analyzed in this paper was manufactured by Computerized Imaging Reference Systems, Inc. (Norfolk, VA) under license from the University of Pennsylvania (Penn). The phantom is based on a computational model of glandular and adipose tissue developed by Penn.13–16 As described in previous work, clusters of calcium oxalate, which are surrogates for calcifications, have also been inserted within the thickness of the phantom.17
The phantom was imaged with a clinical DBT system (Selenia Dimensions, Hologic, Inc., Bedford, MA) at Penn (Philadelphia, PA). Multiple images of the phantom were consecutively acquired by varying the technique settings (kV and mAs). First, the kV was varied (27 to 34 kV), and the mAs was determined by auto-timing. At high kV, fewer x-ray photons are needed for the image, and the mAs is reduced as expected (Figure 1). Second, the kV was fixed (31 kV), and the mAs was varied to study the effect of radiation dose. The mAs increments varied by factors of 21/2 (1.4). Since the system supports discrete mAs values, the closest mAs setting was selected. Each acquisition was repeated twice. All acquisitions were done with the phantom in the same positioning under compression. The views were left cranial-caudal (CC). The reconstruction was prepared with the Selenia Dimensions algorithm with 1.0 mm slice spacing.
Figure 1.
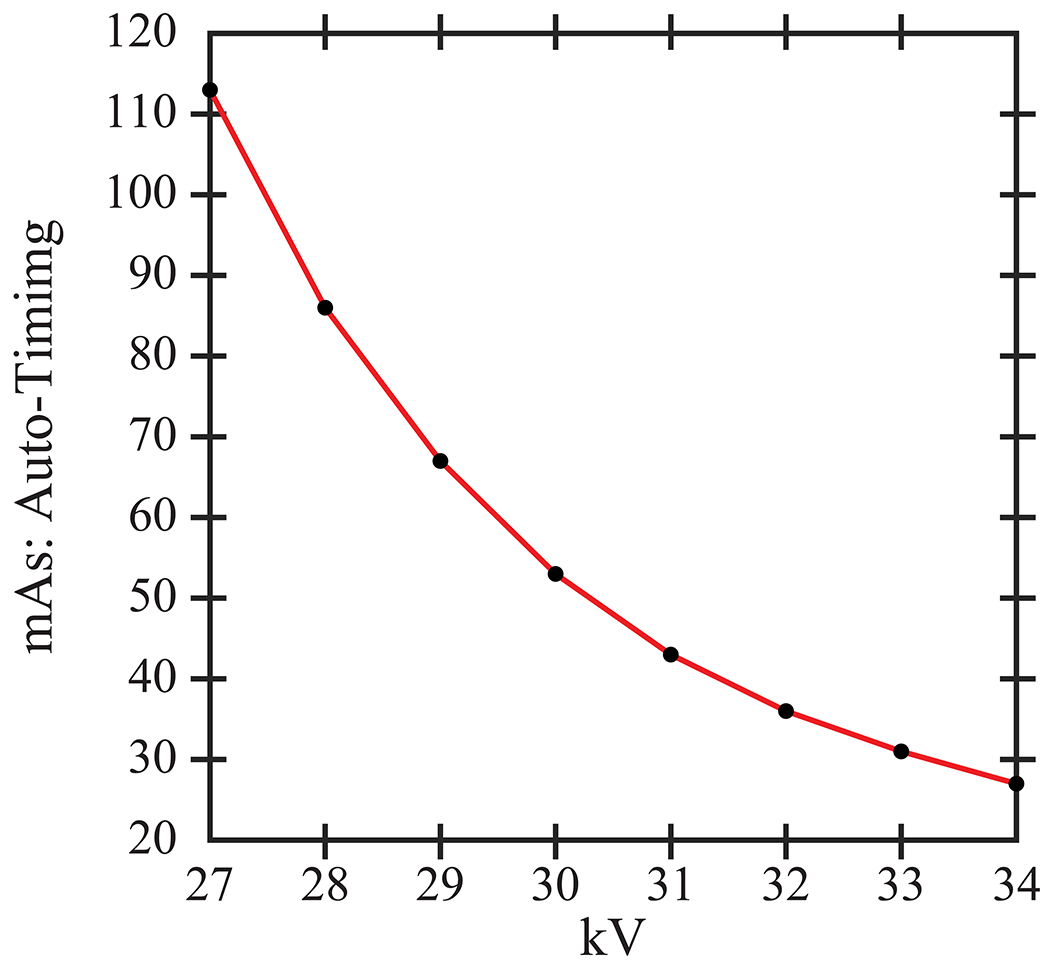
The mAs settings for the phantom were determined by auto-timing. The mAs decreases with increasing kV.
2.2. Texture Feature Analysis
A set of 26 established texture descriptors, including grey-level histogram, co-occurrence, and run-length features, were calculated in each image using a lattice-based texture pipeline previously developed and validated.18–20 Briefly, a regular lattice was overlaid on the image, and texture descriptors were computed on local square windows centered on each lattice point within the breast. The use of a lattice-based approach is motivated by previous work by Zheng et al., which generated receiver operating characteristic (ROC) curves for classifying cases (cancers) and controls (negatives) based on texture features.18 That work found that the lattice-based approach resulted in higher area under the ROC curve than using single regions-of-interest (ROIs).
The texture calculations are averaged over all the windows. First, the texture pipeline was applied to the slice corresponding to the mid-thickness in the reconstruction. Given that the phantom was 51.0 mm thick under compression, slice 25 was considered. Second, the texture pipeline was applied to the synthetic 2D mammogram (C-View™) derived from the reconstruction.
To analyze each texture feature, the mean of the 16 auto-timed measurements was calculated (eight kV settings repeated twice). To identify features which are robust to changes in the technique settings, the coefficient of variation (ratio of the standard deviation to the absolute value of the mean) was also determined. For the purpose of this paper, a feature is considered to be reproducible over multiple acquisitions if the coefficient of variation is less than 0.05.
Texture features in the phantom were then compared against clinical data. The collection of clinical data was approved by the institutional review board at Penn, and was compliant with the Health Insurance Portability and Accountability Act. Similar to the phantom, texture features were analyzed in the central slice of the reconstruction.
There were two different groups of subjects for analysis of the reconstruction and the synthetic 2D images. For the reconstruction, there were 396 subjects between October 2011 and February 2013. The images were drawn from screening exams with an overall assessment of 0 (incomplete), 1 (negative), or 2 (benign) using the Breast Imaging-Reporting and Data System (BI-RADS®). All views for each subject were considered (1,581 total images), including CC and mediolateral oblique (MLO) views as well as additional mediolateral (ML) and lateromedial (LM) views for one subject. By contrast, for the synthetic 2D images, there were 3,799 subjects between September 2014 and December 2014. The images were drawn from screening exams with an overall BI-RADS® assessment of 1 or 2. Only MLO views were considered (7,593 total images). For both groups of subjects, the negative routine screening studies were confirmed at one-year follow-up.
The lattice-based texture pipeline has two main adjustable parameters; one is the size of the window (w) and the other is the distance (d) between adjacent windows. The clinical data were analyzed with lattice parameters w = d = 6.3 mm. These parameters are motivated by the work of Zheng et al., which found that these values result in better ROC performance for distinguishing between cases and controls when compared with larger values of w and d.18 The mean of the 16 auto-timed measurements in the phantom was then compared against the statistical distribution of the feature in the clinical population. We determined the percentile rank of the mean relative to the clinical distribution; this is equivalent to the percentage of clinical data points below the mean. For the purpose of this paper, a feature is considered clinically realistic if the percentile rank is between 2.5% and 97.5% (corresponding to the middle 95% of the distribution). Otherwise, the feature is not considered realistic.
3. RESULTS
To illustrate the effect of the technique settings, Figure 2(a)–(b) shows the central slice of the reconstruction at 31 kV and two mAs values (9 and 120 mAs). Reducing the mAs clearly affects the image quality, resulting in more noise. The calcifications are not in focus in this slice at either mAs setting. Figure 2(c)–(d) shows the synthetic 2D images for the same settings. Since these images are projections through the entire volume, the calcifications are more clearly visualized (arrows). To calculate texture features, a lattice is overlaid on the image, as illustrated in Figure 2(e).
Figure 2.
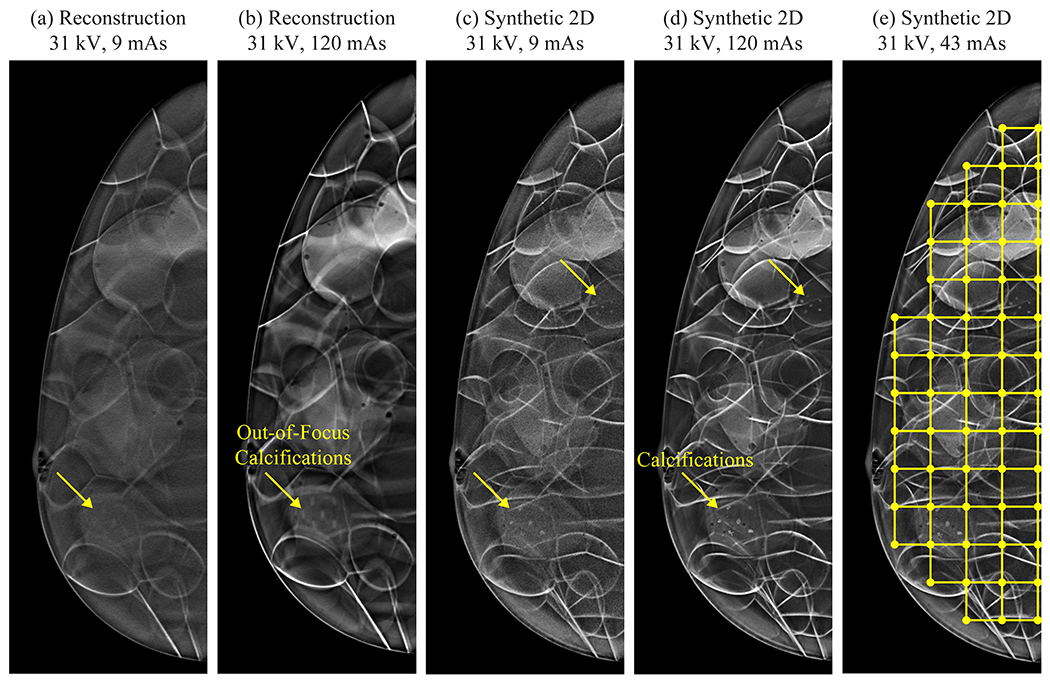
Reducing the mAs results in more pronounced noise. The lattice-based approach for calculating texture is illustrated in (e).
For the central slice of the reconstruction, Figure 3 illustrates how a clinical feature (inertia) varies with the thickness of the breast under compression, as shown by the boxplots at different thickness strata. There is an overall decreasing trend with thickness. This figure illustrates why the texture in the phantom needs to be compared against clinical data in the appropriate thickness stratum (45.0 to 55.0 mm); the boxplot corresponding to this stratum is highlighted in Figure 3(c). In this stratum, there were 177 subjects (386 images) for analysis of texture in the reconstruction and 805 subjects (1,246 images) for analysis of texture in the synthetic 2D image.
Figure 3.
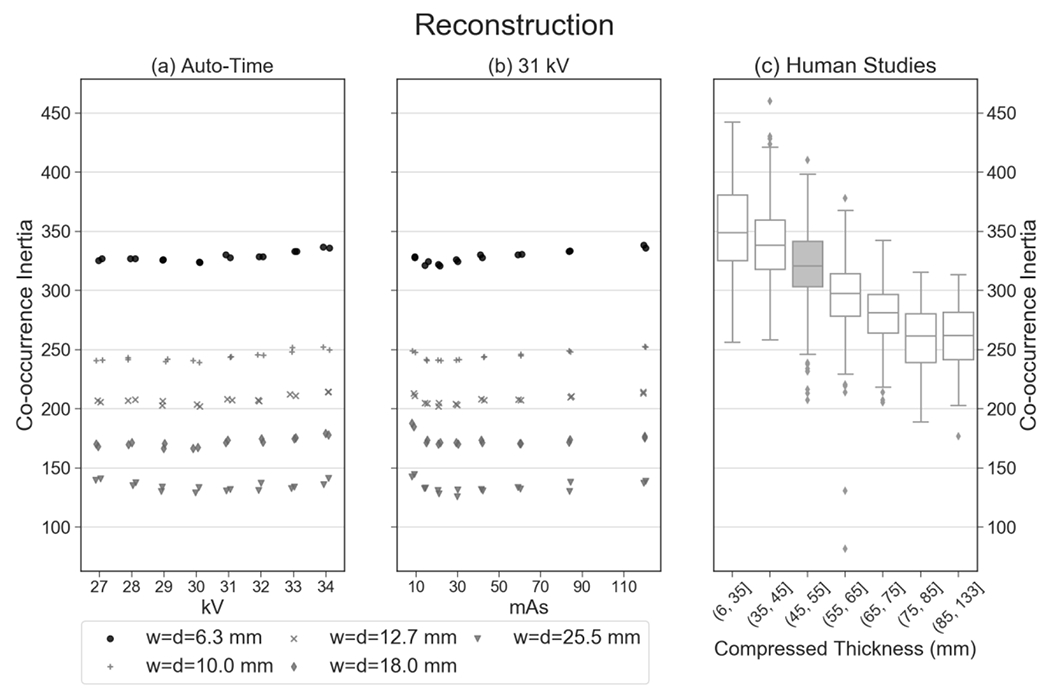
These plots provide an example of a texture feature (inertia) that is reproducible in 16 auto-timed measurements (coefficient of variation of 0.0122). In addition, this feature shows clinical realism; the mean of the 16 auto-timed measurements has a percentile rank of 62.7% relative to the clinical distribution.
For the same feature, Figure 3 also provides the phantom results for five window parameters (w and d). As shown, this feature (inertia) is sensitive to the choice of window parameters. To assess the realism of the phantom, only the data points corresponding to the clinical window parameters (w = d = 6.3 mm) are considered. For these window parameters, the mean of the 16 auto-timed measurements is 3.29 × 10² with a standard deviation of 4.00 (Table 1). The coefficient of variation is less than 0.05 (0.0122), demonstrating reproducibility over the 16 auto-timed measurements.
Table 1.
Summary statistics for phantom texture in the reconstruction assuming lattice parameters w = d = 6.3 mm.
| CENTRAL SLICE OF RECONSTRUCTION | ||||
|---|---|---|---|---|
| Groups of Features | Individual Features | Mean (Std Dev) of 16 Auto-Timed Images | Coefficient of Variation | Percentile Rank of Mean Relative to Clinical Distribution |
| Group 1: Grey-level histogram | Max | 2.24 (0.0981) | 0.0439 | 73.3% |
| Min | −1.17 (0.0382) | 0.0325 | 78.7% | |
| Mean | 0.0364 (0.0108) | 0.297 * | 89.8% | |
| Sum | 1.27 × 10² (37.6) | 0.297 * | 87.5% | |
| Entropy | 6.15 (0.00830) | 0.00135 | 38.2% | |
| Kurtosis | 4.28 (0.0308) | 0.00719 | 97.3% | |
| Sigma | 0.579 (0.0156) | 0.0269 | 66.8% | |
| Skewness | 0.723 (0.0131) | 0.0182 | 93.0% | |
| 5th Percentile | −0.721 (0.0121) | 0.0168 | 86.1% | |
| 5th Mean | −0.847 (0.0162) | 0.0191 | 81.7% | |
| 95th Percentile | 1.15 (0.0421) | 0.0367 | 86.7% | |
| 95th Mean | 1.49 (0.0542) | 0.0364 | 89.8% | |
| Group 2: Co-occurrence | Cluster shade | 1.02 × 10⁴ (2.78 × 10²) | 0.0273 | 92.4% |
| Energy | 9.51 × 10⁻⁴ (4.22 × 10⁻⁵) | 0.0444 | 99.0% ** | |
| Entropy | 9.29 (0.0201) | 0.00217 | <0.1% ** | |
| Inertia | 3.29 × 10² (4.00) | 0.0122 | 62.7% | |
| Correlation | 1.66 × 10⁻³ (5.99 × 10⁻⁵) | 0.0360 | 96.0% | |
| Haralick correlation | 1.42 × 10⁷ (2.17 × 10⁵) | 0.0153 | 36.8% | |
| Inverse difference moment | 0.0971 (0.00223) | 0.0230 | 99.8% ** | |
| Group 3: Run length | Grey-level non-uniformity | 59.9 (0.371) | 0.00619 | 45.8% |
| Run-length non-uniformity | 3.28 × 10³ (12.3) | 0.00374 | <0.1% ** | |
| Run percentage | 0.943 (0.00349) | 0.00371 | 3.6% | |
| High grey-level run emphasis | 3.07 × 10³ (28.2) | 0.00921 | 78.5% | |
| Long run emphasis | 1.00 (6.19 × 10⁻⁵) | 6.19 × 10⁻⁵ | 99.6% ** | |
| Low grey-level run emphasis | 2.17 × 10⁻³ (1.26 × 10⁻⁴) | 0.0580 * | 97.6% ** | |
| Short run emphasis | 1.00 (1.54 × 10⁻⁵) | 1.54 × 10⁻⁵ | 0.4% ** | |
Coefficient of variation exceeds 0.05.
Phantom texture is unrealistic relative to clinical data.
Table 1 shows the summary statistics for all 26 features calculated in the phantom. For 23 out of 26 features (88.5%), the coefficient of variation is less than 0.05, which indicates reproducibility over the 16 auto-timed measurements. There are three features (mean, sum, and low grey-level run emphasis) for which the coefficient of variation exceeds 0.05.
In addition, the percentile rank of the mean was calculated relative to the clinical distribution. Out of 26 features calculated in the phantom, 19 features (73.1%) are clinically realistic in the reconstruction, since the percentile rank is between 2.5% and 97.5%. The feature illustrated in Figure 3 (inertia) is an example of one that it is clinically realistic; the percentile rank is 62.7%.
The feature shown in Figure 3 exhibits minimal variation over the kV and mAs settings considered. We found that the realism of most features was not sensitive to the technique settings. Figure 4 illustrates a feature (low grey-level run emphasis) which is more sensitive to these settings. There is a clear increasing trend as the mAs is increased. The data points for the phantom at high mAs [Figure 4(b)] are outliers relative to the clinical distribution [Figure 4(c)]. It should be noted that in the clinical distribution, some outlier points are not shown, as the vertical axis limits were truncated.
Figure 4.
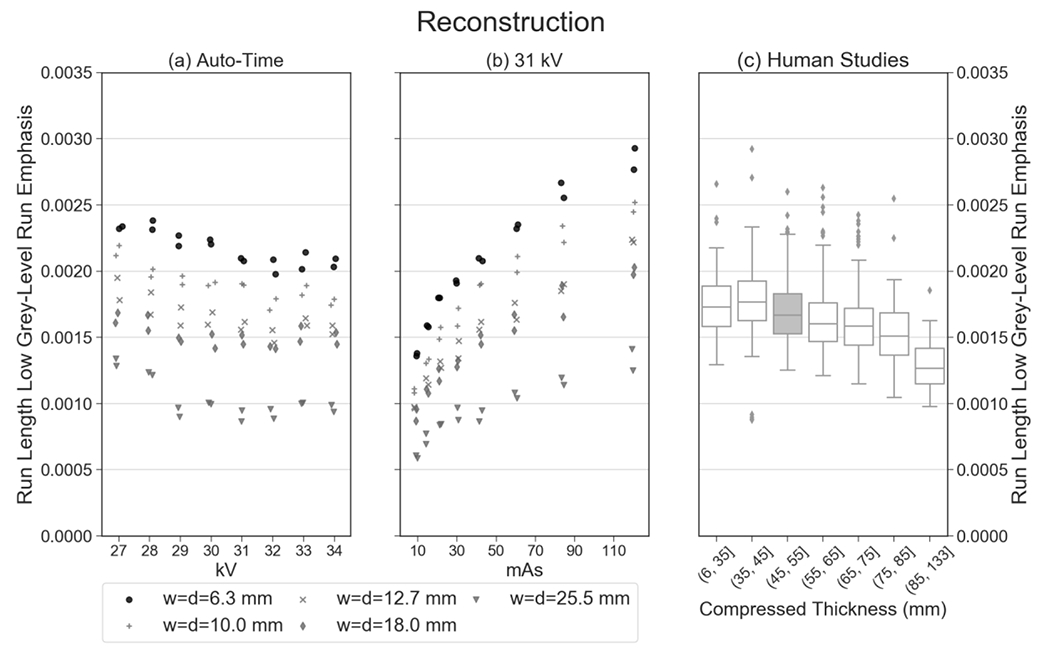
Unlike the feature shown in Figure 3, this feature (low grey-level run emphasis) is an example of one that varies more strongly with mAs. As a result, the realism of this feature is dependent on the technique settings that are chosen.
Similar to Table 1, the summary statistics for the synthetic 2D image are shown in Table 2. Compared against the reconstruction, slightly fewer features (22 out of 26 or 84.6%) are reproducible with a coefficient of variation below 0.05 for the auto-timed acquisitions. Table 2 shows that there is less realism in the synthetic 2D image. Out of 26 features, 11 (42.3%) are clinically realistic. An example of a feature that is realistic in the reconstruction but not in the synthetic 2D image is inertia, for which the percentile rank relative to the clinical distribution is greater than 99.9% (Figure 5).
Table 2.
Summary statistics for phantom texture in the synthetic 2D mammogram assuming lattice parameters w = d = 6.3 mm.
| SYNTHETIC 2D MAMMOGRAM | ||||
|---|---|---|---|---|
| Groups of Features | Individual Features | Mean (Std Dev) of 16 Auto-Timed Images | Coefficient of Variation | Percentile Rank of Mean Relative to Clinical Distribution |
| Group 1: Grey-level histogram | Max | 2.98 (0.0241) | 0.00811 | 92.1% |
| Min | −1.26 (0.0238) | 0.0188 | 65.8% | |
| Mean | 0.0371 (0.00588) | 0.158 * | 55.4% | |
| Sum | 1.29 × 10² (20.5) | 0.158 * | 51.4% | |
| Entropy | 5.96 (0.0266) | 0.00446 | 1.40% ** | |
| Kurtosis | 5.98 (0.175) | 0.0292 | 99.0% ** | |
| Sigma | 0.730 (0.00917) | 0.0126 | 98.7% ** | |
| Skewness | 1.35 (0.0438) | 0.0324 | 99.7% ** | |
| 5th Percentile | −0.764 (0.0141) | 0.0184 | 71.6% | |
| 5th Mean | −0.883 (0.0168) | 0.0191 | 72.4% | |
| 95th Percentile | 1.59 (0.0201) | 0.0127 | >99.9% ** | |
| 95th Mean | 2.02 (0.0190) | 0.00941 | 99.8% ** | |
| Group 2: Co-occurrence | Cluster shade | 1.99 × 10⁴ (4.69 × 10²) | 0.0236 | >99.9% ** |
| Energy | 1.28 × 10⁻³ (9.95 × 10⁻⁵) | 0.0778 * | 99.6% ** | |
| Entropy | 8.78 (0.0337) | 0.00384 | <0.1% ** | |
| Inertia | 4.92 × 10² (6.35) | 0.0129 | >99.9% ** | |
| Correlation | 9.28 × 10⁻⁴ (2.46 × 10⁻⁵) | 0.0265 | 30.1% | |
| Haralick correlation | 9.49 × 10⁶ (5.00 × 10⁵) | 0.0528 * | 1.50% ** | |
| Inverse difference moment | 0.107 (0.00324) | 0.0302 | 99.9% ** | |
| Group 3: Run length | Grey-level non-uniformity | 72.0 (1.65) | 0.0229 | 89.8% |
| Run-length non-uniformity | 3.25 × 10³ (10.4) | 0.00320 | <0.1% ** | |
| Run percentage | 0.934 (0.00295) | 0.00316 | 0.5% ** | |
| High grey-level run emphasis | 2.26 × 10³ (40.7) | 0.0180 | 11.5% | |
| Long run emphasis | 1.00 (6.79 × 10⁻⁵) | 6.79 × 10⁻⁵ | 94.5% | |
| Low grey-level run emphasis | 2.94 × 10⁻³ (1.26 × 10⁻⁴) | 0.0429 | 99.4% ** | |
| Short run emphasis | 1.00 (1.70 × 10⁻⁵) | 1.70 × 10⁻⁵ | 3.40% | |
Coefficient of variation exceeds 0.05.
Phantom texture is unrealistic relative to clinical data.
Figure 5.
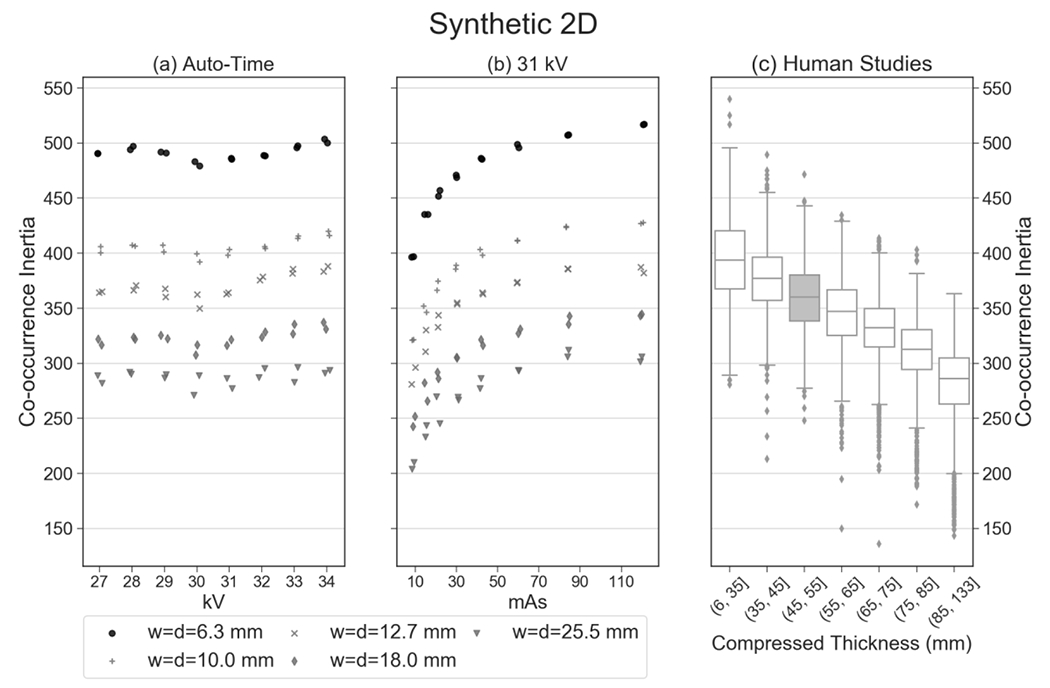
While this feature (inertia) exhibits clinical realism in the reconstruction (Figure 3), it does not show realism in the synthetic 2D image. The percentile rank of the mean of the auto-timed measurements is greater than 99.9% relative to clinical data.
4. DISCUSSION AND CONCLUSION
In this paper, texture features are calculated in an anthropomorphic phantom for DBT. The mean from repeated auto-timed measurements was compared against the distribution of values in clinical data. To assess the realism of each feature, we analyzed whether the mean is within the middle 95% of the clinical distribution. Most features exhibited realism in the reconstruction; however, fewer features exhibited realism in the synthetic 2D image. A potential limitation of this study is that there were different groups of subjects for analysis of the reconstruction and the synthetic 2D images.
The phantom was created from a compartment-based model of glandular and adipose tissue.13–16 In future work, a phantom with finer textural detail can be created by increasing the number of compartments (thus reducing their size). Future work should investigate whether the textural realism can be improved by changing the number of compartments used to create the phantom.
In this paper, the clinical data were binned into strata corresponding to different thicknesses under compression. The phantom texture was compared against clinical data in the same thickness stratum (45.0 to 55.0 mm). One limitation of this paper is that we have not quantified whether some features are more strongly dependent on thickness than others. An additional limitation of this paper is that we have not analyzed how texture features differ between CC and MLO views. Future work should calculate the texture features separately in each view. For the purpose of this paper, all views for each subject were included in the data set for the reconstruction, yet only MLO views were included in the data set for the synthetic 2D images.
In addition to the 26 features considered in this paper, other features such as fractal dimension should be analyzed in future work. Also, additional slices in the reconstruction should be considered, not simply the central slice. As the vertical coordinate of the slice increases, there is greater magnification and hence loss of resolution due to focal spot blurring.21
5. ACKNOWLEDGEMENT
With regard to the project described by this paper, support was provided by grants R01CA154444, R01CA161749 and U54CA163313 from the National Institute of Health, and Burroughs-Wellcome Fund IRSA 1016451. The content is solely the responsibility of the authors and does not necessarily represent the official views of the funding agencies.
6. REFERENCES
- 1.Gur D, Zuley ML, Anello MI, et al. Dose Reduction in Digital Breast Tomosynthesis (DBT) Screening using Synthetically Reconstructed Projection Images: An Observer Performance Study. Academic Radiology. 2012;19(2):166–171. [DOI] [PMC free article] [PubMed] [Google Scholar]
- 2.Zuley ML, Guo B, Catullo VJ, et al. Comparison of Two-dimensional Synthesized Mammograms versus Original Digital Mammograms Alone and in Combination with Tomosynthesis Images. Radiology. 2014;271(3):664–671. [DOI] [PMC free article] [PubMed] [Google Scholar]
- 3.Skaane P, Bandos AI, Eben EB, et al. Two-View Digital Breast Tomosynthesis Screening with Synthetically Reconstructed Projection Images: Comparison with Digital Breast Tomosynthesis with Full-Field Digital Mammographic Images. Radiology. 2014;271(3):655–663. [DOI] [PubMed] [Google Scholar]
- 4.Gilbert FJ, Tucker L, Gillan MGC, et al. Accuracy of Digital Breast Tomosynthesis for Depicting Breast Cancer Subgroups in a UK Retrospective Reading Study (TOMMY Trial). Radiology. 2015;277(3):697–706. [DOI] [PubMed] [Google Scholar]
- 5.Zuckerman SP, Conant EF, Keller BM, et al. Implementation of Synthesized Two-dimensional Mammography in a Population-based Digital Breast Tomosynthesis Screening Program. Radiology. 2016;281(3):730–736. [DOI] [PMC free article] [PubMed] [Google Scholar]
- 6.Zuckerman SP, Maidment ADA, Weinstein SP, McDonald ES, Conant EF. Imaging With Synthesized 2D Mammography: Differences, Advantages, and Pitfalls Compared With Digital Mammography. American Journal of Roentgenology. 2017;209:222–229. [DOI] [PubMed] [Google Scholar]
- 7.Aujero MP, Gavenonis SC, Benjamin R, Zhang Z, Holt JS. Clinical Performance of Synthesized Two-dimensional Mammography Combined with Tomosynthesis in a Large Screening Population. Radiology. 2017;283(1):70–76. [DOI] [PubMed] [Google Scholar]
- 8.Ratanaprasatporn L, Chikarmane SA, Giess CS. Strengths and Weaknesses of Synthetic Mammography in Screening. RadioGraphics. 2017;37(7):1913–1927. [DOI] [PubMed] [Google Scholar]
- 9.Friedewald SM, Rafferty EA, Rose SL, et al. Breast Cancer Screening Using Tomosynthesis in Combination With Digital Mammography. Journal of the American Medical Association. 2014;311(24):2499–2507. [DOI] [PubMed] [Google Scholar]
- 10.Vedantham S, Karellas A, Vijayaraghavan GR, Kopans DB. Digital Breast Tomosynthesis: State of the Art. Radiology. 2015;277(3):663–684. [DOI] [PMC free article] [PubMed] [Google Scholar]
- 11.McDonald ES, Oustimov A, Weinstein SP, Synnestvedt MB, Schnall M, Conant EF. Effectiveness of Digital Breast Tomosynthesis Compared With Digital Mammography: Outcomes Analysis From 3 Years of Breast Cancer Screening. JAMA Oncology. 2016;2(6):737–743. [DOI] [PubMed] [Google Scholar]
- 12.Sharpe RE, Venkataraman S, Phillips J, et al. Increased Cancer Detection Rate and Variations in the Recall Rate Resulting from Implementation of 3D Digital Breast Tomosynthesis into a Population-based Screening Program. Radiology. 2016;278(3):698–706. [DOI] [PMC free article] [PubMed] [Google Scholar]
- 13.Bakic PR, Zhang C, Maidment ADA. Development and characterization of an anthropomorphic breast software phantom based upon region-growing algorithm. Medical Physics. 2011;38(6):3165–3176. [DOI] [PMC free article] [PubMed] [Google Scholar]
- 14.Carton A-K, Bakic P, Ullberg C, Derand H, Maidment ADA. Development of a physical 3D anthropomorphic breast phantom. Medical Physics. 2011;38(2):891–896. [DOI] [PMC free article] [PubMed] [Google Scholar]
- 15.Pokrajac DD, Maidment ADA, Bakic PR. Optimized generation of high resolution breast anthropomorphic software phantoms. Medical Physics. 2012;39(4):2290–2302. [DOI] [PMC free article] [PubMed] [Google Scholar]
- 16.Chui JH, Pokrajac DD, Maidment ADA, Bakic PR. Towards Breast Anatomy Simulation Using GPUs. Lecture Notes in Computer Science. 2012;7361:506–513. [Google Scholar]
- 17.Vieira MAC, Oliveira HCRd, Nunes PF, et al. Feasibility Study of Dose Reduction in Digital Breast Tomosynthesis Using Non-Local Denoising Algorithms. Paper presented at: SPIE Medical Imaging2015; Orlando, FL. [Google Scholar]
- 18.Zheng Y, Keller BM, Ray S, et al. Parenchymal texture analysis in digital mammography: A fully automated pipeline for breast cancer risk assessment. Medical Physics. 2015;42(7):4149–4160. [DOI] [PMC free article] [PubMed] [Google Scholar]
- 19.Keller BM, Oustimov A, Wang Y, et al. Parenchymal texture analysis in digital mammography: robust texture feature identification and equivalence across devices. Journal of Medical Imaging. 2015;2(2):024501-024501–024501-024513. [DOI] [PMC free article] [PubMed] [Google Scholar]
- 20.Gastounioti A, Conant EF, Kontos D. Beyond breast density: a review on the advancing role of parenchymal texture analysis in breast cancer risk assessment. Breast Cancer Research. 2016;18:91. [DOI] [PMC free article] [PubMed] [Google Scholar]
- 21.Johns HE, Cunningham JR. Chapter 16: Diagnostic Radiology. The Physics of Radiology. 4th ed. Springfield, IL: Charles C Thomas; 1983:557–669. [Google Scholar]


