

Abstract
Variability in genes involved in drug pharmacokinetics or drug response can be responsible for suboptimal treatment efficacy or predispose to adverse drug reactions. In addition to common genetic variations, large-scale sequencing studies have uncovered multiple rare genetic variants predicted to cause functional alterations in genes encoding proteins implicated in drug metabolism, transport and response. To understand the functional importance of rare genetic variants in DPYD, a pharmacogene whose alterations can cause severe toxicity in patients exposed to fluoropyrimidine-based regimens, massively parallel sequencing of the exonic regions and flanking splice junctions of the DPYD gene was performed in a series of nearly 3000 patients categorized according to pre-emptive DPD enzyme activity using the dihydrouracil/uracil ([UH2]/[U]) plasma ratio as a surrogate marker of DPD activity. Our results underscore the importance of integrating next-generation sequencing-based pharmacogenomic interpretation into clinical decision making to minimize fluoropyrimidine-based chemotherapy toxicity without altering treatment efficacy.
Subject terms: Predictive markers, Genetic testing
Introduction
An increasing number of clinically relevant association between drug response and genomic variation has been reported over the past years, resulting in evidence-based pharmacogenetic guidelines [1, 2]. For instance, the Pharmacogenomics Knowledge base PharmGKB (https://www.pharmgkb.org) has collected and curated information for more than 740 drugs and, to date, contains 189 clinical guidelines and 868 drug label annotations approved by various pharmaceutical regulatory organizations such as the US Food and Drug Administration (FDA) or the European Medicines Agency (EMA). Nevertheless, although many patients would benefit from pharmacogenetics-based prescription policy [3], only limited applications are observed in clinical practice, especially in primary care [4–7]. Indeed, genetic testing is in most cases performed retrospectively when adverse side effects arise or when a drug lacks efficacy. Main barriers to the implementation of pharmacogenetics into routine clinical practice are the lack of awareness and education of physicians and pharmacists, solid scientific evidence of pharmacogenomic biomarkers, harmonized and implementable pharmacogenomic guidelines and in some instances, the absence of a dedicated infra-structure to integrate pharmacogenetics testing into the workflow of health care providers [6, 8]. Seminal studies have notably shown the importance of common genetic variants affecting phase I or phase II enzymes in the resistance to various pharmacological agents or the occurrence of life-threatening side effects [9]. Prominent examples include the association between common defective TPMT alleles and the risk of hematotoxicity following 6-mercaptopurine exposure [10] or the impact of frequent specific CYP2C19 polymorphisms on clopidogrel efficacy [11]. Nevertheless, these common genetic variants, while important, only account for little of the inherited individual variation in drug response and a substantial fraction of the genetically encoded variability in drug pharmacokinetics remains to be elucidated. Interestingly, recent large-scale studies have unveiled that more than 90% of the genetic variability in genes associated with drug metabolism and disposition is assigned to rare genetic variants, but the functional impact of such rare pharmacogenetic variants on drug response remains poorly documented.
Fluoropyrimidine-based treatment regimens are the standard therapy for many distinct types of advanced solid tumors including breast, colorectal as well as head and neck cancers [12]. Nevertheless, up to 30% of patients will experience serious adverse drug reactions such as diarrhea, stomatitis, mucositis, myelosuppression or neurotoxicity, which can be lethal in 0.5–1% of cases [12, 13]. Dihydropyrimidine dehydrogenase (DPD), the initial and rate limiting enzyme involved in the catabolism of 5-fluorouracil (5-FU), is responsible for the elimination of 80–85% of the administered dose. Plasma concentrations of uracil ([U]), the endogenous substrate for DPD, or its product dihydrouracil (UH2) are routinely used as a surrogate marker for systemic DPD activity [14]. Indeed, pretreatment [U] and [UH2]/[U] ratio are highly correlated with systemic DPD activity and many studies have shown a relationship between fluoropyrimidine-induced toxicity and a DPD phenotype characterized by high [U] or low [UH2]/[U] ratio [14, 15]. However, the equipment required as well as the recommended pre-analytical conditions for the measurement of [U] and [UH2] are not widely available in many clinical laboratories [16, 17]. Therefore, implementation of alternative approaches such as DPYD-based pharmacogenetic assays are convenient complementary methods to accurately predict DPD activity [16]. Indeed, according to PharmGKB, more than 20 loss-of-function DPYD variants have been reported to alter DPD enzymatic activity, and consequently patients harboring such variants are exposed to an increased risk of severe toxicity when receiving standard dose of fluoropyrimidine. For this reason, international guidelines now recommend pre-emptive DPYD genotyping for several clinically relevant defective variants: i.e., c.1905+1G>A (DPYD*2A), c.1679T>G (DPYD*13), c.2846A>T, and Haplotype B3 (c.1236G>A or c.1129–5923C>G) as well as genotype-guided prescribing recommendations [17, 18].
In this study, using Next Generation Sequencing (NGS), we comprehensively assessed the relationship between DPYD genotype and DPD phenotype in a series of 2 972 patients and identified new rare clinically relevant variants associated with DPD deficiency. Our results also show that rare DPYD genetic variants account for a significative part of the interindividual variability of DPD activity. Therefore, comprehensive NGS-based genotyping instead of candidate SNP interrogation should be considered for the guidance of personalized fluropyrimidine therapy.
Materials and methods
Studied cohort
All patients included in this study were eligible for an uracil analog-based chemotherapy (Supplementary Table S1). Only those for which both DPYD genotype and DPD phenotype were available were included. The protocol has been certified to be in accordance with French laws by the Institutional Review Board of Centre Hospitalier Universitaire de Lille (France). Genotyping analysis and DPD phenotyping were performed as described in our local regular protocol to identify DPD-deficient patients at increased risk of severe fluoropyrimidine-induced toxicity. However, information regarding fluoropyrimidine toxicity was not available. All patients provided their written informed consent for genetic analysis and to publish this paper in accordance with institutional guidelines and the Declaration of Helsinki and Istanbul. The DNA collection was registered by the Ministère de l’Enseignement Supérieur et de la Recherche (Paris, France) under the number: DC-2008–642.
DPD phenotyping
Pretreatment Plasma Uracil [U] and dihydrouracil [UH2] were quantified using a Waters TQD UPLC®-MS/MS System (Waters Corp., Milford, MA, USA) equipped with an electrospray ionization interface according to the method described by Coudore et al. [19]. Data acquisition and processing were performed using MassLynx v.4.0 software. DPD activity was categorized as normal, partial or complete deficiency based on previous reports using the [UH2]/[U] ratio [20–26]. Indeed, although no consensual cut-off values for the [UH2]/[U] ratio has been established yet, a [UH2]/[U] ratio cut-off below or equal to 10 was chosen for DPD deficiency as it has been previously demonstrated as a good predictor of fluoropyrimidine toxicity [15, 27]. Therefore, partial DPD deficiency was defined as [UH2]/[U] ≤ 10 whereas complete DPD deficiency was defined as [UH2]/[U] ≤ 1. Alternatively, DPD activity can also be estimated by measuring [U] and a cut-off value over or equal to 16 µg/mL is used to define partial deficiency and over 150 µg/mL for complete deficiency [15].
DPYD genotyping
All patients gave their written informed consent for genetic testing. Genomic DNA was extracted from peripheral blood using Chemagic Star (Chemagen, Baesweiler, Germany) and then quantified using the NanoDrop® spectrophotometer (ThermoFisher Scientific, Waltham, MA, USA) according to the manufacturer’s instructions. Genomic sequence of the DPYD gene was retrieved from the NCBI website and the Reference Sequence NG_008807.2 was subsequently used. Primers were designed to include all exonic regions and at least 30 bp of each flanking intron using Fluidigm D3™ assay design web-based tool. A total of 64 unique primer pairs were created and are listed in Supplementary Table S2. Custom-designed primer pairs to target DPYD exonic regions and exon–intron boundaries were designed and optimized for the Fluidigm Access Array (Fluidigm, South San Francisco, CA, USA). Amplification of genomic DNA was performed in up to 10-plex PCR reaction wells, followed by addition of barcode indexes and sequencing adaptors by further PCR according to manufacturer’s instructions. Pooled amplicons were harvested and diluted to prepare unidirectional libraries for 150 base-pair (bp) paired-end sequencing on Illumina MiSeq sequencing platform (Illumina, San Diego, CA, USA). Illumina NGS reads were trimmed for base Phred quality control (mean quality in a 30 bp sliding window >20 and 3′ base quality ≥6) and aligned with Burrows–Wheeler Aligner (v0.6.1-r112-master) on hg19 human genome reference sequence. Variant-calling was achieved using MiSeq Reporter v2.6, GATK v3.7 or GATK v4.1.4.0 (Genome Analysis Toolkit) [28] without downsampling or removal of PCR duplicates; variants with quality/depth < 5 or depth < 30 were filtered. All very rare (MAF ≤ 0.1%) and novel variants identified by NGS analysis were validated by Sanger sequencing (Table S2). The functional consequences of each variant were estimated by in silico analysis, using bioinformatic prediction tools such as SIFT, PolyPhen-2 or CADD and on the basis of the ACMG classification.
Statistical analyses
Sample size was chosen empirically based on our previous experiences in the calculation of experimental variability; no statistical method was used to predetermine sample size and no samples or data points were excluded from the reported analyses. Data are described as the medians ± standard deviations, or n (%). Since [U] and [UH2]/[U] values were not normally distributed, non-parametric tests were performed. Allelic frequencies and genotype distribution were estimated by gene counting and tested for Hardy–Weinberg equilibrium. For the comparison of proportions and to evaluate the Hardy–Weinberg equilibrium, we used the chi-square test. As in most cases, a low number of individuals carries the alternate allele homozygote, the influence of the genotypes on DPD activity was assessed by clustering genotypes into a dominant inheritance model. Then, genotypes were compared using non parametric Mann–Whitney and Kruskal–Wallis tests. The level of significance was set at p < 0.05. All analyses were two-sided. Statistical analyses were performed using Prism® 5.0 (GraphPad) and JMP (SAS) software.
Results
Inter-individual variability of pretherapeutic DPD enzyme activity
This retrospective study included 2972 subjects. Mean patient age was 65 ± 11 years, and the sex ratio (M/F) was 1.2 (Supplementary Table S1). Using a cut-off value below or equal to 10 for the [UH2]/[U] ratio, 580 patients (19.7%) were categorized with partial DPD deficiency, whereas no patient exhibited complete DPD deficiency. Mean age did not significantly differ between the partial DPD deficiency group and the normal DPD group (Supplementary Table S1). Overall, [U] and [UH2]/[U] values identified 628 patients (21.1%) with DPD deficiency, but these parameters were in agreement in only 114 (18.2%) patients (Table 1). Indeed, 466 (15.7%) patients presented [UH2]/[U] ≤ 10 and [U] < 16 ng/mL, and 48 (1.6%) presented [UH2]/[U] > 10 and [U] ≥ 16 ng/mL (Table 1). The [UH2]/[U] level below which [U] values were all ≥ 16 ng/mL was 4.6, and the [U] level above which [UH2]/[U] values were all ≤ 10 was 49 ng/mL, suggesting that a better agreement between [UH2]/[U] and [U] values to identify DPD deficiency would require the use of more restrictive thresholds. Based on these results, the current cut-off values for [U] and [UH2]/[U] do not identify DPD deficiency in an equivalent manner, and a [UH2]/[U] ratio ≤ 10 yields a higher proportion of individuals classified with partial DPD deficiency than [U] levels > 16 ng/mL.
Table 1.
Number of patients according to the uracil plasma concentration ([U]) and the dihydrouracil/uracil ([UH2]/[U]) plasma ratio.
| Phenotype | [U] < 16 ng/mL | [U] ≥ 16 ng/mL |
|---|---|---|
| [UH2]/[U] > 10 | 2344 | 48 |
| [UH2]/[U] ≤ 10 | 466 | 114 |
Genetic variants identified in DPYD
The group of patients with partial DPD deficiency represented a total of 580 patients, including 134 wild-type patients (DPYD*1/*1) and 446 patients harboring at least one genetic variant (208 patients carried one genetic variant and 238 patients more than one). Overall, genetic variants identified in patients with partial DPD deficiency represent a total of 809 variants. The remaining 2392 patients exhibiting normal DPD activity include 623 wild-type patients (DPYD*1/*1) and 1769 mutated patients in which a total of 3183 genetic variants were identified (831 carrying a single genetic variant and 938 carrying more than one). The mean coverage (read depth) of the identified genetic variants was 1130 (range: 33–4995) for the group of patients with DPD partial deficiency and 1131 (range: 33–7612) for group of patients whose phenotype was unaltered. 30 distinct genetic variants were identified in the group of patients exhibiting partial DPD deficiency (29 single nucleotide polymorphisms and one indel). Among these genetic variants, 23% (7/30) were common (MAF ≥ 1%) and 77% (23/30) were considered as rare /very rare or novel (MAF < 1%), and among these, 58% (13/23) were classified as deleterious according to variant effect prediction algorithms (Table 2). In addition, the majority of variants were missense (77%; 23/30), one was non-sense, one was categorized as indel and two were located in canonical splice sites. Among the remaining variants, 10% (3/30) were synonymous. In the group of patients exhibiting a normal DPD phenotype, 58 unique genetic variants were identified including 56 single nucleotide polymorphisms and two indel. 12% (7/58) were common whereas 88% (51/58) were considered as rare/very rare or novel (MAF < 1%) including 35% (18/51) classified as deleterious by functional prediction algorithms. In addition, the majority of variants were missense (55%, 32/58), two were non sense and six were located in canonical splice sites. Among the remaining variants, 29% (17/58) were synonymous and 2% (1/58) were located in the UTR (Untranslated Regions). All rare genetic variants were heterozygous. Hardy–Weinberg equilibrium for each common and rare variant and allelic frequencies are reported in Supplementary Table S3. As the French law of information and freedom prohibits to collect information on ethnicity, it was thus impossible to provide data frequency according to patient ancestry. We thus made the assumption that our population was mainly European (Supplementary Table S3).
Table 2.
List of the genetic variants identified in DPYD by next generation sequencing.
| Position (GRCh37) | Ref | Alt | Statut | Number of patients | Allele Freq. | HGVS | dbSNP ID | Allele | Transcript consequences | SIFT (score) | PolyPhen (score) | CADD(score) | ClinVar ID | GnomAD (Eur. MAF) | ||
|---|---|---|---|---|---|---|---|---|---|---|---|---|---|---|---|---|
| Total | Deficient | Coding DNA | Protein | |||||||||||||
| MAF ≥ 1% | ||||||||||||||||
| chr1:97770920 | C | T | Het | 293 | 81 (28%) | 5.10% | c.2194G>A | p.Val732Ile | rs1801160 | *6 | missense variant | T (0.1) | B (0.30) | 24.4 | 100080 | 4.53% |
| Hom | 5 | 1 (20%) | ||||||||||||||
| chr1:97915624 | A | G | Het | 208 | 32 (15%) | 3.63% | c.1896T>C | p.Phe632Phe | rs17376848 | synonymous variant | 3.576 | 100088 | 5.04% | |||
| Hom | 4 | 0 (0%) | ||||||||||||||
| chr1:97981395 | T | C | Het | 951 | 178 (19%) | 20.24% | c.1627A>G | p.Ile543Val | rs1801159 | *5 | missense variant | D (0.04) | B (0) | 15.46 | 100092 | 19.52% |
| Hom | 126 | 15 (12%) | ||||||||||||||
| chr1:97981421 | C | T | Het | 136 | 31 (23%) | 2.36% | c.1601G>A | p.Ser534Asn | rs1801158 | *4 | missense variant | D (0.01) | B (0.03) | 22.8 | 100094 | 1.43% |
| Hom | 2 | 2 (100%) | ||||||||||||||
| chr1:98039419 | C | T | Het | 97 | 19 (20%) | 1.67% | c.1236G>A | p.Glu412Glu | rs56038477 | hapB3 | synonymous variant | 9.659 | 100100 | 1.40% | ||
| Hom | 1 | 0 (0%) | ||||||||||||||
| chr1:98165091 | T | C | Het | 486 | 113 (23%) | 8.92% | c.496A>G | p.Met166Val | rs2297595 | missense variant | D (0) | PD (0.99) | 24.8 | 100116 | 8.59% | |
| Hom | 22 | 2 (9%) | ||||||||||||||
| chr1:98348885 | A | G | Het | 930 | 180 (19%) | 22.98% | c.85T>C | p.Cys29Arg | rs1801265 | *9A | missense variant | T (1) | B (0) | 435 | 22.45% | |
| Hom | 218 | 40 (18%) | ||||||||||||||
| 1% > MAF ≥ 0. 1% | ||||||||||||||||
| chr1:97544543 | G | T | Het | 5 | 3 (60%) | 0.08% | c.3067C>A | p.Pro1023Thr | rs114096998 | missense variant | D (0) | B (0.42) | 18.94 | 100069 | 0.36% | |
| chr1:97547947 | T | A | Het | 22 | 15 (68%) | 0.37% | c.2846A>T | p.Asp949Val | rs67376798 | missense variant | D (0) | PD (0.52) | 25.3 | 88974 | 0.29% | |
| chr1:97915614 | C | T | Het | 12 | 8 (67%) | 0.20% | c.1905+1G>A | p.(?) | rs3918290 | *2A | splice donor variant | 33 | 432 | 0.57% | ||
| chr1:97981343 | A | C | Het | 11 | 6 (55%) | 0.19% | c.1679T>G | p.Ile560Ser | rs55886062 | *13 | missense variant | D (0) | PD (0.94) | 27.9 | 88975 | 0.031% |
| chr1:98015269 | G | A | Het | 7 | 0 (0%) | 0.12% | c.1371C>T | p.Asn457Asn | rs57918000 | synonymous variant | 11.57 | 100097 | 0.24% | |||
| chr1:98039437 | C | T | Het | 5 | 2 (40%) | 0.08% | c.1218G>A | p.Met406Ile | rs61622928 | missense variant | T (0.31) | B (0) | 19.85 | 100101 | 0.67% | |
| chr1:98144726 | T | C | Het | 8 | 2 (25%) | 0.13% | c.775A>G | p.Lys259Glu | rs45589337 | missense variant | D (0) | PD (0.62) | 23 | 235464 | 0.61% | |
| MAF ≤ 0.1% | ||||||||||||||||
| chr1:97544541 | C | T | Het | 1 | 0 | 0.02% | c.3069G>A | p.Pro1023Pro | rs749122978 | synonymous variant | D (0) | B (0.42) | 0.179 | NA | 0.002% | |
| chr1:97547907 | G | A | Het | 1 | 0 | 0.02% | c.2886C>T | p.Thr962Thr | rs368617815 | synonymous variant | 11.25 | NA | 0.006% | |||
| chr1:97547921 | T | C | Het | 3 | 3 (100%) | 0.05% | c.2872A>G | p.Lys958Glu | rs141044036 | missense variant | D (0.01) | PD (1) | 28.9 | 551659 | 0.002% | |
| chr1:97564044 | C | T | Het | 1 | 0 | 0.02% | c.2766+1G>A | p.(?) | rs1355754530 | splice donor variant | 34 | NA | 0.001% | |||
| chr1:97564177 | A | C | Het | 1 | 0 | 0.02% | c.2634T>G | p.Ser878Arg | rs919596571 | missense variant | T (0.36) | B (0.00) | 23 | 874134 | 0.001% | |
| chr1:97658667 | CT | C | Het | 1 | 0 | 0.02% | c.2579del | p.Gln860Argfs*9 | rs746991079 | frameshift variant | 34 | 551707 | 0.004% | |||
| chr1:97658736 | C | A | Het | 1 | 0 | 0.02% | c.2511G>T | p.Leu837Leu | rs763174477 | synonymous variant | 9.956 | NA | 0.016% | |||
| chr1:97700416 | C | T | Het | 1 | 0 | 0.02% | c.2434G>A | p.Val812Ile | rs371313778 | missense variant | T (0.11) | B (0.03) | 22.9 | NA | 0.012% | |
| chr1:97700495 | C | T | Het | 1 | 0 | 0.02% | c.2355G>A | p.Leu785Leu | NA | synonymous variant | 10.03 | NA | ||||
| chr1:97700520 | G | T | Het | 1 | 1 | 0.02% | c.2330C>A | p.Ala777Asp | rs374825099 | missense variant | T (0.05) | B (0.4) | 25.5 | NA | 0.003% | |
| chr1:97700547 | G | T | Het | 1 | 0 | 0.02% | c.2303C>A | p.Thr768Lys | rs56005131 | missense variant | T (0.16) | B (0.05) | 22.7 | 287480 | 0.019% | |
| chr1:97771751 | C | T | Het | 3 | 1 (33%) | 0.05% | c.2161G>A | p.Ala721Thr | rs145548112 | missense variant | D (0) | PD (1) | 31 | 100082 | 0.015% | |
| chr1:97771760 | C | A | Het | 1 | 1 | 0.02% | c.2152G>T | p.Val718Leu | NA | missense variant | T (0.24) | B (0.01) | 21.3 | NA | ||
| chr1:97771837 | C | T | Het | 1 | 0 | 0.02% | c.2075G>A | p.Arg692Gln | rs375436137 | missense variant | T (0.09) | B (0.04) | 26.8 | 2412214 | 0.002% | |
| chr1:97771841 | C | T | Het | 1 | 0 | 0.02% | c.2071G>T | p.Val691Leu | rs202212118 | missense variant | T (0.1) | PD (0.97) | 29.5 | 298286 | 0.015% | |
| chr1:97839112 | C | T | Het | 1 | 0 | 0.02% | c.2058+5G>A | p.(?) | rs367623519 | splice region variant | 22.7 | NA | 0.005% | |||
| chr1:97847973 | C | T | Het | 1 | 1 | 0.02% | c.1950G>A | p.Trp650* | NA | stop gain | 45 | NA | ||||
| chr1:97915615 | G | C | Het | 1 | 0 | 0.02% | c.1905C>G | p.Asn635Lys | rs3918289 | missense variant | T (1) | B (0.02) | 1.764 | NA | 0.002% | |
| chr1:97915674 | T | G | Het | 1 | 1 | 0.02% | c.1846A>C | p.Lys616Gln | rs368146607 | missense variant | D (0.01) | PD (0.96) | 26.2 | NA | 0.003% | |
| chr1:97915692 | T | C | Het | 1 | 0 | 0.02% | c.1828A>G | p.Ile610Val | NA | missense variant | D (0.01) | PD (0.85) | 24.9 | NA | ||
| chr1:97915724 | A | G | Het | 1 | 1 | 0.02% | c.1796T>C | p.Met599Thr | rs147601618 | missense variant | T (0.42) | B (0) | 18.83 | 550673 | 0.006% | |
| chr1:97915745 | C | T | Het | 1 | 1 | 0.02% | c.1775G>A | p.Arg592Gln | rs138616379 | missense variant | D (0) | PD (0.97) | 29.8 | 554703 | 0.002% | |
| chr1:97915769 | G | A | Het | 1 | 0 | 0.02% | c.1751C>T | p.Thr584Ile | NA | missense variant | T (0.12) | B (0.26) | 25.2 | NA | ||
| chr1:97915777 | G | A | Het | 1 | 1 | 0.02% | c.1743C>T | p.Asp581Asp | rs555178721 | splice region variant | 11.55 | NA | 0.005% | |||
| chr1:97981321 | T | A | Het | 2 | 0 | 0.03% | c.1701A>T | p.Gly567Gly | rs148372305 | synonymous variant | 9.725 | 738289 | 0.024% | |||
| chr1:97981377 | C | G | Het | 1 | 0 | 0.02% | c.1645G>C | p.Ala549Pro | rs140039091 | missense variant | D (0) | PD (1) | 29.5 | NA | <0.001% | |
| chr1:97981407 | C | T | Het | 1 | 1 | 0.02% | c.1615G>A | p.Gly539Arg | rs142619737 | missense variant | D (0) | PD (0.97) | 23.3 | 100093 | 0.020% | |
| chr1:97981408 | G | A | Het | 1 | 0 | 0.02% | c.1614C>T | p.Ala538Ala | rs760853559 | synonymous variant | 6.617 | 298288 | 0.006% | |||
| chr1:98015121 | C | T | Het | 1 | 0 | 0.02% | c.1519G>A | p.Val507Ile | rs138391898 | missense variant | T (0.93) | B (0) | 0.92 | NA | 0.001% | |
| chr1:98015142 | A | G | Het | 1 | 0 | 0.02% | c.1498T>C | p.Ser500Pro | NA | missense variant | D (0) | PD (0.91) | 25.3 | NA | ||
| chr1:98015280 | T | C | Het | 1 | 1 | 0.02% | c.1360A>G | p.Ile454Val | rs927463053 | missense variant | T (0.71) | B (0) | 15.44 | NA | 0.001% | |
| chr1:98015291 | G | C | Het | 1 | 0 | 0.02% | c.1349C>G | p.Ala450Gly | rs72975710 | missense variant | D (0.01) | B (0.07) | 28 | 298294 | 0.002% | |
| chr1:98039515 | A | G | Het | 2 | 0 | 0.03% | c.1140T>C | p.Ala380Ala | rs150759598 | synonymous variant | 9.718 | NA | 0.005% | |||
| chr1:98058790 | C | T | Het | 1 | 0 | 0.02% | c.1112G>A | p.Arg371Lys | NA | missense variant | D (0.03) | B (0.07) | 25.3 | NA | ||
| chr1:98058813 | G | A | Het | 1 | 1 | 0.02% | c.1089C>T | p.Phe363Phe | rs764173823 | synonymous variant | 13.76 | NA | 0.002% | |||
| chr1:98058829 | C | T | Het | 1 | 0 | 0.02% | c.1073G>A | p.Arg358His | rs573299212 | missense variant | D (0) | PD (0.98) | 29.9 | NA | 0.002% | |
| chr1:98058915 | T | C | Het | 1 | 0 | 0.02% | c.987A>G | p.Pro329Pro | NA | synonymous variant | 11.46 | NA | ||||
| chr1:98060643 | C | T | Het | 1 | 0 | 0.02% | c.930G>A | p.Leu310Leu | NA | synonymous variant | 11 | NA | ||||
| chr1:98060721 | A | C | Het | 1 | 0 | 0.02% | c.852T>G | p.Gly284Gly | NA | splice region variant | 14.32 | NA | ||||
| chr1:98144657 | C | T | Het | 1 | 0 | 0.02% | c.844G>A | p.Gly282Arg | NA | missense variant | D (0) | PD (1) | 32 | NA | ||
| chr1:98164964 | C | A | Het | 1 | 1 | 0.02% | c.623G>T | p.Arg208Leu | rs376073289 | missense variant | D (0) | PD (1) | 29.6 | 806173 | 0.002% | |
| chr1:98164975 | G | C | Het | 1 | 0 | 0.02% | c.612C>G | p.Ser204Ser | rs768519000 | synonymous variant | 7.559 | NA | <0.001% | |||
| chr1:98164986 | T | G | Het | 1 | 1 | 0.02% | c.601A>C | p.Ser201Arg | rs72549308 | missense variant | D (0) | PD (1) | 26.4 | NA | 0.003% | |
| chr1:98164996 | A | G | Het | 1 | 0 | 0.02% | c.591T>C | p.Pro197Pro | rs758927521 | synonymous variant | 11.97 | 1750509 | <0.001% | |||
| chr1:98165030 | T | C | Het | 1 | 0 | 0.02% | c.557A>G | p.Tyr186Cys | rs115232898 | missense variant | D (0, 0.1) | PD (0.98) | 25.5 | 100113 | 0.21% | |
| chr1:98165042 | A | T | Het | 1 | 0 | 0.02% | c.545T>A | p.Met182Lys | rs779728902 | missense variant | T (0.35) | B (0.01) | 23.9 | 1321453 | 0.005% | |
| chr1:98165063 | G | A | Het | 1 | 1 | 0.02% | c.524C>T | p.Ser175Leu | rs371792178 | missense variant | T (0.06) | B (0) | 18.2 | NA | 0.004% | |
| chr1:98187121 | T | G | Het | 1 | 0 | 0.02% | c.428A>C | p.Tyr143Ser | NA | missense variant | T (0.39) | B (0.08) | 17.8 | NA | ||
| chr1:98205947 | C | T | Het | 1 | 0 | 0.02% | c.321+1G>A | p.(?) | rs746368304 | splice donor variant | 35 | 2439928 | 0.002% | |||
| chr1:98205966 | N1 | G | Het | 3 | 1 (33%) | 0.05% | c.299_302del | p.Phe100Serfs*15 | rs539032572 | *7 | frameshift variant | 33 | 495550 | 0.010% | ||
| chr1:98205983 | C | G | Het | 1 | 0 | 0.02% | c.286G>C | p.Asp96His | rs773159364 | missense variant | D (0) | PD (0.99) | 25.8 | NA | <0.001% | |
| chr1:98293727 | A | N2 | Het | 1 | 0 | 0.02% | c.168_175dup | p.Phe59* | NA | stop gain | NA | |||||
| chr1:98348881 | G | T | Het | 1 | 1 | 0.02% | c.89C>A | p.Ser30Tyr | NA | missense variant | D (0) | PD (0.98) | 26.9 | NA | ||
| chr1:98386443 | G | A | Het | 1 | 0 | 0.02% | c.36C>T | p.Ile12Ile | NA | synonymous variant | 15.25 | NA | ||||
| chr1:98386447 | T | G | Het | 1 | 0 | 0.02% | c.32A>C | p.Asp11Ala | NA | missense variant | D (0) | PD (0.84) | 23.9 | NA | ||
| chr1:98386452 | C | A | Het | 1 | 0 | 0.02% | c.27G>T | p.Ser9Ser | NA | synonymous variant | 13.9 | NA | ||||
| chr1:98386478 | T | C | Het | 1 | 0 | 0.02% | c.1A>G | p.Met1? | rs772950053 | start lost | D (0) | B (0.23) | 24 | NA | <0.001% | |
Alt alternative allele, B benign, CADD Combined Annotation Dependent Depletion, D deleterious, Eur european, Freq frequency, Het heterozygous, Hom homozygous, MAF minor allelic frequency, N1 GATGA, N2 AAATTATTC, NA not attributed, PD probably damaging, Ref reference allele, T tolerated.
Association between the most clinically relevant DPYD defective variants and DPD deficiency
Dose adjustment based on pretreatment screening for the most clinically relevant DPYD defective variants, i.e. c.1679T>G (DPYD*13, rs55886062), c.1905+1G>A (DPYD*2A, rs3918290) and c.2846A>T (p.Asp949Val or rs67376798), has been shown to improve the safety of chemotherapy regimens based on fluorouracil [29]. Accordingly, international recommendations now provide indications for drug-related genetic tests and DPYD genotype-guided dosing in routine clinical practice [17, 18]. As expected, our data showed a significant association between each of these genetic variants and low DPD activity (Fig. 1).
Fig. 1. Association between the most clinically relevant DPYD defective rare variants and DPD deficiency.
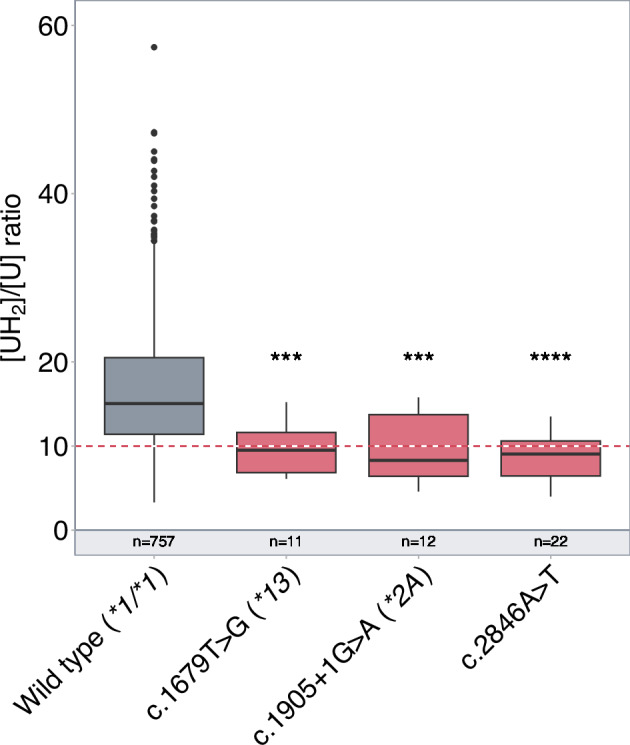
Box plot showing DPD pretreatment activity assessed by the dihydrouracil/uracil ([UH2]/[U]) plasma ratio according to the patient genotype. The box represents the 25–75% quartiles, the line in the box represents the median, whiskers represent the range. The red dash line indicates the ratio threshold used to categorize patients as having partial DPD deficiency (ratio ≤10) or normal DPD activity (ratio>10). n = number of patients; ***P < 0.001; ****P < 0.0001.
Association between common DPYD genetic variants and DPD deficiency
The association between common DPYD genetic variants (MAF ≥ 1%) and DPD activity is summarized in Fig. 2. Among the seven genetic variants identified, three variants (c.1236G>A or rs56038477 p.Glu412Glu ; c.496A>G or rs2297595 p.Met166Val; DPYD*6 c.2194G>A or rs1801160 p.Val732Ile) were significantly more frequent in the group of patients exhibiting partial DPD deficiency. Consistent with previous reports, the c.1236G>A (rs56038477) which is included in the risk haplotype B3 was significantly associated with low DPD activity [30, 31]. Nevertheless, compared to the most clinically relevant DPYD defective variants, the association of these three variants with DPD activity was rather modest (Fig. 2).
Fig. 2. Association between common DPYD genetic variants and DPD deficiency.
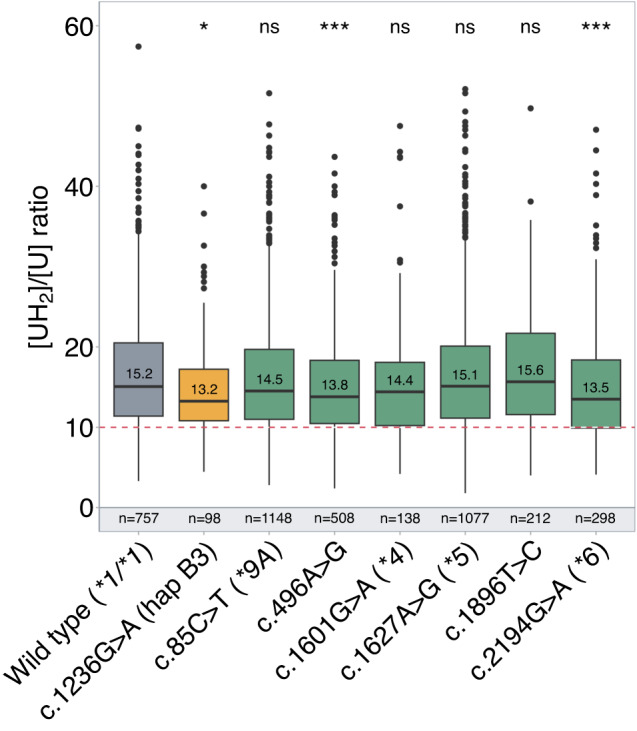
Box plot showing DPD pretreatment activity assessed by the dihydrouracil/uracil ([UH2]/[U]) plasma ratio according to the patient genotype. The hapB3 haplotype is represented in yellow whereas the other common variants are in green. The box represents the 25–75% quartiles, the line in the box represents the median, whiskers represent the range. The red dash line indicates the ratio threshold used to categorize patients as having partial DPD deficiency (ratio ≤10) or normal DPD activity (ratio >10). n = number of patients, ns = non-significant; *P < 0.05, **P < 0.01.
Association between rare, very rare and novel DPYD genetic variants and DPD deficiency
The list of frequent (MAF ≥ 1%), rare (MAF < 1%) and very rare (MAF ≤ 0.1%) variants identified in the DPYD gene in the whole cohort is summarized in Table 2. The number of patients in each group is summarized in Fig. 3A. Variants with a MAF below 1% were found to be enriched in patients exhibiting low DPD activity (9.3% versus 3.2% ; P < 0.00001) (Fig. 3B). This remained significant when excluding the rare clinically relevant DPYD defective variants (4.5% versus 2.6% ; P < 0.03). As many rare variants are likely to have little to no impact on DPD activity, a similar analysis including variants with a MAF below 1% and a putative deleterious impact on DPYD function according to CADD score (threshold above 15) was performed after excluding the rare clinically relevant DPYD defective variants. Indeed, a CADD score above 15 has been previously shown as a good prediction tool for pharmacogenetic variants [32]. Not surprisingly, these were more common in the group of patients with low DPD activity (4.2% versus 1.6% ; P < 0.001) (Fig. 3C). Overall, our results indicate that rare DPYD genetic variants account for a significative part of the interindividual variability of DPD activity.
Fig. 3. Association between DPYD genetic variant frequency and pretreatment DPD activity.

(A) Flow chart showing the distribution of all identified DPYD genetic variants according to the minor allele frequency (MAF) in the groups of partial DPD deficiency ([UH2]/[U] plasma ratio below or equal to 10) and normal DPD activity ([UH2]/[U] plasma ratio above 10) (number of patients are reported) (B) Distribution of DPYD genetic variants based on minor allele frequency (MAF) below 1% according to pretreatment DPD activity (number of patients and percentage are reported). (C) Distribution of the DPYD genetic variants with a MAF below 1% and predicted to impact DPD activity (CADD score > 15) in the group of patients exhibiting normal or low DPD activity (number of patients and percentage are reported).
Discussion
Innovative and collaborative research efforts over the last decades have substantially improved our understanding of the role played by inherited genetic changes on the interindividual variability in drug efficacy or toxicity [33]. Large scale sequencing studies have notably shown that single-nucleotide variants are the most common form of protein-altering “functional variants” identified among genes relevant to the drug pharmacokinetics and pharmacodynamics, also known as pharmacogenes [33, 34]. Of particular interest, results from these studies have also revealed that rare genetic variants account for a substantial part of the unexplained interindividual differences in drug response, but their exact contribution on drug pharmacokinetics has not been systematically evaluated and remains thus poorly understood [33–36]. In this study, we focused on dihydropyrimidine dehydrogenase, a key enzyme in the metabolic catabolism of the chemotherapeutic agent 5-FU or its prodrugs, whose complete deficiency is associated with impaired clearance of 5-FU, excessive drug accumulation and severe toxicity.
Various genotyping and phenotyping approaches have been developed to assess DPD deficiency in order to reduce the incidence of severe toxicity without affecting treatment efficacy by dose tailoring fluoropyrimidine-based therapy. Although various uracil-based methods are routinely used in various countries to predict DPD deficiency, clinical relevance of pretreatment DPD phenotyping by these assays remains controversial [30]. Indeed, optimal cutoff levels that predict toxicity have not been validated yet and previous studies have shown extensive variability in uracil measurements when different cohorts were compared [12, 18, 37, 38]. In line with this, de With et al. [39]. very recently raised important issues against the utility of uracil-based assays in clinical practice given the large inter-center variability observed in measured pretreatment uracil levels. By contrast, the clinical validity of genotype-based approaches has been established in multiple metaanalyses as well as in large prospective studies [39, 40]. Results from these studies have in particular shown that prediction of DPD enzyme activity by molecular genetic testing in routine clinical practice is a reliable method that not only significantly improves patient safety but is also cost‐effective [41]. Consequently, clinical practice guidelines now recommend pre-emptive DPYD genotyping especially in Europe, where these four DPYD deficient alleles are relatively common in individuals of Caucasian ancestry [42]. Nevertheless, even using this strategy, prediction of fluoropyrimidine-induced toxicity remains suboptimal to detect all patients at risk of toxicity [43]. In this context, we aimed to assess whether rare genetic variants significantly contribute to the large interindividual variability of DPD enzyme characterizing a series of about 3 000 patients using new sequencing technologies.
Next Generation Sequencing (NGS) refers to a wide range of technologies enabling rapid and high-throughput sequencing of DNA [44]. In recent years, NGS has been successfully used to comprehensively interrogate the entire spectrum of genomic variations in pharmacogenes including rare variants [33]. In line with this, we applied an NGS-based approach to capture rare and common genetic variations located either in the coding sequence of the DPYD gene or its flanking intronic regions. Specifically, our results confirmed the strong impact of the three clinically rare variants. Additionally, although a significant association between DPD activity and three common known variants including Haplotype B3 was also shown in our large series of patients, their modest effect on DPD activity raises the question of their clinical relevance. Therefore, we suggest additional studies to clarify their use in prospective DPYD genotyping, especially as our study may be biased by several confounding factors. Of particular interest, our results also showed the importance of considering rare DPYD genetic variants to predict the risk of 5-FU toxicity. This is in agreement with results from sequencing data established in large distinct populations, which showed that the vast majority of variants among pharmacogenes are rare (MAF < 1%) or very rare (MAF ≤ 0.1%) and non-synonymous, with an estimated 30-40% of functional variability likely attributed to these rare variants [45]. For example, resequencing of 202 drug target genes in about 14 000 individuals showed that more than 95% of the identified variants had a MAF below 0.5% and that 90% of those were not known [46]. In light of our results, we suggest that additional studies should be performed to assess the association between rare DPYD genetic variants and fluoropyrimidine toxicity. This point is indeed of importance and represents one limitation of our study, as we could only assess the relationship between rare genetic variants and DPD activity.
In conclusion, our results strongly suggest that integrating rare genetic variants into routine pharmacogenetic testing can significantly improve the prediction of DPD enzyme activity. Therefore, we advocate that pre-emptive screening of DPD deficiency should be based on a more comprehensive genotyping approach, combined with phenotyping strategies, to ensure the safe administration of fluoropyrimidines.
Supplementary information
Table S1. Demographic parameters of the whole cohort compared in male versus female patients.
Table S2. Custom-designed primer pairs and Sanger primer pairs.
Table S3. Hardy-Weinberg equilibrium and Minor Allele Frequency observed compared to GnomAD European frequencies for common (MAF ≥ 1) DPYD variants.
Author contributions
Conceptualization, MP, CC and NP; Formal analysis, RL and BH; Investigation, NS and CD; Methodology, RL; Writing – original draft, RL and NP; Writing – review & editing, SF, NB, CVdH, MC, DA and CC.
Data availability
Data and results are available at the Unit of Pharmacogenetics, University Hospital of Lille.
Competing interests
The authors declare no competing interests.
Footnotes
The original online version of this article was revised: Figure 1 was updated.
Publisher’s note Springer Nature remains neutral with regard to jurisdictional claims in published maps and institutional affiliations.
These authors contributed equally: Romain Larrue, Sandy Fellah.
Change history
7/11/2025
The original online version of this article was revised: Figure 1 was updated.
Change history
7/15/2025
A Correction to this paper has been published: 10.1038/s41397-025-00381-2
Supplementary information
The online version contains supplementary material available at 10.1038/s41397-023-00322-x.
References
- 1.Relling MV, Klein TE, Gammal RS, Whirl-Carrillo M, Hoffman JM, Caudle KE. The clinical pharmacogenetics implementation consortium: 10 years later. Clin Pharm Ther. 2020;107:171–5. [DOI] [PMC free article] [PubMed] [Google Scholar]
- 2.Relling MV, Klein TE. CPIC: clinical pharmacogenetics implementation consortium of the pharmacogenomics research network. Clin Pharm Ther. 2011;89:464–7. [DOI] [PMC free article] [PubMed] [Google Scholar]
- 3.Swen JJ, van der Wouden CH, Manson LE, Abdullah-Koolmees H, Blagec K, Blagus T, et al. A 12-gene pharmacogenetic panel to prevent adverse drug reactions: an open-label, multicentre, controlled, cluster-randomised crossover implementation study. Lancet Lond Engl. 2023;401:347–56. [DOI] [PubMed] [Google Scholar]
- 4.Rigter T, Jansen ME, de Groot JM, Janssen SWJ, Rodenburg W, Cornel MC. Implementation of pharmacogenetics in primary care: a multi-stakeholder perspective. Front Genet. 2020;11:10. [DOI] [PMC free article] [PubMed] [Google Scholar]
- 5.St Sauver JL, Bielinski SJ, Olson JE, Bell EJ, Mc Gree ME, Jacobson DJ, et al. Integrating pharmacogenomics into clinical practice: promise vs reality. Am J Med. 2016;129:1093–1099.e1. Oct [DOI] [PMC free article] [PubMed] [Google Scholar]
- 6.Haga SB, Kantor A. Horizon scan of clinical laboratories offering pharmacogenetic testing. Health Aff Proj Hope. 2018;37:717–23. [DOI] [PMC free article] [PubMed] [Google Scholar]
- 7.Oates JT, Lopez D. Pharmacogenetics: an important part of drug development with a focus on its application. Int J Biomed Investig. 2018;1:111. [DOI] [PMC free article] [PubMed] [Google Scholar]
- 8.Pasternak AL, Ward KM, Ateya MB, Choe HM, Thompson AN, Clark JS, et al. Establishment of a pharmacogenetics service focused on optimizing existing pharmacogenetic testing at a large academic health center. J Pers Med. 2020;10:154. [DOI] [PMC free article] [PubMed] [Google Scholar]
- 9.Evans WE, Relling MV. Moving towards individualized medicine with pharmacogenomics. Nature. 2004;429:464–8. [DOI] [PubMed] [Google Scholar]
- 10.Hulot JS, Bura A, Villard E, Azizi M, Remones V, Goyenvalle C, et al. Cytochrome P450 2C19 loss-of-function polymorphism is a major determinant of clopidogrel responsiveness in healthy subjects. Blood. 2006;108:2244–7. [DOI] [PubMed] [Google Scholar]
- 11.Yates CR, Krynetski EY, Loennechen T, Fessing MY, Tai HL, Pui CH, et al. Molecular diagnosis of thiopurine S-methyltransferase deficiency: genetic basis for azathioprine and mercaptopurine intolerance. Ann Intern Med. 1997;126:608–14. [DOI] [PubMed] [Google Scholar]
- 12.Knikman JE, Gelderblom H, Beijnen JH, Cats A, Guchelaar HJ, Henricks LM. Individualized dosing of fluoropyrimidine-based chemotherapy to prevent severe fluoropyrimidine-related toxicity: what are the options? Clin Pharm Ther. 2021;109:591–604. [DOI] [PMC free article] [PubMed] [Google Scholar]
- 13.Rosmarin D, Palles C, Church D, Domingo E, Jones A, Johnstone E, et al. Genetic markers of toxicity from capecitabine and other fluorouracil-based regimens: investigation in the QUASAR2 study, systematic review, and meta-analysis. J Clin Oncol J Am Soc Clin Oncol. 2014;32:1031–9. [DOI] [PMC free article] [PubMed] [Google Scholar]
- 14.Meulendijks D, Henricks LM, Jacobs BAW, Aliev A, Deenen MJ, de Vries N, et al. Pretreatment serum uracil concentration as a predictor of severe and fatal fluoropyrimidine-associated toxicity. Br J Cancer. 2017;116:1415–24. [DOI] [PMC free article] [PubMed] [Google Scholar]
- 15.Pallet N, Hamdane S, Garinet S, Blons H, Zaanan A, Paillaud E, et al. A comprehensive population-based study comparing the phenotype and genotype in a pretherapeutic screen of dihydropyrimidine dehydrogenase deficiency. Br J Cancer. 2020;123:811–8. [DOI] [PMC free article] [PubMed] [Google Scholar]
- 16.Schneider JJ, Galettis P, Martin JH. Overcoming barriers to implementing precision dosing with 5-fluorouracil and capecitabine. Br J Clin Pharm. 2021;87:317–25. [DOI] [PubMed] [Google Scholar]
- 17.Henricks LM, Lunenburg CATC, de Man FM, Meulendijks D, Frederix GWJ, Kienhuis E, et al. DPYD genotype-guided dose individualisation of fluoropyrimidine therapy in patients with cancer: a prospective safety analysis. Lancet Oncol. 2018;19:1459–67. [DOI] [PubMed] [Google Scholar]
- 18.Diasio RB, Offer SM. Testing for dihydropyrimidine dehydrogenase deficiency to individualize 5-fluorouracil therapy. Cancers. 2022;14:3207. [DOI] [PMC free article] [PubMed] [Google Scholar]
- 19.Coudoré F, Roche D, Lefeuvre S, Faussot D, Billaud EM, Loriot MA, et al. Validation of an ultra-high performance liquid chromatography tandem mass spectrometric method for quantifying uracil and 5,6-dihydrouracil in human plasma. J Chromatogr Sci. 2012;50:877–84. [DOI] [PubMed] [Google Scholar]
- 20.Kristensen MH, Pedersen P, Mejer J. The value of dihydrouracil/uracil plasma ratios in predicting 5-fluorouracil-related toxicity in colorectal cancer patients. J Int Med Res. 2010;38:1313–23. [DOI] [PubMed] [Google Scholar]
- 21.Gamelin E, Boisdron-Celle M, Guérin-Meyer V, Delva R, Lortholary A, Genevieve F, et al. Correlation between uracil and dihydrouracil plasma ratio, fluorouracil (5-FU) pharmacokinetic parameters, and tolerance in patients with advanced colorectal cancer: a potential interest for predicting 5-FU toxicity and determining optimal 5-FU dosage. J Clin Oncol J Am Soc Clin Oncol. 1999;17:1105. [DOI] [PubMed] [Google Scholar]
- 22.Jiang H, Lu J, Jiang J, Hu P. Important role of the dihydrouracil/uracil ratio in marked interpatient variations of fluoropyrimidine pharmacokinetics and pharmacodynamics. J Clin Pharm. 2004;44:1260–72. [DOI] [PubMed] [Google Scholar]
- 23.Zhou ZW, Wang GQ, Wan DS, Lu ZH, Chen YB, Li S, et al. The dihydrouracil/uracil ratios in plasma and toxicities of 5-fluorouracil-based adjuvant chemotherapy in colorectal cancer patients. Chemotherapy. 2007;53:127–31. [DOI] [PubMed] [Google Scholar]
- 24.Wettergren Y, Carlsson G, Odin E, Gustavsson B. Pretherapeutic uracil and dihydrouracil levels of colorectal cancer patients are associated with sex and toxic side effects during adjuvant 5-fluorouracil-based chemotherapy. Cancer. 2012;118:2935–43. [DOI] [PubMed] [Google Scholar]
- 25.Mueller F, Büchel B, Köberle D, Schürch S, Pfister B, Krähenbühl S, et al. Gender-specific elimination of continuous-infusional 5-fluorouracil in patients with gastrointestinal malignancies: results from a prospective population pharmacokinetic study. Cancer Chemother Pharm. 2013;71:361–70. [DOI] [PubMed] [Google Scholar]
- 26.Galarza AFA, Linden R, Antunes MV, Hahn RZ, Raymundo S, da Silva ACC, et al. Endogenous plasma and salivary uracil to dihydrouracil ratios and DPYD genotyping as predictors of severe fluoropyrimidine toxicity in patients with gastrointestinal malignancies. Clin Biochem. 2016;49:1221–6. [DOI] [PubMed] [Google Scholar]
- 27.Boisdron-Celle M, Remaud G, Traore S, Poirier AL, Gamelin L, Morel A, et al. 5-Fluorouracil-related severe toxicity: a comparison of different methods for the pretherapeutic detection of dihydropyrimidine dehydrogenase deficiency. Cancer Lett. 2007;249:271–82. [DOI] [PubMed] [Google Scholar]
- 28.McKenna A, Hanna M, Banks E, Sivachenko A, Cibulskis K, Kernytsky A, et al. The Genome Analysis Toolkit: a MapReduce framework for analyzing next-generation DNA sequencing data. Genome Res. 2010;20:1297–303. [DOI] [PMC free article] [PubMed] [Google Scholar]
- 29.Wigle TJ, Povitz BL, Medwid S, Teft WA, Legan RM, Lenehan J, et al. Impact of pretreatment dihydropyrimidine dehydrogenase genotype-guided fluoropyrimidine dosing on chemotherapy associated adverse events. Clin Transl Sci. 2021;14:1338–48. [DOI] [PMC free article] [PubMed] [Google Scholar]
- 30.van Kuilenburg ABP, Meijer J, Mul ANPM, Meinsma R, Schmid V, Dobritzsch D, et al. Intragenic deletions and a deep intronic mutation affecting pre-mRNA splicing in the dihydropyrimidine dehydrogenase gene as novel mechanisms causing 5-fluorouracil toxicity. Hum Genet. 2010;128:529–38. [DOI] [PMC free article] [PubMed] [Google Scholar]
- 31.Meulendijks D, Henricks LM, van Kuilenburg ABP, Jacobs BAW, Aliev A, Rozeman L, et al. Patients homozygous for DPYD c.1129-5923C>G/haplotype B3 have partial DPD deficiency and require a dose reduction when treated with fluoropyrimidines. Cancer Chemother Pharm. 2016;78:875–80. [DOI] [PubMed] [Google Scholar]
- 32.Zhou Y, Mkrtchian S, Kumondai M, Hiratsuka M, Lauschke VM. An optimized prediction framework to assess the functional impact of pharmacogenetic variants. Pharmacogenomics J. 2019;19:115–26. [DOI] [PMC free article] [PubMed] [Google Scholar]
- 33.Schwarz UI, Gulilat M, Kim RB. The role of next-generation sequencing in pharmacogenetics and pharmacogenomics. Cold Spring Harb Perspect Med. 2019;9:a033027. [DOI] [PMC free article] [PubMed] [Google Scholar]
- 34.Zhou Y, Tremmel R, Schaeffeler E, Schwab M, Lauschke VM. Challenges and opportunities associated with rare-variant pharmacogenomics. Trends Pharm Sci. 2022;43:852–65. [DOI] [PubMed] [Google Scholar]
- 35.Ingelman-Sundberg M, Mkrtchian S, Zhou Y, Lauschke VM. Integrating rare genetic variants into pharmacogenetic drug response predictions. Hum Genomics. 2018;12:26. [DOI] [PMC free article] [PubMed] [Google Scholar]
- 36.Callon S, Brugel M, Botsen D, Royer B, Slimano F, Feliu C, et al. Renal impairment and abnormal liver function tests in pre-therapeutic phenotype-based DPD deficiency screening using uracilemia: a comprehensive population-based study in 1138 patients. Ther Adv Med Oncol. 2023;15:17588359221148536. [DOI] [PMC free article] [PubMed] [Google Scholar]
- 37.Deenen MJ, Meulendijks D, Cats A, Sechterberger MK, Severens JL, Boot H, et al. Upfront genotyping of DPYD*2A to individualize fluoropyrimidine therapy: a safety and cost analysis. J Clin Oncol J Am Soc Clin Oncol 2016;34:227–34. Jan 20 [DOI] [PubMed] [Google Scholar]
- 38.Sistonen J, Büchel B, Froehlich TK, Kummer D, Fontana S, Joerger M, et al. Predicting 5-fluorouracil toxicity: DPD genotype and 5,6-dihydrouracil:uracil ratio. Pharmacogenomics. 2014;15:1653–66. [DOI] [PubMed] [Google Scholar]
- 39.de With M, Knikman J, de Man FM, Lunenburg CATC, Henricks LM, van Kuilenburg ABP, et al. Dihydropyrimidine dehydrogenase phenotyping using pretreatment uracil: a note of caution based on a large prospective clinical study. Clin Pharm Ther. 2022;112:62–8. [DOI] [PMC free article] [PubMed] [Google Scholar]
- 40.Henricks LM, Opdam FL, Beijnen JH, Cats A, Schellens JHM. DPYD genotype-guided dose individualization to improve patient safety of fluoropyrimidine therapy: call for a drug label update. Ann Oncol J Eur Soc Med Oncol. 2017;28:2915–22. [DOI] [PubMed] [Google Scholar]
- 41.Froehlich TK, Amstutz U, Aebi S, Joerger M, Largiadèr CR. Clinical importance of risk variants in the dihydropyrimidine dehydrogenase gene for the prediction of early-onset fluoropyrimidine toxicity. Int J Cancer. 2015;136:730–9. [DOI] [PubMed] [Google Scholar]
- 42.Paulsen NH, Pfeiffer P, Ewertz M, Fruekilde PBN, Feddersen S, Holm HS, et al. Implementation and clinical benefit of DPYD genotyping in a Danish cancer population. ESMO Open. 2023;8:100782. [DOI] [PMC free article] [PubMed] [Google Scholar]
- 43.Rare genetic variant burden in DPYD predicts severe fluorop, De Mattia E, Silvestri M, Polesel J, Ecca F, Mezzalira S, Scarabel L, et al. yrimidine-related toxicity risk. Biomed Pharmacother Biomed Pharmacother. 2022;154:113644. [DOI] [PMC free article] [PubMed] [Google Scholar]
- 44.Larrue R, Chamley P, Bardyn T, Lionet A, Gnemmi V, Cauffiez C, et al. Diagnostic utility of whole-genome sequencing for nephronophthisis. NPJ Genom Med. 2020;5:38. [DOI] [PMC free article] [PubMed] [Google Scholar]
- 45.Kozyra M, Ingelman-Sundberg M, Lauschke VM. Rare genetic variants in cellular transporters, metabolic enzymes, and nuclear receptors can be important determinants of interindividual differences in drug response. Genet Med J Am Coll Med Genet. 2017;19:20–9. [DOI] [PubMed] [Google Scholar]
- 46.Nelson MR, Wegmann D, Ehm MG, Kessner D, St Jean P, Verzilli C, et al. An abundance of rare functional variants in 202 drug target genes sequenced in 14,002 people. Science. 2012;337:100–4. [DOI] [PMC free article] [PubMed] [Google Scholar]
Associated Data
This section collects any data citations, data availability statements, or supplementary materials included in this article.
Supplementary Materials
Table S1. Demographic parameters of the whole cohort compared in male versus female patients.
Table S2. Custom-designed primer pairs and Sanger primer pairs.
Table S3. Hardy-Weinberg equilibrium and Minor Allele Frequency observed compared to GnomAD European frequencies for common (MAF ≥ 1) DPYD variants.
Data Availability Statement
Data and results are available at the Unit of Pharmacogenetics, University Hospital of Lille.