

Abstract
Background:
The association between testosterone concentrations and sleep duration is poorly understood.
Objective:
To evaluate the association between sleep duration and quality with serum testosterone concentrations and its variation by sex and age.
Methods:
Data were analyzed for 8748 men and women (≥20 years old) who participated in the cycles of the National Health and Nutrition Examination Survey 2011–2016, a cross-sectional study. Total testosterone (ng/dL) was measured and categorized (low, moderate, and high) based on established cut-offs for men and its tertile distribution among women. Sleep duration was classified as ≤6, 7–8, and ≥9 h. Sleep quality was classified as poor or good based on the frequency of trouble falling or staying asleep or sleeping too much. Weighted multivariable adjusted and multinomial logistic regression models were conducted to assess these associations.
Results:
The association between sleep duration and testosterone concentrations, varied according to sex and age. Sleep deprivation (≤6 h) was associated with high testosterone (odds ratio = 3.62; 95% confidence interval: 1.37, 9.53) among young men (20–40 years old); meanwhile, middle-aged men (41–64 years old) who reported more sleep duration had low testosterone (odds ratio = 2.03; 95% confidence interval: 1.10, 3.73). A J-shaped association between sleep duration and low testosterone (odds ratio≤6 h = 1.57; 95% confidence interval: 1.10, 2.27; odds ratio≥9 h = 2.06; 95% confidence interval: 1.18, 3.59) was observed in women aged 41–64 years. We did not find any association with sleep quality.
Conclusion:
The association of sleep duration with serum testosterone concentrations varies with sex and age group. Prospective studies are warranted to confirm these sex and age group differences.
Keywords: age, serum testosterone, sex, sleep
1 |. INTRODUCTION
Healthy sleeping habits are well recognized as an important component of maintaining a healthy lifestyle. This understanding is based on a previous statement by the American Academy of Sleep Medicine and Sleep Research Society recommending that adults should sleep 7 or more hours per night on a regular basis.1 However, on average, American adults sleep 6.9 h per night and approximately 20% of adults sleep less than 6.5 h.2
An emerging body of literature is reporting a strong association between sleep deprivation and chronic diseases, such as cardiovascular disease, cancer, and obesity.3 It is possible that these associations are due in part to the negative effects of sleep deprivation on biological pathways, such as the endocrine and inflammatory pathways.4,5
In parallel, some evidence suggests that the aging of the American population and the obesity epidemic have influenced the increasing prevalence of low concentrations of testosterone (T).6–8 Interestingly, some previous studies have linked low concentrations of T with cardiovascular mortality,9 prostate cancer,10 and obesity,11 similar to that observed with sleep deprivation.
The association of sleep deprivation with T concentrations remains poorly understood. However, some studies have suggested a positive association between sleep deprivation and low concentrations of T.6–8 Furthermore, sex and age differences in relation to T concentrations, sleeping habits, and prevalence of chronic diseases have been observed, but these disparities remain inconclusive.12
Therefore, in this study, we proposed to investigate the association of sleep duration and quality with serum T concentrations, and whether these associations vary by sex and age categories in a large nationally representative sample of the US population.
2 |. MATERIALS AND METHODS
2.1 |. Study population
The National Health and Nutrition Examination Survey (NHANES) is a program of studies undertaken by the National Center for Health Statistics of the US Centers for Disease Control and Prevention to assess the health and nutritional status of adults and children in the US. NHANES is a cross-sectional study that uses a multistage, stratified, and clustered probability sampling strategy in which Mexican-Americans, non-Hispanic Blacks, and the elderly are oversampled to ensure adequate sample size and to represent the total US civilian, non-institutionalized population.13 Details of the survey design, methods, and data collection are available on the NHANES website (https://wwwn.cdc.gov/nchs/nhanes/Default.aspx. Accessed January 2020).
For this analysis, we used data from male and female participants in the 2011–2012, 2013–2014, and 2015–2016 NHANES cycles (Figure 1). We excluded participants with a self-reported history of prostate and breast cancers because certain treatments may affect hormone concentrations (n = 363). We also excluded participants with missing information on sleep duration (n = 20) and covariates (n = 2010) and pregnant women at the time of the interview (n = 138). The final sample size was 8748 participants (men = 4236 and women 4512). Estradiol and sex hormone binding globulin (SHBG) concentrations were only available for 2013–2016 cycles (n = 5310).
FIGURE 1.
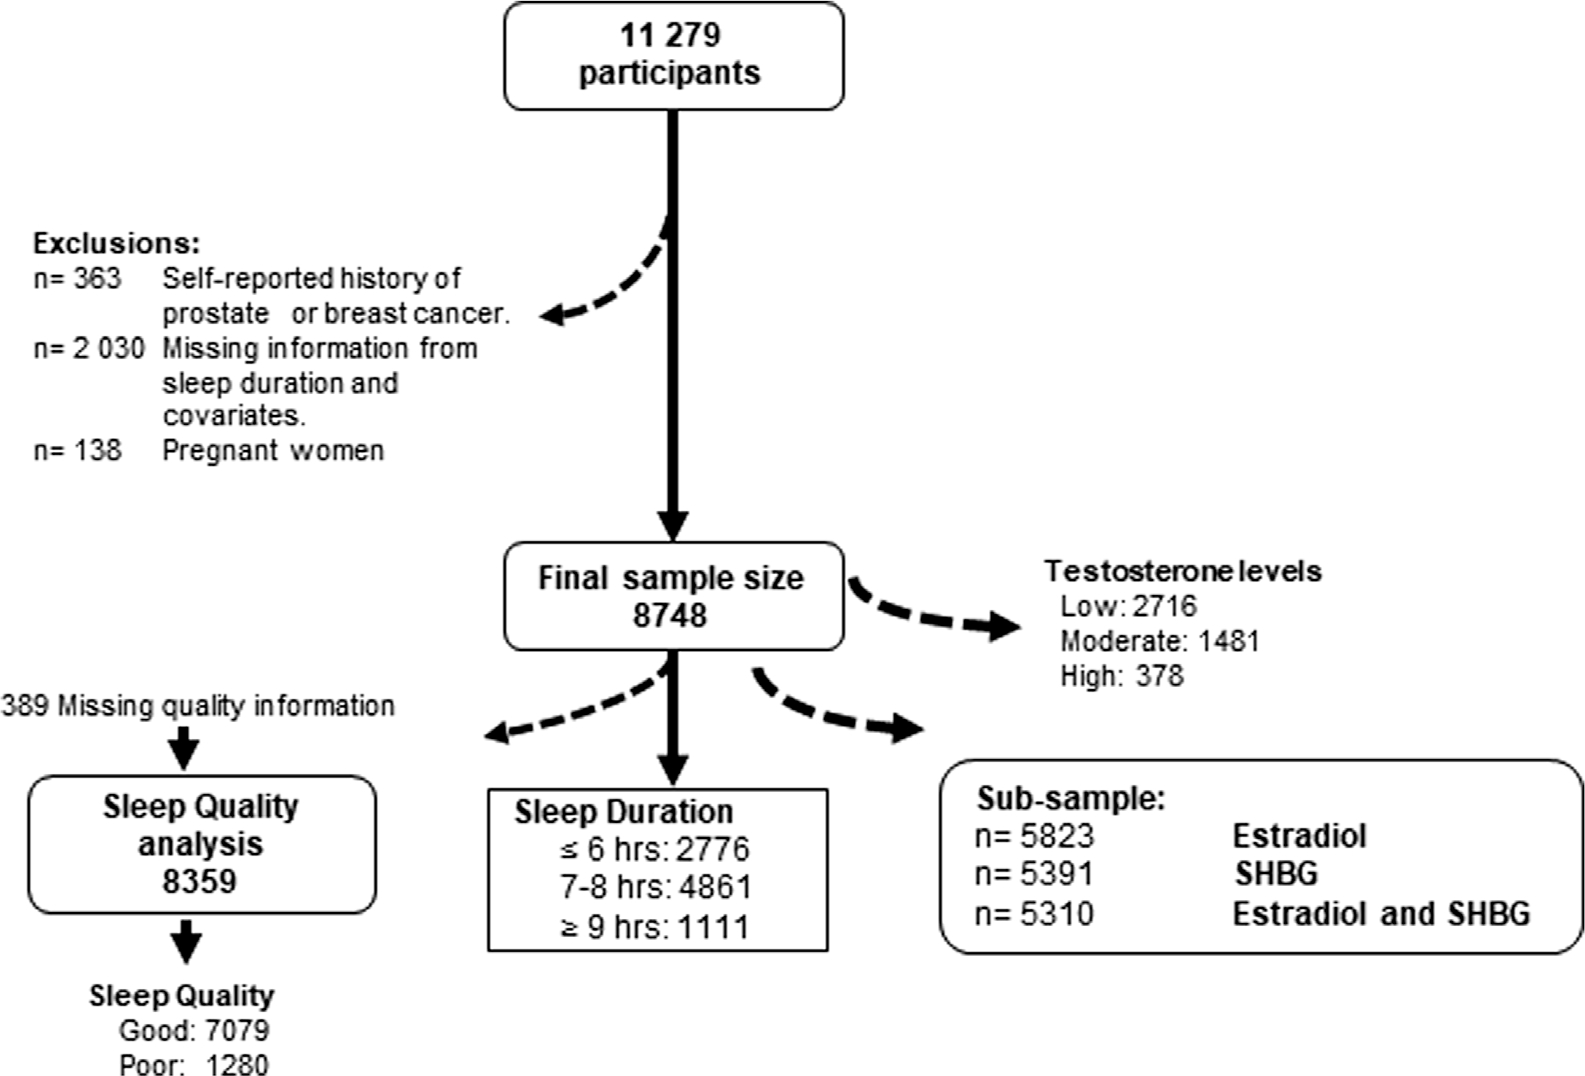
Flow diagram of study population.
2.2 |. Assessment of outcome—testosterone, estradiol, and SHBG
Morning sample participants were chosen to reduce extraneous variation because of diurnal production of hormones. Total T and estradiol concentrations were measured in NHANES cycles with liquid chromatography–mass spectrometry/mass spectrometry; details on the blood draw, process, storage, and shipping methods are provided elsewhere.14 Briefly, total T and estradiol were isolated from 100 μL serum by two serial liquid–liquid extraction steps and quantified with [13C] stable isotope-labeled T as the internal standard. SHBG was quantified based on the reaction of SHBG with immunoantibodies and chemoluminescence measurements of the reaction products that occur after two incubation periods and subjecting to a magnetic field. The limits of detection for T, estradiol, and SHBG were 0.75 ng/dL, 2.99 pg/mL, and 0.80 nmol/L, respectively. Serum albumin was measured by the DcX800 method, in which serum albumin forms a complex with the Bromcresol Purple reagent. The limit of detection for albumin was 1 g/dL.
Total T was categorized into low, moderate, and high groups. For males, we used the following cut-offs: low > 300 ng/dL, moderate = 300–850 ng/dL (reference group), and high > 850 ng/dL.15 Meanwhile, for women, we used the tertile distribution (low ≤ 15.06 ng/dL, moderate = 15.07–24.4 ng/dL [reference group], and high > 24.4).
2.3 |. Assessment of exposure—sleep duration and quality
In the NHANES waves, sleep duration was measured by the question “How much sleep do you usually get at night on weekdays or workdays?” with potential responses allowed from 1 to 24 h. In this study, sleep duration was categorized into three groups based on the recommendations of The American Academy of Sleep Medicine and Sleep Research Society: ≤6 h sleep, 7–8 h sleep, and ≥9 h sleep.1 The ≤6 and ≥9 h sleep categories were compared with the 7–8 h sleep (reference group) to estimate the odds of low T and high T categories.
As a proxy of sleep quality, we used the following question: “Over the last 2 weeks, how often have you been bothered by the following problems: trouble falling or staying asleep, or sleeping too much?” The potential responses were not at all, several days, more than half the days, and nearly every day. “Poor sleep” meant more than half the days or nearly all days having trouble sleeping and “good sleep” was considered if someone answered not at all or several days. This information was available for 8359 individuals.
2.4 |. Assessment of covariates
Age, sex, race/ethnicity, smoking status, caffeine intake, alcohol consumption, diabetes, hypertension, and physical activity during the past 30 days were self-reported during the NHANES interviews. Body mass index (BMI) was calculated as weight in kilograms divided by height in meters squared. Individuals were classified as having diabetes if their fasting plasma glucose concentrations were ≥126 mg/dL, if they responded positively to questions about medication treatment or if they were “told by a doctor you have diabetes or sugar diabetes.” Glucose was measured in NHANES using the glucose hexokinase method with a Hitachi Model 704 multichannel analyzer (Boehringer Mannheim Diagnostics). Three readings of systolic and diastolic blood pressure were obtained from participants who attended the mobile examination center. We used the average of those three measurements (≥140/90 mmHg). We also considered the current use of antihypertensive medication treatment or being “told by a doctor you have hypertension” as an indication of high blood pressure (hypertension). Participants were asked if they had smoked more than 100 cigarettes in their lifetime and if they were current smokers. This was used to classify participants as never, former, and current smokers from self-reported information, participants. We considered vigorous physical activity if participant reported to do any activity that caused heavy sweating or large increases in breathing or heart rate (e.g., swimming, aerobics, or fast cycling). Moderate physical activity included activities that caused light sweating or a moderate increase in the heart rate, such as playing golf, dancing, bicycling for pleasure, or walking. Data on caffeine intake (mg/day), plain and tap water (g), and alcohol (g) were obtained from the Total Nutrient File, which contains summed nutrients for an individual from all food and beverages provided on the dietary recall.13
2.5 |. Statistical analysis
Sampling weights were applied to account for selection probabilities, over-sampling, non-response, and differences between the sample and the total US population. We compared the distribution of sociodemographic and lifestyle factors by hours of sleep categories; for continuous variables, we used Kruskal–Wallis and chi-square tests for categorical factors (Table 1) and by sleep quality (Table S1). T, estradiol, and SHGB concentrations were log-transformed, and their geometric means were estimated according to sex (male/female), as well as the frequencies for T categories.
TABLE 1.
Characteristics of adults aged ≥20 years in the total sample according to sleep duration (n = 8748) (National Health and Nutrition Examination Survey [NHANES] 2011–2016).
| Characteristics | Sleep duration |
Weighted p-valuea | ||
|---|---|---|---|---|
| ≤6 h (n = 2776) | 7–8 h (n = 4861) | ≥9h (n = 1111) | ||
| Sex | <0.0001 | |||
| Male | 1391 (32.84) | 2357 (55.64) | 488 (11.52) | |
| Female | 1385 (30.70) | 2504 (55.50) | 623 (13.81) | |
| Age (years), n (%) | <0.0001 | |||
| 20–40 | 965 (32.63) | 1643 (55.56) | 349 (11.80) | |
| 41–64 | 1329 (35.68) | 2038 (54.71) | 358 (9.61) | |
| ≥65 | 482 (23.33) | 1180 (57.12) | 404 (19.55) | |
| Race/ethnicity, n (%) | <0.0001 | |||
| Non-Hispanic White | 1276 (27.30) | 2769 (59.24) | 629 (13.46) | |
| Non-Hispanic Black | 1095 (43.50) | 1172 (46.56) | 250 (9.93) | |
| Mexican-American | 405 (26.01) | 920 (59.09) | 232 (14.90) | |
| Body mass index (kg/m2), n (%) | <0.0001 | |||
| <25 | 618 (28.73) | 1240 (57.65) | 293 (13.62) | |
| 25–29 | 847 (29.97) | 1628 (57.61) | 351 (12.42) | |
| ≥30 | 1311 (34.77) | 1993 (52.85) | 467 (12.38) | |
| Diabetes, n (%) | <0.0001 | |||
| No | 2304 (31.54) | 4133 (56.57) | 869 (11.89) | |
| Yes | 472 (32.76) | 727 (50.45) | 242 (16.79) | |
| Hypertension, n (%) | 0.0022 | |||
| No | 1485 (30.78) | 2794 (57.92) | 545 (11.30) | |
| Yes | 1291 (32.90) | 2067 (52.68) | 566 (14.42) | |
| Smoking status, n (%) | <0.0001 | |||
| Never smoker | 1436 (30.02) | 2743 (57.34) | 605 (12.65) | |
| Former smoker | 613 (28.33) | 1270 (58.69) | 281 (12.99) | |
| Current smoker | 727 (40.39) | 848 (47.11) | 225 (12.50) | |
| Physical activityb, n (%) | <0.0001 | |||
| No | 1476 (33.73) | 2265 (51.76) | 635 (14.51) | |
| Yes | 1300 (29.73) | 2596 (59.38) | 476 (10.89) | |
| Caffeine intake (mg), n (%) | 0.0093 | |||
| Never | 209 (30.78) | 363 (53.46) | 107 (15.76) | |
| 1–199 | 1825 (31.33) | 3240 (55.62) | 760 (13.05) | |
| 200–324 | 409 (31.39) | 748 (57.41) | 146 (11.20) | |
| ≥325 | 333 (35.39) | 510 (54.20) | 98 (10.41) | |
| Alcohol intake, n (%) | ||||
| No consumers | 2015 (32.63) | 3338 (54.06) | 822 (13.31) <0.0001 | |
| Consumers (g) | 761 (29.58) | 1523 (59.19) | 289 (11.23) | |
| Median (p25-p75) | 19.05 (9.85–39.00) | 19.10 (9.60–35.25) | 20.90 (8.70–39.75) 0.2962 | |
Weighted p-value for differences among predictors by sleep duration categories using the chi-square test and Kruskal-Wallis test (for alcohol intake).
Moderate/vigorous physical activity.
We used two independent multivariable weighted multinomial logistic regression models to estimate the association between sleep duration and quality with high and low concentrations of T categories compared with moderate concentrations. All models were adjusted for sex, age category, BMI, race/ethnicity, total caffeine intake, total alcohol intake, hypertension, diabetes, smoking status, and physical activity.
Stratified and multivariable analyses were conducted by sex (male/female) and age-categories (20–40, 41–64, and ≥65 years) because these factors have been observed to modify T concentrations.12,16 All p-values were two-sided; α = 0.05 was considered the cut-off for statistical significance.
2.6 |. Sensitivity analysis
We conducted two sensitivity analyses: (1) In a subsample, the final models were additionally adjusted by estradiol and SHBG; (2) we used unweighted models to rule out the possibility that our results were the consequence of a statistical artifact because of the weights.
All statistical analyses were performed using R (version 4.3.0).
3 |. RESULTS
Table 1 shows the distribution of selected characteristics stratified by sleep duration. Participants with a higher sleep duration (≥9 h) were mainly women ≥65 years old with a previous history of diabetes and never caffeine consumption. In contrast, non-Hispanic Black participants, with obesity (BMI ≥ 30 kg/m2) and current smokers had a lower sleep duration (≤6 h). A history of hypertension, moderate/vigorous physical activity, and a higher proportion of alcohol consumers were associated with 7–8 h of sleep; however, no differences were observed in the median intake of alcohol among the consumers. Regarding sleep quality, 15.3% of participants reported having poor sleep quality (Table S1). The highest proportion of poor sleep quality was observed among men, between 41 and 64 years old, and non-Hispanic White. Those participants with history of obesity, diabetes, hypertension, physical inactivity, current smokers, and higher alcohol consumption also reported a higher proportion of poor sleep quality.
The distribution of T, SHGB, and estradiol according to sex are shown in Table 2. Among men, the geometric mean of T was 370.94 ng/dL, and 28.59% were classified as T deprivation. The T geometric mean among women was 18.82 ng/dL.
TABLE 2.
Biomarker distribution among adults aged ≥20 years according to sex (National Health and Nutrition Examination Survey [NHANES] 2011–2016).
| Biomarkers | Men (n = 4236) | Women (n = 4512) |
|---|---|---|
|
| ||
| Testosterone (ng/dL)a | ||
| Geometric mean (95% CI) | 370.94 (365.22, 376.74) | 18.82 (18.48, 19.17) |
| Low, n (%) | 1211 (28.59) | 1505 (33.36) |
| Moderate, n (%) | 2922 (68.98) | 1507 (33.40) |
| High, n (%) | 103 (2.43) | 1500 (33.24) |
| SHBG (nmol/L)b | ||
| Geometric mean (95% CI) | 40.37 (39.57, 41.19) | 62.50 (61.15, 63.88) |
| Estradiol (pg/mL)c | ||
| Geometric mean (95% CI) | 23.49 (23.15, 23.83) | 19.13 (18.13, 20.18) |
Abbreviations: CI,confidenceinterval;SHBG, sex hormone binding globulin.
Testosterone categories for men: low (<300 ng/dL), moderate (300–850 ng/dL), and high (>850 ng/dL). For women: low (≤15.06 ng/dL), moderate (15.07–24.4 ng/dL), and high (>24.4 ng/dL).
Subsample (n = 5391), men (n = 2567), and women (n = 2824).
Subsample (n = 5823), men (n = 2817), and women (n = 3006).
Table 3 shows multivariable multinomial logistic regression models stratified by sex and age and adjusted by BMI, race/ethnicity, total caffeine intake, total alcohol intake, hypertension, diabetes, smoking status, and physical activity. Overall, the association between sleep duration and T concentrations depended on age categories. Among young men (20–40 years old), sleep duration ≤6 h was associated with high T concentrations (odds ratio [OR] = 3.62; 95% confidence interval [CI]: 1.37, 9.53); meanwhile, among middle-aged men (41–64 years old), more sleep duration was associated with low T concentrations (OR≥9 h = 2.03; 95% CI: 1.10, 3.73). In contrast, a J-shaped association between sleep duration and low T concentrations (OR≤6 h = 1.57; 95% CI: 1.10, 2.27; OR≥9 h = 2.06; 95% CI: 1.18, 3.59) was observed in women aged 41–64 years. These associations were generally consistent with the subsample analysis adjusted for estradiol and SHBG concentrations (Table 4) and the unweighted analysis (Table 3). We did not observe significant associations among older adults between sleep duration and T concentrations. No significant associations were observed between sleep quality (poor vs. good) and T concentrations (Table S2).
TABLE 3.
Multivariable multinomial logistic regression of the association between sleep duration and testosterone categories stratified by sex and age categories (National Health and Nutrition Examination Survey [NHANES] 2011–2016).
| Age groups/sleep duration (h) | Testosterone concentrations (ng/dL) categoriesa |
|||||||
|---|---|---|---|---|---|---|---|---|
| Men |
Women |
|||||||
| n | Low < 300, OR (95% CI) | n | High > 850, OR (95% CI) | n | Low ≤15.06, OR (95% CI) | n | High > 24.4, OR (95% CI) | |
| Allb | ||||||||
| ≤6 (n = 2776) | 384 | 0.89 (0.70, 1.14) | 44 | 1.56 (0.87, 2.78) | 473 | 1.27 (0.98, 1.64) | 464 | 1.08 (0.87, 1.34) |
| 7–8 (n = 4861) | 664 | Ref | 47 | Ref | 817 | Ref | 817 | Ref |
| ≥9 (n = 1111) | 163 | 1.36 (1.04, 1.78) | 12 | 0.86 (0.32, 2.28) | 215 | 1.22 (0.90, 1.65) | 219 | 1.26 (0.99, 1.60) |
| 20–40 years oldc | ||||||||
| ≤6 (n = 965) | 114 | 0.91 (0.66, 1.25) | 21 | 3.62 (1.37, 9.53) | 68 | 0.81 (0.49, 1.32) | 226 | 0.92 (0.62, 1.35) |
| 7–8 (n = 1643) | 197 | Ref | 12 | Ref | 131 | Ref | 409 | Ref |
| ≥9 (n = 349) | 27 | 0.84 (0.50, 1.40) | 7 | 2.07 (0.52, 8.15) | 32 | 0.97 (0.52, 1.81) | 107 | 1.14 (0.77, 1.67) |
| 41–64 years oldc | ||||||||
| ≤6 (n = 1329) | 193 | 0.85 (0.58, 1.24) | 17 | 1.62 (0.64, 4.09) | 281 | 1.57 (1.10, 2.27) | 175 | 1.21 (0.87, 1.69) |
| 7–8 (n = 2038) | 263 | Ref | 24 | Ref | 404 | Ref | 258 | Ref |
| ≥9 (n = 358) | 60 | 2.03 (1.10, 3.73) | 3 | 0.66 (0.15, 2.89) | 85 | 2.06 (1.18, 3.59) | 57 | 1.45 (0.82, 2.55) |
| ≥65 years oldc | ||||||||
| ≤6 (n = 482) | 77 | 0.86 (0.49, 1.53) | 6 | 0.53 (0.18, 1.59) | 124 | 1.17 (0.68, 1.99) | 63 | 1.07 (0.64, 1.80) |
| 7–8 (n = 1180) | 204 | Ref | 11 | Ref | 282 | Ref | 150 | Ref |
| ≥9 (n = 404) | 76 | 1.33 (0.86, 2.05) | 2 | 0.49 (0.05, 4.94) | 98 | 0.71 (0.43, 1.18) | 55 | 1.23 (0.78, 1.92) |
Note: Significant results are in bold.
Abbreviations: CI, confidence interval; OR, odds ratio; Ref, reference group.
Reference outcome for multinomial analysis was moderate testosterone levels.
Multivariable analysis was adjusted for age categories, body mass index, race/ethnicity, total caffeine intake, total alcohol intake, hypertension, diabetes, smoking status, and physical activity.
Models adjusted for body mass index, race/ethnicity, total caffeine intake, total alcohol intake, hypertension, diabetes, smoking status, and physical activity.
TABLE 4.
Multivariablea multinomial logistic regression of the association between sleep duration and testosterone categories stratified by sex and age categories in a subsample of National Health and Nutrition Examination Survey (NHANES) 2013–2016 with estradiol and SHBG information.
| Age groups/sleep duration (h) | Testosterone concentrations (ng/dL) categoriesa |
|||||||
|---|---|---|---|---|---|---|---|---|
| Men |
Women |
|||||||
| n | Low < 300, OR (95% CI) | n | High > 850, OR (95% CI) | n | Low ≤ 15.06, OR (95% CI) | n | High > 24.4, OR (95% CI) | |
| Allb | ||||||||
| ≤6 (n = 1421) | 181 | 0.98 (0.72, 1.32) | 26 | 2.58 (1.25, 5.34) | 227 | 1.29 (0.97, 1.71) | 242 | 1.00 (0.73, 1.38) |
| 7–8 (n = 3047) | 392 | Ref | 27 | Ref | 490 | Ref | 517 | Ref |
| ≥9 (n = 842) | 110 | 1.52 (1.10, 2.10) | 11 | 1.15 (0.42, 3.16) | 166 | 1.24 (0.87, 1.77) | 167 | 1.15 (0.87, 1.51) |
| 20–40 years oldc | ||||||||
| ≤6 (n = 495) | 49 | 0.84 (0.52, 1.35) | 16 | 5.97 (1.72, 20.72) | 37 | 1.06 (0.62, 1.81) | 111 | 0.81 (0.48, 1.36) |
| 7–8 (n = 1001) | 118 | Ref | 6 | Ref | 70 | Ref | 258 | Ref |
| ≥9 (n = 266) | 20 | 0.79 (0.42, 1.49) | 6 | 2.38 (0.64, 8.90) | 24 | 1.31 (0.61, 2.83) | 84 | 1.02 (0.62, 1.65) |
| 41–64 years oldc | ||||||||
| ≤6 (n = 670) | 91 | 1.12 (0.61, 2.07) | 7 | 3.31 (0.80, 13.72) | 124 | 1.53 (1.01, 2.31) | 104 | 1.33 (0.77, 2.31) |
| 7–8 (n = 1286) | 151 | Ref | 15 | Ref | 242 | Ref | 160 | Ref |
| ≥9 (n = 276) | 40 | 3.44 (1.49, 7.93) | 3 | 1.29 (0.14, 11.67) | 65 | 1.97 (0.99, 3.91) | 43 | 1.35 (0.67, 2.74) |
| >65 years oldc | ||||||||
| ≤6 (n = 256) | 41 | 0.82 (0.40, 1.70) | 3 | 0.65 (0.03, 11.85) | 66 | 1.08 (0.59, 1.96) | 27 | 0.59 (0.30, 1.16) |
| 7–8 (n = 760) | 123 | Ref | 6 | Ref | 178 | Ref | 99 | Ref |
| ≥9 (n = 300) | 50 | 1.20 (0.67, 2.13) | 2 | 0.39 (0.02, 7.14) | 77 | 0.72 (0.44, 1.19) | 40 | 1.07 (0.63, 1.82) |
Note: Significant results are in bold.
Abbreviations: CI, confidence interval; OR, odds ratio; Ref, reference group.
Reference outcome for multinomial analysis was moderate testosterone levels.
Multivariable analysis was adjusted for age categories, body mass index, race/ethnicity, total caffeine intake, total alcohol intake, hypertension, diabetes, smoking status, and physical activity, estradiol, and SHBG concentrations.
Models adjusted for body mass index, race/ethnicity, total caffeine intake, total alcohol intake, hypertension, diabetes, smoking status, and physical activity, estradiol, and SHBG concentrations.
4 |. DISCUSSION
This cross-sectional study of a nationally representative sample of US men and women suggests that association between sleep duration and T concentrations varied by sex and age. Among men, sleep deprivation (≤6 h) was associated with higher T concentrations; meanwhile, among middle-aged men (41–64 years old), more sleep duration was associated with low T concentrations. In women, a J-shaped association between sleep duration and low T concentrations was observed only in the middle-aged category. No association was observed in relation to poor sleep quality.
To our knowledge, no study has investigated the association of sleep duration and quality with serum T concentrations in a nationally representative sample of US men and women and stratified by age groups. However, it is important to note that previous studies have explored the interplay between sleep, T, sex, and age in different settings that may provide insight into our findings.6,7 One study using continuous T concentrations found an inverted “U-shaped” association; men with a sleep duration of less than <7 h and greater than 9 h had the lowest total and bioavailable T concentrations.7 Another study conducted with the NHANES 2011–2012 reported a reduction in T concentrations for each hour of sleep lost.6 Only two studies have evaluated this association in women with negative results17,18; however, in both cases, the duration of sleep was divided into two categories using a cut-off of 617 or 7 h.18
Sleep is a dynamic process characterized by two stages: non-rapid eye movement (NREM) and rapid eye movement (REM).19 NREM sleep represents the transition from drowsiness to deep sleep, and it is divided into three stages. The third stage is known as sleep wave sleep (SWS), which is considered a metabolically active stage.19 The results from experimental studies suggest that there are differences in T concentrations according to the duration of sleep deprivation and the sleep stage in which deprivation occurs. A meta-analysis8 that included 256 healthy men revealed that total sleep deprivation (≥24 h) reduced male T concentrations, while short-term partial sleep deprivation had no significant effect on serum T concentrations. Nevertheless, this effect on T concentrations seems to be a consequence of the stage of sleep at which deprivation occurs more than the duration. For instance, total sleep deprivation and 4.5 h of sleep restricted to the first night-half significantly reduced morning T concentrations in a study of 15 young and healthy men (27.1 ± 1.32 years; BMI, 22.9 ± 0.3 kg/m2).20 This is consistent with the reduction in androgen secretion associated with suppression of SWS.21 T secretion is pulsatile, following a circadian and ultradian rhythm. Serum T concentrations begin to rise after falling asleep, until the onset of REM,39 and the highest T peak is reached upon waking.19
Our divergent findings between men and women could be explained by differences in frequency of awakening. It has been reported that post-menopausal women have a longer sleep duration,22 while women in the menopausal transition may also have trouble falling asleep and more frequent awakenings.23 A cohort study showed that women with less frequent awakenings had higher T concentrations.24 Low T concentrations have also been reported in middle-aged men who reported nocturnal awakenings.25 We hypothesize that independent of sleep duration, among middle-aged women, a greater number of awakenings would lead to a disruption of the deeper sleep stage (SWS), which would cause a reduction in T concentrations. In contrast, although the middle-aged men had a shorter sleep duration, they could have a smaller number of awakenings. However, the lack of information on this variable in the NHANES study did not allow us to test this hypothesis.
Certain limitations must be considered when interpreting our results. We relied on a single measurement of T, and this could not be representative of biological variation during the day. This limits the possibility of establishing a temporal relationship between duration and quality sleep with T. In this same sense, evidence suggests that high amounts of exogenous T may be associated with shorter sleep duration.26 Nevertheless, NHANES had no information about T replacement therapy or similar. Second, the lack of information in relation to the presence and frequency of sleep apnea may not allow us an adequate classification of the exposure variable. Only the NHANES 2015–2016 has information on snoring and a high frequency of snoring (five or more nights per week) was associated with lower T concentrations, mainly in men between 40 and 59 years old with a waist circumference ≥102 cm.27 Additionally, there is evidence that T concentrations can return to normal values after a normal night’s sleep.19 Possibly, our results could be affected because we did not have information on the frequency of naps or the duration of sleep during the weekend. Finally, we do not reject the possibility of residual confounding because of the breadth of our age categories, as well as unmeasured variables in this study. Occupation or switching work schedule hours have been associated with a disruption in the circadian cycle and T concentration19,28 and this information was not available. Regarding other hormones involved in sleep duration, estradiol and SHBG concentrations were available only for NHANES 2013–2016; however, we performed a sensitivity analysis adjusted by these variables and the associations remained in the same direction. Despite the mentioned limitations, our study has strengths. The NHANES is a representative survey of the US population, which allows the extrapolation of our results to adults who are older than 20 years old. Unlike previous studies, we stratified by age groups, considering that the association between sleep and T concentrations is not the same at all ages, and it could depend on key age stages.
Regarding sleep quality, we did not find an association with T concentrations. It is possible that this is because of misclassification error because we use a quality proxy based on self-reporting any difficulty sleeping or sleeping too much. Nonetheless, this is consistent with prior studies. Three studies among men found no association with T concentrations, despite having used a more precise definition of sleep quality.29–31 They used the Pittsburgh Sleep Quality Index29,30 which considers the sleep duration and six other components of sleep; another used the Karolinska Sleep Questionnaire,31 which considers the frequency of snoring, sleep problems, and apnea.
5 |. CONCLUSIONS
In summary, these results show an association between sleep duration and testosterone concentrations, but this association differs by sex and age. The biological mechanism underlying this association remains unclear. Prospective studies are necessary to establish a temporal relationship with a particular focus on the duration and quality of sleep. They should obtain information in relation to sleep problems, as well as the stage of sleep deprivation and the frequency of awakenings.
Supplementary Material
ACKNOWLEDGMENTS
We thank the participants and staff of the National Health and Nutrition Examination Survey. David S. Lopez was supported by the National Institutes of Health and National Institute on Aging (grant number: P30AG059301) and the Cancer Prevention and Research Institute of Texas (CPRIT), (grant number: RP210130). Additionally, Sadaf A. Milani received a grant from NIA (PI Milani) (number: 1K01AG075254) and Pepper Center (number: P30AG024832).
Footnotes
CONFLICT OF INTEREST STATEMENT
All authors declare that they have no conflicts of interest.
SUPPORTING INFORMATION
Additional supporting information can be found online in the Supporting Information section at the end of this article.
DATA AVAILABILITY STATEMENT
All data generated or analyzed in this study were provided by the National Center for Health Statistics of the US Centers for Disease Control and Prevention (https://www.cdc.gov/nchs/nhanes/index.htm). For further data inquiries, please contact the corresponding author of this manuscript (David S. Lopez).
REFERENCES
- 1.Consensus Conference Panel, Watson NF, Badr MS, et al. Recommended amount of sleep for a healthy adult: a joint consensus statement of the American Academy of Sleep Medicine and Sleep Research Society. J Clin Sleep Med. 2015;11:591–592. doi: 10.5664/jcsm.4758 [DOI] [PMC free article] [PubMed] [Google Scholar]
- 2.Banks S, Dinges DF. Behavioral and physiological consequences of sleep restriction. J Clin Sleep Med. 2007;3:519–528. [PMC free article] [PubMed] [Google Scholar]
- 3.Chaput JP, Dutil C, Featherstone R, et al. Sleep duration and health in adults: an overview of systematic reviews. Appl Physiol Nutr Metab. 2020;45(10 suppl 2):S218–S231. doi: 10.1139/apnm-2020-0034 [DOI] [PubMed] [Google Scholar]
- 4.Beaman A, Bhide MC, McHill AW, Thosar SS. Biological pathways underlying the association between habitual long-sleep and elevated cardiovascular risk in adults. Sleep Med. 2021;78:135–140. doi: 10.1016/j.sleep.2020.12.011 [DOI] [PMC free article] [PubMed] [Google Scholar]
- 5.Lokeshwar SD, Patel P, Fantus RJ, et al. Decline in serum testosterone levels among adolescent and young adult men in the USA. Eur Urol Focus. 2021;7:886–889. doi: 10.1016/j.euf.2020.02.006 [DOI] [PubMed] [Google Scholar]
- 6.Patel P, Shiff B, Kohn TP, Ramasamy R. Impaired sleep is associated with low testosterone in US adult males: results from the National Health and Nutrition Examination Survey. World J Urol. 2019;37:1449–1453. doi: 10.1007/s00345-018-2485-2 [DOI] [PubMed] [Google Scholar]
- 7.Ruge M, Skaaby T, Andersson AM, Linneberg A. Cross-sectional analysis of sleep hours and quality with sex hormones in men. Endocr Connect. 2019;8:141–149. doi: 10.1530/EC-18-0548 [DOI] [PMC free article] [PubMed] [Google Scholar]
- 8.Su L, Zhang SZ, Zhu J, Wu J, Jiao YZ. Effect of partial and total sleep deprivation on serum testosterone in healthy males: a systematic review and meta-analysis. Sleep Med. 2021;88:267–273. doi: 10.1016/j.sleep.2021.10.031 [DOI] [PubMed] [Google Scholar]
- 9.Lopez DS, Lee WC, Garcia CO, et al. Low testosterone and high cholesterol levels in relation to all-cause, cardiovascular disease, and cancer mortality in White, Black, and Hispanic men: NHANES 1988–2015. Hormones. 2022;21:399–411. doi: 10.1007/s42000-022-00360-3 [DOI] [PMC free article] [PubMed] [Google Scholar]
- 10.Claps M, Petrelli F, Caffo O, et al. Testosterone levels and prostate cancer prognosis: systematic review and meta-analysis. Clin Genitourin Cancer. 2018;16:165–175.e2. doi: 10.1016/j.clgc.2018.01.005 [DOI] [PubMed] [Google Scholar]
- 11.Lopez DS, Rohrmann S, Peskoe SB, et al. Racial/ethnic differences in the associations of overall and central body fatness with circulating hormones and metabolic factors in US men. Int J Endocrinol Metab. 2017;15:e44926. doi: 10.5812/ijem.44926 [DOI] [PMC free article] [PubMed] [Google Scholar]
- 12.Mong JA, Cusmano DM. Sex differences in sleep: impact of biological sex and sex steroids. Philos Trans R Soc Lond B Biol Sci. 2016;371(1688):20150110. doi: 10.1098/rstb.2015.0110 [DOI] [PMC free article] [PubMed] [Google Scholar]
- 13.Centers for Disease Control and Prevention (CDC) National Center for Health Statistics. National Health and Nutrition Examination Survey: Overview. Accessed January 2022. https://www.cdc.gov/nchs/data/nhanes/nhanes_13_14/NHANES_Overview_Brochure.pdf
- 14.Centers for Disease Control and Prevention (CDC) National Center for Health Statistics. National Health and Nutrition Examination Survey (NHANES): Laboratory Procedures Manual. Accessed May 2023. https://wwwn.cdc.gov/nchs/data/nhanes/2011-2012/manuals/2011-12_Laboratory_Procedures_Manual.pdf
- 15.Mulhall JP, Trost LW, Brannigan RE, et al. Evaluation and management of testosterone deficiency: AUA guideline. J Urol. 2018;200:423–432. doi: 10.1016/j.juro.2018.03.115 [DOI] [PubMed] [Google Scholar]
- 16.Lopez DS, Peskoe SB, Joshu CE, et al. Racial/ethnic differences in serum sex steroid hormone concentrations in US adolescent males. Cancer Causes Control. 2013;24:817–826. doi: 10.1007/s10552-013-0154-8 [DOI] [PMC free article] [PubMed] [Google Scholar]
- 17.Lim AJR, Huang Z, Chua SE, Kramer MS, Yong EL. Sleep duration, exercise, shift work and polycystic ovarian syndrome-related outcomes in a healthy population: a cross-sectional study. PLoS One. 2016;11:e0167048. doi: 10.1371/journal.pone.0167048 [DOI] [PMC free article] [PubMed] [Google Scholar]
- 18.Michels KA, Mendola P, Schliep KC, et al. The influences of sleep duration, chronotype, and nightwork on the ovarian cycle. Chronobiol Int. 2020;37:260–271. doi: 10.1080/07420528.2019.1694938 [DOI] [PMC free article] [PubMed] [Google Scholar]
- 19.Andersen ML, Alvarenga TF, Mazaro-Costa R, Hachul HC, Tufik S. The association of testosterone, sleep, and sexual function in men and women. Brain Res. 2011;1416:80–104. doi: 10.1016/j.brainres.2011.07.060 [DOI] [PubMed] [Google Scholar]
- 20.Schmid SM, Hallschmid M, Jauch-Chara K, Lehnert H, Schultes B. Sleep timing may modulate the effect of sleep loss on testosterone. Clin Endocrinol. 2012;77(5):749–754. doi: 10.1111/j.1365-2265.2012.04419.x [DOI] [PubMed] [Google Scholar]
- 21.Ukraintseva YV, Liaukovich KM, Polishchuk АA, et al. Slow-wave sleep and androgens: selective slow-wave sleep suppression affects testosterone and 17α-hydroxyprogesterone secretion. Sleep Med. 2018;48:117–126. doi: 10.1016/j.sleep.2018.04.012 [DOI] [PubMed] [Google Scholar]
- 22.Young T, Rabago D, Zgierska A, Austin D, Laurel F. Objective and subjective sleep quality in premenopausal, perimenopausal, and postmenopausal women in the Wisconsin Sleep Cohort Study. Sleep. 2003;26(6):667–672. doi: 10.1093/sleep/26.6.667 [DOI] [PubMed] [Google Scholar]
- 23.Kravitz HM, Zhao X, Bromberger JT, et al. Sleep disturbance during the menopausal transition in a multi-ethnic community sample of women [published correction appears in Sleep. 2008;31(9):table of contents]. Sleep. 2008;31(7):979–990. [PMC free article] [PubMed] [Google Scholar]
- 24.Sowers MF, Zheng H, Kravitz HM, et al. Sex steroid hormone profiles are related to sleep measures from polysomnography and the Pittsburgh Sleep Quality Index. Sleep. 2008;31(10):1339–1349. [PMC free article] [PubMed] [Google Scholar]
- 25.Hirokawa K, Fujii Y, Taniguchi T, Tsujishita M. Associations of testosterone and cortisol concentrations with sleep quality in Japanese male workers. Compr Psychoneuroendocrinol. 2022;12:100158. doi: 10.1016/j.cpnec.2022.100158 [DOI] [PMC free article] [PubMed] [Google Scholar]
- 26.Liu PY, Yee B, Wishart SM, et al. The short-term effects of high-dose testosterone on sleep, breathing, and function in older men. J Clin Endocrinol Metab. 2003;88:3605–3613. doi: 10.1210/jc.2003-030236 [DOI] [PubMed] [Google Scholar]
- 27.Su L, Chen J, Qu H, Luo C, Wu J, Jiao Y. Association between snoring frequency and male serum testosterone: findings from the 2015–2016 National Health and Nutrition Examination Survey. Sleep Med. 2022;100:1–5. doi: 10.1016/j.sleep.2022.07.016 [DOI] [PubMed] [Google Scholar]
- 28.Wittert G The relationship between sleep disorders and testosterone in men. Asian J Androl. 2014;16:262–265. doi: 10.4103/1008-682X.122586 [DOI] [PMC free article] [PubMed] [Google Scholar]
- 29.Zhang W, Piotrowska K, Chavoshan B, Wallace J, Liu PY. Sleep duration is associated with testis size in healthy young men. J Clin Sleep Med. 2018;14:1757–1764. doi: 10.5664/jcsm.7390 [DOI] [PMC free article] [PubMed] [Google Scholar]
- 30.Du CQ, Yang YY, Chen J, Feng L, Lin WQ. Association between sleep quality and semen parameters and reproductive hormones: a cross-sectional study in Zhejiang, China. Nat Sci Sleep. 2020;12:11–18. doi: 10.2147/NSS.S235136 [DOI] [PMC free article] [PubMed] [Google Scholar]
- 31.Jensen TK, Andersson AM, Skakkebæk NE, et al. Association of sleep disturbances with reduced semen quality: a cross-sectional study among 953 healthy young Danish men. Am J Epidemiol. 2013;177:1027–1037. doi: 10.1093/aje/kws420 [DOI] [PubMed] [Google Scholar]
Associated Data
This section collects any data citations, data availability statements, or supplementary materials included in this article.
Supplementary Materials
Data Availability Statement
All data generated or analyzed in this study were provided by the National Center for Health Statistics of the US Centers for Disease Control and Prevention (https://www.cdc.gov/nchs/nhanes/index.htm). For further data inquiries, please contact the corresponding author of this manuscript (David S. Lopez).