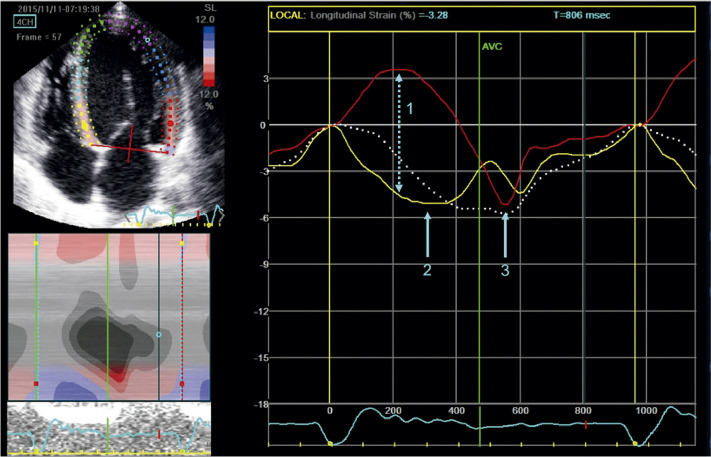
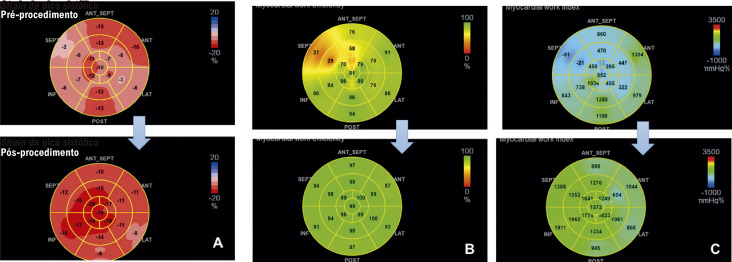
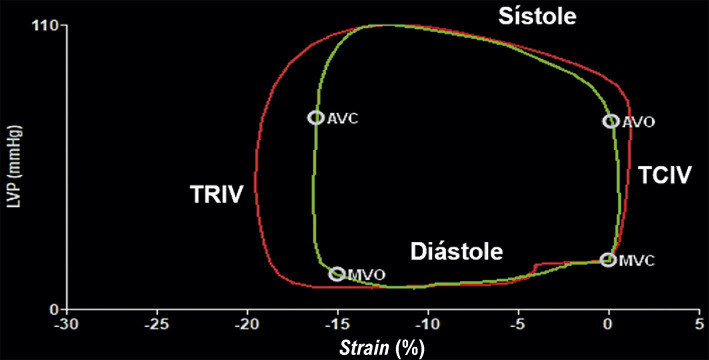
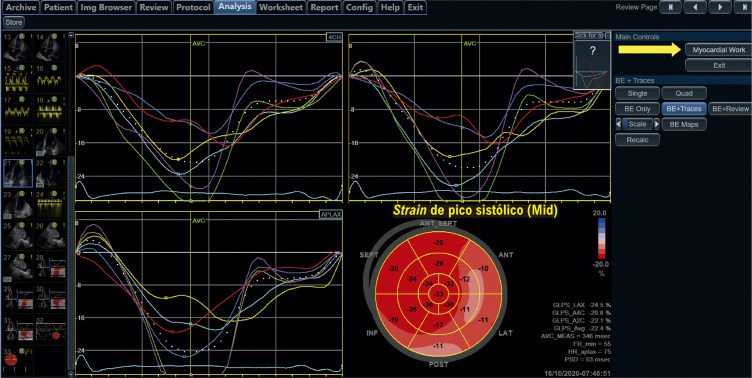
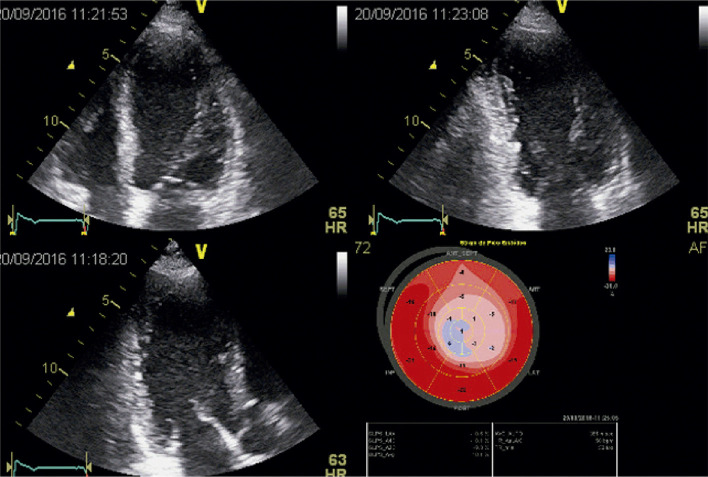
Abstract
| Posicionamento do Departamento de Imagem Cardiovascular da Sociedade Brasileira de Cardiologia sobre o Uso do Strain Miocárdico na Rotina do Cardiologista – 2023 | |
|---|---|
| O relatório abaixo lista as declarações de interesse conforme relatadas à SBC pelos especialistas durante o período de desenvolvimento deste posicionamento, 2022/2023. | |
| Especialista | Tipo de relacionamento com a indústria |
| Adenalva Lima de Souza Beck | Nada a ser declarado |
| Alex Felix | Nada a ser declarado |
| Ana Clara Rodrigues | Nada a ser declarado |
| Ana Cristina Camarozano | Nada a ser declarado |
| Anderson da Costa Armstrong |
|
| André Luiz Cerqueira de Almeida |
|
| Andressa Mussi Soares |
|
| Arnaldo Rabischoffsky | Nada a ser declarado |
| Aurélio Carvalho Pinheiro | Nada a ser declarado |
| Bruna Morhy Borges Leal Assunção | Nada a ser declarado |
| Camila Rocon | Nada a ser declarado |
| Carlos Eduardo Suaide Silva | Nada a ser declarado |
| Carlos Eduardo Rochitte | Nada a ser declarado |
| Cecilia Beatriz Bittencourt Viana Cruz | Nada a ser declarado |
| Cintia Galhardo Tressino | Nada a ser declarado |
| Claudia Gianini Monaco | Nada a ser declarado |
| Claudia R. Pinheiro de Castro Grau | Nada a ser declarado |
| Cláudio Henrique Fischer | Nada a ser declarado |
| Daniel de Andrade Hygidio | Nada a ser declarado |
| Daniela do Carmo Rassi Frota | Nada a ser declarado |
| David Costa de Souza Le Bihan |
|
| Eliza de Almeida Gripp | Nada a ser declarado |
| Fábio Luis de Jesus Soares | Nada a ser declarado |
| Fabio Villaça Guimarães Filho | Nada a ser declarado |
| Gabriela Nunes Leal | Nada a ser declarado |
| Henry Abensur | Nada a ser declarado |
| Isabel Cristina Britto Guimarães | Nada a ser declarado |
| Jeane Mike Tsutsui |
|
| Jorge Andion Torreão |
|
| Jorge Eduardo Assef | Nada a ser declarado |
| José Luiz Barros Pena | Nada a ser declarado |
| Jose Maria Del Castillo | Nada a ser declarado |
| Marcelo Dantas Tavares de Melo | Nada a ser declarado |
| Marcelo Goulart Paiva | Nada a ser declarado |
| Marcelo Haertel Miglioranza | Nada a ser declarado |
| Marcelo Luiz Campos Vieira | Nada a ser declarado |
| Márcio Silva Miguel Lima | Nada a ser declarado |
| Marco Stephan Lofrano Alves | Nada a ser declarado |
| Maria Eduarda Menezes de Siqueira | Nada a ser declarado |
| Maria Estefânia Bosco Otto | Nada a ser declarado |
| Maria Rosa Dantas | Nada a ser declarado |
| Maria Veronica Camara dos Santos | Nada a ser declarado |
| Marly Maria Uellendahl Lopes | Nada a ser declarado |
| Rafael Bonafim Piveta |
|
| Rafael Modesto Fernandes | Nada a ser declarado |
| Renato de Aguiar Hortegal | Nada a ser declarado |
| Roberto Magalhães Saraiva | Nada a ser declarado |
| Rodrigo Bellio de Mattos Barretto |
|
| Rodrigo Julio Cerci | Nada a ser declarado |
| Salustiano Pereira de Araujo | Nada a ser declarado |
| Samira Saady Morhy | Nada a ser declarado |
| Sanderson Antonio Cauduro | Nada a ser declarado |
| Sandra Marques e Silva |
|
| Sandra Nívea dos Reis Saraiva Falcão | Nada a ser declarado |
| Silvio Henrique Barberato | Nada a ser declarado |
| Thais Harada Campos Espirito Santo | Nada a ser declarado |
| Tonnison de Oliveira Silva | Nada a ser declarado |
| Vera Maria Cury Salemi | Nada a ser declarado |
| Viviane Tiemi Hotta |
|
Sumário
1. Conceitos Básicos sobre o Estudo da Deformação do Ventrículo Esquerdo 7
1.1. Breve Introdução aos Princípios Físicos da Formação dos Speckles na Imagem Cardiovascular 7
1.2. Definições 7
1.2.1. Strain e Strain Rate 7
1.2.2. Deformação Longitudinal, Circunferencial e Radial 8
1.2.3. Tempo dos Eventos Mecânicos 8
1.2.4. Medidas de Pico Extraídas das Curvas de Deformação 8
1.3. Fatores que Afetam a Estimativa do Strain 8
1.3.1 Qualidade da Imagem 8
1.3.2. Modalidade de Imagem Cardiovascular 9
1.3.3. Fabricante e Versão do Software 9
1.3.4. Condições Hemodinâmicas 9
1.4. Strain Longitudinal Global 9
2. Recomendações Gerais para o Uso do Strain: Aplicabilidade Clínica, Comparação com a Fração de Ejeção e Descrição Adequada no Laudo 11
2.1. Valor Prognóstico, Padrões Paramétricos e Detecção Subclínica de Cardiopatias da Deformação Miocárdica 11
2.2. Strain ou Fração de Ejeção: Qual é a Melhor Alternativa? 11
2.3. Recomendações Gerais de como Reportar os Resultados do Strain e os Valores de Normalidade 11
2.4. Conclusão 11
3. Strain na Cardio-oncologia 14
4. Strain na Disfunção Diastólica 16
4.1. Introdução 16
4.2. Strain do Ventrículo Esquerdo 16
4.3. Strain do Átrio Esquerdo 16
4.4. Conclusão 16
5. Strain nas Cardiomiopatias 17
5.1. Introdução 17
5.2. Cardiomiopatia Dilatada 17
5.3. Cardiomiopatia Arritmogênica 17
5.4. Cardiomiopatia Hipertrófica 18
5.5. Endomiocardiofibrose 18
5.6. Miocárdio Não Compactado 18
6. Strain nas Valvopatias 19
7. Strain nas Cardiopatias Isquêmicas 20
7.1. Introdução 20
7.2. Strain na Síndrome Coronariana Aguda 20
7.3. Strain na Síndrome Coronariana Crônica 20
7.4. Strain do Ventrículo Direito na Cardiopatia Isquêmica 21
8. Strain nas Doenças Sistêmicas (Amiloidose e Doença de Fabry) 22
8.1. Strain na Amiloidose Cardíaca 22
8.1.1. Papel da Análise da Deformação Miocárdica no Diagnóstico da Amiloidose Cardíaca 22
8.2. Doença de Fabry 25
9. Strain na Hipertensão Arterial Sistêmica 26
9.1. Introdução 26
9.2. Hipertensão Arterial Sistêmica sem Critérios para Hipertrofia Ventricular Esquerda 26
9.3. Hipertensão Arterial Sistêmica com Critérios para Hipertrofia Ventricular Esquerda 27
9.4. Tratamento Clínico 27
9.5. Conclusão 27
10. Strain em Atletas 27
11. Strain na Ecocardiografia com Estresse 29
12. Strain nas Cardiopatias Congênitas 29
13. Strain do Ventrículo Direito 30
13.1. Introdução 30
13.2. Características Anatômicas e Funcionais do Ventrículo Direito 30
13.3. Ventrículo Direito e Parâmetros Ecocardiográficos na Avaliação da Função Sistólica 30
13.4. Aquisição e Limitações 31
13.5. Indicações/Valores de Normalidade 32
14. Strain do Átrio Esquerdo e do Átrio Direito 33
14.1. Técnica de Obtenção e Análise do strain do Átrio Esquerdo 33
14.2. Valores de Normalidade 33
14.3. Aplicabilidade Clínica do Strain do Átrio Esquerdo 33
14.3.1. Insuficiência Cardíaca e Avaliação de Função Diastólica 33
14.3.2. Fibrilação Atrial 34
14.3.3. Valvopatias 34
14.3.4. Doença Arterial Coronariana 34
14.4. Strain Atrial Direito 34
15. Avaliação da Torção do Ventrículo Esquerdo 34
15.1. Introdução 34
15.2. Definições e Nomenclaturas 35
15.3. Passo a Passo da Avaliação da Torção Ventricular pelo Ecocardiograma com Speckle Tracking 35
15.4. Aplicações Clínicas 35
16. Strain na Análise da Dissincronia Ventricular 36
16.1. Introdução 36
16.2. Avaliação da Dissincronia na Seleção dos Pacientes para a Terapia de Ressincronização Cardíaca 37
16.3. Avaliação de Viabilidade Miocárdica 37
16.4. Orientação do Local de Implante dos Eletrodos 38
16.5. Avaliação Prognóstica após a Terapia de Ressincronização Cardíaca 38
16.6. Ajuste nos Parâmetros de Ressincronização 38
17. Myocardial Work (Trabalho Miocárdico) 38
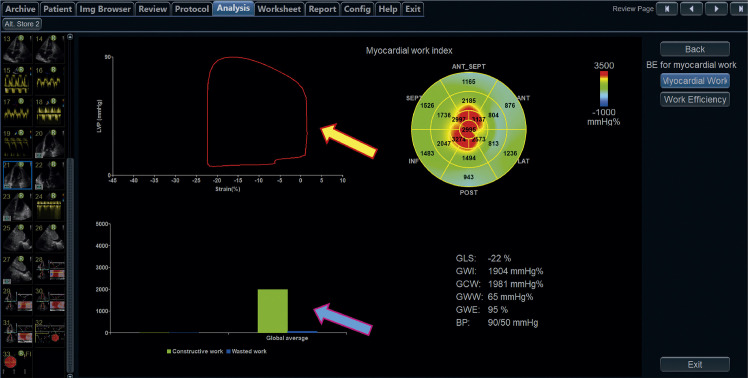
17.1. Introdução 38
17.2. Aquisição do Trabalho Miocárdico 38
17.3. Valores de Normalidade 39
17.4. Potencial Uso Clínico 42
18. Strain no 3D: O Que Pode Acrescentar ao Exame 43
18.1. Introdução 43
18.2. Strain Ventricular Esquerdo 43
18.3. Strain Ventricular Direito 43
18.3.1. Aquisição e Análise do Full-volume 3D 44
18.4. Strain Atrial Esquerdo 44
19. O papel da Ressonância e Tomografia Cardíacas na Avaliação do Strain 44
19.1. Introdução 44
19.2. Métodos de Aquisição do Strain pela Ressonância Magnética Cardíaca 44
19.3. Strain do Ventrículo Direito pela Ressonância Magnética Cardíaca 44
19.4. Strain do Ventrículo Esquerdo pela Ressonância Magnética Cardíaca 44
19.5. Strain do Átrio Esquerdo pela Ressonância Magnética Cardíaca 46
19.6. Strain pela Tomografia Cardíaca 46
Referências 46
1. Conceitos Básicos sobre o Estudo da Deformação do Ventrículo Esquerdo
1.1. Breve Introdução aos Princípios Físicos da Formação dos Speckles na Imagem Cardiovascular
A palavra “speckle” refere-se à aparência granular da imagem gerada por um sistema de imagem de coerência óptica, tal como o laser, tomografia de coerência óptica ou ultrassonografia.1,2
Na ecocardiografia, um pulso de ultrassom emitido propaga-se em linha reta, interagindo com as diferentes interfaces acústicas da cavidade torácica até atingir o coração. Entre os diversos fenômenos acústicos que ocorrem nesse percurso, parte do feixe de ultrassom emitido sofre reflexão pelas diferentes estruturas cardíacas, gerando um eco que é parcialmente captado de volta pelo transdutor e utilizado pelo software como entrada (input) para a elaboração das imagens de ecocardiografia. Nesse caso, o comprimento de onda do feixe ultrassonográfico é habitualmente menor do que o tamanho das estruturas refletoras.
Entretanto, quando o comprimento de onda é maior do que a microestrutura com a qual interage, há uma dispersão do feixe de ultrassom, que se irradia para todas as direções (dispersão difusiva ou “diffusive scattering”). Esse fenômeno é o resultado do padrão de interferência de todas as frentes de onda que sofreram dispersão a partir dos diferentes dispersores (diferenças locais de densidade e compressibilidade dos tecidos).
Parte da dispersão difusiva é capturada pelo transdutor, formando a imagem de aspecto granular que denominamos speckle.
A presença de speckles torna a imagem do modo B menos nítida para o operador humano, porém ela não deve ser vista como um ruído, pois traz consigo informações únicas de forma a atuar como uma “impressão digital” do meio estudado pelo ultrassom.1
1.2. Definições
1.2.1. Strain e Strain Rate
Strain corresponde à quantidade deformação de um objeto em relação à sua forma original.3 Na cardiologia, esse conceito é representado como o percentual (%) de encurtamento/alongamento do coração em relação à sua medida inicial. Esse conceito pode ser aplicado para um segmento miocárdico (strain regional) ou para a totalidade de uma das câmaras do coração como o ventrículo esquerdo (VE) (strain global).
O strain rate indica a taxa de deformação miocárdica (%) a cada segundo(s-1) ou, em outras palavras, a velocidade com que a deformação ocorre.3-4
1.2.2. Deformação Longitudinal, Circunferencial e Radial
A aplicação do conceito de deformação nos permite pormenorizar o estudo do encurtamento/alongamento do miocárdio do VE a partir de sua orientação em diferentes eixos.
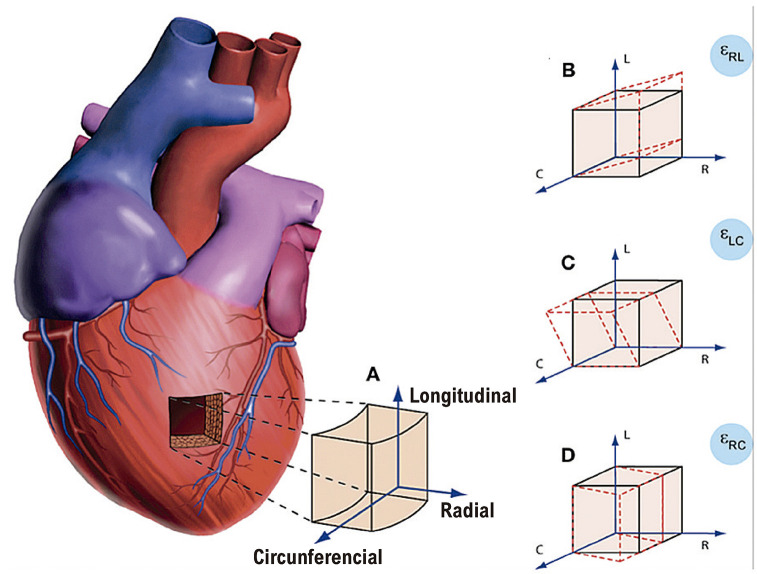
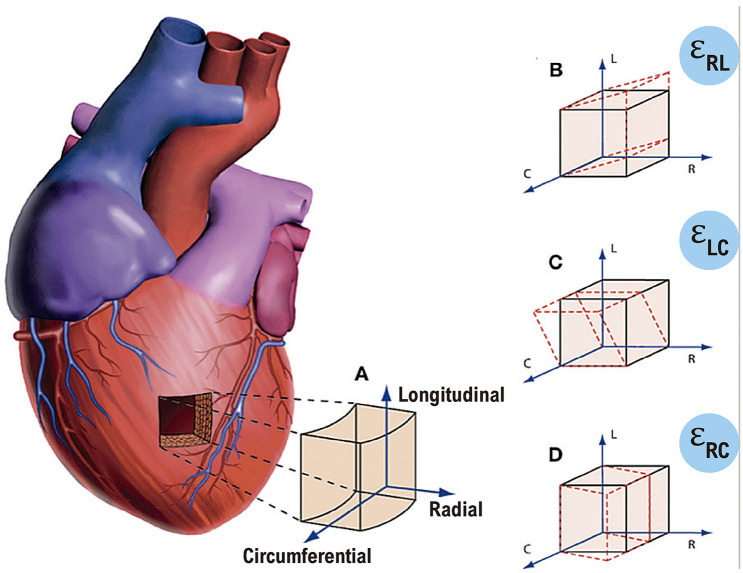
De fato, devido à disposição helicoidal das fibras musculares cardíacas, o encurtamento sistólico do VE é determinado pela ação de fibras no sentido longitudinal e de fibras no sentindo circunferencial,5 o que determina os dois vetores-força ativos da deformação (Figura 1.1 A).
Figura 1.1. – A deformação miocárdica pormenorizada em diferentes eixos. A) A deformação básica pode ser aferida nos sentidos longitudinal, circunferencial e radial.4 A partir da interação de dois desses vetores-força, há o surgimento de um terceiro vetor resultante. B) Shear-strain radial-circunferencial. C) Shear-strain longitudinal-circunferencial (que equivale a torção ventricular/torsion). D) Shear-strain radial-circunferencial.
A aplicação dessas forças no sentido longitudinal e circunferencial sobre um material de baixa compressibilidade (tecido miocárdico) resulta em um espessamento do miocárdio no sentindo radial (componente passivo da deformação).6 Em última análise, este responde pela diminuição radial da cavidade ventricular.4
É preciso ter em conta que o processo de deformação é bem mais complexo do que podemos aferir, pois, para cada processo de interação entre os vetores-força, surge um novo vetor resultante do cisalhamento entre as diferentes deformações, o shear-strain (Figura 1.1 B, C e D).
O encurtamento sistólico da fibra no sentido longitudinal e circunferencial produz valores negativos de strain. Já o espessamento sistólico radial atribui um valor positivo ao strain. Muitos autores optam por expressar apenas o valor absoluto (valor em módulo), e adotaremos essa abordagem aqui.
1.2.3. Tempo dos Eventos Mecânicos
Descrevemos, a seguir, algumas definições fundamentais para a prática clínica:1,7
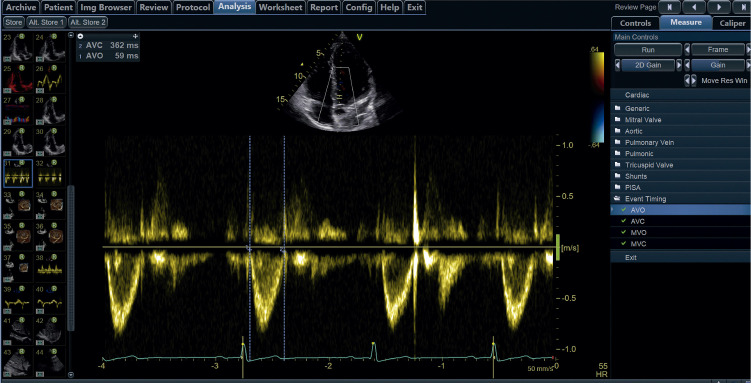
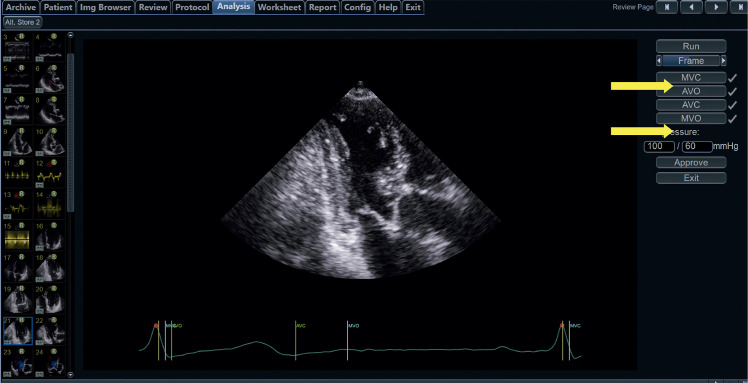
• Final da sístole (end-systole): definido como o ponto temporal de fechamento da valva aórtica. Potenciais substitutos: nadir do strain global ou da curva de volume. É recomendado que os softwares informem qual critério foi adotado para definir o final da sístole.
• Final da diástole (end-diastole): definido como o ponto temporal no qual ocorre o pico do complexo QRS. A marcação de eventos (event timing) deve ser feita preferencialmente utilizando o Doppler e tendo como referência o eletrocardiograma (ECG).
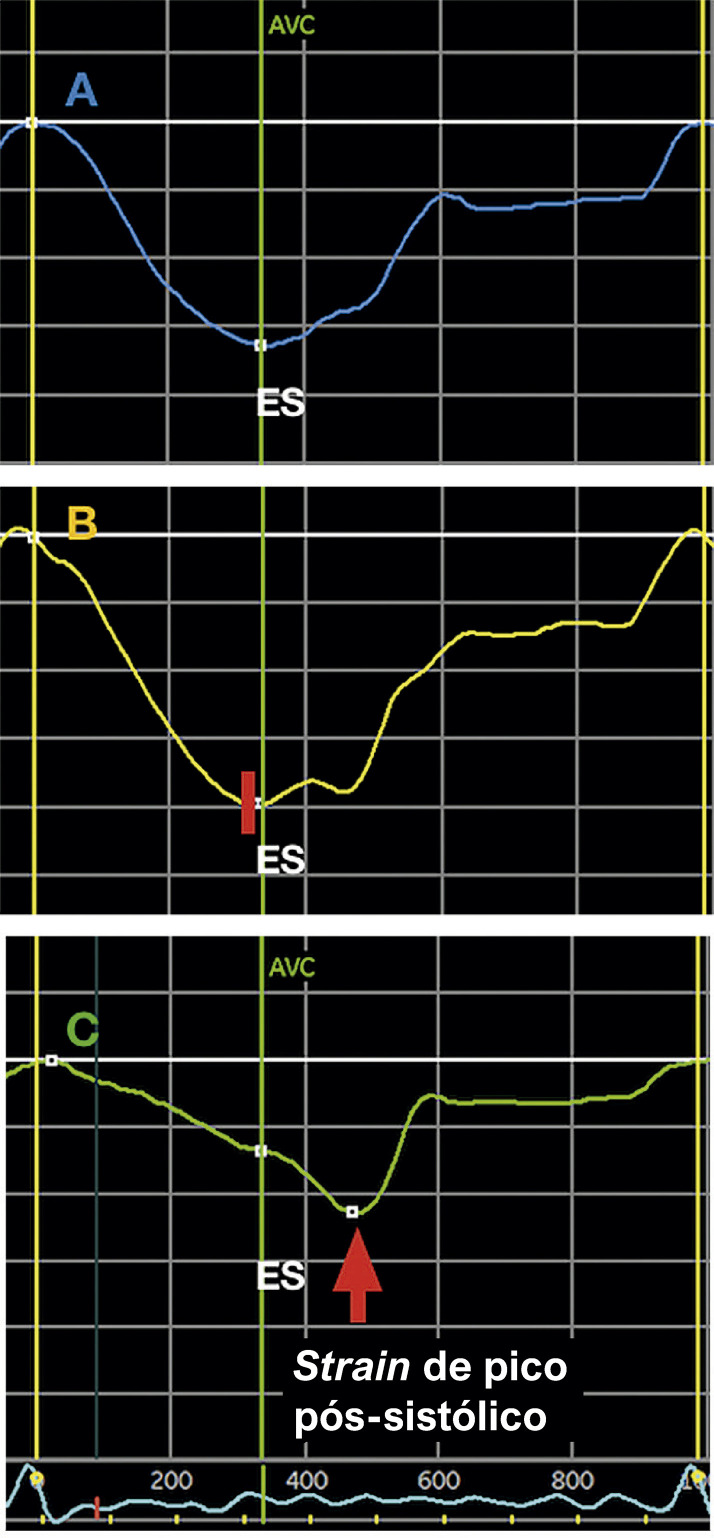
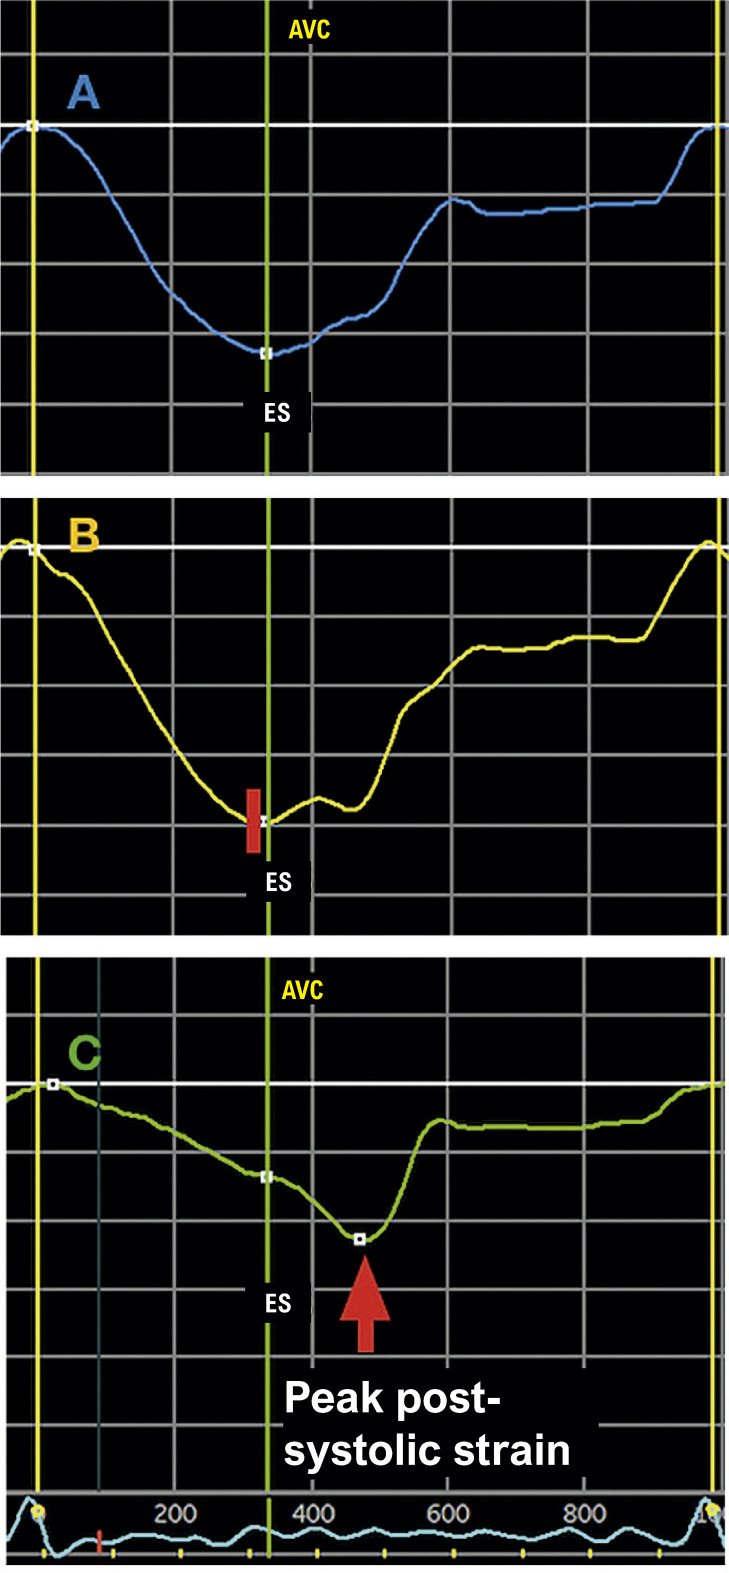
1.2.4. Medidas de Pico Extraídas das Curvas de Deformação (Figura 1.2)
Figura 1.2. – Medidas de pico extraídas das curvas de deformação. A) O strain pico sistólico, o strain pico e strain do final da sístole (ES) coincidem no momento do fechamento da valva aórtica (AVC). B) O strain de pico sistólico e o strain de pico coincidem, porém ambos acontecem imediatamente antes do fechamento da valva aórtica (pequena barra vermelha), produzindo uma discreta dissociação entre aqueles e o strain do final da sístole (ES). C) O strain de pico sistólico e o strain do final da sístole (ES) coincidem (ambos apresentando valores absolutos reduzidos), porém o strain de pico ocorre após o fechamento da valva aórtica (fenômeno de encurtamento pós-sistólico).
• Strain do final da sístole (end-systolic strain): o ponto da curva de deformação no final da sístole, conforme previamente definido (fechamento da valva aórtica). Esse é o parâmetro padrão para descrever a deformação miocárdica.
• Strain de pico sistólico (peak systolic strain): o ponto onde ocorre o pico da curva durante toda a sístole.
• Strain de pico sistólico positivo (positive peak systolic strain): valor mais positivo registrado em casos em que a curva de um determinado segmento apresente esse comportamento em algum momento da sístole.
• Strain de pico (peak strain): o ponto onde ocorre o pico da curva de deformação, considerando todo o ciclo cardíaco. Habitualmente, esse ponto é alcançado até o fechamento da valva aórtica. Quando ocorre após, é descrito como strain pós-sistólico (post systolic strain)8 ou encurtamento pós-sistólico (EPS, post-systolic shortening). O strain pós-sistólico reflete a deformação de segmentos que se contraem após o fechamento da valva aórtica e não contribuem para a ejeção ventricular.
1.3. Fatores que Afetam a Estimativa do Strain
1.3.1 Qualidade da Imagem
A qualidade da imagem é um fator crítico que afeta a performance de qualquer software que estime a deformação miocárdica. Vários autores reportaram a sensibilidade da estimativa do strain e strain rate proporcionais à qualidade da imagem e do algoritmo de tracking.9-11
1.3.2. Modalidade de Imagem Cardiovascular
Diferentes modalidades de imagem cardiovascular fornecem valores diferentes de strain. Tee et al.12 reportaram tais diferenças aferidas entre a ecocardiografia transtorácica, a tomografia computadorizada e a ressonância magnética cardíaca (RMC).
1.3.3. Fabricante e Versão do Software
Estudos organizados pela European Association of Cardiovascular Imaging (EACVI) e American Society of Echocardiography (ASE) testaram a variabilidade de medidas do strain longitudinal global (SLG) obtidas entre diferentes fabricantes de aparelhos e softwares, com evidência de divergências significativas.13-14 Contudo, há de se considerar que tais diferenças ainda são menores que a variabilidade da fração de ejeção (FE) reportadas na literatura.9-10,15
Além da variabilidade interfabricante, deve-se estar atento à variabilidade intersoftwares do mesmo fabricante. Mudanças significativas no SLG foram previamente reportadas.11,15
Dessa forma, estudos ecocardiográficos seriados deveriam, idealmente, ser realizados com o mesmo aparelho/software e sob condições hemodinâmicas semelhantes, sobretudo em situações cuja variação do SLG pode levar a implicações terapêuticas profundas, como no contexto de avaliação de cardiotoxicidade induzida por quimioterápicos, por exemplo.4
1.3.4. Condições Hemodinâmicas
A deformação do VE varia consideravelmente de acordo com as condições de pré-carga e pós-carga às quais o ventrículo está submetido.
1.4. Strain Longitudinal Global
É o parâmetro de deformação cardíaca com evidências científicas mais robustas e o único com uso de maior relevância na prática clínica.9 Ele reflete a deformação longitudinal relativa (%) do miocárdio do VE, que ocorre desde o período de contração isovolumétrica até o final do período de ejeção.1,5,15
Matematicamente, a contração em cada instante é computada pelo algoritmo como: , em que L(t) é o comprimento longitudinal no tempo t, e L(ED) é o comprimento no fim da diástole.1
Há divergências significativas entre softwares quanto ao comprimento L(ED) utilizado: linha inteira da região de interesse (ROI) vs. média de determinado número de pontos do ROI x média dos valores em cada segmento do mesmo quadro.
O valor de normalidade do SLG é de, aproximadamente, 20%.9 Há evidências de variações dos valores de normalidade de acordo com sexo e idade.7
Para a análise do SLG do VE (SLGVE) por speckle tracking, é necessária uma série de cuidados relacionados à aquisição das imagens:
1) O paciente deve estar sob monitorização eletrocardiográfica.
2) Se possível, deve-se tentar apneia expiratória, evitando os movimentos de translação do coração com as incursões respiratórias.
3) Deve-se buscar um ponto de equilíbrio entre aspectos de resolução espacial e temporal do método ecocardiográfico, ponderando os ajustes do aparelho em relação ao foco, à profundidade e à largura, de modo que otimizem a câmara cardíaca de interesse, versus o frame rate (FR). Este último deve ser mantido entre 40 e 80 quadros por segundo (em pacientes com frequência cardíaca normal). É importante ratificar que, quanto maior a frequência cardíaca, valores mais altos de FR serão necessários.
4) Evitar “imagens truncadas” do VE (foreshortening).
5) Clipes das janelas acústicas apicais de 3, 4 e 2 câmaras devem ser adquiridos, preferencialmente com o mínimo de três batimentos, excluindo-se extrassístoles.
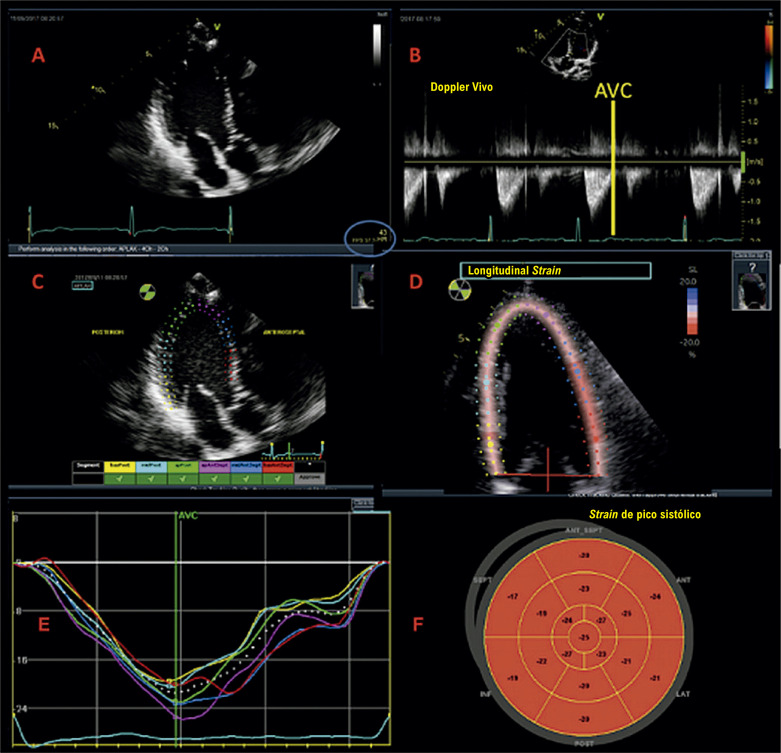
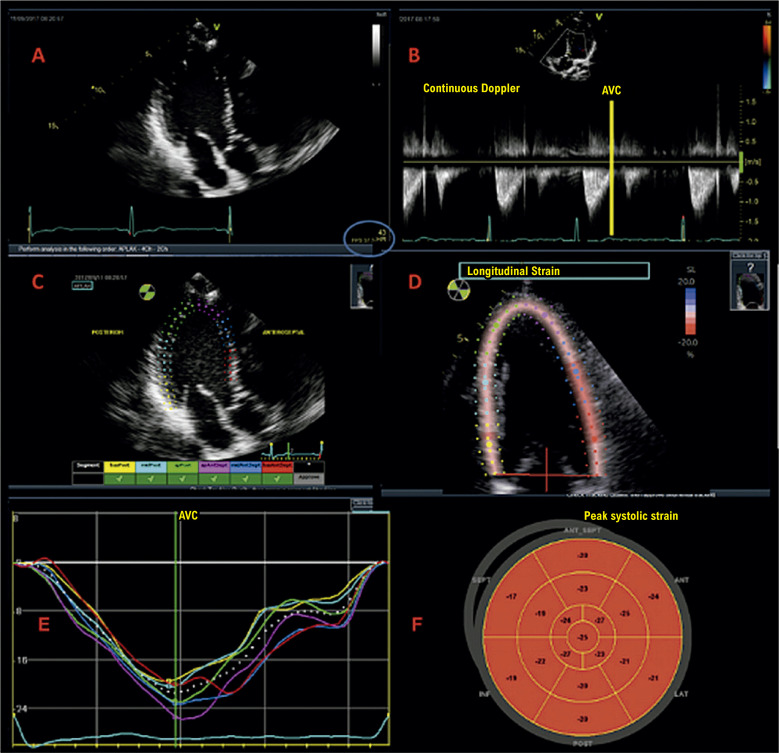
A Tabela 1.1 e a Figura 1.3 trazem um resumo dos passos a serem seguidos para realizar a medida do SLG.
Tabela 1.1. – Passo a passo para medida do strain longitudinal global para a maioria dos fabricantes4.
|
|
|
|
|
|
|
Figura 1.3. – Passo a passo para obtenção do strain longitudinal global. Inicialmente, adquirem-se imagens em 3, 4 e 2 câmaras, com eletrocardiograma de boa qualidade e com frame rate adequado (entre 40 e 80 quadros por segundo) (Imagem A, ovoide azul). Marca-se o fechamento da valva aórtica (AVC) a partir do traçado de Doppler pulsátil ou contínuo (Imagem B). Em seguida, faz-se a marcação de três pontos (dois na base e um no ápice), nas três imagens adquiridas, observando se o software faz um de rastreio adequado das imagens 2D (Imagens C e D). Finalmente, obtemos as curvas (Imagem E), o bull’s eye (Imagem F) e o valor obtido do strain longitudinal global. Adaptado de Tressino et al.4.
2. Recomendações Gerais para o Uso do Strain: Aplicabilidade Clínica, Comparação com a Fração de Ejeção e Descrição Adequada no Laudo
2.1. Valor Prognóstico, Padrões Paramétricos e Detecção Subclínica de Cardiopatias da Deformação Miocárdica
A análise de deformação miocárdica (strain) é uma ferramenta robusta e versátil que oferece informações adicionais e com menor variabilidade em relação aos parâmetros habituais sobre prognóstico, padrões paramétricos peculiares das cardiomiopatias (CMPs) e detecção de lesão subclínica.
Estudos recentes demostraram o valor incremental do SLGVE sobre a fração de ejeção do ventrículo esquerdo (FEVE).10 É importante realçar que a análise do strain apresenta uma variabilidade inter e intraobservador de 4,9 a 8,6%, bem menor que a FEVE, provavelmente por sofrer menos influência da pré- e pós-carga ventricular.13,16 Além disso, o SLGVE vem se tornando uma ferramenta superior à FEVE naqueles pacientes com insuficiência cardíaca com fração de ejeção reduzida (ICFEr) e preservada (ICFEp).17,18 Além da análise do VE, a piora do strain do ventrículo direito (VD) fornece valor aditivo prognóstico naqueles pacientes com ICFEp.19
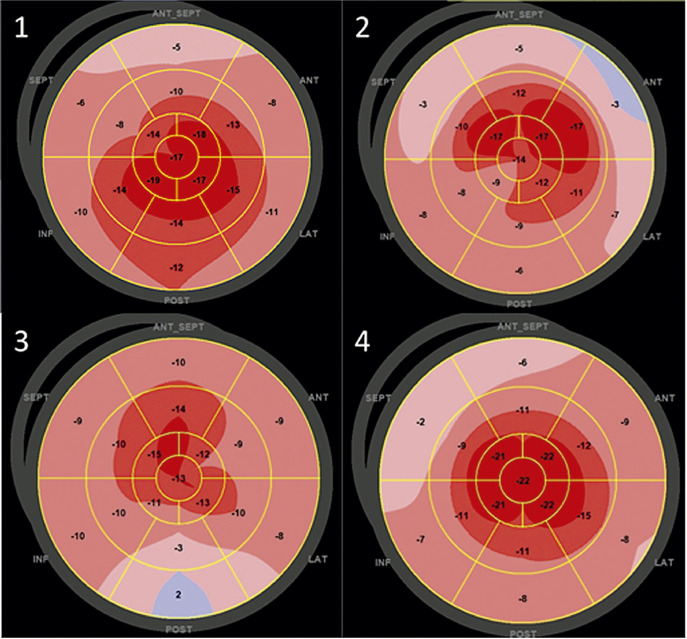
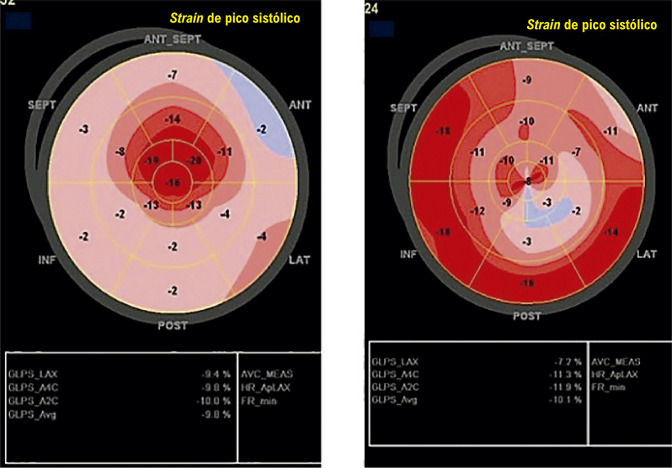
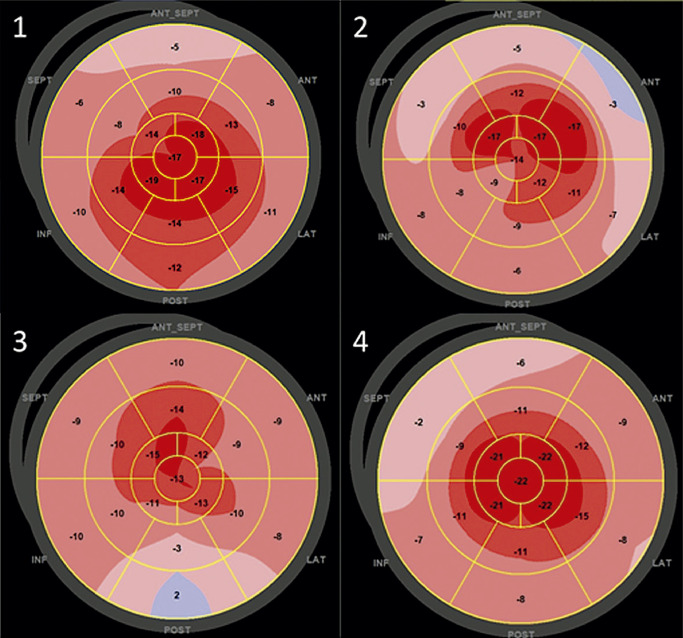
As CMPs compartilham achados morfológicos semelhantes na maioria das vezes, sendo um grande desafio diagnóstico na prática clínica diária. É comum haver a presença de aumento da massa e da espessura ventricular, associada à disfunção diastólica (DD) e com FEVE preservada nos estágios mais iniciais. A análise paramétrica do SLGVE pelo mapa polar possibilita que o exame de ecocardiograma desmascare alguns diagnósticos que não eram percebidos pelos parâmetros habituais, sendo descrito como uma “impressão digital” de algumas delas. O exemplo clássico é o padrão de poupar a ponta (apical sparing) da amiloidose, que será descrito com mais detalhes em capítulo específico.20 Essa caracterização fenotípica vem despertando muito entusiasmo por favorecer uma facilidade diagnóstica nas patologias raras. Por outro lado, é importante ressaltar que, se não combinarmos o strain com dados da história clínica, aspectos morfológicos e hemodinâmicos, favoreceremos o excesso e o erro diagnóstico. Veja esses exemplos de “apical sparing” (Figura 2.1).
Figura 2.1. – Padrões de SLG com aspecto de poupar a ponta em diferentes cardiopatias. 1: Cardiotoxicidade por antracíclico; 2: Miocárdio não compactado; 3: Hipotireoidismo; 4: Amiloidose por transtirretina.
A utilização do strain como ferramenta diagnóstica e prognóstica se consolidou através de sua aplicação na cardio-oncologia, quando há a oportunidade de ajustar a conduta terapêutica, baseada na variação se seu valor, em relação ao valor do exame basal durante a quimioterapia. Quando há uma redução relativa maior que 15%, considera-se cardiotoxicidade com lesão miocárdica subclínica.21 Em 2019, um posicionamento das diversas sociedades elaborou critérios para o uso adequado das diversas modalidades de imagens para avaliação das estruturas cardíacas nas doenças não valvares. Nesse documento, das 81 indicações descritas, apenas quatro consideraram o uso do strain adequado, sendo três na cardio-oncologia e uma para avaliação da CMP hipertrófica.22 Apesar da falta de estudos bem desenhados que validem essa ferramenta nas demais situações descritas por esse posicionamento, o strain é largamente utilizado nos grandes centros de cardio-oncologia. Recentemente, a atualização da Diretriz Brasileira de Cardio-Oncologia reforçou a sua utilização.23
2.2. Strain ou Fração de Ejeção: Qual é a Melhor Alternativa?
A FEVE é um dos principais parâmetros ecocardiográficos utilizados para a avaliação da função ventricular na prática diária, sendo um dado de fácil interpretação pelos clínicos, além de ser amplamente disponível e obtida em equipamentos básicos de ultrassom. Há extensa validação do uso desse parâmetro para o manejo de pacientes portadores de cardiopatias, sendo utilizado em grandes estudos de intervenção terapêutica como critério de inclusão de pacientes e, muitas vezes, servindo como parâmetro para a avaliação e o acompanhamento de resultados.24 O valor prognóstico da FEVE é bastante estabelecido na insuficiência cardíaca (IC) crônica25 e, por isso, na atual recomendação da Sociedade Europeia de Cardiologia, as ICs são classificadas com base no valor da FEVE em: 1) IC com FE preservada (ICFEp: FE ≥ 50%); 2) IC com FE em meio termo (ICFEmr: ); e 3) ICs com FE de ejeção reduzida (ICFEr: FE < 40%).26
A FEVE tem importante papel como parâmetro quantitativo para a definição de estratégias específicas em IC, por exemplo, servindo de critério para a indicação de terapia de ressincronização cardíaca em pacientes com IC refratária (FEVE ≤ 35%) ou mesmo na detecção de cardiotoxicidade em pacientes com câncer em uso de antracíclicos (queda evolutiva de FEVE ≥ 10% em relação ao basal com valor menor que o limite inferior da normalidade).27 No entanto, deve-se ressaltar que há limitação da acurácia da FEVE estimada pelo Simpson biplanar pela grande variabilidade interobservador dessa medida, que pode chegar até 13%.28 A ecocardiografia tridimensional (ECO3D), diferente do método Simpson biplanar, não se baseia em assunções geométricas e, por isso, mede diretamente os volumes das cavidades e a FEVE, com resultados bastante comparáveis aos obtidos pela RMC. Pelo uso de algoritmos automáticos e pela menor suscetibilidade a variações nas janelas de aquisição (orientação dos cortes apicais), a ECO3D possui menor variabilidade intra e interobservador que o método biplanar (0.4 ± 4.5%),29 sendo uma boa alternativa para o acompanhamento e a vigilância de pacientes com disfunção ventricular ou sob risco de dano miocárdico.
As técnicas de avaliação da deformação miocárdica, como o strain, permitem a avaliação dos três componentes de contração das fibras miocárdicas: longitudinal, radial e circunferencial. A FEVE é determinada sobretudo pelos componentes radial e circunferencial da contração miocárdica, que resultam no espessamento das paredes do miocárdio e na redução da cavidade ventricular na sístole. É importante notar, porém, que a FEVE não é um determinante único da performance ventricular (função “ejetiva”), sendo esta também dependente de um volume diastólico final (VDF) do VE adequado para gerar um volume sistólico normal. Isso explica por que, em pacientes com CMPs com expressão fenotípica de hipertrofia parietal concêntrica, como nas infiltrativas ou hipertróficas, podemos ter FEVE normal e baixo débito cardíaco. Esses pacientes se apresentam clinicamente como ICFEp e, à despeito de FEVE normal, têm geralmente pior prognóstico que pacientes com FEVE normal e débito cardíaco preservado, com alterações da função contrátil detectáveis apenas pelo SLG.30
De fato, a deformação longitudinal é o componente da contratilidade miocárdica que se altera mais precocemente em grande parte das CMPs, podendo sinalizar um processo em estágio inicial e subclínico (ainda sem redução da FEVE), fase de doença em que a instituição de medidas terapêuticas ou cardioprotetoras pode apresentar melhores resultados. O SLG pode se encontrar alterado até mesmo em doenças genéticas não fenotipicamente expressas, tal como em portadores de Ataxia de Friedreich com massa e FEVE normais, podendo, inclusive, predizer a queda da FEVE e o prognóstico nesses pacientes.31
Estudos demonstram o valor prognóstico adicional do SLG em pacientes com IC, com valor incremental ao efeito prognóstico da FEVE, sobretudo em pacientes com FE > 35%.32 Dessa forma, Potter et al. sugeriram uma nova classificação de função ventricular, incorporando à prática clínica o uso valores de SLGVE de forma complementar à quantificação da FEVE, auxiliando na decisão clínica e na avaliação prognóstica dos pacientes, sobretudo nos com FEVE > 53% (ICFEp).10
2.3. Recomendações Gerais de como Reportar os Resultados do Strain e os Valores de Normalidade
Com o objetivo de simplificar a descrição do strain no laudo de ecocardiograma, é recomendada a utilização do tipo de strain analisado (o qual define os movimentos de contração ou alongamento) e sua avaliação numérica em valores absolutos, principalmente em estudos comparativos sequenciais, com o objetivo de não levar a interpretações equivocadas de piora do strain. Outras informações cruciais que devem ser descritas são os sinais vitais do paciente (pressão arterial e frequência cardíaca), devido a alterações de pré- e pós-carga que influenciam o valor global do strain, a marca do equipamento de ultrassom utilizado, bem como a versão do software de análise, em decorrência da variabilidade da normalidade entre os fabricantes.33,34 A Tabela 2.1 abaixo descreve as informações essenciais que devem constar no laudo para descrição completa do strain.9
Tabela 2.1. – Elementos essenciais para a descrição do strain no laudo de ecocardiograma.
| Informações relevantes do strain no laudo | Descrição |
|---|---|
| Sinais Vitais | Pressão arterial e frequência cardíaca16 |
| Tipo de strain | Longitudinal, circunferencial e radial |
| Valor absoluto do strain | Na descrição da função da câmara analisada |
| Câmara cardíaca analisada | VE, VD ou AE |
| Padrão de mapa polar (Figura 2.2) | Se há algum padrão típico, como em amiloidose ou cardiomiopatia hipertrófica40 |
| Variação percentual em exames sequenciais | Utilização comprovada em cardio-oncologia. ∆%= strain exame basal, atual/basal21 |
| Equipamento e versão do software utilizado | Há variabilidade do valor normal do strain segundo a marca e a versão do equipamento37 |
∆%: variação (delta) percentual; AE: átrio esquerdo; VD: ventrículo direito; VE: ventrículo esquerdo.
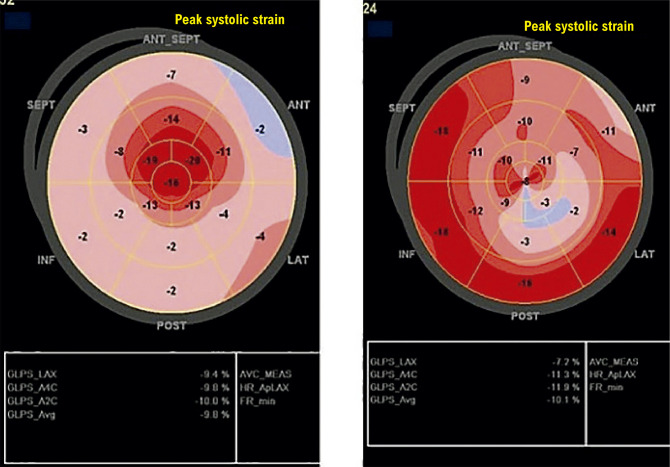
Figura 2.2. – Padrão de strain avaliado no mapa polar: A: Padrão típico de amiloidose (poupa o ápex); B: Padrão típico de cardiomiopatia hipertrófica com predomínio apical (strain reduzido predominante no ápex, em que a hipertrofia foi evidenciada como mais acentuada no estudo bidimensional).
Os valores normais de referência para o strain analisado9,35-39 devem ser incluídos no laudo. A Tabela 2.2 descreve valores médios da normalidade de forma simplificada dos diversos tipos de strain, bem como o grau de evidência para sua utilização na prática clínica. Diferentemente da FEVE, o valor de normalidade do strain ainda não foi assimilado de maneira consistente pelo cardiologista clínico e, portanto, devem constar no laudo como referência.
Tabela 2.2. – Valores de normalidade gerais para as diferentes modalidades de strain e câmaras cardíacas. Grau de comprovação da aplicação clínica.
| Câmara/Tipo de strain | Valor de normalidade (valor absoluto) | Aplicação na prática clínica |
|---|---|---|
|
|
|
|
|
|
|
|
|
AE: átrio esquerdo; VD: ventrículo direito; VE: ventrículo esquerdo. ++++ Muito utilizado; +++ Utilizado; ++ Utilização limitada na prática clínica; + Utilização limitada na prática clínica, e não acessado em softwares embutidos nos equipamentos de ecocardio.
2.4. Conclusão
A evidência atual é robusta para a incorporação do strain na prática clínica diária. Porém, ainda temos desafios para nossa realidade nacional, como a falta de democratização de acesso nos serviços de ecocardiograma com aparelhos com softwares para sua análise e falta de dados sobre a população brasileira. Utilizamos valores extrapolados de população com perfil sociodemográfico bem distinto de nossa realidade, com aplicação adaptada para a população brasileira. O Departamento de Imagem Cardiovascular está promovendo um trabalho multicêntrico (já em andamento), quando estão sendo analisados dados ecocardiográficos de brasileiros hígidos, para que possamos ter um retrospecto dos valores de normalidade em nossa população. O strain vem para se somar aos valores habituais do ecocardiograma, trazendo mais robustez prognóstica, possibilitando diagnóstico de CMPs, particularmente nas que se apresentam com aumento da espessura miocárdica, e, por último, diagnóstico de lesão miocárdica subclínica.
3. Strain na Cardio-oncologia
A disfunção cardíaca relacionada ao tratamento contra o câncer representa uma importante causa de morbidade e mortalidade nos pacientes oncológicos.42,43 Essa complicação pode interromper o tratamento e comprometer a cura ou o adequado controle do câncer.44,45Além disso, a IC relacionada à cardiotoxicidade por quimioterápicos frequentemente tem pior prognóstico que muitas neoplasias, com mortalidade de até 60% em 2 anos.42
A identificação precoce da cardiotoxicidade com a instituição de medidas cardioprotetoras tem potencial impacto prognóstico nesse cenário.46,47 Contudo, os métodos usualmente utilizados para esse diagnóstico, como a FEVE pela técnica bidimensional, têm baixa sensibilidade.48,49 Assim, a utilização de marcadores mais precoces para a identificação dessa complicação, como a análise do strain, tem grande destaque nesse contexto.
Os métodos de diagnóstico por imagem têm papel fundamental nesse cenário, e o ecocardiograma tem sido a ferramenta mais utilizada em função de sua correspondência anatômica, caráter não invasivo, fácil acesso, baixo custo e isenção de radiação ionizante.27 A FEVE é o parâmetro mais utilizado para o diagnóstico de cardiotoxicidade. Utilizando a técnica bidimensional, ela deve ser calculada pelo método de Simpson biplanar.21 A ECO3D, quando disponível, é a técnica de escolha para monitorar a FEVE em pacientes com câncer. Suas principais vantagens incluem maior acurácia no reconhecimento de FEVE abaixo do limite inferior da normalidade e maior reprodutibilidade que a técnica bidimensional, com acurácia semelhante à ressonância cardíaca. Entretanto, sua baixa disponibilidade, seu alto custo e a experiência do operador representam barreiras da técnica tridimensional.27,50
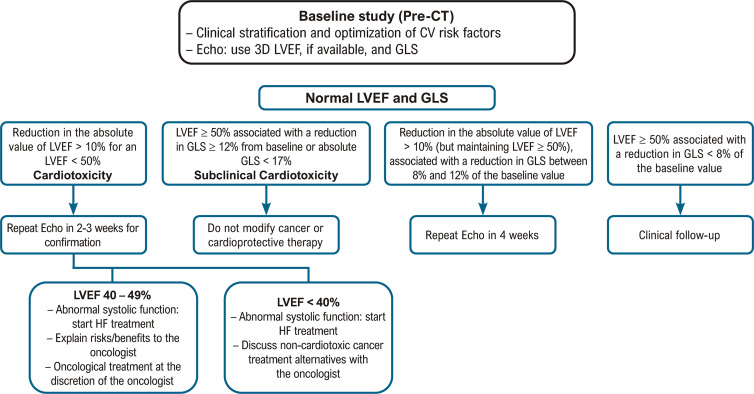
A disfunção ventricular relacionada ao tratamento contra o câncer é definida por queda absoluta da FEVE em mais de 10 pontos percentuais, para um valor inferior a 50%, na presença ou não de sintomas de IC. Recomenda-se que esse estudo ecocardiográfico seja repetido dentro de 2 a 3 semanas para se avaliar os efeitos da pré e pós-carga sobre a FEVE.
Apesar de ser um importante e já estabelecido fator prognóstico, a FEVE tem baixa sensibilidade para o diagnóstico de cardiotoxicidade, sendo dependente de alguns fatores como pré-carga cardíaca, qualidade da imagem e experiência do examinador. Além disso, ela pode subestimar o real dano cardíaco, uma vez que mecanismos hemodinâmicos compensatórios permitem o adequado desempenho sistólico do VE, mesmo na presença de disfunção dos miócitos.48 Assim, a redução da FEVE ocorre frequentemente em um momento muito tardio, quando, mesmo com a intervenção terapêutica, a maioria dos pacientes não tem recuperação funcional.46,48,49
Quando a detecção da cardiotoxicidade é precoce, com instituição de tratamento cardioprotetor, os pacientes têm maior potencial para a recuperação da função ventricular.46,51 Nesse cenário, o estudo da deformação miocárdica ou strain tem grande destaque. O strain calculado pela técnica de speckle tracking bidimensional (ST2D) tem surgido como um marcador sensível e reprodutível de análise da função sistólica e da contratilidade do VE, validado em modelos in vitro e in vivo.52,53 Tem sido crescente o número de publicações que demonstram a utilidade do estudo da deformação miocárdica pelo ST2D na detecção precoce e subclínica da cardiotoxicidade induzida por quimioterápicos, especialmente através da queda relativa do SLG.23,54-57
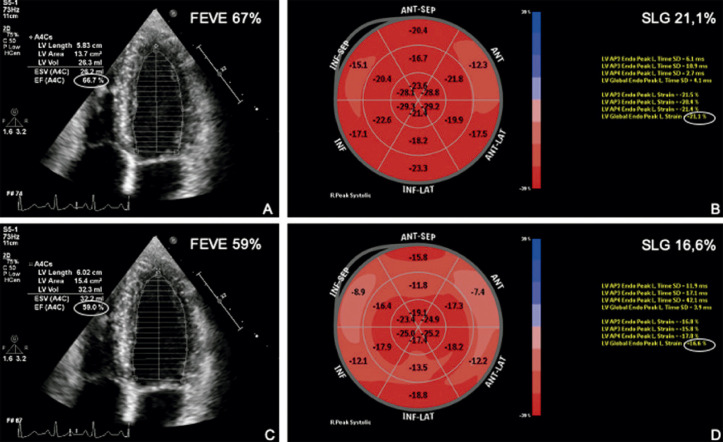
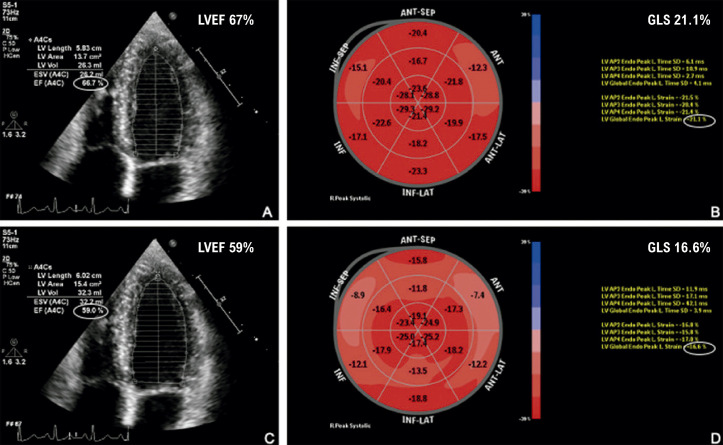
É recomendada a análise do SLG nos pacientes que irão se submeter a tratamento quimioterápico potencialmente cardiotóxico. O diagnóstico subclínico de cardiotoxicidade é sugerido quando há uma queda do SLG maior ou igual a 12% em relação ao seu valor basal.21,27Na ausência de um estudo ecocardiográfico basal (pré-quimioterapia) para comparação, é sugerido, com base na opinião de especialistas, um valor absoluto de strain inferior a 17% como marcador de cardiotoxicidade subclínica, desde que não haja outros dados clínicos de sobreposição de outra doença miocárdica de base. Uma queda do SLG inferior a 8% do valor basal é considerada não significativa. A Figura 3.1 apresenta um exemplo de cardiotoxicidade subclínica sugerida pela queda relativa do SLG.
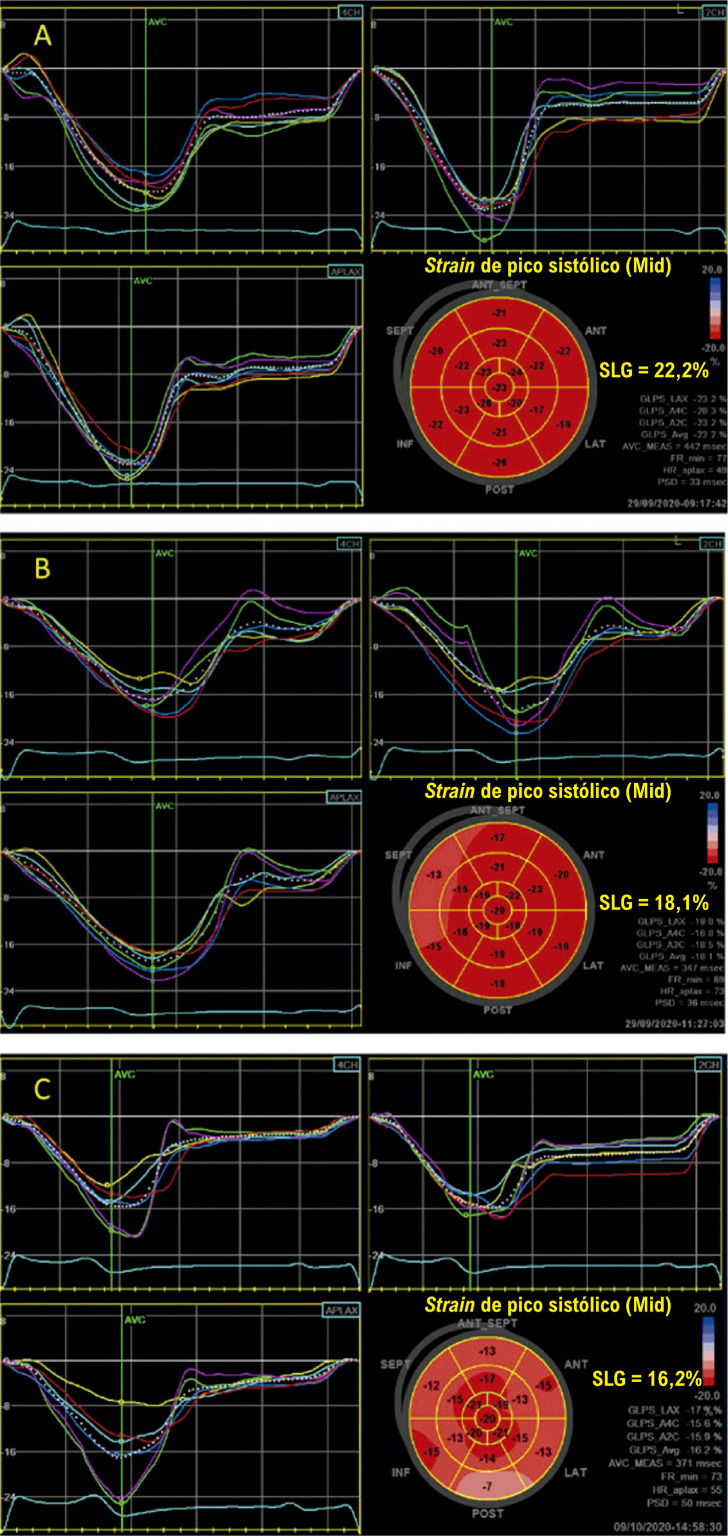
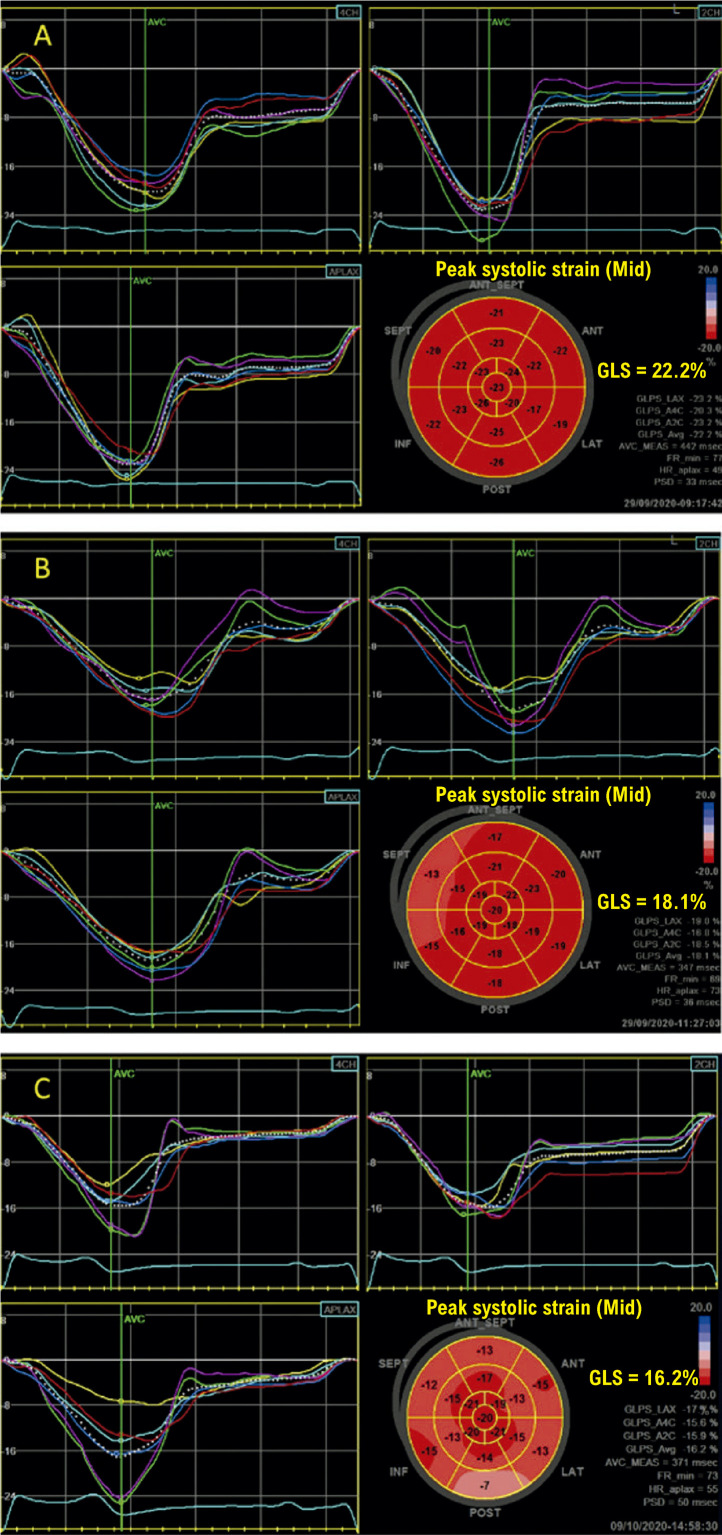
Figura 3.1. – Exemplo de cardiotoxicidade subclínica em paciente com câncer de mama. Análise da FEVE pelo método de Simpson e do SLG com imagem do bull’s eye. Em A e B, avaliação pré-quimioterapia; em B e C, avaliação após dose cumulativa de 240 mg/m2 de doxorrubicina. Não houve queda expressiva da FEVE, entretanto, foi observada queda relativa de 22% no SLG. FEVE: fração de ejeção do ventrículo esquerdo; SLG: strain longitudinal global.
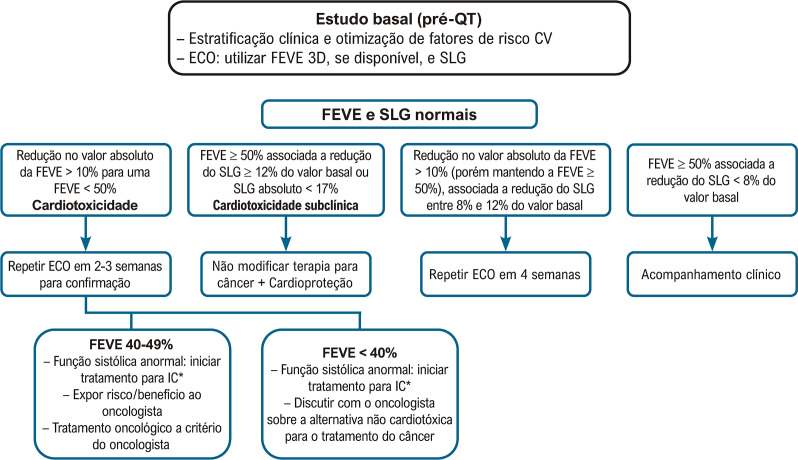
A Figura 3.2 apresenta o algoritmo do seguimento ecocardiográfico no paciente oncológico, baseado na FEVE e no SLG. As Figuras 3.3 e 3.4 apresentam o monitoramento ecocardiográfico em pacientes sob tratamento com antracíclicos e trastuzumabe, respectivamente.
Figura 3.2. – Algoritmo de avaliação do paciente oncológico durante o tratamento quimioterápico, baseado na FEVE e SLG. CV: cardiovascular; ECA: enzima conversora da angiotensina; FEVE: fração de ejeção do ventrículo esquerdo; QT: quimioterapia; SLG: strain longitudinal global.
Figura 3.3. – Monitoramento ecocardiográfico durante o tratamento com antraciclinas. FEVE: fração de ejeção do ventrículo esquerdo; SLG: strain global longitudinal.
Figura 3.4. – Monitoramento ecocardiográfico durante o tratamento com trastuzumabe. FEVE: fração de ejeção do ventrículo esquerdo; SLG: strain global longitudinal.
O ensaio clínico randomizado SUCCOUR foi o primeiro estudo prospectivo e multicêntrico com maior poder científico que demonstrou o impacto prognóstico da cardioproteção guiada pelo SLG em comparação à cardioproteção guiada pela queda da FEVE pela ECO3D. Esse estudo revelou que, em pacientes recebendo quimioterapia com antracíclicos e com risco elevado de cardiotoxicidade, a cardioproteção (incluindo inibidor da enzima conversora de angiotensina [ECA] e betabloqueador) guiada por uma queda relativa do SLG maior ou igual a 12% do valor basal resultou em menor grau de queda da FEVE e menor incidência de disfunção cardíaca relacionada ao tratamento contra o câncer em 1 ano de seguimento.58
O strain calculado pelo speckle tracking tridimensional (ST3D) tem demonstrado vantagens técnicas em relação ao ST2D com acurácia, reprodutibilidade e aplicabilidade já demonstradas em diferentes cenários.59-62 Recentemente, pequenos estudos demonstraram o impacto do ST3D no reconhecimento precoce de alterações mecânicas relacionadas à quimioterapia.63-66 Entretanto, são necessários estudos maiores e principalmente com maior tempo de seguimento para avaliar o valor prognóstico dessa técnica.
Entre as limitações da análise do SLG, destacamos a variabilidade das medidas em equipamentos de diferentes fabricantes, de modo que as medições devem ser sempre feitas nos mesmos aparelhos. Assim como a FEVE, o SLG sofre influência pelos efeitos da pré- e pós-carga, geometria ventricular, alterações teciduais (infarto, miocardite, por exemplo) e distúrbios de condução. Por último, determinadas informações clínicas e oncológicas são fundamentais e devem ser reportadas no laudo para uma acurada interpretação ecocardiográfica, conforme apresentado na Tabela 3.1.
Tabela 3.1. – Informações clínicas e oncológicas relevantes no laudo ecocardiográfico.
| Tempo entre a infusão do quimioterápico e a realização do eco (pré ou pós) |
| Frequência cardíaca Pressão arterial Estado volêmico (descrição do diâmetro e variação da veia cava inferior) |
| Comparação com estudo basal, em especial FEVE e SLG – em caso de queda relativa, descrever o percentual desta redução |
| Aparelho/software utilizado para a análise do SLG |
FEVE: fração de ejeção do ventrículo esquerdo; SLG: strain longitudinal global.
4. Strain na Disfunção Diastólica
4.1. Introdução
A DD é considerada um marcador precoce de dano miocárdico e, mesmo quando assintomática, pode determinar maiores taxas de mortalidade. Com a progressão da DD, ocorre aumento das pressões de enchimento do VE e ICFEp,67,68 sendo que esta última responde por mais de 50% das internações por IC e apresenta taxas de mortalidade equiparáveis às da ICFEr.69 Ao contrário da ICFEp, a DD pré-clínica é potencialmente reversível. Entretanto, a sua fisiopatologia é complexa e, apesar do uso integrado de vários parâmetros, o algoritmo atualmente recomendado é pouco sensível para detectar estágios subclínicos de DD.70,71
Casos indeterminados ainda são frequentes porque esses parâmetros nem sempre se alteram simultaneamente ou de forma linear.70 Fatores não diastólicos também podem contribuir para a ICFEp levando a expressões fenotípicas variadas, a depender do mecanismo fisiopatológico predominante.72 Ferramentas que avaliam as mecânicas ventricular e atrial esquerdas pela medida do strain podem suplantar esses desafios diagnósticos.73,74 O papel da mecânica ventricular direita nesse contexto ainda está sob investigação.75
4.2. Strain do Ventrículo Esquerdo
Diversos estudos têm demonstrado que parâmetros de deformação miocárdica avaliados por meio do speckle tracking, especialmente o SLGVE, têm melhor correlação com o relaxamento do VE e maior acurácia em predizer pressões de enchimento e intolerância ao exercício quando comparados a índices derivados do Doppler tecidual.76-78 A queda do SLGVE auxilia na detecção da DD em estágios mais iniciais e também prediz eventos cardiovasculares (CV) na ICFEp.17,79-82 Diante dessas evidências, o SLGVE reduzido (< 16%) já foi incluído como critério diagnóstico no novo algoritmo proposto pelas recentes diretrizes de ICFEp.83
4.3. Strain do Átrio Esquerdo
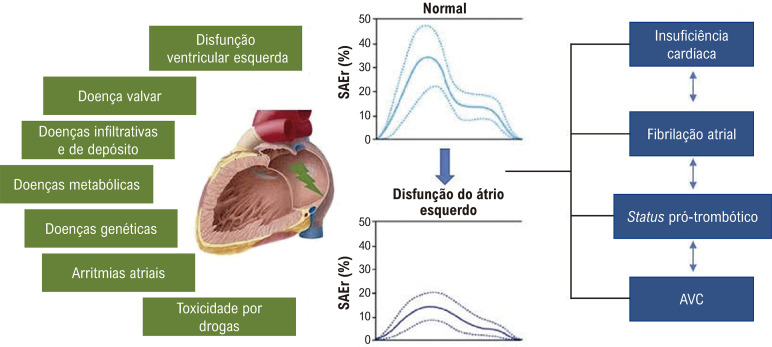
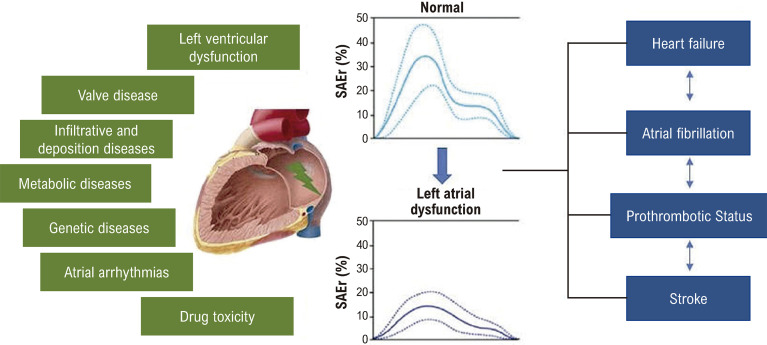
O strain atrial esquerdo (SAE) permite uma análise mais detalhada da função do átrio esquerdo (AE) e dos seus diversos componentes (reservatório, conduto e de bomba).70 Alterações no SAE expressam o acoplamento ventrículo-atrial e são resultantes da exposição crônica à elevação das pressões do VE, reduções da complacência e do relaxamento do AE,41,84,85 podendo preceder o seu remodelamento morfológico.86-88 Embora tenha sido descrita redução de todos componentes do SAE,86,89,90 o SAE de reservatório (SAEr) tem se mostrado o parâmetro mais robusto e se altera de forma linear com a progressão da DD.91-93 Morris et al., entre outros, demonstraram que o SAEr reduzido (< 23%) aumentou a detecção de DD, além de se correlacionar com pressões de enchimento e desfechos clínicos.93-99
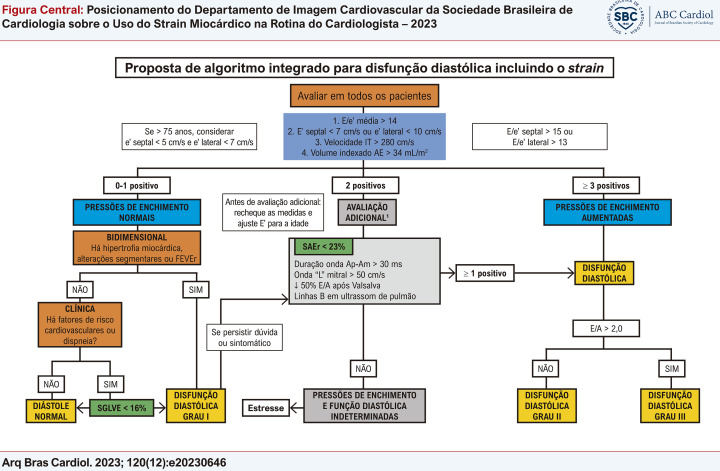
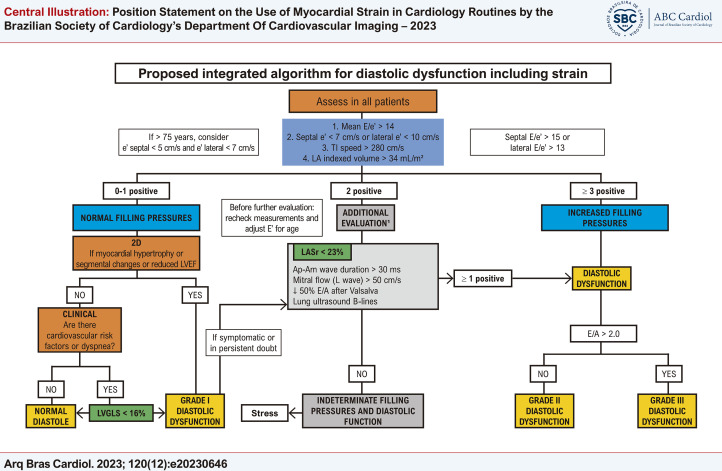
Diante do número crescente de evidências, o SLGVE e o SAEr poderiam ser integrados ao algoritmo de DD vigente, conforme proposto na Figura Central. Essa estratégia pode ajudar a reclassificar os casos indeterminados e aumentar a acurácia para identificar estágios mais precoces de DD, especialmente em indivíduos com fatores de risco cardiovascular ou dispneia inexplicada.97
Figura Central. : Posicionamento do Departamento de Imagem Cardiovascular da Sociedade Brasileira de Cardiologia sobre o Uso do Strain Miocárdico na Rotina do Cardiologista – 2023.
Proposta de inclusão do strain no algoritmo integrado de avaliação da função diastólica, adaptado e traduzido de Nagueh et al.67 AE: átrio esquerdo; Ap: duração da onda A reversa pulmonar; Am: duração da onda A mitral; DD: disfunção diastólica; FEVEr: fração de ejeção do ventrículo esquerdo reduzida; IT: insuficiência tricúspide; SAEr: strain do AE de reservatório; SLGVE: strain longitudinal global do ventrículo esquerdo. Se remodelamento concêntrico, confirmar com SLGVE. Na presença de FEVEr, tempo de desaceleração da onda E mitral (TDE) < 160 ms e onda S < D pulmonar também são parâmetros de pressão de enchimento aumentada. Esse algoritmo não se aplica a pacientes com fibrilação atrial (FA), calcificação do anel mitral ou valvopatia mitral maior que discreta, bloqueio de ramo esquerdo (BRE), ritmo de marca-passo, próteses valvares ou hipertensão pulmonar (HP) primária grave.
Consensos com padronização da metodologia do strain foram publicados para minimizar a variabilidade entre os fabricantes, o que ainda é uma limitação.7,92,100,101 Esperam-se novos estudos prospectivos e multicêntricos para avaliar se a modificação desses índices, com o tratamento, muda o prognóstico da DD e ICFEp.
4.4. Conclusão
O SLGVE e o SAEr são marcadores de doença subclínica que podem ser incorporados às recomendações vigentes para refinar o diagnóstico, o estadiamento e prognóstico da DD. Considerando-se a natureza complexa dessa avaliação, seria salutar a implementação e validação de algoritmos desenvolvidos por meio de inteligência artificial.
5. Strain nas Cardiomiopatias
5.1. Introdução
Seguindo um termo geral, as CMPs são afecções do músculo cardíaco. Em uma conotação mais pura e primária, elas não guardam uma associação com importantes causas sabidamente agressivas ao miocárdio, como a doença arterial coronariana (DAC), hipertensão arterial, valvopatias e cardiopatias congênitas. Podem ser divididas nos principais grandes grupos: dilatada, hipertrófica, restritiva, CMP arritmogênica e “miscelâneas não classificadas”.102
5.2. Cardiomiopatia Dilatada
Por definição, a CMP dilatada se caracteriza como uma doença que acomete o tecido miocárdico e que leva à progressiva redução da função sistólica e dilatação da cavidade do VE. Clinicamente, os indivíduos podem apresentar sinais e sintomas de IC, com necessidade de tratamento, hospitalizações, e por fim, transplante cardíaco.102-107
O ecocardiograma faz parte do arsenal diagnóstico de primeira-linha, com um papel extremamente importante no diagnóstico e prognóstico. Seus principais objetivos são a avaliação da dimensão volumétrica das câmaras cardíacas e a avaliação do desempenho sistólico do VE, classicamente realizada pela estimativa da FE, e que deve ser executada preferencialmente através do método de Simpson.
O strain é uma ferramenta ecocardiográfica adicional para agregar informação a essa avaliação e também possibilita detectar anormalidades sutis, subclínicas e em estágios iniciais de doenças.
Abduch et al. demonstraram excelente correlação entre parâmetros volumétricos obtidos pela ECO3D e o strain em pacientes com CMP dilatada.108 Com a evolução da CMP dilatada para fases mais acentuadas de comprometimento sistólico do VE, haverá redução mais importante do strain e do strain rate nas três principais orientações (longitudinal, radial e circunferencial) (Figura 5.1).109 A torção do VE também acompanha essa tendência de diminuição com a progressão da doença. Adicionalmente, em fases muito avançadas, também pode haver inversão das rotações: segmentos basais com rotação anti-horária e os apicais em sentido horário.110-112
Figura 5.1. – A) exemplo de strain longitudinal global (SLG) normal do ventrículo esquerdo. Observam-se as deflexões negativas das curvas, que se apresentam relativamente homogêneas nas três incidências. Abaixo e à direita, a representação paramétrica em bull’s eye, com todos os campos em vermelho mais intenso, significando uma boa deformação global. B) exemplo de strain em um indivíduo portador de cardiomiopatia dilatada de etiologia chagásica. É possível observar a redução de amplitude das curvas, que aqui se apresentam também muito heterogêneas. As curvas de strain septal e na parede inferior têm deflexão positiva, ou seja, indicando distensão ou discinesia, o que está bem demonstrado mapa de bull´s eye em azul (setas amarelas), além do vermelho menos intenso, representando baixos valores de strain (SLG = -5,6%).
O SLG é um preditor independente de mortalidade por todas as causas em pacientes com ICFEr, especialmente em pacientes do sexo masculino sem FA.113 Já nos pacientes com FEVE recuperada, um SLG anormal prevê a probabilidade de diminuição da FEVE durante o acompanhamento, enquanto um SLG normal prevê a probabilidade de FEVE estável durante a recuperação.114
5.3. Cardiomiopatia Arritmogênica
A CMP arritmogênica é uma entidade histologicamente caracterizada por infiltração fibrogordurosa no tecido miocárdico. Essa infiltração ocorre preferencialmente nas vias de entrada, saída e ápice do VD, o chamado “triângulo da displasia”, entretanto o VE também pode ser acometido de forma concomitante ou até mesmo exclusiva.115-117
Macroscopicamente, a parede ventricular tende a se afilar, com formação de microaneurismas, e a tendência é progredir para comprometimento sistólico e dilatação da cavidade. O método diagnóstico padrão-ouro é a RMC, contudo o ecocardiograma é o exame inicial, e o strain da parede livre do VD pode auxiliar na determinação do comprometimento sistólico dessa cavidade.
Prakasa et al. foram os primeiros a analisar o strain na CMP arritmogênica com acometimento do VD, em 2007. Eles mostraram uma diferença consistente entre os valores do strain nos indivíduos doentes (10 ± 6%) em comparação com os normais (28 ± 11%, P = 0,001).118
O strain longitudinal da parede livre do VD (SL-PLVD) está associado à taxa de progressão estrutural em pacientes com CMP arritmogênica. Ele pode ser um marcador útil para determinar quais pacientes requerem acompanhamento e tratamento mais próximos. Pacientes com strain de VD menor que 20% tiveram um risco maior de progressão estrutural (odds ratio: 18,4; IC95% 2,7–125,8; P = 0,003).119
Pacientes com CMP arritmogênica apresentam redução do strain atrial direito (AD) em todas as fases da diástole, mesmo quando o volume do AD é normal. O strain do AD, obtido nas fases reservatório e bomba, está associado a um risco aumentado de eventos CV.120
5.4. Cardiomiopatia Hipertrófica
A CMP hipertrófica (CMPH) é uma doença autossômica dominante, sendo a doença cardíaca de etiologia genética mais comum. Caracteriza-se pelo aumento da espessura miocárdica ventricular de diferentes morfologias (podendo ser concêntrica, apical, septal, hipertrofia da parede livre do VE e do VD) e está relacionada ao aumento da morbimortalidade dos pacientes acometidos.121-123
O ecocardiograma é o método de imagem mais utilizado para o diagnóstico morfológico e hemodinâmico na CMPH. Cerca de 25% desses pacientes apresentam gradiente em via de saída do VE maior de 30 mmHg no repouso, que pode ser quantificado pelo Doppler contínuo.124 O gradiente dinâmico também pode estar presente nesses pacientes e pode ser mais bem avaliado pela realização das manobras de Valsalva durante o ecocardiograma, pelo ecocardiograma com estresse físico ou farmacológico com dobutamina.125 Níveis elevados de gradiente intraventricular na CMPH podem ser um dos determinantes para a queda da deformidade miocárdica e dos mecanismos de torção, assim como do strain no AE.126
A técnica do strain miocárdico auxilia na análise da mecânica cardíaca regional e global na CMPH, sendo medida através do speckle tracking, e é capaz de detectar precocemente alterações da função sistólica, fibrose e até maior risco de o paciente desenvolver arritmia, mesmo nos casos de pacientes com função sistólica normal.126-130 O padrão do mapa polar auxilia na diferenciação das fenocópias que cursam com aumento da espessura, visto que a deformação miocárdica longitudinal apresenta-se reduzida no local da hipertrofia20,131,132 (Figura 5.2).
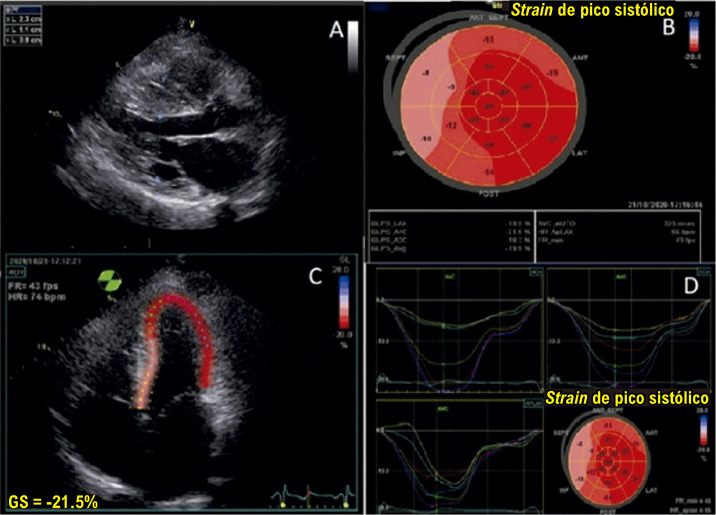
Figura 5.2. – A. Imagem bidimensional demonstrando hipertrofia septal assimétrica não obstrutiva, com septo interventricular medindo 23 mm e parede posterior de 11 mm. B. Strain longitudinal global normal do ventrículo esquerdo (20%), com representação paramétrica em bull’s eye, demonstrando segmentos com boa deformação miocárdica em vermelho mais intenso e menores valores de deformação nos segmentos septais, representados na cor rosa (8%). C. Incidência de 4 câmaras, com pior deformação miocárdica nos segmentos médio e basal ínfero-septal. D. Observa-se a redução de amplitude das curvas que representam os segmentos septais, também demonstrado mapa de bull´s eye em rosa, representando valores menores de strain (8%).
Hiemstra et al. identificaram que o volume atrial esquerdo indexado e o SLGVE são fatores prognósticos independentes de desfechos adversos como morte súbita e transplante cardíaco em pacientes com CMPH.133 Embora o SLG do VD (SLGVD) possa estar alterado no paciente com CMPH por ser uma doença estrutural cardíaca, seu significado prognóstico é desconhecido.133,134
5.5. Endomiocardiofibrose
A endomiocardiofibrose (EMF) é a CMP restritiva mais comum em nosso meio, na África equatorial e na Índia, afetando cerca de 10 milhões de pessoas no mundo. Ela é caracterizada pela deposição de tecido fibroso no endomiocárdio do ápice e da via de entrada de um ou ambos os ventrículos. A etiologia permanece desconhecida até hoje, podendo estar relacionada a hipereosinofilia, infestações parasitárias e desnutrição proteica, especialmente em populações de padrão socioeconômico comprometido.
O ecocardiograma mostra ventrículos de tamanho normal ou reduzidos, com morfologia ventricular em “cogumelo” ou em “V” pela deposição da fibrose, podendo estar associado à trombose endocárdica apical, hipermotilidade da região basal ventricular (sinal de Merlon), átrios de volume geralmente muito aumentados, função ventricular sistólica comumente preservada e DD.135-137
Poucos artigos avaliaram a EMF utilizando a ECO3D com speckle tracking. Esses estudos mostram redução do SLG, especialmente com comprometimento mais importante da região apical.137,138
5.6. Miocárdio Não Compactado
O miocárdio não compactado (MNC) é caracterizado pela presença de trabéculas proeminentes e espaços intertrabeculares profundos na cavidade do VE devido à compactação incompleta do miocárdio na vida embrionária. Isso pode levar a quadro clínico de IC, arritmias e eventos tromboembólicos. Existem duas formas, a esporádica e a familiar, sendo que a última está relacionada a mutações de proteínas do sarcômero. Os índices de deformação miocárdica permitem uma análise regional adequada da função ventricular em pacientes com MNC e auxiliam na diferenciação de outras CMPs.
Um estudo indiano comparou a deformação miocárdica de 12 pacientes com MNC, 18 pacientes com CMPH e 18 indivíduos saudáveis. Ambos os grupos de pacientes apresentaram redução do strain longitudinal, entretanto, os pacientes com MNC apresentaram maior redução do strain longitudinal na região apical quando comparados com o grupo de CMPH (12,18 ± 6,25 vs. 18,37 ± 3,67; p < 0,05), sugerindo um comprometimento maior dessa região na não compactação miocárdica. Além disso, um gradiente ápico-basal no strain longitudinal foi observado nos pacientes com MNC, mas não nos com CMPH.139 Ambos os grupos apresentam DD quando comparados com o grupo-controle. Outro estudo mostrou que o strain longitudinal é maior no grupo de MNC em relação à CMP dilatada idiopática e que o gradiente base-ápice do strain é um índice útil para diferenciar essas doenças com sensibilidade de 88,4% e especificidade de 66,7%.140
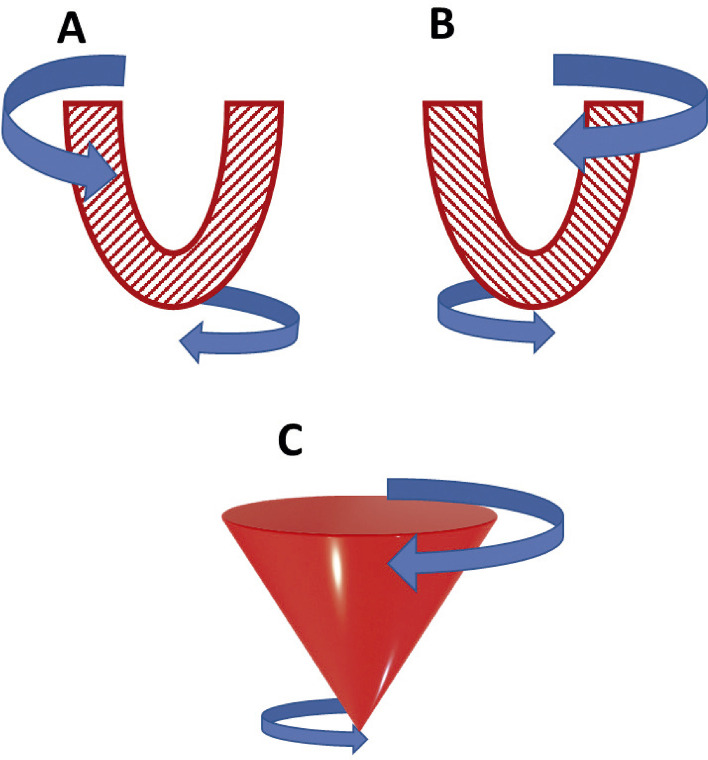
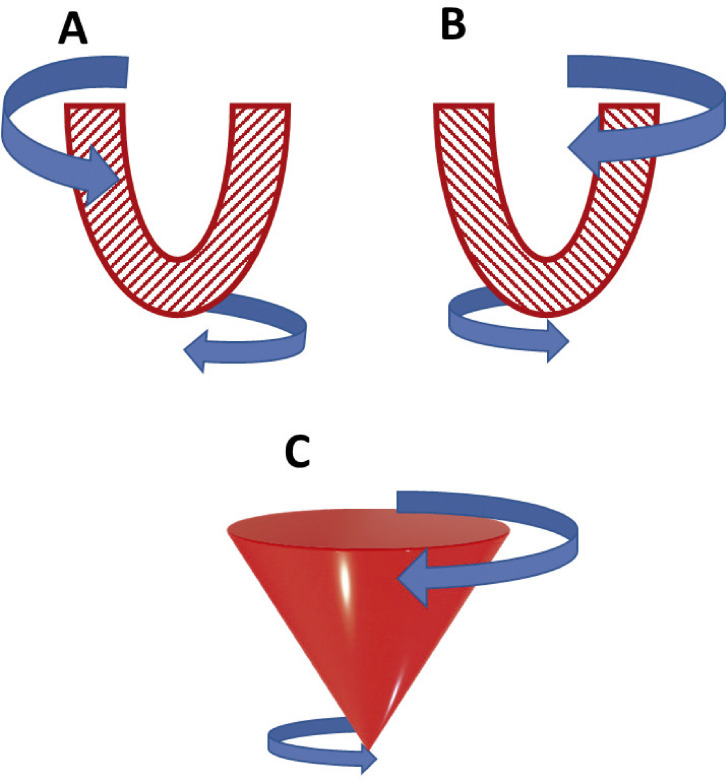
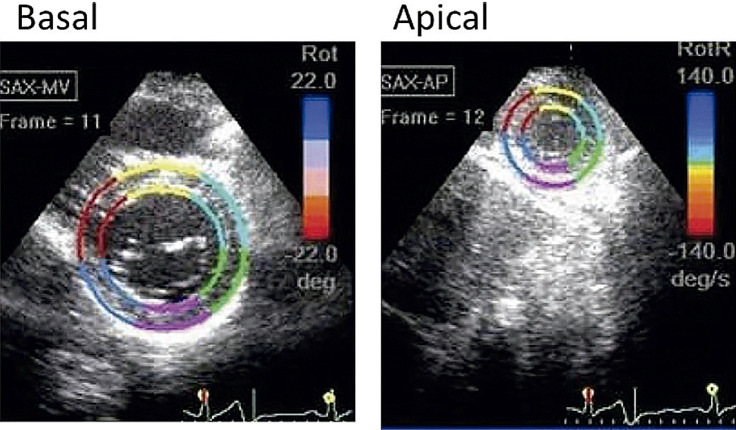
No coração normal, a base do VE gira no sentido horário durante a sístole, enquanto o ápice gira no sentido anti-horário, sendo que a torção é a diferença entre a rotação apical menos a basal. Um estudo prévio mostra que 50% dos pacientes com MNC apresentam rotação em corpo rígido (RCR), com rotação horária do ápice e da base; entretanto, estudos anteriores mostraram prevalência de 53,3% e 83%.141,142 Um estudo com 28 crianças com MNC mostrou que 39% dos pacientes apresentavam RCR, além de apresentarem menor strain longitudinal, mas não FEVE, em relação ao grupo sem RCR, podendo ter valor prognóstico.143 Além disso, os autores sugerem que o RCR está possivelmente relacionado principalmente à disfunção da camada apical subepicárdica compactada, sem relação com a distribuição de trabéculas. Outro estudo em 101 crianças com MNC mostrou que o grupo que apresentou desfecho adverso tinha redução do strain longitudinal, radial e circunferencial, sugerindo ser uma doença que afeta globalmente o coração e não apenas a região não compactada.144
6. Strain nas Valvopatias
O ecodopplercardiograma transtorácico é o método de primeira linha para o diagnóstico e a classificação da gravidade das valvopatias, por meio de uma análise combinada das alterações da anatomia e da função valvar.145 Esse método diagnóstico participa ativamente na definição do momento correto e do tipo de intervenção que deve ser realizada para o tratamento das valvopatias.
Classicamente, a indicação de tratamento é baseada na presença de sintomas ou de fatores complicadores.145 Entre os fatores complicadores, a disfunção ventricular esquerda é considerada o fator mais importante.145
A avaliação da função ventricular esquerda é habitualmente realizada pela ecocardiografia, por meio da medida da FEVE.146 Entretanto, várias evidências científicas têm demonstrado que a medida do strain ventricular esquerdo pode identificar a presença de disfunção ventricular antes da queda da FE.
A insuficiência mitral (IM), talvez seja a valvopatia que melhor representa esse paradoxo, uma vez que, nessa doença, o estado de alta pré-carga e baixa pós-carga faz com que a FE não represente adequadamente a função sistólica do VE. Por essa razão, as diretrizes clínicas são bastante conservadoras na definição de disfunção ventricular esquerda nessa condição.145,147-149 Entretanto, alguns estudos indicam que, mesmo utilizando esses parâmetros, o desfecho clínico após correção cirúrgica da IM pode não ser satisfatório, especialmente no que se refere à queda da FE e à presença de IC.150-151 Dessa forma, estudos têm demonstrado que mesmo em pacientes com FE acima de 60% e com diâmetro sistólico final do VE menor que 40 mm, a presença de SLG reduzido (≤ 19%) se associou à queda da FE abaixo de 50% no pós-operatório.152-154 Um SLG reduzido, abaixo de 18,1%, também se associou à maior mortalidade e a mais eventos CV em pacientes com IM seguidos prospectivamente e submetidos à cirurgia corretiva.155
Na insuficiência aórtica (IAo), demonstrou-se que a gravidade da valvopatia se correlaciona com a queda do strain ventricular esquerdo.156 Além disso, em pacientes com IAo importante e crônica, assintomáticos e com FE preservada, um SLG abaixo de 19% se associou à maior mortalidade ao longo do tempo, que era corrigida com a realização de troca valvar.157 O mesmo grupo mostrou que uma medida menor que 19% do SLG após a cirurgia, bem como uma queda de mais de 5 pontos percentuais no SLG, implicava em maior mortalidade.158
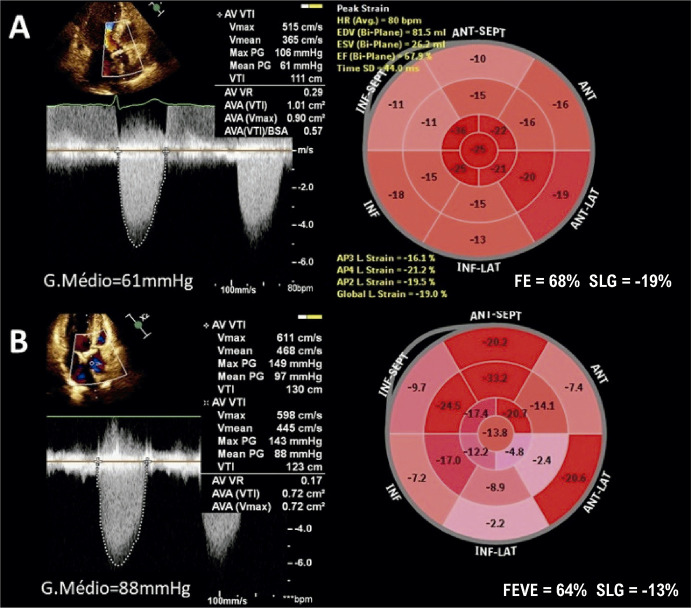
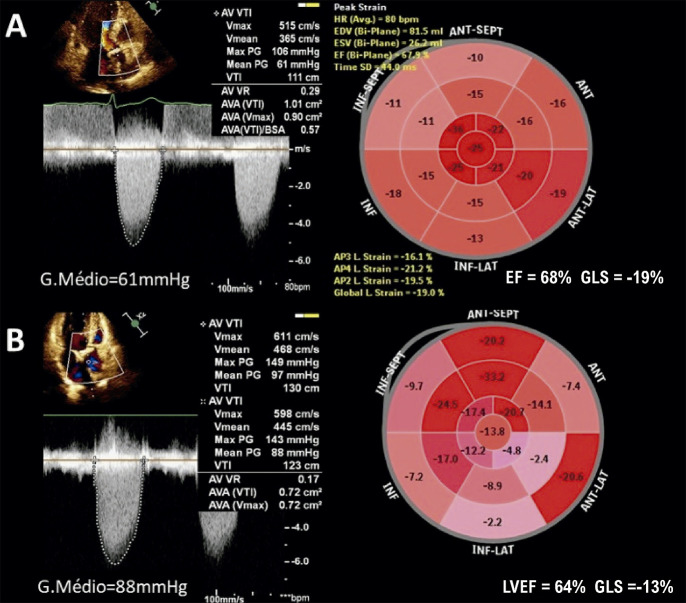
Na estenose aórtica (EA) importante, a presença de FE menor que 50% e/ou de sintomas têm sido os pilares para indicação de tratamento.145,147-149 Entretanto, uma estratégia baseada em aguardar que a FEVE caia para < 50% para indicar a intervenção cirúrgica aórtica pode levar a desfechos clínicos insatisfatórios.159 Assim, o emprego de um parâmetro robusto de detecção de disfunção miocárdica subclínica, como o SLG, parece ser uma ferramenta de grande valor na estratificação do risco (Figura 6.1). Enquanto a FEVE não difere entre os graus de EA, o SLG diminui linearmente conforme a doença progride,160 acarretando maior risco de desfechos clínicos adversos, mesmo em assintomáticos.161
Figura 6.1. – Dois pacientes com estenose aórtica grave clássica, de alto fluxo, com fração de ejeção (FE) do ventrículo esquerdo normal, mas valores bastante distintos de strain longitudinal global (SLG). (A) Gradiente transvalvar aórtico médio = 61 mmHg, com FE e SLG normais. (B) Gradiente transvalvar aórtico médio = 88 mmHg, com FE normal e SLG diminuído.
Diversos estudos examinaram o valor prognóstico do SLG para predizer a mortalidade e eventos CV em indivíduos assintomáticos com EA e FEVE preservada, visando selecionar quais devem ser encaminhados precocemente para a intervenção valvar.162-164 Os resultados desses estudos foram condensados em uma metanálise que definiu SLG < 14,7% como o valor de corte associado com maior risco de morte (sensibilidade de 60% e especificidade de 70%; área sob a curva [ASC] = 0,68).165 Foi encontrado SLG < 14,7% em aproximadamente um terço da população de indivíduos com EA moderada a grave e FEVE preservada, acarretando risco de morte 2,6 vezes maior. É importante ressaltar que a relação entre SLG e mortalidade foi significativa, tanto naqueles com FEVE entre 50-59% quanto naqueles com FEVE ≥ 60%. Em contraste, o achado de SLG > 18% se associou com excelente evolução clínica (97±1% de sobrevida em 2 anos). Portanto, o SLG diminuído, a despeito da FEVE preservada, configura-se como um poderoso preditor prognóstico a ser considerado na tomada de decisão clínica para indicar intervenção na EA grave assintomática, em conjunto com outros dados clínicos e ecocardiográficos.
7. Strain nas Cardiopatias Isquêmicas
7.1. Introdução
A ecocardiografia é uma excelente ferramenta a ser utilizada nas unidades de emergência para o diagnóstico de síndrome coronariana aguda e suas complicações. Ela oferece informações sobre o prognóstico desses pacientes a curto e a longo prazo, e o seu papel está bem definido na estratificação de risco da DAC estável e na avaliação de viabilidade miocárdica.
Entre as técnicas existentes, a ecocardiografia bidimensional com strain pelo speckle tracking (2DST) ratifica e acrescenta informações, sem estender em demasiado o tempo de exame. Ela avalia com boa acurácia a isquemia subendocárdica através do strain longitudinal em eventos agudos e crônicos.
Ao longo do texto, serão revisadas as indicações sobre o uso do strain longitudinal, circunferencial e radial nas cardiopatias isquêmicas, assim como outros dados fornecidos ao se calcular o strain, como a dispersão mecânica. Na Tabela 7.1 estão as principais indicações do strain na cardiopatia isquêmica
Tabela 7.1. – Principais aplicações do strain na cardiopatia isquêmica.
| Indicações do strain na cardiopatia isquêmica |
|---|
| Avaliação da alteração segmentar e global |
| Diferenciação de infartos subendocárdicos dos transmurais (acometimento longitudinal, radial e circunferencial) |
| Discriminar a artéria culpada de acordo com o acometimento pelo bull’s eye |
| Avaliação da melhora do strain global e segmentar após a revascularização miocárdica |
| Melhora a detecção de doença arterial coronariana |
| Preditor desfechos e de remodelamento após infarto agudo do miocárdio |
| Preditor de desfechos como hospitalizações por insuficiência cardíaca e mortalidade por todas as causas |
| Identifica pacientes com risco de arritmias |
7.2. Strain na Síndrome Coronariana Aguda
O strain bidimensional é um marcador com boa sensibilidade para detectar isquemia miocárdica, considerado mais reprodutível que a FEVE e com acurácia confirmada pela RMC.52,166 A fibra subendocárdica é mais sensível à isquemia no seu estágio inicial, e o componente longitudinal predomina nesse tipo de isquemia.167 O SLG apresenta-se reduzido no infarto agudo do miocárdio (IAM) e correlaciona-se com a extensão do infarto, FE, eventos adversos e resposta às estratégias de reperfusão.168-172
Pacientes com infartos de pequena extensão, apresentam o SLG e radial reduzidos, enquanto o circunferencial e o twist se mantêm preservados. No entanto, o strain circunferencial estará comprometido também no infarto transmural.173
A identificação da extensão do infarto transmural apresenta uma implicação prognóstica importante, pois está associada a prognóstico reservado e a um maior número de eventos adversos. Os infartos subendocárdicos e não transmurais são associados com recuperação após revascularização (Figura 7.1).174
Figura 7.1. – Strain 2D visualizado através do bull’s eye demonstra alteração de deformidade na região apical do ventrículo esquerdo, com valores dos segmentos envolvidos reduzidos, compatível com lesão de artéria descendente anterior.
Um valor do strain longitudinal de 15% correlaciona-se com alterações segmentares (sensibilidade de 76% e especificidade de 95%).168O strain radial com o ponto de corte de 16,5% diferencia infartos transmurais dos não transmurais (sensibilidade de 70% e especificidade de 71,2%). O valor do strain circunferencial < 11% diferencia infarto transmural de não transmural (sensibilidade de 70% e especificidade de 71,2%).175Além disso, o strain longitudinal regional de 4,5% distingue infarto transmural de não transmural (sensibilidade de 81,2% e especificidade de 81,6%).176,177
Um outro dado importante em relação ao SLG é o seu valor diagnóstico na doença coronariana aguda (DCA) sem supra de ST para discriminar a artéria culpada. Uma coorte com 58 pacientes, dos quais 33 tinham DAC significativa (lesão acima de 50%) definida pela cineangiocoronariografia e submetidos à análise do strain antes do procedimento, demonstrou um ponto de corte de 19,7% (sensibilidade de 81% e especificidade de 88%, com ASC = 0,92) para detecção de DAC. O emprego de um ponto de corte de 21% foi capaz de excluir estenose coronariana significativa em 100% dos pacientes. O strain longitudinal territorial foi calculado como a média dos strain de pico sistólico dos segmentos que pertencem ao território daquele vaso estudado. Nesse trabalho, se o ponto de corte de 21% fosse aplicado, 16 pacientes seriam poupados da cineangiocoronariografia.178,179
O strain pode ser uma ferramenta para auxiliar na detecção de oclusão coronariana aguda em pacientes sem supra de ST, que podem se beneficiar de terapia de reperfusão precoce. Um estudo avaliou 150 pacientes, que realizaram o exame ecocardiográfico antes de serem encaminhados à cineangiocoronariografia. Desse total, 33 apresentaram oclusão coronariana aguda. Observou-se que um strain menor que 14% identificou a oclusão coronariana aguda (sensibilidade de 85% e especificidade de 70%), mas estudos mais robustos necessitam ser realizados para validação da técnica.180
O strain emergiu como uma nova técnica para detectar alterações subclínicas segmentares e globais, com performance acima de testes enzimáticos, ECG e escores de risco, além do seu papel na avaliação prognóstica desses pacientes com DCA. Trata-se de um exame rápido disponível à beira do leito e que pode ser realizado antes da cineangiocoronariografia, especialmente por ecocardiografistas treinados. Essa técnica está indicada, conforme os estudos citados, na DCA sem supra de ST para a avaliação das alterações segmentares e da função ventricular global, para diferenciar infartos pequenos dos infartos transmurais, discriminar a provável artéria culpada e para a avaliação pós-revascularização percutânea. Também é possível utilizá-la para a avaliação da viabilidade miocárdica após episódios de IAM.181,182
7.3. Strain na Síndrome Coronariana Crônica
A área mais suscetível a isquemia está localizada na região subendocárdica e, nessa localidade, as fibras estão orientadas no sentido longitudinal, portanto a avaliação da deformação longitudinal utilizando o 2DST seria um excelente marcador para a presença isquemia em comparação à avaliação somente pela ecocardiografia convencional.183
A interação do miocárdio normal e anormal gera padrões regionais típicos de deformação miocárdica, indicando que a contração miocárdica e a deformação miocárdica não são parâmetros intercambiáveis.16,184
O SLG pode ser muito mais sensível do que a FEVE na capacidade de detectar alterações precoces na isquemia miocárdica, pois avalia a função longitudinal do VE, porém ele não tem especificidade superior quando comparado às alterações da mobilidade de parede.185,186
A variabilidade das medidas regionais do strain pelo speckle tracking é relativamente alta, o que torna essas avaliações menos adequadas para o uso de rotina. No entanto, as medidas do SLG mostraram-se reprodutíveis e robustas, provavelmente devido à avaliação amplamente automatizada desse método.187 A outra alteração é a heterogeneidade regional de ativação miocárdica, que altera a sequência temporal de encurtamento e alongamento do miocárdio.
Na isquemia, não somente a amplitude do encurtamento é reduzida, como também o início e a duração da contração das fibras são alterados, o que gera um encurtamento ou espessamento característico do miocárdio após o fechamento da válvula aórtica.187 Essa alteração, chamada de encurtamento pós-sistólico (EPS), é característica do desenvolvimento de isquemia, apesar de poder ocorrer também na disfunção regional de qualquer causa (cicatriz, dissincronia etc.).187,188 Esse EPS pode ser entendido como um sinal de atraso do relaxamento para que a região isquêmica possa encurtar, enquanto a pressão do VE reduz e o tecido circundante relaxa.16 Um menor EPS com função sistólica normal é um achado frequente em 30% a 40% dos segmentos miocárdicos de corações saudáveis e pode ser encontrado principalmente no ápice e na base das paredes inferior, septal e antero-septal.16,189 Um dado importante no contexto da CMP isquêmica é a avaliação temporal do padrão das curvas do SLG, pois, muitas vezes, os segmentos isquêmicos podem ter valores do pico sistólico preservados, porém apresentam atraso temporal em relação aos outros segmentos não isquêmicos.
É importante ressaltar que as medidas do strain longitudinal regional não necessariamente refletem a impressão visual das alterações da contração, que é determinada pelo espessamento radial e pelo movimento endocárdico para o interior da cavidade.16
O SLG contribui para a detecção de DAC em pacientes com angina estável (estenose maior ou igual a 70%), com valores reduzidos na presença de DAC (17,1 ± 2,5% vs. 18,8 ± 2.6%; p < 0,001), especialmente quando associado ao teste ergométrico, e, além disso, identifica a provável artéria culpada.183 O emprego do strain longitudinal e, especialmente, do strain rate melhorou a sensibilidade e a acurácia na detecção das alterações segmentares no período tardio do pós-infarto do miocárdio.189
Na estratificação dos pacientes pós-IAM, um valor SLG menor que 15% antes da alta hospitalar foi um preditor independente de dilatação do VE em um seguimento de 3 a 6 meses, além de servir como um marcador do tamanho da área do infarto.190Nesse mesmo contexto de pós-IAM, um valor do SLG menor do que 14% foi um preditor independente de morte cardiovascular e internações por IC.191 Nos pacientes com doença crônica estável, um valor do SLG menor que 11,5% também demonstrou ser um preditor de morte por todas as causas e de desfechos combinados (morte por todas as causas e internação por IC).192
A heterogeneidade regional da contração miocárdica também pode ser avaliada pela dispersão mecânica, que é definida como o desvio padrão de tempo para atingir o pico tensão negativa entre todos os segmentos do VE. Esse índice tem um valor preditivo para taquiarritmia ventricular em pacientes pós-infarto. Foi demostrado que valores maiores de dispersão foram encontrados em pacientes que apresentaram arritmias no pós-IAM (85 +/- 29 ms vs. 56 +/-13 ms, p < 0,001).193
7.4. Strain do Ventrículo Direito na Cardiopatia Isquêmica
A função do VD é comprometida em aproximadamente um terço dos infartos de parede inferior e seu envolvimento tem sido descrito como um preditor importante de mortalidade hospitalar e de complicações maiores. A avaliação da função do VD é desafiadora devido à sua complexidade estrutural. O valor do strain da parede livre do VD demostrou ser um preditor de oclusão proximal da artéria coronária direita em pacientes com IAM de parede inferior (strain da parede livre do VD < 14,5%, ASC = 0,81; p < 0,001).194
Na doença isquêmica crônica estável, o strain da parede livre do VD apresenta-se alterado em pacientes com estenose da coronária direita (lesão maior que 50%) e pode ser usado para detectar disfunção subclínica nesse contexto.195
8. Strain nas Doenças Sistêmicas (Amiloidose e Doença de Fabry)
8.1. Strain na Amiloidose Cardíaca
A amiloidose é uma doença sistêmica causada pela deposição extracelular de fibrilas amiloides insolúveis nos tecidos. O acometimento cardíaco é um importante fator prognóstico e causa grande impacto na qualidade de vida dos pacientes, ocorrendo mais comumente nas formas causadas por cadeias leves (AL) e na amiloidose por transtirretina (ATTR).196
A ecocardiografia é um método de primeira linha para o diagnóstico e a avaliação prognóstica da amiloidose cardíaca (AC) e de outras doenças cardíacas infiltrativas. A maioria dos achados clássicos e sinais mais específicos da AC ao ecocardiograma ocorre somente em estágios muito avançados da doença.30 Situações clínicas como a IC com FE preservada e a presença de hipertrofia ventricular podem servir como sinais de alerta para a suspeição diagnóstica de AC.197
8.1.1. Papel da Análise da Deformação Miocárdica no Diagnóstico da Amiloidose Cardíaca
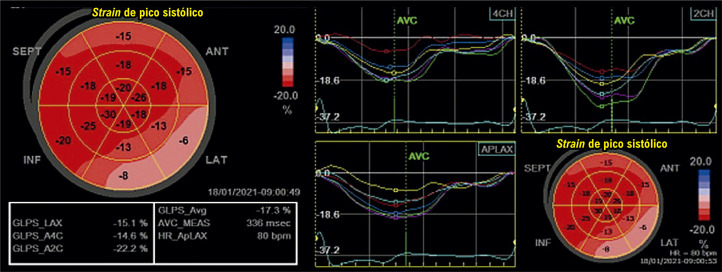
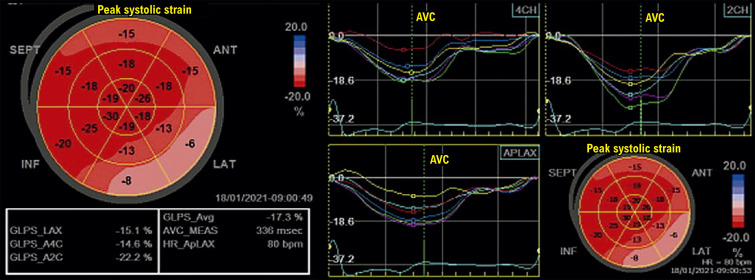
O SLGVE encontra-se consistentemente alterado em pacientes com AC e está diretamente relacionado ao grau de infiltração amiloide, quantificado na ressonância magnética (RM) pelo grau de realce tardio por gadolíneo (LGE) e pelo volume extracelular (VEC) calculado em imagens de sequência T1.30 Um padrão de alteração regional dos valores de strain longitudinal (SL), com preservação relativa dos valores de deformação longitudinal dos segmentos apicais (RELAPS) foi descrita na literatura, definindo um gradiente basal-apical característico, conhecido como apical sparing ou cherry on top (Figura 8.1).
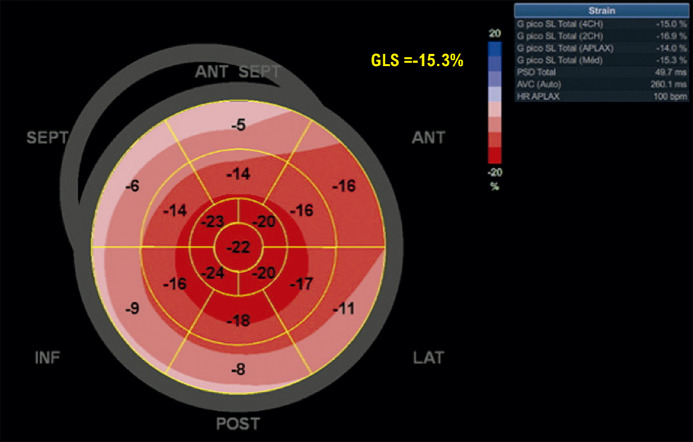
Figura 8.1. – Strain 2D longitudinal do ventrículo esquerdo em paciente com amiloidose cardíaca ATTR, demonstrando padrão de preservação relativa apical ou apical sparing, com maior acometimento da deformação segmentar em segmentos médios e basais, com maior deformação nos segmentos apicais.
Na publicação original de Phelan et al., o RELAPS foi calculado a partir da seguinte equação: média do SL apical/(média do SL dos segmentos médios + média do SL dos segmentos basais), com valores > 1,0 apresentando boa acurácia para o diagnóstico de AC, com boa diferenciação de hipertrofias ventriculares causadas por EA e pela CMPH (ASC: 0,94).20
Esse padrão regional do SL, com gradiente basal-apical, é encontrado indistintamente nos tipos de amiloidose AL e ATTR. É importante enfatizar que o padrão clássico de apical sparing, embora descrito como característico para AC, pode estar ausente, conforme exemplificado no estudo de Ternacle et al., em que 52% dos pacientes com diagnóstico de AC tinham RELAPS “não diagnóstico” (< 1,0).198 Isso pode ser explicado, em alguns casos, pelo baixo grau de infiltração amiloide do miocárdio, em estágios bastante precoces da doença. Valores de SL regional septal apical/septal basal > 2,1 (SAB), quanto associados a tempo de desaceleração do influxo mitral < 200 ms, também demonstraram boa acurácia para a diferenciação de AC de outras doenças com fenótipo de hipertrofia parietal do VE, como doença de Fabry, ataxia de Friedreich, e hipertrofia do VE relacionada à hipertensão arterial sistêmica (HAS).199
A relação da FE do VE/SLG > 4,1 também foi demonstrada como um bom parâmetro para diferenciar AC de CMPH, com performance superior ao RELAPS ou SAB, independentemente do tipo de AC.200
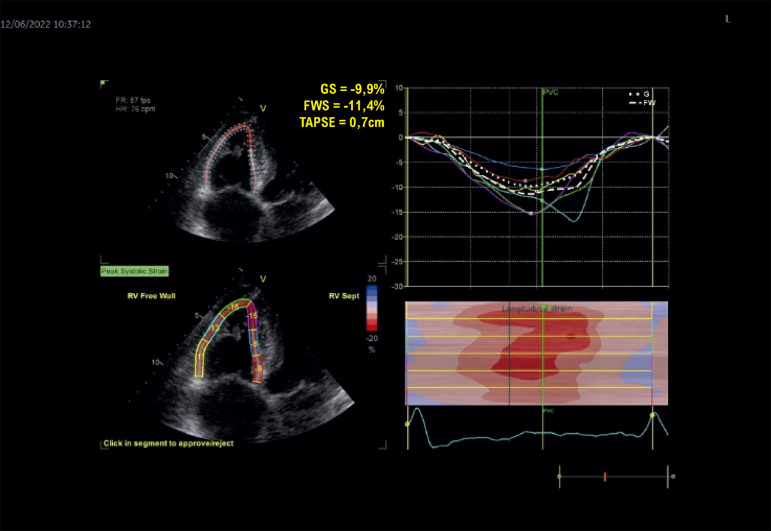
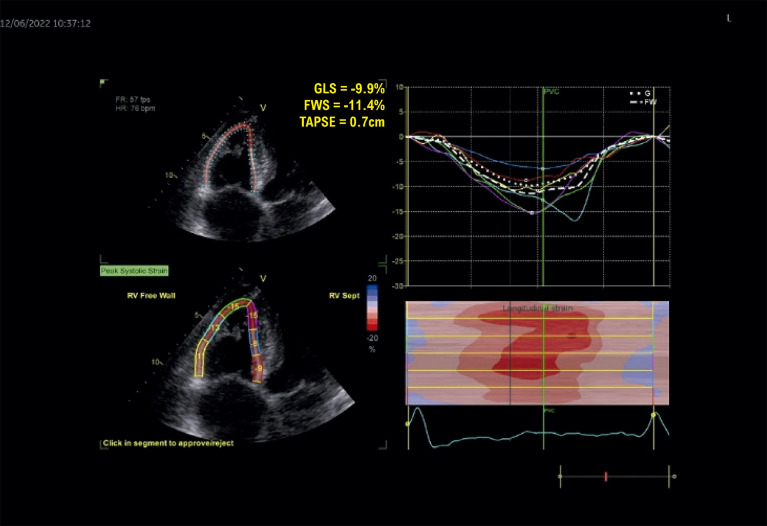
A deformação miocárdica do VD está geralmente reduzida em pacientes com AC, e seu achado pode ajudar a diferenciar de outras causas de hipertrofias parietais (Figura 8.2), tendo sido descrito também um padrão de preservação relativa apical, similar ao que é descrito no VE.201 Bellavia et al. demonstraram que alterações do VD podem ocorrer precocemente em pacientes com AC do tipo AL, mesmo em casos em que as espessuras parietais do VE ainda são normais.202
Figura 8.2. – Strain 2D longitudinal do ventrículo direito em paciente com amiloidose cardíaca ATTR, demonstrando redução do valor absoluto global (SLGVD = 9,9%) e redução absoluta do strain médio de parede livre (11,4%), com maior acometimento da deformação segmentar em segmentos médios e basais, com maior deformação nos segmentos apicais.
Na AC, assim como observado em outras CMPs infiltrativas, pode haver acometimento significativo de outros componentes da deformação miocárdica, como o strain circunferencial,203 strain radial,204 twist e torção (Figura 8.3). Em pacientes com amiloidose sistêmica em estágios iniciais de doença, sem evidência de AC, o twist e untwist podem estar aumentados de forma compensatória,205 sendo a deterioração desses parâmetros progressiva com o evoluir da doença,206 podendo levar, em casos avançados, à rotação da base e ápice cardíacos na mesma direção, criando um padrão chamado de rigid body rotation, com perda completa de importante contribuição da torção cardíaca à mecânica ventricular.
Figura 8.3. – Amiloidose ATTR. Strain 2D radial do ventrículo esquerdo (VE) na porção basal, demonstrando importante redução dos valores absolutos em todos os segmentos (A). Há também alteração do strain circunferencial, resultando em significativa redução do twist (4o) e torção do VE (B).
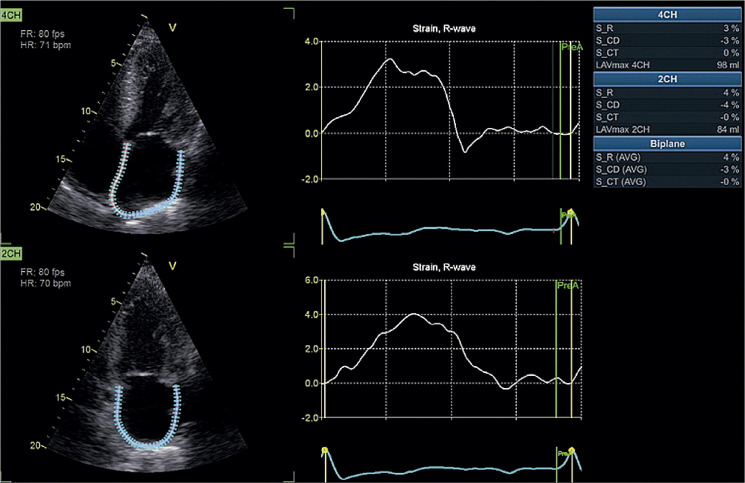
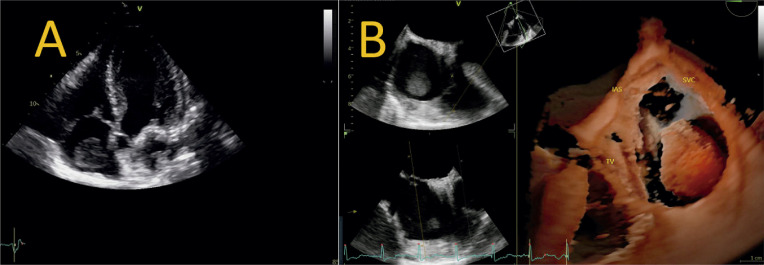
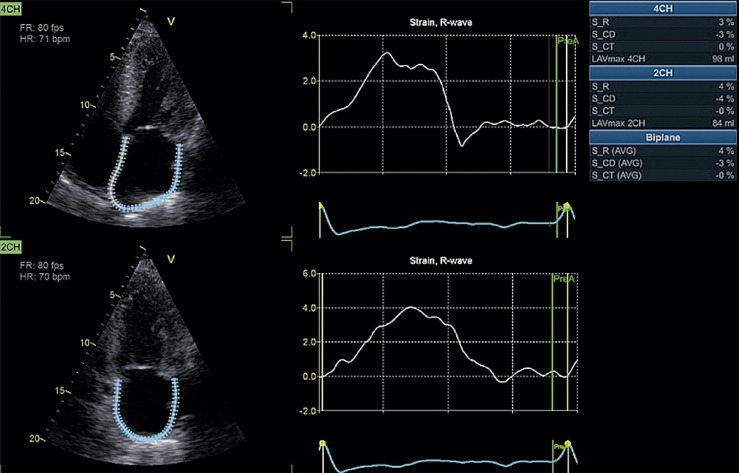
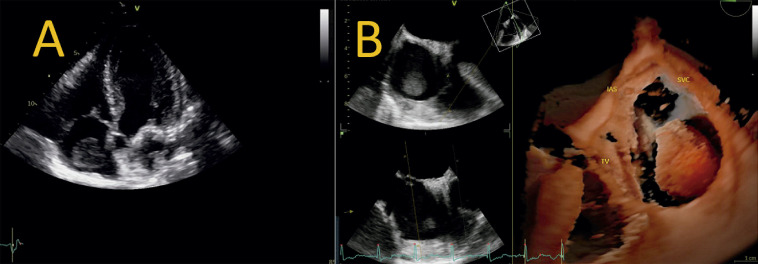
O strain do AE também se encontra frequentemente alterado de forma significativa nos pacientes com AC, em parte como resultado da própria DD do VE, mas também de forma importante pelo efeito da infiltração direta da parede atrial por fibrilas amiloides (Figura 8.4). Em um estudo recente de Aimo et al., apenas o SL atrial de pico (LA-PALS) apresentou uma associação independente com o diagnóstico de AC, além das variáveis ecocardiográficas clássicas e dos biomarcadores cardíacos.207 Foi também reconhecido que a miopatia infiltrativa atrial avançada poderia causar grave disfunção e perda da eficiência mecânica da cavidade, levando a uma situação de “dissociação eletromecânica” atrial (DEMA).208 Em uma grande coorte de pacientes, Bandera et al. demonstraram a presença de DEMA (determinados pela análise do SL) em 22,1% dos pacientes em ritmo sinusal, que era fator determinante de mau prognóstico, quando comparado com a evolução de pacientes em ritmo sinusal e função mecânica atrial preservada.209 Em uma série de 156 pacientes com AC da Mayo Clinic, trombos intracardíacos foram detectados pelo ecocardiograma transesofágico em 27%,210 dados reproduzidos por outros estudos, com ocorrência de trombos inclusive em pacientes em ritmo sinusal211,212(Figura 8.5).
Figura 8.4. – Amiloidose AL. Strain bidimensional do átrio esquerdo (AE), com análise das janelas apical 4 câmaras e apical 2 câmaras demonstrando importante redução do valor do strain de AE biplanar (strain reservatório = 4%).
Figura 8.5. – Amiloidose ATTR. Na janela apical ao bidimensional (A), podemos observar a presença de grande massa móvel no interior do átrio direito em paciente com ritmo sinusal. Ao ecocardiograma transesofágico tridimensional (B), em imagem renderizada, observa-se a grande massa aderida ao apêndice atrial direito, correspondendo a trombo. IAS: septo interatrial; SVC: veia cava superior; TV: valva tricúspide.
O strain 3D pode ser útil em demonstrar alteração de todos os componentes da deformação miocárdica em pacientes com AC. Vitarelli et al. demonstraram que a rotação basal de pico do VE, SL basal do VD e SL basal do VE foram capazes de distinguir com grande acurácia pacientes com AC de pacientes portadores de outras hipertrofias ventriculares.213 Em estudo de Baccouche et al.214 usando SL derivado da ECO3D, foi possível demonstrar o mesmo padrão de apical sparing, com gradiente basal-apical característico.
O trabalho miocárdico (TM), do inglês myocardial work (MW), também foi avaliado em pacientes com AC. Clemmensen et al. demonstraram que pacientes com AC tiveram menor índice de TM do VE (left ventricular myocardial work index, LVMWI) que o grupo-controle, com alterações mais pronunciadas nos segmentos basais e, quando submetidos a ecocardiograma de estresse, o aumento de LVMWI do repouso ao pico do exercício foi de 1.974 mmHg% em pacientes do grupo-controle (IC95% 1.699–2.250 mmHg%; p < 0,0001) comparado com apenas 496 mmHg% em pacientes com AC (IC95% 156–835 mmHg%; p < 0,01).215
O uso de strain para a avaliação evolutiva e para monitorar a resposta de pacientes em uso de tratamentos específicos para AC é bastante promissor. Giblin et al. avaliaram retrospectivamente 45 pacientes com AC ATTR em seguimento de 1 ano, comparando os valores de SL e MW entre os grupos de pacientes tratados e não tratados com Tafamidis.216 No grupo de pacientes não tratados, foi encontrada uma maior deterioração de SLG (p = 0,02), LVMWI e eficiência de TM (p = 0,04), sem diferenças significativas entre os grupos considerando os valores de strain circunferencial, strain radial, twist ou torção.
Os parâmetros de deformação miocárdica também foram bastante estudados como índices prognósticos na AC pela sua capacidade em fornecer dados quantitativos e pela sua alta sensibilidade e reprodutibilidade. Em estudo de Ternacle et al., foram preditores independentes de eventos cardiovascular maiores em um seguimento médio de 11 meses: SL apical médio (ponto de corte: -14,5%), NT-pro-BNP elevado e classe funcional NYHA III ou IV.198 Em outro estudo, o índice RELAPS se associou de forma independente com o desfecho composto de morte ou transplante cardíaco em 5 anos (hazard ratio 2,45; p = 0,003), mantendo o valor preditivo desse desfecho primário mesmo na análise multivariada (p = 0,018).217
Em um grande estudo publicado por Buss et al. incluindo 206 pacientes com AC AL, foi demonstrado que o SL baseado no Doppler e o SLG tiveram forte associação com os níveis de NT-proBNP e com a sobrevida (melhor ponto de corte: -11,78%), sendo que, na análise multivariada, apenas a DD e o SLG permaneceram como preditores independentes de sobrevida.218
Em trabalho recente, Liu et al. incluíram 40 pacientes portadores de mieloma múltiplo com FE preservada antes do início de tratamento com bortezomibe, medindo SLG e parâmetros de TM na linha de base.219 Os autores observaram que eficiência de TM global (global MW efficiency, GMWE) tinha associação significativa com eventos adversos cardíacos após 6 meses de quimioterapia, com ASC = 0,896 (IC95% 0,758–0,970; p < 0,05). O SL do VD também foi associado a prognóstico em pacientes com AC. Huntjens et al., estudando 136 pacientes com AC, demonstraram que valores de strain de todas as cavidades tinham associação significativa com sobrevida em um seguimento médio de 5 anos.220 O SL de pico do AE e o strain médio de parede livre do VD mantiveram associação independente com prognóstico na análise multivariada. Como variável independente, o strain de pico do AE teve a associação mais robusta com a sobrevida (p < 0,001), e combinando strain do AE com SLG e strain médio de parede livre do VD, foi obtida a maior capacidade de predição prognóstica (p < 0,001).
8.2. Doença de Fabry
A doença de Anderson-Fabry é a doença de depósito glicogênico mais comum, acometendo 1 a cada 50.000 indivíduos.221 É uma doença recessiva ligada ao X, portanto, afeta comumente mais indivíduos masculinos, sendo as mulheres carreadoras da mutação, e caracteriza-se pela ausência da atividade da alfa-galactosidade. Com isso, ocorre um acúmulo progressivo de globotriaosilceramida nos rins, coração e nervos. Clinicamente, os pacientes manifestam-se com alterações cutâneas (angioqueratomas), neuropatia periférica, insuficiência renal e IC decorrente de uma CMP restritiva com aumento da espessura miocárdica. Essas manifestações clínicas podem ocorrer na infância, porém, é mais comum que surjam após a terceira década de vida.222
A análise morfológica do acometimento ventricular apresenta a característica de aumento da espessura do VE, podendo evoluir para uma redução de sua complacência e IC com FE preservada por uma CMP restritiva. Outros achados interessantes que podem somar como red flags são a presença de hipertrofia do músculo papilar, sinal do duplo contorno do endocárdio e obstrução dinâmica na via de saída do VE.223 Esse fenótipo semelhante da CMPH é descrito em 6% dos homens224 e em 12% das mulheres, com o diagnóstico na faixa etária mais tardia.225 Por outro lado, a análise paramétrica disposta pelo bull’s eye da deformação longitudinal do VE tem um papel relevante na diferenciação das CMPs que cursam com aumento da espessura miocárdica, principalmente quando há um fenótipo assimétrico da hipertrofia ventricular esquerda (HVE), em que há a possibilidade etiológica de uma CMPH, amiloidose (principalmente por transtirretina), doença de Fabry e cardiopatia hipertensiva no idoso.
Caracteristicamente, a CMPH apresenta os valores segmentares mais reduzidos nas porções em que ocorre maior espessura; a CMP amiloidótica ocorre um padrão de poupar o ápice e acometer mais as regiões médio-basais do VE, a cardiopatia hipertensiva pode se apresentar com discreta redução SLG. Porém, curiosamente, a doença de Fabry, apresenta um padrão singular em que, apesar do aumento assimétrico da espessura ventricular, a região mais acometida pela deformação longitudinal é a porção basal da parede ínfero-lateral (Figura 8.6), e ocorre um padrão decremental progressivo à medida que a doença evolui sem tratamento. Existe uma boa correlação entre o acometimento descrito pela análise de deformação longitudinal do VE e o realce tardio pela RM nas diferentes fases da doença.222 Além desse papel discriminatório, um estudo avaliou doentes com Fabry sem alterações morfológicas com um grupo-controle saudável. Nesse estudo, foi analisado o strain longitudinal do VE, VD e do AE com diferença entre os grupos (18,1 ± 4,0, 21,4 ± 4,9 e 29,7 ± 9,9 vs. 21,6 ± 2,2, 25,2 ± 4,0 e 44,8 ± 11,1%, p < 0,001). Interessantemente, além dessa diferença entre os grupos, as alterações da deformação apresentaram boa correlação com a gravidade dos sintomas.226
Figura 8.6. – Strain global longitudinal, em paciente com doença de Fabry, mostrando, no bull’s eye, os valores mais reduzidos nas porções basais da parede ínfero-lateral do ventrículo esquerdo.
O tratamento já é disponibilizado, e é possível apresentar mudanças morfológicas do coração a partir de um ano de tratamento, como a redução de sua espessura.227,228 Sendo assim, é esperado que ocorra uma melhora da deformação longitudinal do VE mais precocemente, mesmo antes da redução da massa ventricular. Porém, a literatura ainda carece de publicações sobre a resposta terapêutica e o padrão do SLG ao longo do tratamento.
A análise da deformação miocárdica é uma importante ferramenta no diagnóstico das hipertrofias ventriculares sem etiologia, principalmente dentro de um contexto clínico coerente e com boa janela ecocardiográfica, acompanhamento dos familiares que não tiveram acesso ao estudo genético e avaliação de resposta terapêutica (Figura 8.6).
9. Strain na Hipertensão Arterial Sistêmica
9.1. Introdução
Nesta sessão, serão discutidas as principais vantagens e desvantagens do uso do strain em casos de HAS, com e sem critérios para CMP hipertensiva (presença ou não de HVE), e o seu valor clínico atual.
9.2. Hipertensão Arterial Sistêmica sem Critérios para Hipertrofia Ventricular Esquerda
A HAS provoca, ao longo de sua evolução clínica, alterações da contratilidade miocárdica comprovada com a redução do strain longitudinal em resposta à pós-carga e ao estresse sistólico de parede elevados, com significado prognóstico comprovado. A queda do SLG traduz a disfunção miocárdica subclínica antes mesmo do surgimento da HVE e queda de FE detectada pela medida tradicional, sendo essa medida do strain a única a se alterar em HAS estágio A do desenvolvimento de IC.229-239A redução do SLG acontece, inicialmente, na região basal do septo interventricular (SIV), estendendo-se para as regiões basal e média de outras paredes, e isso se deve à provável maior sobrecarga do SIV ao estresse sistólico de parede nos estágios iniciais da síndrome hipertensiva.240,241 (Figura 9.1) As fibras longitudinais da camada subendocárdica estão precocemente acometidas nessa fase inicial juntamente com o mesocárdio, ao contrário do epicárdio, como demonstrado em alguns estudos.242
Figura 9.1. – Exemplos de mapa polar do strain longitudinal global (SLG) com as curvas do strain de pico sistólico obtidas em 4C, 2C e 3C. (A) Paciente saudável não hipertenso com SLG preservado; (B) Paciente hipertenso sem hipertrofia ventricular esquerda (HVE) com SLG no limite inferior da normalidade com alteração regional da deformação miocárdica em septo basal; (C) Paciente hipertenso com HVE com SLG reduzido e com maior alteração da deformação miocárdica nos segmentos basais e médios do que nos apicais.
Entretanto, a alteração do strain longitudinal da camada epicárdica foi a única variável preditora de eventos CVs em outra publicação, indicando que seu acometimento pode corresponder à lesão mais severa e crônica.243 Todavia, na grande maioria dos equipamentos disponíveis atualmente a análise por camadas do miocárdio não é possível. Por outro lado, os strains radial e circunferencial, que usam toda a espessura miocárdica em sua análise, têm uma tendência a permanecerem inalterados ou até mesmo aumentados como uma provável tentativa de compensação mecânica à redução do SLG60,236 e, quando o componente circunferencial se altera, pode traduzir disfunção miocárdica mais severa.244
As principais explicações para a redução do SLG estão associadas a um aumento da síntese de colágeno, culminando com a fibrose, marcador contundente de disfunção miocárdica. O SLG reduzido se correlaciona não somente com marcadores plasmáticos de fibrose, como a elevação do inibidor tecidual de metaloproteinase, mas também com a fibrose detectada com realce tardio pelo gadolíneo em estudos de RM em pacientes hipertensos.231,234,238,239 Reduções do SLG foram também observadas em pacientes com hipertensão dos tipos mascarada e “jaleco branco”245,246, com correlação dessas quedas com marcadores ecocardiográficos convencionais de DD240, além de maior deterioração a longo prazo em indivíduos que interromperam tratamento anti-hipertensivo.247
9.3. Hipertensão Arterial Sistêmica com Critérios para Hipertrofia Ventricular Esquerda
As consequências miocárdicas da doença hipertensiva crônica incluem a hipertrofia de miócitos, além de fibrose miocárdica e espessamento medial das artérias coronárias intramiocárdicas.248 Consequentemente, a HAS e as modificações do remodelamento miocárdico são fatores de risco para o desenvolvimento de eventos cardíacos maiores, tais como o risco de desenvolvimento de IC e morte prematura. Assim o uso do strain nesses casos tem o objetivo principal de detectar alterações sutis da função sistólica, antes mesmo do comprometimento da FE obtida de forma convencional, selecionando casos de ICFEP para a adoção de tratamento adequado.
Os tipos de remodelamento do VE podem apresentar alterações dos vários tipos de strain. Assim, na hipertrofia concêntrica, é possível encontrar valores reduzidos do SLG com queda progressiva de acordo com a evolução dos tipos geométricos, desde o remodelamento concêntrico até a hipertrofia excêntrica com dilatação do VE.249-251 O strain global circunferencial e o strain global radial encontram-se com valores preservados na maioria dos estudos252 ou até mesmo reduzidos em algumas séries249 e tendem a permanecer normais nas camadas epicárdicas em indivíduos com HAS e HVE.250 O comportamento da torção e do twisting também pode ser variável, com valores normais ou reduzidos de acordo com o tipo de geometria ventricular.249,253 Quando se considera o uso da técnica tridimensional do strain, o SLG 3D tende a se deteriorar de acordo com o grau de hipertrofia e diâmetro da cavidade do VE na HAS.62,250
Além da correlação do SLG reduzido com os diferentes padrões de HVE, o strain pode ser usado para auxiliar no esclarecimento da causa da hipertrofia e é frequentemente mais reduzido em casos de CMPH quando comparado com HVE por HAS.254
9.4. Tratamento Clínico
O SLG apresenta queda paralela com a piora da classe funcional241 e melhora com o tratamento a longo prazo, como demonstrado em uma análise de seguimento de 3 anos após tratamento anti-hipertensivo255 e em casos de tratamento anti-hipertensivo no ambiente de atendimento em emergência.256 O SLG reduzido também se correlacionou com a MAPA anormal em pacientes em tratamento, mesmo após ajuste de outras variáveis clínicas como idade, presença de diabetes melito e índice de massa do VE.257
9.5. Conclusão
Existem evidências suficientes para recomendar o uso do strain em pacientes com HAS, independentemente da presença de HVE, tanto para a identificação precoce das alterações estruturais subclínicas, como para os quadros de ICFEP visando a adoção de tratamento otimizado. Por outro lado, há a necessidade de estudos mais robustos para nortear o uso sistemático do strain nessa população.
10. Strain em Atletas
A atividade física regular e intensa é responsável por uma série de profundas alterações elétricas, estruturais e funcionais adaptativas, usualmente referidas como “coração de atleta”.258 A análise dessa condição é importante para uma melhor compreensão dos mecanismos de adequação cardíaca e melhoria da performance e do rendimento, orientando o treinamento otimizado. Além disso, permite a diferenciação de patologias que podem ter características morfológicas semelhantes àquelas induzidas pelo treinamento.
Atletas de alto rendimento e que apresentam grandes volumes do VE parecem pertencer ao espectro da fisiologia saudável típica do “coração de atleta”. Alguns trabalhos demonstram que o SLG se encontra discretamente reduzido nos atletas em repouso, quando comparado com sedentários; em outros, essa medida mostra-se superior aos controles.259,260 Entretanto, na maioria dos estudos, não foi identificada diferença significativa.261 Essa variação pode estar relacionada ao impacto de diferentes fatores como pré- e pós-carga, massa miocárdica e bradicardia sinusal. Por esse motivo, a presença de valores reduzidos de SLG em atletas com função diastólica do VE normal ou supranormal pode ser determinante para a distinção entre as adaptações secundárias aos exercícios e às patologias cardíacas. Valores absolutos iguais ou superiores a 18% são considerados ainda dentro da normalidade. A redução desses índices é muito mais acentuada em portadores de CMPH e HAS.262 No entanto, o strain circunferencial global e o strain radial não demonstraram alterações significativas em relação ao grupo-controle.261 A representação paramétrica em bull’s-eye pode fornecer subsídios para diferenciar o coração do atleta de outras doenças que cursam com hipertrofias.263
Quando os atletas são categorizados de acordo com o tipo e intensidade dos exercícios praticados em estático e dinâmico, surgem diferenças predominantemente em aspectos mecânicos do VE. Um estudo recente mostrou que a torção cardíaca foi maior em atletas com dinâmica baixa, estática alta (levantamento de peso, artes marciais), estática baixa e dinâmica alta (maratona, futebol) em relação aos controles. Contrariamente, a torção foi menor em atletas com dinâmica alta, estática moderada (natação, polo aquático), o que pode ser explicado por alterações na rotação apical, mas não na basal. O pico de untwisting foi maior em atletas com predominância de exercícios com componentes dinâmico baixo e estático alto, enquanto picos menores foram encontrados em atletas praticantes de esportes com componentes dinâmico alto e estático alto.261 Estudos utilizando o speckle tacking para quantificar a deformação miocárdica têm mostrado que atletas competitivos de resistência (endurance) apresentam valores normais ou aumentados do strain.264-268
Em relação ao VD, os índices de deformação miocárdica, obtidos tanto pelo Doppler tecidual quanto pelo speckle tracking, podem estar discretamente reduzidos nos segmentos basal e médio da parede livre do VD, notadamente em atletas de resistência em comparação aos controles.269 Ainda é controverso se tal redução da deformação miocárdica do VD é apenas uma resposta adaptativa ao exercício ou se é uma alteração subclínica por lesão miocárdica.270 Alguns autores supõem que tal achado pode ser explicado pelas mudanças na curvatura entre o ápice e base do VD, resultando nessa diferença do strain entre os segmentos.
Ainda são iniciais os estudos da função atrial em atletas com a técnica do speckle tracking e apresentam resultados conflitantes. Um estudo mostrou que a contração atrial avaliada pelo SLG do AE diminuiu significativamente após treino.271 Outro estudo não mostrou diferenças no strain atrial entre atletas e sedentários.272
A medida do strain também se faz importante na avaliação da função diastólica. O exercício dinâmico leva a um relaxamento ventricular mais efetivo, além da dilatação biventricular, entretanto, o exercício estático pode estar relacionado ao de aumento da espessura miocárdica e hipertrofia concêntrica do VE, podendo levar a algum grau de comprometimento da função diastólica.273 Além disso, o uso de drogas ilícitas para o aumento da performance pode levar à deterioração da função ventricular, sistólica ou diastólica; a ecocardiografia com speckle tracking pode detectar precocemente essas alterações.274
Por isso, é fundamental que, na avaliação da função ventricular dos atletas profissionais e/ou amadores, utilizemos todas as ferramentas disponíveis no arsenal da ecocardiografia. O strain é capaz de detectar alterações incipientes da função sistólica muito antes que ocorra qualquer alteração da contratilidade ao estudo bidimensional ou diminuição da FE.
A ecocardiografia com speckle tracking tem se mostrado bastante promissora para complementar a ecocardiografia bidimensional de rotina na avaliação de atletas. O SLG nessa população (diferentemente da população sedentária) pode ser considerado normal com valores absolutos superiores a 16%, valores inferiores devem levantar suspeita de patologia, principalmente se diante de outros sinais sugestivos como hipertrofia ou dilatação ventricular significativas.275
11. Strain na Ecocardiografia com Estresse
A Tabela 11.1 mostra as principais aplicações do strain na ecocardiografia com estresse.
Tabela 11.1. – Aplicações do strain na ecocardiografia com estresse.
| Cenário clínico | Conceito |
|---|---|
| Detecção de isquemia189,276-280 |
|
| Avaliação da viabilidade281-285 |
|
| Estenose aórtica286,287 |
|
| Miocardiopatia hipertensiva288 |
|
| Miocardiopatia diabética289,290 |
|
| Cardiomiopatias132,291-293 |
|
| Coração de atleta294,295 |
|
ATC: angioplastia transluminal coronária; CMPH: cardiomiopatia hipertrófica; CRM: cirurgia de revascularização miocárdica; ESD: ecocardiografia de estresse com dobutamina; FC: frequência cardíaca; IM: infarto do miocárdio; SC: strain circunferencial; SL: strain longitudinal; SR: strain radial, SLG: strain longitudinal global; SRL: strain regional longitudinal; VD: ventrículo direito.
Em breve, um artigo de revisão mais completo sobre ecocardiografia de estresse será publicado neste periódico.
12. Strain nas Cardiopatias Congênitas
Alguns estudos já demonstraram o elevado valor prognóstico do strain obtido pelo speckle tracking, reforçando sua utilidade tanto em patologias congênitas como adquiridas.9No entanto, o strain miocárdico está sujeito a variações fisiológicas causadas por idade, sexo, frequência cardíaca, pré-carga, pressão arterial e superfície corpórea, além do tipo de software utilizado para análise.296 Um esforço contínuo vem sendo realizado no sentido de estabelecer valores normais do strain que possam ser utilizados como referência universal em pediatria, para que a avaliação da deformação miocárdica seja adotada na rotina clínica.297-299
Apresentaremos, nas tabelas a seguir, os valores de strain miocárdico já apresentados na literatura, em crianças normais (Tabelas 12.1 a 12.3) e em algumas cardiopatias congênitas, com recomendações de valores de corte (Tabela 12.4).
Tabela 12.1. – Valores normais de strain de ventrículo esquerdo, segundo as faixas etárias298.
| Idade em anos | Strain global de pico sistólico longitudinal | Strain de pico sistólico longitudinal corte apical 4 câmaras | Strain global de pico sistólico circunferencial | Strain de pico sistólico circunferencial ao nível dos músculos papilares | Strain global de pico sistólico radial | Strain de pico sistólico radial ao nível dos músculos papilares |
|---|---|---|---|---|---|---|
| 0-1 | 18,7% (20,8; 16,7) | 19,4% (22,2; 16,6) | _____ | 18,2% (22,6; 13,7) | _____ | 44,4% (36,6; 52,1) |
| 2-9 | 21,7% (23,0; 20,5) | 21,0% (21,8; 20,2) | 24,5% (27,2; 21,7) | 20,3% (21,4; 19,1) | 48,0% (33,3; 62,8) | 50,8% (47,4; 54,1) |
| 10-13 | 20% (20,8; 19,1) | 20,5% (21,7; 19,2) | 21,9% (26,5; 17,4) | 21,5% (23,1; 19,8) | 43,7% (33,0; 54,5) | 52,1% (48,5; 55,8) |
| 14-21 | 19,9 (20,6; 19,2) | 19,9% (21,2; 18,6) | 16,4% (23,3; 9,6) | 16,4% (23,3; 9,6) | 44,0% (41,6; 46,4) | 46,4% (39,7; 53,1) |
| Geral | 20,2% (20,8; 19,6) | 20,4% (21,1; 19,8) | 22,3% (19,9; 24,6) | 20,4% (21,1; 19,8) | 45,2% (38,8; 51,7) | 49,4% (47,2; 51,6) |
Valores expressos como média e intervalo de confiança de 95%.
Tabela 12.2. – Valores normais de strain de ventrículo direito, segundo as faixas etárias300.
| 31 dias a 24 meses | 2 a 5 anos | 5 a 11 anos | 11 a 18 anos | |
|---|---|---|---|---|
| SLG VD % | 25,4 ± 3,9 | 25,9 ± 4,0 | 25,8 ± 4,7 | 25,4 ± 4,1 |
SLG: strain longitudinal global; VD: ventrículo direito. Valores expressos como média ± desvio padrão.
Tabela 12.3. – Valores normais de strain atrial direito e esquerdo, segundo as faixas etária301.
| Medida | 31 dias a 24 meses | 2 a 5 anos | 5 a 11 anos | 11 a 18 anos |
|---|---|---|---|---|
| Strain AE (R) % | 52,8 ± 10,1 | 55,7 ± 10,7 | 58,1 ± 10 | 57,6 ± 10,5 |
| Strain AE (C) % | 14,2 ± 6,6 | 12,7 ± 6,1 | 14,0 ± 6,7 | 15,1 ± 7,0 |
| Strain AD (R) % | 47,1 ± 9,6 | 49,6 ± 10,2 | 51,6 ± 10,7 | 52,0 ± 10,6 |
| Strain AD (C) % | 11,5 ± 6,0 | 11,9 ± 5,9 | 11,8 ± 6,3 | 12,8 ± 5,8 |
AD: átrio direito; AE: átrio esquerdo; C: fase de contração atrial; R: fase de reservatório. Valores expressos como média ± desvio padrão.
Tabela 12.4. – Exemplos de estudos que avaliam o uso do strain na hipertensão pulmonar idiopática e em cardiopatias congênitas.
| Autores | Parâmetro | Ponto de corte | Achado | S/E | |
|---|---|---|---|---|---|
| Hipertensão pulmonar idiopática | Muntean et al.302 | Strain segmento médio PL VD | 18,5% | Preditor de piora clínica |
|
| Anomalia de Ebstein | Kühn et al.303 | SLG VD (06 segmentos) | 20,15% | Diagnóstico de disfunção de VD (FE < 50% à RM) |
|
| VD sistêmico (PO TGA Senning/Mustard) | Lipczyńska et al.304 | SLG VD (06 segmentos) | 14,2% | Diagnóstico de disfunção de VD (FE < 45% à RM) |
|
| VD sistêmico (TCCGA) | Kowalik et al.305 | SLG VD (06 segmentos) | Diagnóstico de disfunção de VD (FE < 45% à RM) |
|
|
| PO OACE | Castaldi et al.306 | Strain segmentar de pico do VE | 14,8% | Preditor de fibrose à RM |
|
| Fisiologia Univentricular (PO Fontan) | Park et al.307 | Strain rate circunferencial | -1,0s-1 | Preditor de internação prolongada (>14 dias) após anastomose CPT |
|
ASC: área sob a curva; CPT: cavopulmonar total; E: especificidade; FE: fração de ejeção; OACE: origem anômala de artéria coronariana esquerda; PL: parede livre; PO: pós-operatório; RM: ressonância magnética; S: sensibilidade; SLG: strain longitudinal global; TCCGA: transposição corrigida das grandes artérias; TGA: transposição das grandes artérias; VD: ventrículo direito.
Em breve, um artigo de revisão mais completo sobre o tema será publicado neste periódico.
13. Strain do Ventrículo Direito
13.1. Introdução
O VD tem importante papel na fisiopatologia das doenças cardiopulmonares. Um grande número de evidências tem demonstrado que a disfunção do VD é um importante marcador independente de morbidade e mortalidade em várias situações clínicas como: IC, doenças valvares, HP, embolia pulmonar (EP), cardiopatia isquêmica e na presença de cardiopatia congênita nos adultos.308-313
A RMC é considerada o exame não invasivo padrão-ouro para a obtenção dos volumes, FE e avaliação estrutural do VD. Tem, porém, como principais limitações um custo elevado, maior tempo da aquisição das imagens e pouca disponibilidade na maioria dos centros.314 A ecocardiografia bidimensional (2D) é o exame inicial mais utilizado na avaliação estrutural e funcional do VD, por ser mais disponível, de menor custo, não invasiva e com menor tempo para aquisição das imagens. Essa avaliação do VD pela 2D, entretanto, é desafiadora, pela estrutura complexa da cavidade, pela posição desfavorável dentro da parede torácica, pela intensa trabeculação miocárdica, que impede a melhor visualização do endocárdio, por possuir paredes mais finas e pela alta dependência das condições de carga dos índices mais utilizados da função sistólica.315
Vários parâmetros ecocardiográficos indicadores da função sistólica do VD são utilizados na prática clínica. Recentemente, a ecocardiografia 2D com strain pelo speckle tracking foi introduzida no cenário clínico como um indicador objetivo de contratilidade miocárdica regional e global, inicialmente na avaliação do VE e, mais recentemente, do VD. Com a aplicação dessa nova metodologia, mais pesquisas e publicações têm chamado atenção das vantagens da sua utilização em relação aos outros parâmetros convencionais ecocardiográficos.316
13.2. Características Anatômicas e Funcionais do Ventrículo Direito
Na Tabela 13.1, podemos observar as principais características que diferenciam os ventrículos.317-319
Tabela 13.1. – Características anatômicas e funcionais dos ventrículos.
| Ventrículo direito | Ventrículo esquerdo | |
|---|---|---|
| Estrutura | Via de entrada, região trabeculada, infundíbulo. | Não tem infundíbulo, e a trabeculação é limitada. |
| Forma |
|
Elíptica |
| Orientação predominante das fibras miocárdicas |
|
|
| Disposição das fibras na parede livre | Predomínio transversalmente | Predomínio obliquamente |
| Disposição das fibras no SIV | Obliquamente com extensão para a via de saída | Obliquamente |
| Contribuição do espessamento do SIV no eixo transversal e encurtamento no eixo longitudinal na sístole | +++ | +++ |
| Padrão de contração | Principalmente longitudinal da base para o ápex |
|
| Massa (g/m2) | 26 ± 5 | 87 ± 12 |
| Espessura da parede (mm) | 2 a 5 | 7 a 11 |
SIV: septo interventricular.
As funções do VE e VD estão intimamente relacionadas, fenômeno chamado de interação ventricular sistólica, pois compartilham fibras musculares dispostas obliquamente no SIV. Elas têm vantagens mecânicas sobre as fibras transversais da parede livre do VD.36 A continuidade dessas fibras musculares permite que a parede livre do VD seja tracionada quando ocorre a contração do VE, sendo estimado que 20 a 40% do volume sistólico ejetado e da pressão sistólica do VD resultem da contração do VE.318,319
13.3. Ventrículo Direito e Parâmetros Ecocardiográficos na Avaliação da Função Sistólica
Na avaliação da função sistólica do VD, vários índices são utilizados rotineiramente como a mudança fracional da área (FAC), a excursão sistólica do anel tricúspide (TAPSE), a velocidade de pico sistólico do anel tricúspide e o índice de performance miocárdica. Cada um deles tem vantagens e limitações, variável exequibilidade e reprodutibilidade, com discutível eficácia diagnóstica e prognóstica.35,36 Acredita-se que, no momento, nenhum deles seja, isoladamente, um bom indicador da função sistólica do VD. Uma vez que o vetor da contração longitudinal é o mais importante, pela orientação das fibras musculares longitudinais predominantes do anel tricúspide ao ápex, dá-se preferência aos índices que exploram a movimentação no eixo longitudinal na avaliação da função longitudinal regional ou global do VD.92
A ecocardiografia 2DST é uma modalidade de imagem que avalia a deformação miocárdica, propriedade intrínseca do miocárdio, nas três direções (longitudinal, circunferencial e radial), sendo a longitudinal a mais utilizada por sua boa reprodutibilidade, relevante informação prognóstica, validação em estudo experimental75 e em estudos clínicos com RMC em várias doenças CV.320-323
Assim, o 2DST do VD tem se mostrado um bom marcador da função sistólica, com valor prognóstico em várias doenças CV.75,324-330
13.4. Aquisição e Limitações
O SLGVD pelo 2DST deve ser obtido através da janela apical 4 câmaras modificada, focada no VD, com o transdutor deslocado mais lateralmente e direcionado para o ombro direito, o que permite a melhor visibilização da parede livre e reprodutibilidade das medidas (Figura 13.1). É importante otimizar a orientação, a profundidade e o ganho e, com isso, maximizar o tamanho do VD e visualizar o seu ápice durante todo o ciclo cardíaco.36 Um outro cuidado na aquisição é não anteriorizar ou posteriorizar o transdutor, evitando, respectivamente, o aparecimento da valva aórtica ou do seio coronário, exibindo apenas o septo interatrial.331 Uma vez que a visualização adequada for obtida, recomenda-se ajustar o aparelho para gravar três ciclos cardíacos e adquirir imagens com uma resolução temporal de 50–80 quadros por segundo. Essa taxa de enquadramento pode ser obtida por ajustes indiretos, como por meio da profundidade da imagem e da abertura do feixe de ultrassom e resolução, como também por ajustes diretos permitidos pelo aparelho de ecocardiograma utilizado. Em alguns softwares, ainda se faz necessária a definição do início e do fim do tempo de ejeção do VD por meio do Doppler pulsado registrado na via de saída do VD.
Figura 13.1. – Protocolo de imagem para medir a deformação do ventrículo direito (VD) por meio da ecocardiografia speckle tracking na projeção apical 4 câmaras. A) Janela apical 4 câmaras (forma de aquisição inadequada); B) Janela apical 4 câmaras focada no VD (forma de aquisição adequada). VD4CDL: strain global longitudinal do ventrículo direito; VDPLDL: strain de parede livre do ventrículo direito.
A ROI é definida pela borda endocárdica incluindo a parede livre do VD e SIV, com o cuidado de não incluir o pericárdio e ajustar a largura da ROI para não ficar muito estreita, pois isso pode levar a resultados errôneos. Atenção deve ser dada no posicionamento dos pontos de referência basais, pois se estiver abaixo do ideal, ou seja, no lado atrial do anel tricuspídeo, pode resultar em valores reduzidos da deformação longitudinal.332
A ROI pode ser traçada manualmente pelo usuário ou gerada automaticamente. Se for gerada automaticamente, o usuário deve ter permissão para verificar e, eventualmente, editá-la de modo manual.92 Depois de verificar a qualidade do rastreamento e sua aprovação final pelo operador, os valores de deformação regional serão exibidos. Pelas recomendações atuais, o valor utilizado deve ser o maior valor modular alcançado durante a sístole (strain de pico sistólico), sendo o traçado do Doppler da valva pulmonar utilizado para determinar o final da diástole e da sístole.92 Sempre que possível, deve-se utilizar um software apropriado, já que o algoritmo de detecção automática dos segmentos do VD reduz a necessidade de intervenções por parte do operador, contribuindo, assim, para uma melhor reprodutibilidade dos resultados.
A segmentação da parede livre do VD entre o ápice e a base inclui três segmentos (segmentos basal, médio e apical). O SIV é segmentado de maneira semelhante. O strain longitudinal da parede livre do VD (SL-PLVD) é a média dos valores de deformação dos seus três segmentos, enquanto o SLGVD é a média dos valores do strain dos segmentos de sua parede livre e do SIV. O SL-PLVD é o mais utilizado na prática e na pesquisa clínica, uma vez que o SLGVD sofre interferência da função ventricular esquerda pelo SIV, obtendo, assim, valores absolutos relativamente mais baixos.333 Para fins de padronização, deve-se relatar como parâmetro padrão o SL-PLVD, sendo opcional o cálculo do SLGVD.92
Como limitações, além de janelas acústicas inadequadas, estudos experimentais e modelos matemáticos mostraram que a magnitude da deformação miocárdica é influenciada pela frequência cardíaca, além da pré- e pós-carga. Com função sistólica preservada, estudos confirmaram que o strain pode aumentar com o aumento da pré-carga e da frequência cardíaca e pode reduzir com o efeito contrário dessas variáveis.16,334
13.5. Indicações/Valores de Normalidade
A disfunção sistólica do VD é bem estabelecida como um fator de prognóstico ruim em várias doenças CV, e o SLGVD é um marcador prognóstico independente nos pacientes com HP, IC, cardiopatia isquêmica e outras CMPs, assim como tem melhor correlação com a FE do VD pela RMC em comparação aos parâmetros tradicionais.35,320-23,334-336
Nos pacientes com HP, o SLGVD está diminuído, mostrando uma boa correlação com os parâmetros hemodinâmicos invasivos da performance do VD.337 Além disso, foi demonstrado que o SLGVD é preditor independente de mortalidade por todas as causas e eventos relacionados à HP. Com o objetivo de avaliar o valor prognóstico do SLGVD nesses pacientes, uma metanálise recente mostrou que sua redução relativa de 19% está associada a um maior risco de eventos relacionados à HP, enquanto a redução relativa de 22% do SLGVD está associada a um maior risco de morte por todas as causas.324 A Figura 13.2 mostra um exemplo de strain de VD em um paciente com HP primária de longa data.
Figura 13.2. – Exemplo de strain de ventrículo direito em paciente com hipertensão pulmonar primária de longa data. Software Tomtec. VD4CDL: strain global longitudinal do ventrículo direito; VDPLDL: strain de parede livre do ventrículo direito.
Em pacientes com IC, o SLGVD tem elevada sensibilidade e acurácia no diagnóstico da disfunção sistólica dessa câmara cardíaca.338 Uma publicação recente evidenciou que valores absolutos < 14,8% estão associados a eventos adversos como morte, transplante cardíaco e hospitalização, independentemente da FEVE e DD do VE.19 Além disso, o SLGVD e o SL-PLVD foram capazes de detectar anormalidades sutis da função sistólica do VD em pacientes com IC e FEVE reduzida e em menor grau nos com IC e FEVE preservada.329 Quanto aos pacientes elegíveis para o implante de dispositivo de assistência ventricular esquerda, o SLGVD é uma ferramenta útil na estratificação de risco de falência do VD. Com uma sensibilidade de 68% e uma especificidade de 76%, o valor absoluto de SLGVD < 9,6% foi capaz de identificar os pacientes que evoluíram com falência do VD pós-procedimento, definida como necessidade de dispositivo de assistência ventricular direita ou uso de inotrópicos por mais de 14 dias.339 Já em transplantados cardíacos, a combinação das medidas do SLGVE e o SL-PLVD pode ser útil para excluir rejeição celular aguda e reduzir o número de biópsias de rotina.340 As Figuras 13.3 e 13.4 mostram exemplos de strain de VD em paciente com dispositivo de assistência ventricular e em paciente transplantado cardíaco, respectivamente.
Figura 13.3. – Exemplo de strain de ventrículo direito em paciente em uso de dispositivo de assistência ventricular. Software Echopac GE. SLG: strain de parede livre do ventrículo direito.
Figura 13.4. – Exemplo de strain de ventrículo direito em paciente transplantado cardíaco. Software Tomtec. RV4CDL: strain global longitudinal do ventrículo direito; RVFWSL: strain de parede livre do ventrículo direito.
No IAM, o SLGVD é o parâmetro ecocardiográfico que tem melhor correlação com a fração de ejeção do ventrículo direito (FEVD) obtida pela RMC.341 Somado a isso, esse parâmetro demonstrou ser preditor independente de morte, reinfarto e hospitalização por IC, confirmando seu papel fundamental na avaliação dessa população.342A avaliação de pacientes com displasia arritmogênica do VD é discutida em outra sessão.
Recentemente, o papel da disfunção sistólica do VD tem sido investigado em outras CMPs. Na CMPH, foram descritos valores de SLGVD reduzidos em relação a um grupo-controle saudável,343 e também diferenciou pacientes com CMPH e hipertrofia secundária à hipertensão, com alta sensibilidade e especificidade.344
A estenose mitral é a doença valvar cardíaca que mais acomete o VD, com alteração frequente dos parâmetros convencionais da sua avaliação. O SLGVD demonstra um padrão de alteração segmentar, com valores significativamente menores no SIV e na parede livre basal do VD e valores normais na parede livre média e apical.345,346 Em pacientes com insuficiência tricúspide funcional importante, o SL-PLVD identificou, em maior proporção, os pacientes com disfunção do VD (84,9%) em comparação à FAC (48,5%) e à TAPSE (71,7%). Além disso, o SL-PLVD esteve associado de maneira independente com a mortalidade por todas as causas e teve um valor prognóstico incremental quando associado aos parâmetros tradicionais de avaliação do VD.328
Atualmente, falta um consenso em relação aos valores normais de strain do VD devido à escassez de estudos nessa área. O último documento de recomendações para quantificação das câmaras cardíacas pela ecocardiografia em adultos da Sociedade Americana de Ecocardiografia e da Associação Europeia de Imagem Cardiovascular sugere que valores, tanto do SLGVD quanto do SL-PLVD, inferiores a 20% sejam considerados como anormais.35 No entanto, é preciso cautela, pois os diferentes tipos de aparelho trazem softwares diferentes, com valores de referência particulares e diferenças quanto ao nível de mapeamento (endocárdico, epicárdico ou abrangendo toda a parede miocárdica).
A Tabela 13.2 resume as principais recomendações da utilização do SLG na avaliação do VD.
Tabela 13.2. – Indicações da utilização do strain longitudinal global na avaliação do ventrículo direito.
|
|
|
|
|
|
|
CMPH: cardiomiopatia hipertrófica; CMD: Cardiomiopatia dilatada; DAVD: displasia arritmogênica de ventrículo direito.
14. Strain do Átrio Esquerdo e do Átrio Direito
14.1. Técnica de Obtenção e Análise do strain do Átrio Esquerdo
A análise da função do AE usando o strain permite que os três componentes da função do AE sejam analisados: AESr, que avalia a função reservatório; AEScd, que avalia a função de conduto; e o AESct, que avalia a função contrátil. Embora menos utilizada, também há a taxa de deformação ou strain rate, descrita como pAESRr (pico strain rate na fase reservatório), pAESRcd (pico de strain rate na fase de conduto) e pAESRct (pico de strain rate durante contração atrial).92,347
Para a análise do strain do AE, usam-se imagens apicais 4 câmaras e 2 câmaras otimizadas para o AE e com frequência de quadros alta, habitualmente entre 40 e 80 fps. Seleciona-se um ciclo cardíaco específico e faz-se manualmente o traçado ponto a ponto a partir da borda endocárdica do anel mitral até o anel mitral oposto, extrapolando-se a entrada das veias pulmonares e do apêndice atrial esquerdo. O software cria a ROI, a qual é ajustada para 03 mm de largura e deve cobrir da borda endocárdica até a epicárdica. Caso a qualidade do tracking seja reprovada em dois ou mais segmentos, mesmo após ajuste manual, deve-se excluir essa incidência da análise. Finalmente, o software calcula o SLG para cada uma das janelas apicais citadas acima.
Na análise do strain do AE, há dois métodos diferentes como ponto de referência ou zero: o início da onda P do ECG2 ou o pico da onda R do QRS.348 O primeiro método permite o reconhecimento mais fácil dos componentes do strain do AE, sendo necessária a soma dos valores absolutos de AEScd e AESct, para se obter o AESr. O segundo método oferece diretamente o valor do AESr, que é o dado com maior valor prognóstico, sendo que os demais componentes são obtidos a partir do gráfico. O método que usa a onda R como referência é o mais recomendado, porque esse é o ponto de menor volume do AE, sendo o AESr mais facilmente obtido. A maior parte dos trabalhos usa esse método.92
14.2. Valores de Normalidade
O strain do AE apresenta grande heterogeneidade na literatura quanto aos valores de normalidade. A metanálise realizada por Pathan et al. é a melhor evidência no momento: os valores médios do AESr, AEScd e AESct foram, respectivamente: 39,4% (IC95% 38%–40,8%); 23% (IC95% 20,7%–25,2%) e 17,4% (IC95% 16,0%–19,0%).37
14.3. Aplicabilidade Clínica do Strain do Átrio Esquerdo
A avaliação do strain do AE demonstrou valor prognóstico incremental em diversos contextos clínicos, quando comparada à mensuração volumétrica isolada349 (Figura 14.1).
Figura 14.1. – Mecanismos envolvidos na disfunção atrial esquerda avaliada pelo strain.
14.3.1. Insuficiência Cardíaca e Avaliação de Função Diastólica
O strain do AE está deprimido na ICFEr e possui valor prognóstico para previsão de morte por todas as causas ou de nova internação por IC,350 boa correlação com capacidade funcional351 e pressões de enchimento do VE,352 além de ser bom preditor de resposta à terapia de ressincronização miocárdica.353 Na ICFEp, o strain do AE apresenta importante papel no diagnóstico 354 e prognóstico,73,355 além de ser capaz de predizer o risco de evolução para FA.98
Cerca de 20% dos casos de ICFEp podem ter padrão indeterminado na avaliação da função diastólica do VE,93 e o strain do AE é capaz de recategorizar esses pacientes,90 sendo que os três componentes da função atrial demonstraram boa acurácia em determinar aumento da pressão atrial esquerda.89
14.3.2. Fibrilação Atrial
Na FA, as funções de reservatório e conduto do AE estão deprimidas e a contrátil é ausente. O strain do AE é capaz de prever FA nova em diversas patologias como ICFEr,356 estenose mitral,357 doença de Chagas358 e após implante de marca-passo,359 além de prever o risco de recorrência de FA após cardioversão360 ou ablação.361-363 É possível que a avaliação da função do AE pelo strain seja incorporada no processo decisório da indicação de ablação de FA. O AESr também está associado com ocorrência de AVCi independente de CHA2DS2-VASc escore, idade e uso de anticoagulante.364
14.3.3. Valvopatias
O strain do AE pode sinalizar maior gravidade e evolução desfavorável na valvopatia mitral e aórtica.365,366 Na IM primária grave, o AESr demonstrou ser preditor de hospitalização por IC ou morte por todas as causas, independentemente das indicações de intervenção cirúrgica.367,368
14.3.4. Doença Arterial Coronariana
A DAC associa-se à disfunção atrial por dois mecanismos principais: DD do VE e isquemia direta do AE.369 O strain do AE pode ter importante valor prognóstico na síndrome coronariana aguda, correlacionando-se com maior gravidade370 e desfechos desfavoráveis.371
14.4. Strain Atrial Direito
O strain do AD carece de dados, mas um estudo recente avaliou 101 voluntários saudáveis e descreveu os seguintes valores utilizando o complexo QRS como referência: reservatório (37,6% ± 6,9), conduto (26,0% ± 7,1) e contração (11,6% ± 4,4).372 A avaliação da função do AD é alvo de interesse em cardiopatias congênitas,301,373 valvopatia tricúspide e HP.374
15. Avaliação da Torção do Ventrículo Esquerdo
15.1. Introdução
A função do VE é determinada pelas interações complexas entre a anatomia do tecido, a contratilidade miocárdica e hemodinâmica. No miocárdio do VE, as fibras musculares possuem direções diferentes. Na região subendocárdica, as fibras são quase paralelas à parede e produzem um movimento de rotação do tipo direito (hélice de mão direita), o que gradualmente muda no subepicárdico para fibras anguladas a 60–70 graus, promovendo uma rotação do tipo esquerda (hélice de mão esquerda).375,376
A contração das fibras subepicárdicas faz com que o ápice do VE gire no sentido anti-horário e a sua base no sentido horário. Por outro lado, a contração das fibras subendocárdicas faz o ápice e a base do VE girarem exatamente nas direções opostas. Dado ao maior raio de rotação da camada epicárdica, a direção das fibras subepicárdicas prevalece na direção geral de rotação quando ambas as camadas se contraem simultaneamente. Isso resulta em rotação global do VE no sentido anti-horário próxima ao ápice e na rotação no sentido horário próxima à base do VE durante a ejeção ventricular,377 como ilustrado na Figura 15.1.
Figura 15.1. – Direção da rotação das fibras subendocárdicas (A); direção da rotação das fibras subepicárdicas (B); e rotação resultante geral do ventrículo esquerdo com a contração simultânea das fibras (C). Adaptado de Stöhr et al.384.
Esse movimento de torção do VE contribui para manter uma distribuição uniforme do encurtamento e do estresse das fibras ao longo de todas as paredes, produzindo, assim, uma FE relativamente elevada (~60%), a despeito de encurtamento limitado (~20%).378 A torção e o cisalhamento das fibras subendocárdicas durante a ejeção ventricular resultam no armazenamento de energia potencial, que é subsequentemente usada para o desenrolar diastólico das fibras e, assim, destorcer as hélices, produzindo juntos a sucção diastólica.379,380 As condições de pré- e pós-carga e contratilidade alteram a extensão da torção ventricular.381 O aumento da pré-carga ou da contratilidade aumentam a torção do VE, enquanto o aumento na pós-carga causa efeito inverso.
Várias modalidades e técnicas de imagem podem ser usadas para quantificar a mecânica da torção ventricular: ecocardiografia (Doppler tecidual, ST2D e ST3D, imagem de velocidade vetorial [VVI]), RMC (tissue tagging) e sonomicrometria. Atualmente, não existe um padrão-ouro para a avaliação da mecânica de torção do VE, tendo as modalidades de imagem listadas acima boa concordância.382 Devido à sua segurança, disponibilidade e melhor custo/efetividade, a ecocardiografia tem sido a modalidade de imagem mais empregada.
15.2. Definições e Nomenclaturas
Torção, twist, twist rate, untwist, untwist rate são as terminologias comumente utilizadas para descrever os achados da rotação sistólica e a rotação diastólica reversa da base e do ápice do VE, como vistos pelo ápex. As definições desses termos podem ser encontradas nas Tabelas 15.1 e 15.2.
Tabela 15.1. – Definições e parâmetros utilizados para avaliação do mecanismo de twist do ventrículo esquerdo na sístole.
| Parâmetro | Definição |
|---|---|
| Rotação apical (º) | Pico da rotação sistólica no sentido anti-horário da região apical do VE (medido em graus) |
| Taxa de rotação apical (º/s) | Pico de velocidade de rotação apical no sentido anti-horário (medido em graus/segundo) |
| Rotação basal (º) | Pico da rotação sistólica no sentido horário da região basal do VE (medido em graus) |
| Taxa de rotação basal (º/s) | Pico de velocidade de rotação basal no sentido horário (medido em graus/segundo) |
| Twist VE (º) | Diferença do pico das rotações sistólicas do ápice e da base do VE (medido em graus) |
| Torção do VE (º/cm) | Twist normalizado: razão do ângulo do twist pela distância entre a base e o ápice na sístole (medido em graus/centímetro) |
| Twist rate (º/s) | Velocidade de pico do twist do VE (medido em graus/segundo) |
(o): graus; (o/s): graus por segundo; (º/cm): graus por centímetro; VE: ventrículo esquerdo.
Tabela 15.2. – Definições e parâmetros utilizados para avaliação do mecanismo de twist do ventrículo esquerdo na diástole.
| Parâmetro | Definição |
|---|---|
| Rotação reversa apical (º) | Pico da rotação diastólica no sentido horário da região apical do VE (medido em graus) |
| Taxa de rotação reversa apical (º/s) | Pico de velocidade da rotação reversa apical no sentido horário (medido em graus/segundo) |
| Rotação reversa basal (º) | Pico da rotação diastólica no sentido anti-horário da região basal do VE (medido em graus) |
| Taxa de rotação reversa basal (º/s) | Pico de velocidade da rotação basal (medido em graus/segundo) |
| Untwist (º) | Diferença do pico das rotações diastólicas reversas do ápice e da base do VE (medido em graus) |
| Untwist rate (º/s) | Velocidade de pico do untwist do VE (medido em graus/segundo) |
(o): graus; (o/s): graus por segundo; VE: ventrículo esquerdo.
15.3. Passo a Passo da Avaliação da Torção Ventricular pelo Ecocardiograma com Speckle Tracking
Para avaliação do mecanismo de rotação, são obtidas imagens paraesternais do eixo curto do VE ao nível basal (valva mitral) e apical (abaixo dos músculos papilares) (Figura 15.2). É importante obter a imagem apical do VE onde não apareça o VD ou apenas uma parte deste, em geral um a dois espaços intercostais abaixo da posição habitual. A maioria dos erros de avaliação ocorre devido à seleção inapropriada dos planos basal e apical e do ajuste da ROI.
Figura 15.2. – Planos de obtenção das imagens para medida da rotação basal e apical. Imagens cedidas pelo Dr. Marcio Lima.
Por convenção, quando a rotação é horária, o traçado é registrado abaixo da linha de base e, quando a rotação é anti-horária, o traçado é inscrito acima da linha de base (Figura 15.3).
Figura 15.3. – Registro das rotações horária (abaixo da linha de base) e anti-horária (acima da linha de base). Imagens cedidas pelo Dr. Marcio Lima.
O valor normal do twist global é de 9,7° ± 4,1°. Para a torção, há poucos valores de referência na literatura, sendo estimada em 1,35°/cm ± 0,54°/cm.383
15.4. Aplicações Clínicas
Os parâmetros de torção do VE têm sido usados principalmente para avaliar as alterações na mecânica ventricular que ocorrem em patologias com FEVE reduzida (CMP isquêmica e dilatada) ou preservada (ICFEp, hipertensão, CMPH, EA, IAo e IM), bem como na avaliação de disfunção miocárdica subclínica causada por quimioterápicos.
A medida do twist e da torção, embora sejam bons parâmetros para ajudar na análise da função sistólica global, tem limitações quanto à reprodutibilidade, em especial devido à falta de parâmetros anatômicos para o corte apical. Os achados de alterações no twist e torção ventricular não são específicos, mas podem contribuir para o entendimento da fisiopatologia de diferentes CMPs, auxiliando na diferenciação entre elas (Tabela 15.3).
Tabela 15.3. – Twist do ventrículo esquerdo em diferentes doenças cardiovasculares.
| Doença cardiovascular | Twist do VE | Achados |
|---|---|---|
| Cardiomiopatia isquêmica | Diminuído | Twist diminui dependendo da localização e extensão da isquemia. |
| Cardiomiopatia dilatada | Diminuído | Diminuição do twist proporcional à queda da fração de ejeção |
| Cardiomiopatia hipertrófica | Aumentado | Aumento do twist em especial se houver obstrução da via de saída do VE |
| Estenose aórtica | Aumentado | Aumento do twist em caso de aumento da pós-carga do VE. |
VE: ventrículo esquerdo.
16. Strain na Análise da Dissincronia Ventricular
16.1. Introdução
A terapia de ressincronização cardíaca (TRC) é uma opção terapêutica com indicações já estabelecidas em diretrizes nacionais e internacionais e redução expressiva comprovada em morbidade e mortalidade. Ela é recomendada como classe I para pacientes com CMP dilatada, sintomáticos, em tratamento clínico otimizado, ECG com padrão de BRE, duração do QRS ≥ 150 ms e FEVE abaixo de 35% (nível de evidência: A).385
Essas diretrizes empregam a presença de BRE com duração ≥ 150 ms ao ECG como marcador de dissincronia devido à ausência de evidências da utilidade da avaliação ecocardiográfica da sincronia até o momento. Entretanto, o ECG também apresenta limitações como marcador de dissincronia. Assim, atualmente, a avaliação ecocardiográfica da dissincronia para a seleção da TRC deve ser realizada de maneira individualizada e criteriosa por um examinador com treinamento adequado e interpretada juntamente aos dados clínicos do paciente. Também é importante lembrar que o papel da ecocardiografia engloba não apenas a avaliação da sincronia cardíaca na seleção dos pacientes, mas também o auxílio na escolha do melhor local para o implante do eletrodo VE, além de avaliação da resposta e remodelamento reverso e, mais recentemente, a identificação do risco de arritmias ventriculares.385
16.2. Avaliação da Dissincronia na Seleção dos Pacientes para a Terapia de Ressincronização Cardíaca
A avaliação da dissincronia pelo strain, isoladamente, não indica a TRC, nem a análise de sua eficiência. Entretanto, reconhece-se que, mesmo com a indicação precisa, a chance de sucesso, isto é, melhora clínica, funcional e/ou de variáveis obtidas por métodos de imagem, fica em torno de 60–70% dos casos. A taxa de resposta à TRC pode ser estimada e até melhorada com o emprego da ecocardiografia. Nesse panorama, a medida de valores da deformação miocárdica se destaca.
A análise inicial da dissincronia pelo strain radial descreveu a diferença de tempo entre a deformação máxima radial dos segmentos médios anterosseptal e inferolateral. Uma medida com valor superior a 130 ms caracteriza pacientes com maior taxa de resposta,386 como mostrado na Figura 16.1.
Figura 16.1. – Imagem de strain radial com curvas dos segmentos médios das paredes anterosseptal e inferolateral. O intervalo acima de 130 ms correlaciona-se com uma maior taxa de resposta à terapia de ressincronização cardíaca; nesse caso, 340 ms.
Além da dissincronia radial, a identificação de um padrão de estiramento rebote da parede septal (SRS, septal rebound stretch) pela técnica de speckle tracking demonstrou-se um preditor independente de prognóstico em longo prazo, além de remodelamento reverso ventricular esquerdo com valor incremental à presença de BRE e de apical rocking detectada pela análise visual. Esse padrão reflete à incoordenação da contração cardíaca com resultante redução da performance miocárdica. Assim, estudos recentes indicam que a presença de SRS pode melhorar a seleção dos pacientes na TRC, especialmente no subgrupo de pacientes sem BRE definido.387 A denominação desse padrão clássico é feita por meio de três elementos obtidos pelo padrão de deformação longitudinal dos segmentos (frequentemente basais) inferosseptal e anterolateral: 1) oposição de pico das curvas septal (negativa), lateral (positiva) inicialmente; 2) pico de deformação negativa do septo em até 70% do tempo de ejeção; 3) pico de deformação negativa de parede lateral após fechamento da valva aórtica,388 conforme demonstrado na Figura 16.2.
Figura 16.2. – Imagem do strain longitudinal com curvas dos segmentos basais inferosseptal (amarela) e anterolateral (vermelha) com padrão de bloqueio de ramo esquerdo típico: 1) oposição do pico das curvas septal (negativa) e lateral (positiva), inicialmente; 2) pico de deformação negativa do septo em até 70% do tempo de ejeção, com o encurtamento sendo interrompido durante a sístole, isto é, antes do fechamento da valva aórtica (AVC), resultando em estiramento sistólico; 3) pico de deformação negativa de parede lateral após o fechamento da valva aórtica.
Recentemente, a análise da eficiência do TM global ventricular esquerdo (GLVMWE, global left ventricular myocardial work efficiency) tem se mostrado promissora no contexto da TRC. O GLVMWE pode ser quantificado de maneira não invasiva a partir das curvas de strain miocárdico e medidas da pressão arterial. Valores reduzidos de GLVMWE estiveram associados, de maneira independente, a melhor prognóstico em longo prazo.389 Na Figura 16.3, exemplificam-se as modificações ocorridas no strain, myocardial work e myocardial efficiency em paciente submetido a TRC com sucesso.
Figura 16.3. – Mapas polares comparativos pré- e pós-procedimento do strain longitudinal (A), do myocardial work (B), myocardial efficiency (C) em paciente submetido a terapia de ressincronização com sucesso.
16.3. Avaliação de Viabilidade Miocárdica
Outra aplicação da deformação miocárdica no contexto da TRC refere-se à correlação da presença de fibrose miocárdica com valores reduzidos de strain. Valores de strain global radial reduzidos correlacionam-se a maior grau de fibrose (detectados por RMC) e, assim, identificam pacientes com chance reduzida de recuperação da função ventricular. A redução da deformação longitudinal em pacientes com cardiopatia isquêmica também pode ser empregada para essa finalidade.
16.4. Orientação do Local de Implante dos Eletrodos
Tão importante como a caracterização da fibrose total do VE, a presença de valores comprometidos em segmentos no local de implante do eletrodo do VE tem se relacionado à menor taxa de pacientes respondedores à TRC.
Estudos demonstram que o posicionamento do eletrodo do VE no segmento que apresenta maior atraso da contração mecânica resulta em maiores taxas de sucesso à TRC. A identificação do segmento a ser estimulado pode ser realizada pela técnica de speckle tracking. No estudo TARGET, o posicionamento do eletrodo do VE guiado pela técnica de ST2D resultou em melhor resposta clínica e menores taxas de morte e hospitalizações por IC.390,391
16.5. Avaliação Prognóstica após a Terapia de Ressincronização Cardíaca
A análise da dissincronia pelo strain longitudinal após a TRC foi um preditor forte de arritmias ventriculares. A persistência ou o aumento da dispersão mecânica 6 meses após a TRC, avaliada pelo speckle tracking, está associada a pior prognóstico. Além disso, a resposta à TRC evidenciada pelo remodelamento reverso foi dependente da melhora tanto da função longitudinal quanto da circunferencial após a TRC.392
16.6. Ajuste nos Parâmetros de Ressincronização
Cerca de 30% dos pacientes submetidos a TRC são considerados não respondedores devido à ausência de melhora clínica e/ou funcional, além da ausência de remodelamento reverso evidenciada pela redução das dimensões ventriculares e o aumento da FE.393 Nesse grupo de pacientes, ajustes dos intervalos atrioventricular, interventricular e intraventricular esquerdo podem melhorar a resposta individual à TRC. Alguns estudos têm demonstrado que a speckle tracking pode ser empregada como guia para ajuste dos parâmetros da TRC, com melhora significativa da classe funcional e da FE em pacientes não respondedores.394
17. Myocardial Work (Trabalho Miocárdico)
17.1. Introdução
Uma nova ferramenta ecocardiográfica chamada myocardial work (MW) surgiu recentemente visando incrementar informações acerca da função ventricular, adicionando o efeito da pós-carga do VE à medida do strain longitudinal.
Com o trabalho experimental de Suga et al. em 1979,395 demonstrando que a área sob a curva pressão-volume adquirida de forma invasiva com um cateter de condutância intraventricular refletia o trabalho miocárdico (TM) regional e o consumo de oxigênio por batimento, crescia o interesse dos métodos de imagem em tornar essa análise factível de forma não invasiva.396,397
Russell et al.,398 em 2012, validaram a alça pressão-deformação (PD) do VE obtida de forma totalmente não invasiva, integrando a pressão arterial sistólica (PAS) no momento do exame com o strain longitudinal utilizando o speckle tracking, o que gera, quando interpretadas por um software próprio, alças PD global e por segmento (Figura 17.1). A área sob a curva representa o TM e obteve excelente correlação com as medidas diretas intraventriculares. Além disso o TM foi capaz de refletir o metabolismo miocárdico regional de oxigênio, quando comparado à medida pela tomografia por emissão de pósitrons com (18F) fluorodesoxiglicose.399-401
Figura 17.1. – Alça pressão vs. deformação do ventrículo esquerdo. Em vermelho: alça pressão vs. deformação global do ventrículo esquerdo. Em verde: alça pressão-deformação do segmento basal da parede ínfero-lateral. LVP: pressão do ventrículo esquerdo estimada pela pressão arterial sistólica; AVO: abertura da válvula aórtica; AVC: fechamento da válvula aórtica; MVO: abertura da válvula mitral; MVC: fechamento da válvula mitral.
Aumentos modestos na pressão arterial podem gerar redução de até 9% no SLG, podendo levar a uma errônea interpretação de redução de contratilidade, quando, na verdade, o TM permanece preservado, refletindo apenas uma elevação da pós-carga. Nesse sentido, o TM é considerado um avanço na compreensão da mecânica ventricular.398,402 As principais diferenças entre o TM e o strain do VE são demonstrados na Tabela 17.1.
Tabela 17.1. – Principais diferenças entre o trabalho miocárdico e o strain do ventrículo esquerdo.
| Strain | Trabalho miocárdico | |
|---|---|---|
| Utiliza AFI® | Sim | Sim |
| Medida realizada | AVO-AVC | TCIV+ Tej + TRIV |
| Integra com PA | Não | Sim |
| Valor | % | mmHg% |
| Incorpora pós carga | Não | Sim |
| Medida de eficiência | Não | Sim |
| Estima consumo miocárdico de oxigênio | Não | Sim |
AVO: abertura da válvula aórtica; AVC: fechamento da válvula aórtica; TCIV: tempo de contração isovolumétrico; Tej: tempo de ejeção; TRIV: tempo de relaxamento isovolumétrico.
17.2. Aquisição do Trabalho Miocárdico
Para a obtenção de resultados reprodutíveis e com boa acurácia, é importante o uso de técnica adequada para o cálculo do TM, não só para a aquisição das imagens, mas também para o pós-processamento e a análise dos parâmetros. Essa tecnologia atualmente está apenas disponível em estações de trabalho (workstations) ou embarcadas em aparelhos com software desenvolvido por apenas um fabricante (GE Healthcare, Horten, Norway). As análises podem ser realizadas diretamente no aparelho ou pós-processadas nas workstations a partir de imagens previamente adquiridas.
O protocolo de obtenção de imagens para o cálculo do TM segue os mesmos pré-requisitos técnicos necessários para a análise do SLG, abordados em capítulo específico. Após a realização das análises de strain bidimensional, utilizando imagens adquiridas nas três projeções apicais através da técnica do AFI (automated functional imaging), o software permite que seja selecionada a análise do TM (Figura 17.2). Como passo inicial, devemos inserir manualmente os valores de pressão arterial não invasiva (PNI) medidos no momento do exame, e isso pode ser realizado a qualquer momento do exame na tela de identificação do paciente ou posteriormente, na própria tela de cálculo de TM (Figura 17.3). Essas medidas de PNI serão automaticamente integralizadas no cálculo de curva de pressão vs. deformação.
Figura 17.2. – Após a realização da análise de strain bidimensional longitudinal do ventrículo esquerdo pelo método AFI (automated functional imaging), tendo processado as três janelas apicais, o software oferece a opção de cálculo do trabalho miocárdico (myocardial work) – seta.
Figura 17.3. – Tela inicial de cálculo do trabalho miocárdico. Podemos inserir manualmente, nessa etapa, o valor da pressão arterial não invasiva aferida (seta) e reavaliar ou realizar a marcação de eventos cardíacos, como a abertura e fechamento das valvas mitral e aórtica (setas).
Para que seja possível obter a indexação temporal dos valores obtidos, é necessário que sejam feitas as marcações de eventos do ciclo cardíaco, identificando a abertura e fechamento das valvas mitral e aórtica, o que pode ser realizado através do Doppler espectral dos fluxos mitral e aórtico, ou ao bidimensional, na análise da projeção apical 3 câmaras, em que podemos evidenciar a abertura e fechamento de ambas as valvas (Figura 17.4). Essas marcações também podem ser realizadas na própria tela de cálculo do TM, modificando quadro a quadro (“frame”) a imagem do apical 3 câmaras, selecionando qual o momento exato de cada evento (Figura 17.5). Após aprovar as imagens e marcações realizadas (“aprove”), o software realiza os cálculos e dispõe lado a lado o mapa polar (bull’s eye) com valores de SLG e strain de pico por segmento e, à direita o mapa polar com o índice de TM por segmento, dispondo na parte inferior os valores de índice de TM global (GWI) e GMWE. Ao selecionarmos, à direita, a tecla “work efficiency” o software dispõe no mapa polar os valores de GMWE por segmento (Figura 17.6). Quando selecionamos a tecla “advanced”, são geradas as análises por curvas e gráficos, nas quais é possível observar as alças de pressão do VE (left ventricular pressure, LVP) vs. strain ao longo do ciclo cardíaco, além de um gráfico de barras que demonstra a participação do TM construtivo e do TM desperdiçado (Figura 17.7).
Figura 17.4. – Marcação de eventos cardíacos com o uso do Doppler espectral. Em A, observamos a marcação de abertura (MVO) e o fechamento da valva mitral (MVC) através do influxo mitral. Em B, observamos a marcação de abertura (AVO) e o fechamento da valva aórtica (AVC) através do fluxo da via de saída do ventrículo esquerdo.
Figura 17.5. – A marcação de eventos cardíacos também pode ser realizada na própria tela de cálculo do trabalho miocárdico (myocardial work), modificando quadro a quadro (“frame”) a imagem do apical 3 câmaras, selecionando o momento exato de cada evento, clicando nos campos à direita (setas).
Figura 17.6. – Após a aprovação dos dados obtidos, a marcação adequada de eventos e o preenchimento de pressão não invasiva, o software dispõe os valores de strain longitudinal global e por segmento à esquerda (setas brancas) e os mapas polares com valores de índice de trabalho miocárdico (A – seta amarela) e de eficiência de trabalho miocárdico (B – seta azul).
Figura 17.7. – Quando selecionamos a tecla “advanced”, são geradas as análises por curvas e gráficos, onde é possível observar as alças de pressão do ventrículo esquerdo (left ventricular pressure, LVP) vs. strain ao longo do ciclo cardíaco (seta amarela), além de um gráfico de barras que demonstra a participação do trabalho miocárdico construtivo e do trabalho miocárdico desperdiçado (seta azul).
Os seguintes parâmetros são fornecidos pelo software:
1. Índice de TM global (ITMG/GWI): corresponde ao trabalho total dentro da área sob a curva PD, sendo calculado a partir do fechamento da válvula mitral até a abertura da valva mitral. Um bull’s eye com valores de TM segmentar e global é fornecido (Figura 17.6).
2. TM construtivo (TMC/GCW): é o trabalho que contribui para a ejeção do VE durante a sístole, sendo obtido considerando-se o encurtamento dos miócitos durante a sístole, adicionando o alongamento dos miócitos durante o relaxamento isovolumétrico (Figura 17.7).
3. TM desperdiçado (TMD/GWW): é o trabalho que não contribui para a ejeção do VE, sendo obtido considerando-se o alongamento dos miócitos (em vez de encurtamento) durante a sístole, somado ao encurtamento durante a fase de relaxamento isovolumétrico (encurtamento pós-sistólico) (Figura 17.7).
4. Eficiência do TM (ETM/GMWE): é obtido por meio da fórmula: . Seu valor é dado em porcentagem de 0 a 100% de eficiência (Figura 17.6).
17.3. Valores de Normalidade
Devido à validação recente do TM e de suas variáveis para o uso clínico, não há ensaios multicêntricos com número adequado de pacientes para gerar valores de normalidade definitivos.
Manganaro et al. recentemente analisaram os dados do estudo NORRE visando estabelecer limites de referência normais para o TM. Esse foi um estudo multicêntrico e prospectivo europeu formado por 226 pacientes oriundos de 22 laboratórios de ecocardiografia, que forneceu valores de referência para a maioria dos dados ecocardiográficos 2D e 3D.403 A média ou mediana com o desvio padrão e o intervalo de confiança das variáveis do TM foram, respectivamente, 1.896 + 308 mmHg% (1.292–2.505) para o GWI, 2.232 ± 331 mmHg% (1.582–2.881) para o GCW, 79 mmHg% (53–122) para o GWW e 96% (94–97) para a GMWE.403
O GWI e GCW foram maiores em mulheres acima de 40 anos, e existe forte correlação no aumento do GWI e GCW com o aumento da pressão arterial sistólica.404
17.4. Potencial Uso Clínico
A grande limitação para a democratização do uso do TM é o fato de apenas uma empresa ser detentora do software (GE Healthcare). Além disso, o cálculo do TM usa basicamente a pressão sistólica aferida manualmente como medida de pós-carga em sua validação. É importante também levar em consideração situações clínicas em que há um aditivo da pós-carga além da PAS, como na EA, CMPH obstrutiva e em algumas cardiopatias congênitas. Apesar de se tratar de uma nova ferramenta bastante promissora, à luz do conhecimento científico atual, ainda é restrita ao campo da pesquisa.
Existem algumas publicações que já vêm ganhando notoriedade da aplicação do uso do TM na prática clínica, uma delas é na seleção de pacientes para ressincronização miocárdica. Algumas vezes, a análise do bloqueio do ramo esquerdo pode gerar dúvidas na interpretação (Figura 17.8). Por outro lado, através da análise visual e quantitativa do TM, tornou-se mais fácil o reconhecimento dos casos que têm um ECG com alargamento do QRS e que talvez não tenha um dissincronismo mecânico associado (Figura 17.9). Além da análise visual, tem-se valorizado o valor do trabalho construtivo para identificar os respondedores à terapia de ressincronização, sendo um equivalente de reserva contrátil.405 Outro dado interessante para identificar os pacientes que se beneficiam com a ressincronização é a análise do trabalho perdido do septo.406 Portanto, a análise do TM nos pacientes com BRE pode ajudar a melhorar a estratificação pela análise visual, assim como a quantificação do trabalho construtivo e o trabalho perdido.
Figura 17.8. – Casos 1 e 2 com morfologias bem semelhantes de bloqueio de ramo esquerdo.
Figura 17.9. – Caso 1 não apresenta alteração na mecânica miocárdica visualizado pela linha verde em que o trabalho miocárdico na alça pressão-strain é semelhante ao valor global em vermelho. Já no Caso 2, o “verdadeiro” bloqueio de ramo esquerdo, note que na mesma porção septal a curva em verde adquire um formato típico de 8.
Outro campo interessante na avaliação do TM é na doença coronariana obstrutiva. Ele tem demonstrado sua capacidade de detecção em repouso de doença coronária obstrutiva sendo superior ao SLGVE, mesmo naqueles com FE preservada e sem alteração da contratilidade segmentar.407 A sua aplicação também tem demonstrado identificar aqueles pacientes com infarto agudo que irão apresentar mais complicações hospitalares e predizer aqueles com recuperação da função miocárdica408 e determinar complicações a longo prazo em pacientes com IAM com supradesnível de ST.409
Além das duas situações clínicas descritas, é promissora sua aplicação na CMP dilatada, CMPH e amiloidose. Provavelmente, quando houver mais praticidade do software e mais evidência na literatura, a aplicação do TM será incorporada na prática clínica.
18. Strain no 3D: O Que Pode Acrescentar ao Exame
18.1. Introdução
A avaliação tridimensional (3D) da deformação miocárdica das câmaras cardíacas através da técnica de rastreamento dos “speckles” tem inúmeras vantagens em relação à avaliação bidimensional (2D). Considerando que o miocárdio ventricular esquerdo é composto por três camadas de fibras, que estão dispostas em direções diferentes (longitudinal, circunferencial e transversal), os “speckles” acabam por apresentar uma trajetória não linear, fugindo do plano bidimensional da imagem por alguns momentos do ciclo cardíaco. Por mais que se realizem múltiplas aquisições longitudinais e transversais do miocárdio ventricular esquerdo, a avaliação dos “speckles” no ciclo cardíaco se faz por interpolação, não sendo tão precisa quanto o 3D, que permite acompanhá-los durante todo o ciclo cardíaco nas múltiplas dimensões. Assim, as medidas do strain 3D não são impactadas pela “out-of-plane”, pela torsão miocárdica ou encurtamento apical.410
Em relação ao VD, a metodologia 3D é a única que permite a análise global de todo o miocárdio da câmara, ao passo que, no 2D, apenas a septo e/ou parede livre é avaliada. Ademais, a avaliação do strain 3D é mais fidedigna e fisiológica, pois a análise dos diferentes componentes da deformação miocárdica ocorre de forma simultânea em um único dataset ou ciclo cardíaco. Dessa forma, o strain 3D é uma aplicação promissora para uma avaliação quantitativa, objetiva, compreensiva e reprodutiva da função mecânica do miocárdio. Contudo, essa metodologia apresenta forte dependência da uma boa janela acústica e de um ritmo cardíaco regular, fatores que são os principais limitantes para a incorporação rotineira e sistemática do strain 3D.411 A aplicação clínica também é limitada devido a diferenças nos algoritmos para acompanhamento dos “speckles” e o cálculo (cut-off) da deformação miocárdica, que não está padronizado entre os diferentes fabricantes de softwares.412,413
Uma vez que as medidas do strain 3D obtidas por diferentes fabricantes e softwares não são intercambiáveis, a incorporação clínica em avaliações sequenciais requer que as aquisições basais e no acompanhamento do paciente, bem como as análises, sejam obtidas usando o mesmo equipamento, e a interpretação dos resultados deve considerar os valores da normalidade específicos para o equipamento em questão.410,412 Os valores de referência da normalidade também diferem entre as metodologias bidimensional e tridimensional, havendo apenas uma correlação modesta entre os valores do strain longitudinal. Por fim, ainda se fazem necessárias pesquisas clínicas para avaliar a acurácia e o valor prognóstico do strain 3D.
18.2. Strain Ventricular Esquerdo
O ST3D (ou strain tridimensional) apresenta um princípio melhor quando comparado ao ST2D por não ser limitado a um plano de corte e por permitir dados vetorizados em três planos ortogonais para uma análise. Do ponto de vista de implementação do método, sabemos que o strain bidimensional precisa de resolução temporal muito elevada (34–50 vps), porque os “speckles” ficam pouco tempo (alguns milissegundos) no plano de corte, o que não ocorre no modo tridimensional. Além disso, para o ST3D, o ideal é a obtenção de seis batimentos cardíacos (“6 beat acquisition”), com a maior densidade de linhas e com 44 vps na frequência de 2 a 4 Mhz (pois foi o que apresentou maior acurácia quando comparado a RM). Não se recomenda a aquisição com volumes únicos, e o aumento da resolução temporal no equipamento diminui a qualidade da imagem e o tracking por reduzir a densidade das linhas.414
A factibilidade geral é em torno de 85%, e as limitações para a implementação da técnica são: janela acústica desfavorável, arritmias cardíacas (impedem aquisições em múltiplos batimentos), visualização incompleta dos seguimentos apicais do VE e VD, problemas de tracking dos speckles nos seguimentos basais (distantes do transdutor) e determinação dos valores de normalidade e de prognóstico clínico.
18.3. Strain Ventricular Direito
A análise da contração do VD é importante especialmente para entender o mecanismo dessa câmara diante das doenças congênitas e adquiridas. Porém, ao contrário do VE, a estimativa do VD é mais difícil devido à forma complexa que o VD apresenta e devido à parede fina que possui. Apesar disso, imagens de RM e speckle tracking pelo ecocardiograma têm sido promissoras na análise ventricular direita. No entanto, os valores obtidos pelo ST3D para o VD ainda não estão bem estabelecidos.415 Persistem problemas técnicos para a análise do strain 3D quando o objetivo é analisar as câmaras direitas, uma vez que o software foi criado para a análise do VE e ainda é adaptado para o VD na maioria das máquinas. Apesar de o strain 3D permitir a análise global de todo miocárdio direito, a tecnologia tridimensional para essa câmara ainda está em andamento, não havendo valores de corte bem definidos para o strain 3D do VD até o momento.
18.3.1. Aquisição e Análise do Full-volume 3D
Usando imagem harmônica, idealmente se obtém quatro batimentos triggados na captura. A profundidade deve ser adequada para que somente o VD, suas paredes e o anel tricúspide preencham o volume, e geralmente é o pico sistólico do strain que é usado para análise.
18.4. Strain Atrial Esquerdo
O sistema de ultrassom na avaliação do strain 3D do AE (assim como dos ventrículos) é capaz de adquirir os dados volumétricos do átrio em tempo real e pode medir todos os componentes do strain. Contudo, o tracking em três dimensões é um grande desafio, e a resolução temporal e espacial do 3D é inferior à do 2D, o que torna a análise tridimensional complexa e mais demorada, pois a alta qualidade de imagem é necessária para a aquisição do strain 3D.
Outro ponto em discussão, é a variabilidade inter e intraobservador na avaliação da mecânica cardíaca.414 Sabe-se que tanto a fase de reservatório como a de conduto e a de bomba atrial podem ser bem analisadas pelo strain 2D, e há valores médios de corte relativamente definidos para o strain 2D em cada uma dessas fases. Contudo, ainda não temos valores de referência para o strain 3D. As principais aplicações do método nessa câmara, em que a análise do strain torna-se relevante são: IC com FE preservada,7 avaliação das pressões de enchimento intracavitárias,95 função atrial do atleta de elite416 e CMPs,417 mas os estudos corroboram mais os dados do strain 2D do que do strain 3D.
19. O papel da Ressonância e Tomografia Cardíacas na Avaliação do Strain
19.1. Introdução
A RMC, com sua alta resolução espacial e temporal e natureza não invasiva, tornou-se uma importante modalidade para a avaliação da função global e segmentar dos ventrículos. A avaliação do strain é uma medida estabelecida e confiável de quantificação de disfunção contrátil regional e global e possui a capacidade de detectar disfunção cardíaca subclínica sendo, portanto, uma ferramenta útil para a avaliação da função miocárdica. O ecocardiograma é, atualmente, o método mais disponível e de menor custo para a avaliação do strain, porém a análise pode ser prejudicada em pacientes com limitação de janela acústica.
19.2. Métodos de Aquisição do Strain pela Ressonância Magnética Cardíaca
O tagging miocárdico (“marcação miocárdica”) é a técnica mais validada em estudos e consiste em uma fase de preparação em que “tags” magnéticos (linhas pretas, tags) são ortogonalmente sobrepostas ao miocárdio no início de uma sequência de cine.12,418 Outra alternativa ao tagging que proporciona análise direta do strain miocárdico pela RMC são as técnicas de SENC (strain-encoded) e DENSE (displacement encoding with stimulated echoes).419 Recentemente, foi desenvolvido o método de feature tracking (FT), que permite a quantificação da deformação do miocárdio nas imagens tradicionais de cine RMC sem a necessidade de aquisições adicionais ou longa análise.420,421
Em todas as técnicas de análise do strain, os parâmetros de strain circunferencial e longitudinal globais foram mais reprodutíveis e consistentes do que os regionais.422 Mais detalhes sobre os métodos de aquisição do strain pela RMC podem ser obtidos nas referências.12,418-422
19.3. Strain do Ventrículo Direito pela Ressonância Magnética Cardíaca
A medida do strain miocárdico é um método preciso e prático de avaliação da função do VD, por se tratar de um marcador mais sensível e precoce de disfunção contrátil do que outros métodos disponíveis, como a FE. Estudos têm demonstrado o potencial do strain do VD, avaliado pela RMC, em fornecer informações aditivas e prognósticas independentes.423-428 Existem alguns estudos publicados nos quais os autores analisaram o strain do VD em indivíduos saudáveis e também em grupos-controle sem cardiopatia.423,426,429,430
As patologias que mais acometem o VD, como cardiopatias congênitas, HP e displasia arritmogênica (DAVD) foram as que tiveram maior aplicabilidade na análise do strain do VD. O FT–RMC (feature tracking pela RMC) foi utilizado em pacientes com tetralogia de Fallot corrigida, e os valores de strain estavam reduzidos nesses pacientes e estavam relacionados com parâmetros de função sistólica (FE biventricular) e também capacidade funcional no teste cardiopulmonar.425
A avaliação das funções globais e segmentares do VD é fundamental para o diagnóstico multiparamétrico de DAVD, e o strain do VD provou ser uma ferramenta extremamente útil.428,431 Os strains global e segmentar do VD estão significativamente reduzidos em pacientes com DAVD, independente das dimensões e função do VD, de modo que o comprometimento da deformação do VD pode representar um marcador precoce da doença.428
A Figura 19.1 apresenta exemplos de strain do VD em paciente normal e paciente com HP.
Figura 19.1. – Análise do strain longitudinal global pelo método de feature tracking em paciente com hipertensão pulmonar (acima) e sem hipertensão pulmonar (abaixo). O paciente com hipertensão pulmonar apresentou strain de 4,26% e o sem hipertensão pulmonar de 26,46%.
19.4. Strain do Ventrículo Esquerdo pela Ressonância Magnética Cardíaca
Os valores médios em indivíduos saudáveis dos tipos de strain do VE (SCG, SRG, SLG) foram pesquisados na última década através do FT–RMC,419-423 incluindo uma importante metanálise.424 Os maiores e mais recentes estudos em SCG e SR pelo FT-RMC aplicaram a análise da média de três cortes do eixo curto. A maior parte do SLGVE foi calculada através de um corte 4 câmaras, enquanto algumas publicações mais recentes trazem avaliações da média de três cortes longitudinais. Os valores do SLG e do SCG flutuam dentro de uma margem restrita, enquanto os valores de SRG tiveram intervalos de confiança mais amplos. Especula-se que a movimentação através do plano e a grande variabilidade pessoal podem explicar parcialmente esse fenômeno. Entretanto, a real causa ainda permanece incerta.424
Observa-se uma forte relação dos graus de deformação miocárdica com a presença de realce tardio (RT) miocárdico, em especial o SCG, mas também o SLG derivados do FT-RMC. Ademais, observa-se boa correlação entre as técnicas derivadas entre a ecocardiografia e a RMC.425
Na CMP dilatada, a presença de um SLG acentuadamente reduzido se relacionou fortemente com pior sobrevida, mesmo naqueles com FE muito reduzida, independentemente da classe funcional e outros achados da RMC.426 O FT-RMC pode identificar o subgrupo de portadores de IC com FE preservada e DD através do SLG alterado em comparação a indivíduos saudáveis.427
Na diferenciação entre pericardite constritiva (PC) e CMP restritiva, o SLG derivado da RMC apresentou valor diagnóstico similar ao do ecocardiograma, além de apresentar alto valor discriminatório entre essas patologias. Os valores de SLG são significativamente menores na CMP restritiva, enquanto na pericardite são próximos dos valores encontrados em controles normais.428 Os componentes longitudinal e circunferencial do strain são alterados também em casos de miocardite.429
Publicações que exploraram a capacidade do strain derivado pela ressonância usando tagging miocárdico demonstraram alta capacidade em determinar portadores de amiloidose com presença de RT, sendo potencialmente mais sensível que a própria sequencia pós-contraste.430 A perda do gradiente base-ápice do strain circunferencial parece representar um achado precoce das alterações observadas na doença de Fabry, já as modalidades de strain longitudinal e circunferencial não apresentaram variação significativa entre os controles sadios.431
Usando o FT-RMC, foi observado que pacientes com CMPH têm redução do SLG, SRG e SCG comparados com controles sadios, sendo o SLG e o SRG preditores de eventos adversos,432 assim como já foi demonstrado que o SLG é significativamente superior em pacientes portadores de HAS do que em portadores de CMPH.433
O diagnóstico da doença coronariana isquêmica pela RMC pode ser aperfeiçoado se adicionada a análise com FT-RMC, sendo possível detectar pequenas alterações no strain circunferencial após o estresse por dobutamina, podendo o SLG ser útil na detecção de infarto e avaliação de viabilidade.434 Os três tipos de strain estão reduzidos em pacientes que sofreram IAM com supradesnivelamento do segmento ST, sendo preditores independentes de eventos cardiovasculares adversos.435
Pacientes portadores de EA importante têm SLG e SCG reduzidos em relação aos controles sadios, a despeito dos sintomas apresentados.436 Em pacientes portadores de valva aórtica bicúspide e FE preservada, foram observados indícios de DD através de alterações no strain circunferencial.437 A cardiotoxicidade induzida por quimioterapia apresenta anormalidades no SLG e SCG muito antes do declínio da FEVE.438
Recentemente, foi reportado que o SLG pelo FT-RMC apresenta associação mais intensa com mortalidade do que os observados pela combinação da FEVE e pelo RT miocárdico. Até o momento, essa foi a maior experiência em avaliar o valor prognóstico do SLG avaliado pelo FT-RMC. Ajustado para fatores de risco clássicos, incluindo FEVE e RT, a piora de 1% no SLG foi associada a um aumento de 89% no risco de morte em pacientes isquêmicos e não isquêmicos.439
19.5. Strain do Átrio Esquerdo pela Ressonância Magnética Cardíaca
A avaliação da função do AE tem sido cada vez mais reconhecida como um fator crucial em uma diversidade de patologias cardíacas. Normalmente, sua alteração está associada a pior prognóstico e precede o estabelecimento de IC.
O AE tem a função de reservatório para a drenagem das veias pulmonares, servindo de conduto para a passagem do fluxo até o VE por diferença de pressão causada pela abertura das cúspides mitrais e por fim de função contrátil, com a sístole atrial ocorrendo no final da diástole do VE.440
A análise do strain atrial baseada em FT-RMC quantifica de forma confiável o strain longitudinal do AE e o strain rate. Usando imagens cine-RM padrão, ela discrimina entre pacientes com relaxamento ventricular esquerdo alterados e pacientes saudáveis, como podemos observar na Tabela 19.1.441 Em um subestudo do MESA, a redução no SLG atrial e alteração do volume indexado mínimo do AE foram fatores preditores independentes para a instalação de IC, mesmo ajustados para a massa do VE e pro-BNP.442 Da mesma forma, a avaliação da função fásica do AE foi um preditor de risco independente para a admissão por IC ou morte, mesmo após ajustar para o volume do AE e o remodelamento ventricular.443
Tabela 19.1. – Strain do átrio esquerdo.
| Tipos | ICFEp | CMPH | Normais |
|---|---|---|---|
| Reservatório | 16,3 ± 5,8 | 22,1 ± 5,5 | 29,1 ± 5,3 |
| Conduto | 11,9 ± 4,0 | 10,4 ± 3,9 | 21,3 ± 5,1 |
| Contrátil | 4,5 ± 2,9 | 11,7 ± 4,0 | 7,8 ± 2,5 |
CMPH: cardiomiopatia hipertrófica; ICFep: insuficiência cardíaca com fração de ejeção preservada.
19.6. Strain pela Tomografia Cardíaca
A avaliação do strain pela tomografia cardíaca (TC) pode ser realizada utilizando-se o método feature tracking (FT-TC) nas aquisições contrastadas e trigadas, com reconstruções funcionais do ciclo cardíaco. Os dados ainda são escassos, mas a sua aplicabilidade foi testada em algumas publicações recentes em pacientes portadores de EAo importante, submetidos a implante de prótese aórtica transcutânea. Os resultados demonstram valores similares do SLG entre a FT-TC e a derivada pelo ECO,444,445 assim como alta reprodutibilidade intraobservador e intraclasse para SLG FT-TC do VE, apesar de aparentemente subestimar os valores.444
Outra publicação explorou a relação do strain FT-TC com a doença isquêmica do coração em portadores de lesão significativa na artéria descendente anterior. Observou-se uma redução do strain longitudinal nos segmentos do território da artéria descendente anterior, a despeito de volumes diastólico, sistólico e FE normais.446
No momento, as limitações para a utilização do strain pela RMC e TC se devem à escassa disponibilidade e ao elevado custo de softwares de pós-processamento.
Footnotes
Realização: Departamento de Imagem Cardiovascular da Sociedade Brasileira de Cardiologia (DIC/SBC)
Nota: Estes posicionamentos se prestam a informar e não a substituir o julgamento clínico do médico que, em última análise, deve determinar o tratamento apropriado para seus pacientes.
Referências
- 1.Loizou CP, Pattichis CS, D’Hooge J. Handbook of Speckle Filtering and Tracking in Cardiovascular Ultrasound Imaging and Video. London: The Institution of Engineering and Technology; 2018. [Google Scholar]
- 2.Sutherland GR, Di Salvo G, Claus P, D’hooge J, Bijnens B. Strain and Strain Rate Imaging: A New Clinical Approach to Quantifying Regional Myocardial Function. J Am Soc Echocardiogr. 2004;17(7):788–802. doi: 10.1016/j.echo.2004.03.027. [DOI] [PubMed] [Google Scholar]
- 3.D’hooge J, Heimdal A, Jamal F, Kukulski T, Bijnens B, Rademakers F, et al. Regional Strain and Strain Rate Measurements by Cardiac Ultrasound: Principles, Implementation and Limitations. Eur J Echocardiogr. 2000;1(3):154–170. doi: 10.1053/euje.2000.0031. [DOI] [PubMed] [Google Scholar]
- 4.Tressino CG, Hortegal RA, Momesso M, Barretto RBM, Le Bihan D. Como eu Faço: Avaliação do Strain do Ventrículo Esquerdo. Arq Bras Cardiol: Imagem Cardiovasc. 2020;33(4):ecom15. doi: 10.47593/2675-312X/20203304ecom15. [DOI] [Google Scholar]
- 5.Hortegal R, Abensur H. Strain Echocardiography in Patients with Diastolic Dysfunction and Preserved Ejection Fraction: Are We Ready? Arq Bras Cardiol: Imagem Cardiovasc. 2017;30(4):132–139. doi: 10.5935/2318-8219.20170034. [DOI] [Google Scholar]
- 6.Bijnens B, Cikes M, Butakoff C, Sitges M, Crispi F. Myocardial Motion and Deformation: What Does It Tell Us and How Does It Relate to Function? Fetal Diagn Ther. 2012 1-2;32:5–16. doi: 10.1159/000335649. [DOI] [PubMed] [Google Scholar]
- 7.Voigt JU, Pedrizzetti G, Lysyansky P, Marwick TH, Houle H, Baumann R, et al. Definitions for a Common Standard for 2D Speckle Tracking Echocardiography: Consensus Document of the EACVI/ASE/Industry Task Force to Standardize Deformation Imaging. J Am Soc Echocardiogr. 2015;28(2):183–193. doi: 10.1016/j.echo.2014.11.003. [DOI] [PubMed] [Google Scholar]
- 8.Albuquerque PH, Del Castillo JM, Borba L, Ferro CM, Cabral C, Jr, Everaldo A, Filho, et al. Avaliação da Área de Risco Funcional pela Análise do Strain Miocárdico na Angina Instável. Arq Bras Cardiol: Imagem Cardiovasc. 2020;33(3):eabc73. doi: 10.5935/2318-8219.20200039. [DOI] [Google Scholar]
- 9.Collier P, Phelan D, Klein A. A Test in Context: Myocardial Strain Measured by Speckle-Tracking Echocardiography. J Am Coll Cardiol. 2017;69(8):1043–1056. doi: 10.1016/j.jacc.2016.12.012. [DOI] [PubMed] [Google Scholar]
- 10.Potter E, Marwick TH. Assessment of Left Ventricular Function by Echocardiography: The Case for Routinely Adding Global Longitudinal Strain to Ejection Fraction. JACC Cardiovasc Imaging. 2018;11(2):260–274. doi: 10.1016/j.jcmg.2017.11.017. Pt 1. [DOI] [PubMed] [Google Scholar]
- 11.Castel AL, Menet A, Ennezat PV, Delelis F, Le Goffic C, Binda C, et al. Global Longitudinal Strain Software Upgrade: Implications for Intervendor Consistency and Longitudinal Imaging Studies. Arch Cardiovasc Dis. 2016;109(1):22–30. doi: 10.1016/j.acvd.2015.08.006. [DOI] [PubMed] [Google Scholar]
- 12.Tee M, Noble JA, Bluemke DA. Imaging Techniques for Cardiac Strain and Deformation: Comparison of Echocardiography, Cardiac Magnetic Resonance and Cardiac Computed Tomography. Expert Rev Cardiovasc Ther. 2013;11(2):221–231. doi: 10.1586/erc.12.182. [DOI] [PubMed] [Google Scholar]
- 13.Farsalinos KE, Daraban AM, Ünlü S, Thomas JD, Badano LP, Voigt JU. Head-to-Head Comparison of Global Longitudinal Strain Measurements among Nine Different Vendors: The EACVI/ASE Inter-Vendor Comparison Study. J Am Soc Echocardiogr. 2015;28(10):1171–1181. doi: 10.1016/j.echo.2015.06.011. [DOI] [PubMed] [Google Scholar]
- 14.Mirea O, Pagourelias ED, Duchenne J, Bogaert J, Thomas JD, Badano LP, et al. Intervendor Differences in the Accuracy of Detecting Regional Functional Abnormalities: A Report From the EACVI-ASE Strain Standardization Task Force. JACC Cardiovasc Imaging. 2018;11(1):25–34. doi: 10.1016/j.jcmg.2017.02.014. [DOI] [PubMed] [Google Scholar]
- 15.Sousa RD, Regis CDM, Silva IDS, Szewierenko P, Hortegal RA, Abensur H. Software for Post-Processing Analysis of Strain Curves: The D-Station. Arq Bras Cardiol. 2020;114(3):496–506. doi: 10.36660/abc.20180403. [DOI] [PMC free article] [PubMed] [Google Scholar]
- 16.Voigt JU, Cvijic M. 2- and 3-Dimensional Myocardial Strain in Cardiac Health and Disease. JACC Cardiovasc Imaging. 2019;12(9):1849–1863. doi: 10.1016/j.jcmg.2019.01.044. [DOI] [PubMed] [Google Scholar]
- 17.Buggey J, Alenezi F, Yoon HJ, Phelan M, DeVore AD, Khouri MG, et al. Left Ventricular Global Longitudinal Strain in Patients with Heart Failure with Preserved Ejection Fraction: Outcomes Following an Acute Heart Failure Hospitalization. ESC Heart Fail. 2017;4(4):432–439. doi: 10.1002/ehf2.12159. [DOI] [PMC free article] [PubMed] [Google Scholar]
- 18.Nahum J, Bensaid A, Dussault C, Macron L, Clémence D, Bouhemad B, et al. Impact of Longitudinal Myocardial Deformation on the Prognosis of Chronic Heart Failure Patients. Circ Cardiovasc Imaging. 2010;3(3):249–256. doi: 10.1161/CIRCIMAGING.109.910893. [DOI] [PubMed] [Google Scholar]
- 19.Motoki H, Borowski AG, Shrestha K, Hu B, Kusunose K, Troughton RW, et al. Right Ventricular Global Longitudinal Strain Provides Prognostic Value Incremental to Left Ventricular Ejection Fraction in Patients with Heart Failure. J Am Soc Echocardiogr. 2014;27(7):726–732. doi: 10.1016/j.echo.2014.02.007. [DOI] [PubMed] [Google Scholar]
- 20.Phelan D, Collier P, Thavendiranathan P, Popović ZB, Hanna M, Plana JC, et al. Relative Apical Sparing of longitudinal Strain Using Two-Dimensional Speckle-Tracking Echocardiography is Both Sensitive and Specific for the Diagnosis of Cardiac Amyloidosis. Heart. 2012;98(19):1442–1448. doi: 10.1136/heartjnl-2012-302353. [DOI] [PubMed] [Google Scholar]
- 21.Plana JC, Galderisi M, Barac A, Ewer MS, Ky B, Scherrer-Crosbie M, et al. Expert Consensus for Multimodality Imaging Evaluation of Adult Patients During and after Cancer Therapy: A Report from the American Society of Echocardiography and the European Association of Cardiovascular Imaging. Eur Heart J Cardiovasc Imaging. 2014;15(10):1063–1093. doi: 10.1093/ehjci/jeu192. [DOI] [PMC free article] [PubMed] [Google Scholar]
- 22.Writing Group Members. Doherty JU, Kort S, Mehran R, Schoenhagen P, Soman P, et al. ACC/AATS/AHA/ASE/ASNC/HRS/SCAI/SCCT/SCMR/STS 2019 Appropriate Use Criteria for Multimodality Imaging in the Assessment of Cardiac Structure and Function in Nonvalvular Heart Disease: A Report of the American College of Cardiology Appropriate Use Criteria Task Force, American Association for Thoracic Surgery, American Heart Association, American Society of Echocardiography, American Society of Nuclear Cardiology, Heart Rhythm Society, Society for Cardiovascular Angiography and Interventions, Society of Cardiovascular Computed Tomography, Society for Cardiovascular Magnetic Resonance, and the Society of Thoracic Surgeons. J Am Soc Echocardiogr. 2019;32(5):553–579. doi: 10.1016/j.echo.2019.01.008. [DOI] [PubMed] [Google Scholar]
- 23.Hajjar LA, Costa IBSDSD, Lopes MACQ, Hoff PMG, Diz MDPE, Fonseca SMR, et al. Brazilian Cardio-oncology Guideline - 2020. Arq Bras Cardiol. 2020;115(5):1006–1043. doi: 10.36660/abc.20201006. [DOI] [PMC free article] [PubMed] [Google Scholar]
- 24.McMurray JJ, Packer M, Desai AS, Gong J, Lefkowitz MP, Rizkala AR, et al. Angiotensin-Neprilysin Inhibition versus Enalapril in Heart Failure. N Engl J Med. 2014;371(11):993–1004. doi: 10.1056/NEJMoa1409077. [DOI] [PubMed] [Google Scholar]
- 25.Pocock SJ, Ariti CA, McMurray JJ, Maggioni A, Køber L, Squire IB, et al. Predicting Survival in Heart Failure: A Risk Score Based on 39 372 Patients from 30 Studies. Eur Heart J. 2013;34(19):1404–1413. doi: 10.1093/eurheartj/ehs337. [DOI] [PubMed] [Google Scholar]
- 26.Ponikowski P, Voors AA, Anker SD, Bueno H, Cleland JG, Coats AJ, et al. 2016 ESC Guidelines for the Diagnosis and Treatment of Acute and Chronic Heart Failure: The Task Force for the Diagnosis and Treatment of Acute and Chronic Heart Failure of the European Society of Cardiology (ESC). Developed with the Special Contribution of the Heart Failure Association (HFA) of the ESC. Eur J Heart Fail. 2016;18(8):891–975. doi: 10.1002/ejhf.592. [DOI] [PubMed] [Google Scholar]
- 27.Zamorano JL, Lancellotti P, Muñoz DR, Aboyans V, Asteggiano R, Galderisi M, et al. 2016 ESC Position Paper on Cancer Treatments and Cardiovascular Toxicity Developed Under the Auspices of the ESC Committee for Practice Guidelines: The Task Force for Cancer Treatments and Cardiovascular Toxicity of the European Society of Cardiology (ESC) Eur J Heart Fail. 2017;19(1):9–42. doi: 10.1002/ejhf.654. [DOI] [PubMed] [Google Scholar]
- 28.Thavendiranathan P, Grant AD, Negishi T, Plana JC, Popović ZB, Marwick TH. Reproducibility of Echocardiographic Techniques for Sequential Assessment of Left Ventricular Ejection Fraction and Volumes: Application to Patients Undergoing Cancer Chemotherapy. J Am Coll Cardiol. 2013;61(1):77–84. doi: 10.1016/j.jacc.2012.09.035. [DOI] [PubMed] [Google Scholar]
- 29.Thavendiranathan P, Liu S, Verhaert D, Calleja A, Nitinunu A, van Houten T, et al. Feasibility, Accuracy, and Reproducibility of Real-Time Full-Volume 3D Transthoracic Echocardiography to Measure LV Volumes and Systolic Function: A Fully Automated Endocardial Contouring Algorithm in Sinus Rhythm and Atrial Fibrillation. JACC Cardiovasc Imaging. 2012;5(3):239–251. doi: 10.1016/j.jcmg.2011.12.012. [DOI] [PubMed] [Google Scholar]
- 30.Knight DS, Zumbo G, Barcella W, Steeden JA, Muthurangu V, Martinez-Naharro A, et al. Cardiac Structural and Functional Consequences of Amyloid Deposition by Cardiac Magnetic Resonance and Echocardiography and Their Prognostic Roles. JACC Cardiovasc Imaging. 2019;12(5):823–833. doi: 10.1016/j.jcmg.2018.02.016. [DOI] [PubMed] [Google Scholar]
- 31.Dedobbeleer C, Rai M, Donal E, Pandolfo M, Unger P. Normal Left Ventricular Ejection Fraction and Mass but Subclinical Myocardial Dysfunction in Patients with Friedreich’s Ataxia. Eur Heart J Cardiovasc Imaging. 2012;13(4):346–352. doi: 10.1093/ejechocard/jer267. [DOI] [PubMed] [Google Scholar]
- 32.Stanton T, Leano R, Marwick TH. Prediction of All-Cause Mortality from Global Longitudinal Speckle Strain: Comparison with Ejection Fraction and Wall Motion Scoring. Circ Cardiovasc Imaging. 2009;2(5):356–364. doi: 10.1161/CIRCIMAGING.109.862334. [DOI] [PubMed] [Google Scholar]
- 33.Smiseth OA, Torp H, Opdahl A, Haugaa KH, Urheim S. Myocardial Strain Imaging: How Useful is it in Clinical Decision Making? Eur Heart J. 2016;37(15):1196–1207. doi: 10.1093/eurheartj/ehv529. [DOI] [PMC free article] [PubMed] [Google Scholar]
- 34.Ünlü S, Mirea O, Duchenne J, Pagourelias ED, Bézy S, Thomas JD, et al. Comparison of Feasibility, Accuracy, and Reproducibility of Layer-Specific Global Longitudinal Strain Measurements among Five Different Vendors: A Report from the EACVI-ASE Strain Standardization Task Force. J Am Soc Echocardiogr. 2018;31(3):374–380.e1. doi: 10.1016/j.echo.2017.11.008. [DOI] [PubMed] [Google Scholar]
- 35.Lang RM, Badano LP, Mor-Avi V, Afilalo J, Armstrong A, Ernande L, et al. Recommendations for Cardiac Chamber Quantification by Echocardiography in Adults: An Update from the American Society of Echocardiography and the European Association of Cardiovascular Imaging. J Am Soc Echocardiogr. 2015;28(1):1–39.e14. doi: 10.1016/j.echo.2014.10.003. [DOI] [PubMed] [Google Scholar]
- 36.Longobardo L, Suma V, Jain R, Carerj S, Zito C, Zwicke DL, et al. Role of Two-Dimensional Speckle-Tracking Echocardiography Strain in the Assessment of Right Ventricular Systolic Function and Comparison with Conventional Parameters. J Am Soc Echocardiogr. 2017;30(10):937–946.e6. doi: 10.1016/j.echo.2017.06.016. [DOI] [PubMed] [Google Scholar]
- 37.Pathan F, D’Elia N, Nolan MT, Marwick TH, Negishi K. Normal Ranges of Left Atrial Strain by Speckle-Tracking Echocardiography: A Systematic Review and Meta-Analysis. J Am Soc Echocardiogr. 2017;30(1):59–70.e8. doi: 10.1016/j.echo.2016.09.007. [DOI] [PubMed] [Google Scholar]
- 38.Sugimoto T, Robinet S, Dulgheru R, Bernard A, Ilardi F, Contu L, et al. Echocardiographic Reference Ranges for Normal Left Atrial Function Parameters: Results from the EACVI NORRE Study. Eur Heart J Cardiovasc Imaging. 2018;19(6):630–638. doi: 10.1093/ehjci/jey018. [DOI] [PubMed] [Google Scholar]
- 39.Oikonomou EK, Kokkinidis DG, Kampaktsis PN, Amir EA, Marwick TH, Gupta D, et al. Assessment of Prognostic Value of Left Ventricular Global Longitudinal Strain for Early Prediction of Chemotherapy-Induced Cardiotoxicity: A Systematic Review and Meta-analysis. JAMA Cardiol. 2019;4(10):1007–1018. doi: 10.1001/jamacardio.2019.2952. [DOI] [PMC free article] [PubMed] [Google Scholar]
- 40.Singh A, Voss WB, Lentz RW, Thomas JD, Akhter N. The Diagnostic and Prognostic Value of Echocardiographic Strain. JAMA Cardiol. 2019;4(6):580–588. doi: 10.1001/jamacardio.2019.1152. [DOI] [PubMed] [Google Scholar]
- 41.Thomas L, Marwick TH, Popescu BA, Donal E, Badano LP. Left Atrial Structure and Function, and Left Ventricular Diastolic Dysfunction: JACC State-of-the-Art Review. J Am Coll Cardiol. 2019;73(15):1961–1977. doi: 10.1016/j.jacc.2019.01.059. [DOI] [PubMed] [Google Scholar]
- 42.Felker GM, Thompson RE, Hare JM, Hruban RH, Clemetson DE, Howard DL, et al. Underlying Causes and Long-Term Survival in Patients with Initially Unexplained Cardiomyopathy. N Engl J Med. 2000;342(15):1077–1084. doi: 10.1056/NEJM200004133421502. [DOI] [PubMed] [Google Scholar]
- 43.Hooning MJ, Botma A, Aleman BM, Baaijens MH, Bartelink H, Klijn JG, et al. Long-Term Risk of Cardiovascular Disease in 10-Year Survivors of Breast Cancer. J Natl Cancer Inst. 2007;99(5):365–375. doi: 10.1093/jnci/djk064. [DOI] [PubMed] [Google Scholar]
- 44.Monsuez JJ, Charniot JC, Vignat N, Artigou JY. Cardiac Side-Effects of Cancer Chemotherapy. Int J Cardiol. 2010;144(1):3–15. doi: 10.1016/j.ijcard.2010.03.003. [DOI] [PubMed] [Google Scholar]
- 45.Yeh ET, Tong AT, Lenihan DJ, Yusuf SW, Swafford J, Champion C, et al. Cardiovascular Complications of Cancer Therapy: Diagnosis, Pathogenesis, and Management. Circulation. 2004;109(25):3122–3131. doi: 10.1161/01.CIR.0000133187.74800.B9. [DOI] [PubMed] [Google Scholar]
- 46.Cardinale D, Colombo A, Lamantia G, Colombo N, Civelli M, De Giacomi G, et al. Anthracycline-Induced Cardiomyopathy: Clinical Relevance and Response to Pharmacologic Therapy. J Am Coll Cardiol. 2010;55(3):213–220. doi: 10.1016/j.jacc.2009.03.095. [DOI] [PubMed] [Google Scholar]
- 47.Negishi K, Negishi T, Haluska BA, Hare JL, Plana JC, Marwick TH. Use of Speckle Strain to Assess Left Ventricular Responses to Cardiotoxic Chemotherapy and Cardioprotection. Eur Heart J Cardiovasc Imaging. 2014;15(3):324–331. doi: 10.1093/ehjci/jet159. [DOI] [PubMed] [Google Scholar]
- 48.Ewer MS, Lenihan DJ. Left Ventricular Ejection Fraction and Cardiotoxicity: Is Our Ear Really to The Ground? J Clin Oncol. 2008;26(8):1201–1203. doi: 10.1200/JCO.2007.14.8742. [DOI] [PubMed] [Google Scholar]
- 49.Swain SM, Whaley FS, Ewer MS. Congestive Heart Failure in Patients Treated with Doxorubicin: A Retrospective Analysis of Three Trials. Cancer. 2003;97(11):2869–2879. doi: 10.1002/cncr.11407. [DOI] [PubMed] [Google Scholar]
- 50.Armstrong GT, Plana JC, Zhang N, Srivastava D, Green DM, Ness KK, et al. Screening Adult Survivors of Childhood Cancer for Cardiomyopathy: Comparison of Echocardiography and Cardiac Magnetic Resonance Imaging. J Clin Oncol. 2012;30(23):2876–2884. doi: 10.1200/JCO.2011.40.3584. [DOI] [PMC free article] [PubMed] [Google Scholar]
- 51.Cardinale D, Colombo A, Bacchiani G, Tedeschi I, Meroni CA, Veglia F, et al. Early Detection of Anthracycline Cardiotoxicity and Improvement with Heart Failure Therapy. Circulation. 2015;131(22):1981–1988. doi: 10.1161/CIRCULATIONAHA.114.013777. [DOI] [PubMed] [Google Scholar]
- 52.Amundsen BH, Helle-Valle T, Edvardsen T, Torp H, Crosby J, Lyseggen E, et al. Noninvasive Myocardial Strain Measurement by Speckle Tracking Echocardiography: Validation Against Sonomicrometry and Tagged Magnetic Resonance Imaging. J Am Coll Cardiol. 2006;47(4):789–793. doi: 10.1016/j.jacc.2005.10.040. [DOI] [PubMed] [Google Scholar]
- 53.Korinek J, Wang J, Sengupta PP, Miyazaki C, Kjaergaard J, McMahon E, et al. Two-Dimensional Strain--A Doppler-Independent Ultrasound Method for quantitation of Regional Deformation: Validation In Vitro and In Vivo. J Am Soc Echocardiogr. 2005;18(12):1247–1253. doi: 10.1016/j.echo.2005.03.024. [DOI] [PubMed] [Google Scholar]
- 54.Negishi K, Negishi T, Hare JL, Haluska BA, Plana JC, Marwick TH. Independent and Incremental Value of Deformation Indices for Prediction of Trastuzumab-Induced Cardiotoxicity. J Am Soc Echocardiogr. 2013;26(5):493–498. doi: 10.1016/j.echo.2013.02.008. [DOI] [PubMed] [Google Scholar]
- 55.Sawaya H, Sebag IA, Plana JC, Januzzi JL, Ky B, Cohen V, et al. Early Detection and Prediction of Cardiotoxicity in Chemotherapy-Treated Patients. Am J Cardiol. 2011;107(9):1375–1380. doi: 10.1016/j.amjcard.2011.01.006. [DOI] [PMC free article] [PubMed] [Google Scholar]
- 56.Sawaya H, Sebag IA, Plana JC, Januzzi JL, Ky B, Tan TC, et al. Assessment of Echocardiography and Biomarkers for the Extended Prediction of Cardiotoxicity in Patients Treated with Anthracyclines, Taxanes, and Trastuzumab. Circ Cardiovasc Imaging. 2012;5(5):596–603. doi: 10.1161/CIRCIMAGING.112.973321. [DOI] [PMC free article] [PubMed] [Google Scholar]
- 57.Thavendiranathan P, Poulin F, Lim KD, Plana JC, Woo A, Marwick TH. Use of Myocardial Strain Imaging by Echocardiography for the Early Detection of Cardiotoxicity in Patients During and after Cancer Chemotherapy: A Systematic Review. J Am Coll Cardiol. 2014;63(25):2751–2768. doi: 10.1016/j.jacc.2014.01.073. Pt A. [DOI] [PubMed] [Google Scholar]
- 58.Negishi T, Thavendiranathan P, Negishi K, Marwick TH, SUCCOUR investigators Rationale and Design of the Strain Surveillance of Chemotherapy for Improving Cardiovascular Outcomes: The SUCCOUR Trial. JACC Cardiovasc Imaging. 2018;11(8):1098–1105. doi: 10.1016/j.jcmg.2018.03.019. [DOI] [PubMed] [Google Scholar]
- 59.Abate E, Hoogslag GE, Antoni ML, Nucifora G, Delgado V, Holman ER, et al. Value of Three-Dimensional Speckle-Tracking Longitudinal Strain for Predicting Improvement of Left Ventricular Function after Acute Myocardial Infarction. Am J Cardiol. 2012;110(7):961–967. doi: 10.1016/j.amjcard.2012.05.023. [DOI] [PubMed] [Google Scholar]
- 60.Galderisi M, Esposito R, Schiano-Lomoriello V, Santoro A, Ippolito R, Schiattarella P, et al. Correlates of Global Area Strain in Native Hypertensive Patients: A Three-Dimensional Speckle-Tracking Echocardiography Study. Eur Heart J Cardiovasc Imaging. 2012;13(9):730–738. doi: 10.1093/ehjci/jes026. [DOI] [PubMed] [Google Scholar]
- 61.Mor-Avi V, Sugeng L, Lang RM. Real-time 3-Dimensional Echocardiography: An Integral Component of the Routine Echocardiographic Examination in Adult Patients? Circulation. 2009;119(2):314–329. doi: 10.1161/CIRCULATIONAHA.107.751354. [DOI] [PubMed] [Google Scholar]
- 62.Urbano-Moral JA, Arias-Godinez JA, Ahmad R, Malik R, Kiernan MS, DeNofrio D, et al. Evaluation of Myocardial Mechanics with Three-Dimensional Speckle Tracking Echocardiography in Heart Transplant Recipients: Comparison with Two-Dimensional Speckle Tracking and Relationship with Clinical Variables. Eur Heart J Cardiovasc Imaging. 2013;14(12):1167–1173. doi: 10.1093/ehjci/jet065. [DOI] [PubMed] [Google Scholar]
- 63.Miyoshi T, Tanaka H, Kaneko A, Tatsumi K, Matsumoto K, Minami H, et al. Left Ventricular Endocardial Dysfunction in Patients with Preserved Ejection Fraction after Receiving Anthracycline. Echocardiography. 2014;31(7):848–857. doi: 10.1111/echo.12473. [DOI] [PubMed] [Google Scholar]
- 64.Santoro C, Arpino G, Esposito R, Lembo M, Paciolla I, Cardalesi C, et al. 2D and 3D Strain for Detection of Subclinical Anthracycline Cardiotoxicity in Breast Cancer Patients: A Balance with Feasibility. Eur Heart J Cardiovasc Imaging. 2017;18(8):930–936. doi: 10.1093/ehjci/jex033. [DOI] [PubMed] [Google Scholar]
- 65.Tarr A, Stoebe S, Tuennemann J, Baka Z, Pfeiffer D, Varga A, et al. Early Detection of Cardiotoxicity by 2D and 3D Deformation Imaging in Patients Receiving Chemotherapy. Echo Res Pract. 2015;2(3):81–88. doi: 10.1530/ERP-14-0084. [DOI] [PMC free article] [PubMed] [Google Scholar]
- 66.Piveta RB, Rodrigues ACT, Vieira MLC, Fischer CH, Afonso TR, Daminello E, et al. Early Changes in Myocardial Mechanics Detected by 3-Dimensional Speckle Tracking Echocardiography in Patients Treated with Low Doses of Anthracyclines. JACC Cardiovasc Imaging. 2018;11(11):1729–1731. doi: 10.1016/j.jcmg.2018.04.014. [DOI] [PubMed] [Google Scholar]
- 67.Nagueh SF, Smiseth OA, Appleton CP, Byrd BF, 3rd, Dokainish H, Edvardsen T, et al. Recommendations for the Evaluation of Left Ventricular Diastolic Function by Echocardiography: An Update from the American Society of Echocardiography and the European Association of Cardiovascular Imaging. Eur Heart J Cardiovasc Imaging. 2016;17(12):1321–1360. doi: 10.1093/ehjci/jew082. [DOI] [PubMed] [Google Scholar]
- 68.Redfield MM, Jacobsen SJ, Burnett JC, Jr, Mahoney DW, Bailey KR, Rodeheffer RJ. Burden of Systolic and Diastolic Ventricular Dysfunction in the Community: Appreciating the Scope of the Heart Failure Epidemic. JAMA. 2003;289(2):194–202. doi: 10.1001/jama.289.2.194. [DOI] [PubMed] [Google Scholar]
- 69.Senni M, Tribouilloy CM, Rodeheffer RJ, Jacobsen SJ, Evans JM, Bailey KR, et al. Congestive Heart Failure in the Community: A Study of All Incident Cases in Olmsted County, Minnesota, in 1991. Circulation. 1998;98(21):2282–2289. doi: 10.1161/01.cir.98.21.2282. [DOI] [PubMed] [Google Scholar]
- 70.Nagueh SF. Left Ventricular Diastolic Function: Understanding Pathophysiology, Diagnosis, and Prognosis with Echocardiography. JACC Cardiovasc Imaging. 2020;13(1):228–244. doi: 10.1016/j.jcmg.2018.10.038. Pt 2. [DOI] [PubMed] [Google Scholar]
- 71.Almeida JG, Fontes-Carvalho R, Sampaio F, Ribeiro J, Bettencourt P, Flachskampf FA, et al. Impact of the 2016 ASE/EACVI Recommendations on the Prevalence of Diastolic Dysfunction in the General Population. Eur Heart J Cardiovasc Imaging. 2018;19(4):380–386. doi: 10.1093/ehjci/jex252. [DOI] [PubMed] [Google Scholar]
- 72.Kosmala W, Rojek A, Przewlocka-Kosmala M, Mysiak A, Karolko B, Marwick TH. Contributions of Nondiastolic Factors to Exercise Intolerance in Heart Failure with Preserved Ejection Fraction. J Am Coll Cardiol. 2016;67(6):659–670. doi: 10.1016/j.jacc.2015.10.096. [DOI] [PubMed] [Google Scholar]
- 73.Freed BH, Daruwalla V, Cheng JY, Aguilar FG, Beussink L, Choi A, et al. Prognostic Utility and Clinical Significance of Cardiac Mechanics in Heart Failure with Preserved Ejection Fraction: Importance of Left Atrial Strain. 10.1161/CIRCIMAGING.115.003754e003754Circ Cardiovasc Imaging. 2016;9(3) doi: 10.1161/CIRCIMAGING.115.003754. [DOI] [PMC free article] [PubMed] [Google Scholar]
- 74.Oh JK, Miranda WR, Bird JG, Kane GC, Nagueh SF. The 2016 Diastolic Function Guideline: Is it Already Time to Revisit or Revise Them? JACC Cardiovasc Imaging. 2020;13(1):327–335. doi: 10.1016/j.jcmg.2019.12.004. Pt 2. [DOI] [PubMed] [Google Scholar]
- 75.Lejeune S, Roy C, Ciocea V, Slimani A, Meester C, Amzulescu M, et al. Right Ventricular Global Longitudinal Strain and Outcomes in Heart Failure with Preserved Ejection Fraction. J Am Soc Echocardiogr. 2020;33(8):973–984.e2. doi: 10.1016/j.echo.2020.02.016. [DOI] [PubMed] [Google Scholar]
- 76.Wang J, Khoury DS, Thohan V, Torre-Amione G, Nagueh SF. Global Diastolic Strain Rate for the Assessment of Left Ventricular Relaxation and Filling Pressures. Circulation. 2007;115(11):1376–1383. doi: 10.1161/CIRCULATIONAHA.106.662882. [DOI] [PubMed] [Google Scholar]
- 77.Dokainish H, Sengupta R, Pillai M, Bobek J, Lakkis N. Usefulness of New Diastolic Strain and Strain Rate Indexes for the Estimation of Left Ventricular Filling Pressure. Am J Cardiol. 2008;101(10):1504–1509. doi: 10.1016/j.amjcard.2008.01.037. [DOI] [PubMed] [Google Scholar]
- 78.Hayashi T, Yamada S, Iwano H, Nakabachi M, Sakakibara M, Okada K, et al. Left Ventricular Global Strain for Estimating Relaxation and Filling Pressure - A Multicenter Study. Circ J. 2016;80(5):1163–1170. doi: 10.1253/circj.CJ-16-0106. [DOI] [PubMed] [Google Scholar]
- 79.Stokke TM, Hasselberg NE, Smedsrud MK, Sarvari SI, Haugaa KH, Smiseth OA, et al. Geometry as a Confounder when Assessing Ventricular Systolic Function: Comparison between Ejection Fraction and Strain. J Am Coll Cardiol. 2017;70(8):942–954. doi: 10.1016/j.jacc.2017.06.046. [DOI] [PubMed] [Google Scholar]
- 80.Shah AM, Claggett B, Sweitzer NK, Shah SJ, Anand IS, Liu L, et al. Prognostic Importance of Impaired Systolic Function in Heart Failure with Preserved Ejection Fraction and the Impact of Spironolactone. Circulation. 2015;132(5):402–414. doi: 10.1161/CIRCULATIONAHA.115.015884. [DOI] [PMC free article] [PubMed] [Google Scholar]
- 81.Bianco CM, Farjo PD, Ghaffar YA, Sengupta PP. Myocardial Mechanics in Patients with Normal LVEF and Diastolic Dysfunction. JACC Cardiovasc Imaging. 2020;13(1):258–271. doi: 10.1016/j.jcmg.2018.12.035. Pt 2. [DOI] [PubMed] [Google Scholar]
- 82.Morris DA, Ma XX, Belyavskiy E, Kumar RA, Kropf M, Kraft R, et al. Left Ventricular Longitudinal Systolic Function Analysed by 2D Speckle-Tracking Echocardiography in Heart Failure with Preserved Ejection Fraction: A Meta-Analysis. Open Heart. 2017;4(2):e000630. doi: 10.1136/openhrt-2017-000630. [DOI] [PMC free article] [PubMed] [Google Scholar]
- 83.Pieske B, Tschöpe C, Boer RA, Fraser AG, Anker SD, Donal E, et al. How to Diagnose Heart Failure with Preserved Ejection Fraction: The HFA-PEFF Diagnostic Algorithm: A Consensus Recommendation from the Heart Failure Association (HFA) of the European Society of Cardiology (ESC) Eur Heart J. 2019;40(40):3297–3317. doi: 10.1093/eurheartj/ehz641. [DOI] [PubMed] [Google Scholar]
- 84.Genovese D, Singh A, Volpato V, Kruse E, Weinert L, Yamat M, et al. Load Dependency of Left Atrial Strain in Normal Subjects. J Am Soc Echocardiogr. 2018;31(11):1221–1228. doi: 10.1016/j.echo.2018.07.016. [DOI] [PMC free article] [PubMed] [Google Scholar]
- 85.Mandoli GE, Sisti N, Mondillo S, Cameli M. Left Atrial Strain in Left Ventricular Diastolic Dysfunction: Have we Finally Found the Missing Piece of the Puzzle? Heart Fail Rev. 2020;25(3):409–417. doi: 10.1007/s10741-019-09889-9. [DOI] [PubMed] [Google Scholar]
- 86.Brecht A, Oertelt-Prigione S, Seeland U, Rücke M, Hättasch R, Wagelöhner T, et al. Left Atrial Function in Preclinical Diastolic Dysfunction: Two-Dimensional Speckle-Tracking Echocardiography-Derived Results from the BEFRI Trial. J Am Soc Echocardiogr. 2016;29(8):750–758. doi: 10.1016/j.echo.2016.03.013. [DOI] [PubMed] [Google Scholar]
- 87.Thomas L, Abhayaratna WP. Left Atrial Reverse Remodeling: Mechanisms, Evaluation, and Clinical Significance. JACC Cardiovasc Imaging. 2017;10(1):65–77. doi: 10.1016/j.jcmg.2016.11.003. [DOI] [PubMed] [Google Scholar]
- 88.Santos AB, Roca GQ, Claggett B, Sweitzer NK, Shah SJ, Anand IS, et al. Prognostic Relevance of Left Atrial Dysfunction in Heart Failure with Preserved Ejection Fraction. Circ Heart Fail. 2016;9(4):e002763. doi: 10.1161/CIRCHEARTFAILURE.115.002763. [DOI] [PMC free article] [PubMed] [Google Scholar]
- 89.Fernandes RM, Le Bihan D, Vilela AA, Barretto RBM, Santos ES, Assef JE, et al. Association between Left Atrial Strain and Left Ventricular Diastolic Function in Patients with Acute Coronary Syndrome. J Echocardiogr. 2019;17(3):138–146. doi: 10.1007/s12574-018-0403-7. [DOI] [PubMed] [Google Scholar]
- 90.Singh A, Addetia K, Maffessanti F, Mor-Avi V, Lang RM. LA Strain for Categorization of LV Diastolic Dysfunction. JACC Cardiovasc Imaging. 2017;10(7):735–743. doi: 10.1016/j.jcmg.2016.08.014. [DOI] [PMC free article] [PubMed] [Google Scholar]
- 91.Thomas L, Muraru D, Popescu BA, Sitges M, Rosca M, Pedrizzetti G, et al. Evaluation of Left Atrial Size and Function: Relevance for Clinical Practice. J Am Soc Echocardiogr. 2020;33(8):934–952. doi: 10.1016/j.echo.2020.03.021. [DOI] [PubMed] [Google Scholar]
- 92.Badano LP, Kolias TJ, Muraru D, Abraham TP, Aurigemma G, Edvardsen T, et al. Standardization of Left Atrial, Right Ventricular, and Right Atrial Deformation Imaging Using Two-Dimensional Speckle Tracking Echocardiography: A Consensus Document of the EACVI/ASE/Industry Task Force to Standardize Deformation Imaging. Eur Heart J Cardiovasc Imaging. 2018;19(6):591–600. doi: 10.1093/ehjci/jey042. [DOI] [PubMed] [Google Scholar]
- 93.Morris DA, Belyavskiy E, Aravind-Kumar R, Kropf M, Frydas A, Braunauer K, et al. Potential Usefulness and Clinical Relevance of Adding Left Atrial Strain to Left Atrial Volume Index in the Detection of Left Ventricular Diastolic Dysfunction. JACC Cardiovasc Imaging. 2018;11(10):1405–1415. doi: 10.1016/j.jcmg.2017.07.029. [DOI] [PubMed] [Google Scholar]
- 94.Tossavainen E, Henein MY, Grönlund C, Lindqvist P. Left Atrial Intrinsic Strain Rate Correcting for Pulmonary Wedge Pressure Is Accurate in Estimating Pulmonary Vascular Resistance in Breathless Patients. Echocardiography. 2016;33(8):1156–1165. doi: 10.1111/echo.13226. [DOI] [PubMed] [Google Scholar]
- 95.Singh A, Medvedofsky D, Mediratta A, Balaney B, Kruse E, Ciszek B, et al. Peak Left Atrial Strain as a Single Measure for the Non-Invasive Assessment of Left Ventricular Filling Pressures. Int J Cardiovasc Imaging. 2019;35(1):23–32. doi: 10.1007/s10554-018-1425-y. [DOI] [PMC free article] [PubMed] [Google Scholar]
- 96.Cameli M, Mandoli GE, Loiacono F, Dini FL, Henein M, Mondillo S. Left Atrial Strain: A New Parameter for Assessment of Left Ventricular Filling Pressure. Heart Fail Rev. 2016;21(1):65–76. doi: 10.1007/s10741-015-9520-9. [DOI] [PubMed] [Google Scholar]
- 97.Potter EL, Ramkumar S, Kawakami H, Yang H, Wright L, Negishi T, et al. Association of Asymptomatic Diastolic Dysfunction Assessed by Left Atrial Strain with Incident Heart Failure. JACC Cardiovasc Imaging. 2020;13(11):2316–2326. doi: 10.1016/j.jcmg.2020.04.028. [DOI] [PubMed] [Google Scholar]
- 98.Park JJ, Park JH, Hwang IC, Park JB, Cho GY, Marwick TH. Left Atrial Strain as a Predictor of New-Onset Atrial Fibrillation in Patients with Heart Failure. JACC Cardiovasc Imaging. 2020;13(10):2071–2081. doi: 10.1016/j.jcmg.2020.04.031. [DOI] [PubMed] [Google Scholar]
- 99.Marwick TH, Chandrashekhar Y. Left Atrial Strain: Part of the Solution to Taming the Vicious Twins. JACC Cardiovasc Imaging. 2020;13(10):2278–2279. doi: 10.1016/j.jcmg.2020.09.001. [DOI] [PubMed] [Google Scholar]
- 100.Negishi K, Negishi T, Kurosawa K, Hristova K, Popescu BA, Vinereanu D, et al. Practical Guidance in Echocardiographic Assessment of Global Longitudinal Strain. JACC Cardiovasc Imaging. 2015;8(4):489–492. doi: 10.1016/j.jcmg.2014.06.013. [DOI] [PubMed] [Google Scholar]
- 101.Haji K, Wong C, Wright L, Ramkumar S, Marwick TH. Left Atrial Strain Performance and its Application in Clinical Practice. JACC Cardiovasc Imaging. 2019;12(6):1093–1101. doi: 10.1016/j.jcmg.2018.11.009. [DOI] [PubMed] [Google Scholar]
- 102.Report of the WHO/ISFC Task Force on The Definition and Classification of Cardiomyopathies. Br Heart J. 1980;44(6):672–673. doi: 10.1136/hrt.44.6.672. [DOI] [PMC free article] [PubMed] [Google Scholar]
- 103.Richardson P, McKenna W, Bristow M, Maisch B, Mautner B, O’Connell J, et al. Report of the 1995 World Health Organization/International Society and Federation of Cardiology Task Force on the Definition and Classification of Cardiomyopathies. Circulation. 1996;93(5):841–842. doi: 10.1161/01.cir.93.5.841. [DOI] [PubMed] [Google Scholar]
- 104.Dec GW, Fuster V. Idiopathic Dilated Cardiomyopathy. N Engl J Med. 1994;331(23):1564–1575. doi: 10.1056/NEJM199412083312307. [DOI] [PubMed] [Google Scholar]
- 105.Luk A, Ahn E, Soor GS, Butany J. Dilated Cardiomyopathy: A Review. J Clin Pathol. 2009;62(3):219–225. doi: 10.1136/jcp.2008.060731. [DOI] [PubMed] [Google Scholar]
- 106.Elliott P. Cardiomyopathy. Diagnosis and Management of Dilated Cardiomyopathy. Heart. 2000;84(1):106–112. doi: 10.1136/heart.84.1.106. [DOI] [PMC free article] [PubMed] [Google Scholar]
- 107.Manolio TA, Baughman KL, Rodeheffer R, Pearson TA, Bristow JD, Michels VV, et al. Prevalence and Etiology of Idiopathic Dilated Cardiomyopathy (Summary of a National Heart, Lung, and Blood Institute Workshop. Am J Cardiol. 1992;69(17):1458–1466. doi: 10.1016/0002-9149(92)90901-a. [DOI] [PubMed] [Google Scholar]
- 108.Abduch MC, Salgo I, Tsang W, Vieira ML, Cruz V, Lima M, et al. Myocardial Deformation by Speckle Tracking in Severe Dilated Cardiomyopathy. Arq Bras Cardiol. 2012;99(3):834–843. doi: 10.1590/s0066-782x2012005000086. [DOI] [PubMed] [Google Scholar]
- 109.Lima MS, Villarraga HR, Abduch MC, Lima MF, Cruz CB, Bittencourt MS, et al. Comprehensive Left Ventricular Mechanics Analysis by Speckle Tracking Echocardiography in Chagas disease. 20Cardiovasc Ultrasound. 2016;14(1) doi: 10.1186/s12947-016-0062-7. [DOI] [PMC free article] [PubMed] [Google Scholar]
- 110.Meluzin J, Spinarova L, Hude P, Krejci J, Poloczkova H, Podrouzkova H, et al. Left Ventricular Mechanics in Idiopathic Dilated Cardiomyopathy: Systolic-Diastolic Coupling and Torsion. J Am Soc Echocardiogr. 2009;22(5):486–493. doi: 10.1016/j.echo.2009.02.022. [DOI] [PubMed] [Google Scholar]
- 111.Saito M, Okayama H, Nishimura K, Ogimoto A, Ohtsuka T, Inoue K, et al. Determinants of Left Ventricular Untwisting Behaviour in Patients with Dilated Cardiomyopathy: Analysis by Two-Dimensional Speckle Tracking. Heart. 2009;95(4):290–296. doi: 10.1136/hrt.2008.145979. [DOI] [PubMed] [Google Scholar]
- 112.Abduch MC, Alencar AM, Mathias W, Jr, Vieira ML. Cardiac Mechanics Evaluated by Speckle Tracking Echocardiography. Arq Bras Cardiol. 2014;102(4):403–412. doi: 10.5935/abc.20140041. [DOI] [PMC free article] [PubMed] [Google Scholar]
- 113.Sengeløv M, Jørgensen PG, Jensen JS, Bruun NE, Olsen FJ, Fritz-Hansen T, et al. Global Longitudinal Strain Is a Superior Predictor of All-Cause Mortality in Heart Failure with Reduced Ejection Fraction. JACC Cardiovasc Imaging. 2015;8(12):1351–1359. doi: 10.1016/j.jcmg.2015.07.013. [DOI] [PubMed] [Google Scholar]
- 114.Adamo L, Perry A, Novak E, Makan M, Lindman BR, Mann DL. Abnormal Global Longitudinal Strain Predicts Future Deterioration of Left Ventricular Function in Heart Failure Patients with a Recovered Left Ventricular Ejection Fraction. Circ Heart Fail. 2017;10(6):e003788. doi: 10.1161/CIRCHEARTFAILURE.116.003788. [DOI] [PMC free article] [PubMed] [Google Scholar]
- 115.Sen-Chowdhry S, Lowe MD, Sporton SC, McKenna WJ. Arrhythmogenic Right Ventricular Cardiomyopathy: Clinical Presentation, Diagnosis, and Management. Am J Med. 2004;117(9):685–695. doi: 10.1016/j.amjmed.2004.04.028. [DOI] [PubMed] [Google Scholar]
- 116.Gemayel C, Pelliccia A, Thompson PD. Arrhythmogenic Right Ventricular Cardiomyopathy. J Am Coll Cardiol. 2001;38(7):1773–1781. doi: 10.1016/s0735-1097(01)01654-0. [DOI] [PubMed] [Google Scholar]
- 117.Al-Khatib SM, Stevenson WG, Ackerman MJ, Bryant WJ, Callans DJ, Curtis AB, et al. 2017 AHA/ACC/HRS Guideline for Management of Patients with Ventricular Arrhythmias and the Prevention of Sudden Cardiac Death: Executive Summary: A Report of the American College of Cardiology/American Heart Association Task Force on Clinical Practice Guidelines and the Heart Rhythm Society. Heart Rhythm. 2018;15(10):e190–e252. doi: 10.1016/j.hrthm.2017.10.035. [DOI] [PubMed] [Google Scholar]
- 118.Prakasa KR, Wang J, Tandri H, Dalal D, Bomma C, Chojnowski R, et al. Utility of Tissue Doppler and Strain Echocardiography in Arrhythmogenic Right Ventricular Dysplasia/Cardiomyopathy. Am J Cardiol. 2007;100(3):507–512. doi: 10.1016/j.amjcard.2007.03.053. [DOI] [PubMed] [Google Scholar]
- 119.Malik N, Win S, James CA, Kutty S, Mukherjee M, Gilotra NA, et al. Right Ventricular Strain Predicts Structural Disease Progression in Patients with Arrhythmogenic Right Ventricular Cardiomyopathy. J Am Heart Assoc. 2020;9(7):e015016. doi: 10.1161/JAHA.119.015016. [DOI] [PMC free article] [PubMed] [Google Scholar]
- 120.Anwer S, Guastafierro F, Erhart L, Costa S, Akdis D, Schuermann M, et al. Right Atrial Strain and Cardiovascular Outcome in Arrhythmogenic Right Ventricular Cardiomyopathy. Eur Heart J Cardiovasc Imaging. 2022;23(7):970–978. doi: 10.1093/ehjci/jeac070. [DOI] [PubMed] [Google Scholar]
- 121.Klues HG, Schiffers A, Maron BJ. Phenotypic Spectrum and Patterns of Left Ventricular Hypertrophy in Hypertrophic Cardiomyopathy: Morphologic Observations and Significance as Assessed by Two-Dimensional Echocardiography in 600 Patients. J Am Coll Cardiol. 1995;26(7):1699–1708. doi: 10.1016/0735-1097(95)00390-8. [DOI] [PubMed] [Google Scholar]
- 122.Olivotto I, Cecchi F, Casey SA, Dolara A, Traverse JH, Maron BJ. Impact of Atrial Fibrillation on the Clinical Course of Hypertrophic Cardiomyopathy. Circulation. 2001;104(21):2517–2524. doi: 10.1161/hc4601.097997. [DOI] [PubMed] [Google Scholar]
- 123.Elliott PM, Anastasakis A, Borger MA, Borggrefe M, Cecchi F, Charron P, et al. 2014 ESC Guidelines on Diagnosis and Management of Hypertrophic Cardiomyopathy: The Task Force for the Diagnosis and Management of Hypertrophic Cardiomyopathy of the European Society of Cardiology (ESC) Eur Heart J. 2014;35(39):2733–2779. doi: 10.1093/eurheartj/ehu284. [DOI] [PubMed] [Google Scholar]
- 124.Maron MS, Olivotto I, Betocchi S, Casey SA, Lesser JR, Losi MA, et al. Effect of Left Ventricular Outflow Tract Obstruction on Clinical Outcome in Hypertrophic Cardiomyopathy. N Engl J Med. 2003;348(4):295–303. doi: 10.1056/NEJMoa021332. [DOI] [PubMed] [Google Scholar]
- 125.Panza JA, Petrone RK, Fananapazir L, Maron BJ. Utility of Continuous Wave Doppler Echocardiography in the Noninvasive Assessment of Left Ventricular Outflow Tract Pressure Gradient in Patients with Hypertrophic Cardiomyopathy. J Am Coll Cardiol. 1992;19(1):91–99. doi: 10.1016/0735-1097(92)90057-t. [DOI] [PubMed] [Google Scholar]
- 126.Tigen K, Sunbul M, Karaahmet T, Dundar C, Ozben B, Guler A, et al. Left Ventricular and Atrial Functions in Hypertrophic Cardiomyopathy Patients with Very High LVOT Gradient: A Speckle Tracking Echocardiographic Study. Echocardiography. 2014;31(7):833–841. doi: 10.1111/echo.12482. [DOI] [PubMed] [Google Scholar]
- 127.Serri K, Reant P, Lafitte M, Berhouet M, Le Bouffos V, Roudaut R, et al. Global and Regional Myocardial Function Quantification by Two-Dimensional Strain: Application in Hypertrophic Cardiomyopathy. J Am Coll Cardiol. 2006;47(6):1175–1181. doi: 10.1016/j.jacc.2005.10.061. [DOI] [PubMed] [Google Scholar]
- 128.Chen S, Yuan J, Qiao S, Duan F, Zhang J, Wang H. Evaluation of Left Ventricular Diastolic Function by Global Strain Rate Imaging in Patients with Obstructive Hypertrophic Cardiomyopathy: A Simultaneous Speckle Tracking Echocardiography and Cardiac Catheterization Study. Echocardiography. 2014;31(5):615–622. doi: 10.1111/echo.12424. [DOI] [PubMed] [Google Scholar]
- 129.Almaas VM, Haugaa KH, Strøm EH, Scott H, Smith HJ, Dahl CP, et al. Noninvasive Assessment of Myocardial Fibrosis in Patients with Obstructive Hypertrophic Cardiomyopathy. Heart. 2014;100(8):631–638. doi: 10.1136/heartjnl-2013-304923. [DOI] [PubMed] [Google Scholar]
- 130.Haland TF, Almaas VM, Hasselberg NE, Saberniak J, Leren IS, Hopp E, et al. Strain Echocardiography is Related to Fibrosis and Ventricular Arrhythmias in Hypertrophic Cardiomyopathy. Eur Heart J Cardiovasc Imaging. 2016;17(6):613–621. doi: 10.1093/ehjci/jew005. [DOI] [PMC free article] [PubMed] [Google Scholar]
- 131.Liu H, Pozios I, Haileselassie B, Nowbar A, Sorensen LL, Phillip S, et al. Role of Global Longitudinal Strain in Predicting Outcomes in Hypertrophic Cardiomyopathy. Am J Cardiol. 2017;120(4):670–675. doi: 10.1016/j.amjcard.2017.05.039. [DOI] [PubMed] [Google Scholar]
- 132.Badran HM, Faheem N, Ibrahim WA, Elnoamany MF, Elsedi M, Yacoub M. Systolic Function Reserve Using Two-Dimensional Strain Imaging in Hypertrophic Cardiomyopathy: Comparison with Essential Hypertension. J Am Soc Echocardiogr. 2013;26(12):1397–1406. doi: 10.1016/j.echo.2013.08.026. [DOI] [PubMed] [Google Scholar]
- 133.Hiemstra YL, Debonnaire P, Bootsma M, van Zwet EW, Delgado V, Schalij MJ, et al. Global Longitudinal Strain and Left Atrial Volume Index Provide Incremental Prognostic Value in Patients with Hypertrophic Cardiomyopathy. Circ Cardiovasc Imaging. 2017;10(7):e005706. doi: 10.1161/CIRCIMAGING.116.005706. [DOI] [PubMed] [Google Scholar]
- 134.Zegkos T, Parcharidou D, Ntelios D, Efthimiadis G, Karvounis H. The Prognostic Implications of Two-Dimensional Speckle Tracking Echocardiography in Hypertrophic Cardiomyopathy: Current and Future Perspectives. Cardiol Rev. 2018;26(3):130–136. doi: 10.1097/CRD.0000000000000172. [DOI] [PubMed] [Google Scholar]
- 135.Salemi VM, Leite JJ, Picard MH, Oliveira LM, Reis SF, Pena JL, et al. Echocardiographic Predictors of Functional Capacity in Endomyocardial Fibrosis Patients. Eur J Echocardiogr. 2009;10(3):400–405. doi: 10.1093/ejechocard/jen297. [DOI] [PubMed] [Google Scholar]
- 136.Scatularo CE, Martínez ELP, Saldarriaga C, Ballesteros OA, Baranchuk A, Liprandi AS, et al. Endomyocardiofibrosis: A Systematic Review. Curr Probl Cardiol. 2021;46(4):100784. doi: 10.1016/j.cpcardiol.2020.100784. [DOI] [PubMed] [Google Scholar]
- 137.Valero AR, Orts FJC, Muci T, Blasco PM. Endomyocardial Fibrosis and Apical Thrombus in Patient with Hypereosinophilia. Eur Heart J. 2019;40(40):3364–3365. doi: 10.1093/eurheartj/ehz529. [DOI] [PubMed] [Google Scholar]
- 138.Badami VM, Reece J, Sengupta S. Biventricular Thrombosis in a Young Male. 1179Eur Heart J Cardiovasc Imaging. 2019;20(10) doi: 10.1093/ehjci/jez064. [DOI] [PubMed] [Google Scholar]
- 139.Ashwal AJ, Mugula SR, Samanth J, Paramasivam G, Nayak K, Padmakumar R. Role of Deformation Imaging in Left Ventricular Non-Compaction and Hypertrophic Cardiomyopathy: An Indian Perspective. 6Egypt Heart J. 2020;72(1) doi: 10.1186/s43044-020-0041-z. [DOI] [PMC free article] [PubMed] [Google Scholar]
- 140.Tarando F, Coisne D, Galli E, Rousseau C, Viera F, Bosseau C, et al. Left Ventricular Non-Compaction and Idiopathic Dilated Cardiomyopathy: The Significant Diagnostic Value of Longitudinal Strain. Int J Cardiovasc Imaging. 2017;33(1):83–95. doi: 10.1007/s10554-016-0980-3. [DOI] [PubMed] [Google Scholar]
- 141.van Dalen BM, Caliskan K, Soliman OI, Kauer F, van der Zwaan HB, Vletter WB, et al. Diagnostic Value of Rigid Body Rotation in Noncompaction Cardiomyopathy. J Am Soc Echocardiogr. 2011;24(5):548–555. doi: 10.1016/j.echo.2011.01.002. [DOI] [PubMed] [Google Scholar]
- 142.Peters F, Khandheria BK, Libhaber E, Maharaj N, Santos C, Matioda H, et al. Left Ventricular Twist in Left Ventricular Noncompaction. Eur Heart J Cardiovasc Imaging. 2014;15(1):48–55. doi: 10.1093/ehjci/jet076. [DOI] [PubMed] [Google Scholar]
- 143.Nawaytou HM, Montero AE, Yubbu P, Calderón-Anyosa RJC, Sato T, O’Connor MJ, et al. A Preliminary Study of Left Ventricular Rotational Mechanics in Children with Noncompaction Cardiomyopathy: Do They Influence Ventricular Function? J Am Soc Echocardiogr. 2018;31(8):951–961. doi: 10.1016/j.echo.2018.02.015. [DOI] [PubMed] [Google Scholar]
- 144.Arunamata A, Stringer J, Balasubramanian S, Tacy TA, Silverman NH, Punn R. Cardiac Segmental Strain Analysis in Pediatric Left Ventricular Noncompaction Cardiomyopathy. J Am Soc Echocardiogr. 2019;32(6):763–773.e1. doi: 10.1016/j.echo.2019.01.014. [DOI] [PubMed] [Google Scholar]
- 145.Tarasoutchi F, Montera MW, Ramos AIO, Sampaio RO, Rosa VEE, Accorsi TAD, et al. Update of the Brazilian Guidelines for Valvular Heart Disease - 2020. Arq Bras Cardiol. 2020;115(4):720–775. doi: 10.36660/abc.20201047.. [DOI] [PMC free article] [PubMed] [Google Scholar]
- 146.Barberato SH, Romano MMD, Beck ALS, Rodrigues ACT, Almeida ALC, Assunção BMBL, et al. Position Statement on Indications of Echocardiography in Adults - 2019. Arq Bras Cardiol. 2019;113(1):135–181. doi: 10.5935/abc.20190129. [DOI] [PMC free article] [PubMed] [Google Scholar]
- 147.Baumgartner H, Falk V, Bax JJ, De Bonis M, Hamm C, Holm PJ, et al. 2017 ESC/EACTS Guidelines for the Management of Valvular Heart Disease. Eur Heart J. 2017;38(36):2739–2791. doi: 10.1093/eurheartj/ehx391. [DOI] [PubMed] [Google Scholar]
- 148.Nishimura RA, Otto CM, Bonow RO, Carabello BA, Erwin JP, 3rd, Guyton RA, et al. 2014 AHA/ACC Guideline for the Management of Patients with Valvular Heart Disease: A Report of the American College of Cardiology/American Heart Association Task Force on Practice Guidelines. J Am Coll Cardiol. 2014;63(22):e57–185. doi: 10.1016/j.jacc.2014.02.536. [DOI] [PubMed] [Google Scholar]
- 149.Vahanian A, Beyersdorf F, Praz F, Milojevic M, Baldus S, Bauersachs J, et al. 2021 ESC/EACTS Guidelines for the Management of Valvular Heart Disease. Eur J Cardiothorac Surg. 2021;60(4):727–800. doi: 10.1093/ejcts/ezab389. [DOI] [PubMed] [Google Scholar]
- 150.Suri RM, Schaff HV, Dearani JA, Sundt TM, Daly RC, Mullany CJ, et al. Recovery of Left Ventricular Function after Surgical Correction of Mitral Regurgitation Caused by Leaflet Prolapse. J Thorac Cardiovasc Surg. 2009;137(5):1071–1076. doi: 10.1016/j.jtcvs.2008.10.026. [DOI] [PubMed] [Google Scholar]
- 151.Enriquez-Sarano M, Schaff HV, Orszulak TA, Bailey KR, Tajik AJ, Frye RL. Congestive Heart Failure after Surgical Correction of Mitral Regurgitation. A Long-Term Study. Circulation. 1995;92(9):2496–2503. doi: 10.1161/01.cir.92.9.2496. [DOI] [PubMed] [Google Scholar]
- 152.Pandis D, Sengupta PP, Castillo JG, Caracciolo G, Fischer GW, Narula J, et al. Assessment of Longitudinal Myocardial Mechanics in Patients with Degenerative Mitral Valve Regurgitation Predicts Postoperative Worsening of Left Ventricular Systolic Function. J Am Soc Echocardiogr. 2014;27(6):627–638. doi: 10.1016/j.echo.2014.02.008. [DOI] [PubMed] [Google Scholar]
- 153.Mascle S, Schnell F, Thebault C, Corbineau H, Laurent M, Hamonic S, et al. Predictive Value of Global Longitudinal Strain in a Surgical Population of Organic Mitral Regurgitation. J Am Soc Echocardiogr. 2012;25(7):766–772. doi: 10.1016/j.echo.2012.04.009. [DOI] [PubMed] [Google Scholar]
- 154.Witkowski TG, Thomas JD, Debonnaire PJ, Delgado V, Hoke U, Ewe SH, et al. Global Longitudinal Strain Predicts Left Ventricular Dysfunction after Mitral Valve Repair. Eur Heart J Cardiovasc Imaging. 2013;14(1):69–76. doi: 10.1093/ehjci/jes155. [DOI] [PubMed] [Google Scholar]
- 155.Kim HM, Cho GY, Hwang IC, Choi HM, Park JB, Yoon YE, et al. Myocardial Strain in Prediction of Outcomes after Surgery for Severe Mitral Regurgitation. JACC Cardiovasc Imaging. 2018;11(9):1235–1244. doi: 10.1016/j.jcmg.2018.03.016. [DOI] [PubMed] [Google Scholar]
- 156.Marciniak A, Sutherland GR, Marciniak M, Claus P, Bijnens B, Jahangiri M. Myocardial Deformation Abnormalities in Patients with Aortic Regurgitation: A Strain Rate Imaging Study. Eur J Echocardiogr. 2009;10(1):112–119. doi: 10.1093/ejechocard/jen185. [DOI] [PubMed] [Google Scholar]
- 157.Alashi A, Mentias A, Abdallah A, Feng K, Gillinov AM, Rodriguez LL, et al. Incremental Prognostic Utility of Left Ventricular Global Longitudinal Strain in Asymptomatic Patients with Significant Chronic Aortic Regurgitation and Preserved Left Ventricular Ejection Fraction. JACC Cardiovasc Imaging. 2018;11(5):673–682. doi: 10.1016/j.jcmg.2017.02.016. [DOI] [PubMed] [Google Scholar]
- 158.Alashi A, Khullar T, Mentias A, Gillinov AM, Roselli EE, Svensson LG, et al. Long-Term Outcomes After Aortic Valve Surgery in Patients with Asymptomatic Chronic Aortic Regurgitation and Preserved LVEF: Impact of Baseline and Follow-Up Global Longitudinal Strain. JACC Cardiovasc Imaging. 2020;13(1):12–21. doi: 10.1016/j.jcmg.2018.12.021. Pt 1. [DOI] [PubMed] [Google Scholar]
- 159.Dahl JS, Magne J, Pellikka PA, Donal E, Marwick TH. Assessment of Subclinical Left Ventricular Dysfunction in Aortic Stenosis. JACC Cardiovasc Imaging. 2019;12(1):163–171. doi: 10.1016/j.jcmg.2018.08.040. [DOI] [PubMed] [Google Scholar]
- 160.Ng AC, Delgado V, Bertini M, Antoni ML, van Bommel RJ, van Rijnsoever EP, et al. Alterations in Multidirectional Myocardial Functions in Patients with Aortic Stenosis and preserved Ejection Fraction: A Two-Dimensional Speckle Tracking Analysis. Eur Heart J. 2011;32(12):1542–1550. doi: 10.1093/eurheartj/ehr084. [DOI] [PubMed] [Google Scholar]
- 161.Lafitte S, Perlant M, Reant P, Serri K, Douard H, DeMaria A, et al. Impact of Impaired Myocardial Deformations on Exercise Tolerance and Prognosis in Patients with Asymptomatic Aortic Stenosis. Eur J Echocardiogr. 2009;10(3):414–419. doi: 10.1093/ejechocard/jen299. [DOI] [PubMed] [Google Scholar]
- 162.Lancellotti P, Donal E, Magne J, Moonen M, O’Connor K, Daubert JC, et al. Risk Stratification in Asymptomatic Moderate to Severe Aortic Stenosis: The Importance of The Valvular, Arterial and Ventricular Interplay. Heart. 2010;96(17):1364–1371. doi: 10.1136/hrt.2009.190942. [DOI] [PubMed] [Google Scholar]
- 163.Yingchoncharoen T, Gibby C, Rodriguez LL, Grimm RA, Marwick TH. Association of Myocardial Deformation with Outcome in Asymptomatic Aortic Stenosis with Normal Ejection Fraction. Circ Cardiovasc Imaging. 2012;5(6):719–725. doi: 10.1161/CIRCIMAGING.112.977348. [DOI] [PubMed] [Google Scholar]
- 164.Kearney LG, Lu K, Ord M, Patel SK, Profitis K, Matalanis G, et al. Global Longitudinal Strain is a Strong Independent Predictor of All-Cause Mortality in Patients with Aortic Stenosis. Eur Heart J Cardiovasc Imaging. 2012;13(10):827–833. doi: 10.1093/ehjci/jes115. [DOI] [PubMed] [Google Scholar]
- 165.Magne J, Cosyns B, Popescu BA, Carstensen HG, Dahl J, Desai MY, et al. Distribution and Prognostic Significance of Left Ventricular Global Longitudinal Strain in Asymptomatic Significant Aortic Stenosis: An Individual Participant Data Meta-Analysis. JACC Cardiovasc Imaging. 2019;12(1):84–92. doi: 10.1016/j.jcmg.2018.11.005. [DOI] [PubMed] [Google Scholar]
- 166.Liou K, Negishi K, Ho S, Russell EA, Cranney G, Ooi SY. Detection of Obstructive Coronary Artery Disease Using Peak Systolic Global Longitudinal Strain Derived by Two-Dimensional Speckle-Tracking: A Systematic Review and Meta-Analysis. J Am Soc Echocardiogr. 2016;29(8):724–735.e4. doi: 10.1016/j.echo.2016.03.002. [DOI] [PubMed] [Google Scholar]
- 167.Hashimoto I, Li X, Bhat AH, Jones M, Zetts AD, Sahn DJ. Myocardial Strain Rate is a Superior Method for Evaluation of left Ventricular Subendocardial Function Compared with Tissue Doppler Imaging. J Am Coll Cardiol. 2003;42(9):1574–1583. doi: 10.1016/j.jacc.2003.05.002. [DOI] [PubMed] [Google Scholar]
- 168.Gjesdal O, Hopp E, Vartdal T, Lunde K, Helle-Valle T, Aakhus S, et al. Global Longitudinal Strain Measured by Two-Dimensional Speckle Tracking Echocardiography is Closely Related to Myocardial Infarct Size in Chronic Ischaemic Heart Disease. Clin Sci. 2007;113(6):287–296. doi: 10.1042/CS20070066. [DOI] [PubMed] [Google Scholar]
- 169.Delgado V, Mollema SA, Ypenburg C, Tops LF, van der Wall EE, Schalij MJ, et al. Relation between Global Left Ventricular Longitudinal Strain Assessed with Novel Automated Function Imaging and Biplane Left Ventricular Ejection Fraction in Patients with coronary artery disease. J Am Soc Echocardiogr. 2008;21(11):1244–1250. doi: 10.1016/j.echo.2008.08.010. [DOI] [PubMed] [Google Scholar]
- 170.Korosoglou G, Haars A, Humpert PM, Hardt S, Bekeredjian R, Giannitsis E, et al. Evaluation of Myocardial Perfusion and Deformation in Patients with Acute Myocardial Infarction Treated with Primary Angioplasty and Stent Placement. Coron Artery Dis. 2008;19(7):497–506. doi: 10.1097/MCA.0b013e328310904e. [DOI] [PubMed] [Google Scholar]
- 171.Tanaka H, Kawai H, Tatsumi K, Kataoka T, Onishi T, Nose T, et al. Improved Regional Myocardial Diastolic Function Assessed by Strain Rate Imaging in Patients with coronary Artery Disease Undergoing Percutaneous Coronary Intervention. J Am Soc Echocardiogr. 2006;19(6):756–762. doi: 10.1016/j.echo.2006.01.008. [DOI] [PubMed] [Google Scholar]
- 172.Esmaeilzadeh M, Khaledifar A, Maleki M, Sadeghpour A, Samiei N, Moladoust H, et al. Evaluation of Left Ventricular Systolic and Diastolic Regional Function after Enhanced External Counter Pulsation Therapy Using Strain Rate Imaging. Eur J Echocardiogr. 2009;10(1):120–126. doi: 10.1093/ejechocard/jen183. [DOI] [PubMed] [Google Scholar]
- 173.Takeuchi M, Nishikage T, Nakai H, Kokumai M, Otani S, Lang RM. The Assessment of Left Ventricular Twist in Anterior Wall Myocardial Infarction Using Two-Dimensional Speckle Tracking Imaging. J Am Soc Echocardiogr. 2007;20(1):36–44. doi: 10.1016/j.echo.2006.06.019. [DOI] [PubMed] [Google Scholar]
- 174.Kim RJ, Wu E, Rafael A, Chen EL, Parker MA, Simonetti O, et al. The Use of Contrast-Enhanced Magnetic Resonance Imaging to Identify Reversible Myocardial Dysfunction. N Engl J Med. 2000;343(20):1445–1453. doi: 10.1056/NEJM200011163432003. [DOI] [PubMed] [Google Scholar]
- 175.Becker M, Hoffmann R, Kühl HP, Grawe H, Katoh M, Kramann R, et al. Analysis of Myocardial Deformation Based on Ultrasonic Pixel Tracking to Determine Transmurality in Chronic Myocardial Infarction. Eur Heart J. 2006;27(21):2560–2566. doi: 10.1093/eurheartj/ehl288. [DOI] [PubMed] [Google Scholar]
- 176.Roes SD, Mollema SA, Lamb HJ, van der Wall EE, Roos A, Bax JJ. Validation of Echocardiographic Two-Dimensional Speckle Tracking Longitudinal Strain Imaging for Viability Assessment in Patients with Chronic Ischemic Left Ventricular Dysfunction and Comparison with Contrast-Enhanced Magnetic Resonance Imaging. Am J Cardiol. 2009;104(3):312–317. doi: 10.1016/j.amjcard.2009.03.040. [DOI] [PubMed] [Google Scholar]
- 177.Geyer H, Caracciolo G, Abe H, Wilansky S, Carerj S, Gentile F, et al. Assessment of Myocardial Mechanics Using Speckle Tracking Echocardiography: Fundamentals and Clinical Applications. J Am Soc Echocardiogr. 2010;23(4):351–369. doi: 10.1016/j.echo.2010.02.015. [DOI] [PubMed] [Google Scholar]
- 178.Caspar T, Samet H, Ohana M, Germain P, El Ghannudi S, Talha S, et al. Longitudinal 2D Strain Can Help Diagnose Coronary Artery Disease in patIents with Suspected Non-ST-Elevation Acute Coronary Syndrome but Apparent Normal Global and Segmental Systolic Function. Int J Cardiol. 2017;236:91–94. doi: 10.1016/j.ijcard.2017.02.068. [DOI] [PubMed] [Google Scholar]
- 179.Prastaro M, Pirozzi E, Gaibazzi N, Paolillo S, Santoro C, Savarese G, et al. Expert Review on the Prognostic Role of Echocardiography after Acute Myocardial Infarction. J Am Soc Echocardiogr. 2017;30(5):431–443.e2. doi: 10.1016/j.echo.2017.01.020. [DOI] [PubMed] [Google Scholar]
- 180.Eek C, Grenne B, Brunvand H, Aakhus S, Endresen K, Smiseth OA, et al. Strain Echocardiography Predicts Acute Coronary Occlusion in Patients with Non-ST-Segment Elevation Acute Coronary Syndrome. Eur J Echocardiogr. 2010;11(6):501–508. doi: 10.1093/ejechocard/jeq008. [DOI] [PubMed] [Google Scholar]
- 181.Mollema SA, Delgado V, Bertini M, Antoni ML, Boersma E, Holman ER, et al. Viability Assessment with Global Left Ventricular Longitudinal Strain Predicts Recovery of Left Ventricular Function after Acute Myocardial Infarction. Circ Cardiovasc Imaging. 2010;3(1):15–23. doi: 10.1161/CIRCIMAGING.108.802785. [DOI] [PubMed] [Google Scholar]
- 182.Bhutani M, Vatsa D, Rahatekar P, Verma D, Nath RK, Pandit N. Role of Strain Imaging for Assessment of Myocardial Viability in Symptomatic Myocardial Infarction with Single Vessel Disease: An Observational Study. Echocardiography. 2020;37(1):55–61. doi: 10.1111/echo.14567. [DOI] [PubMed] [Google Scholar]
- 183.Biering-Sørensen T, Hoffmann S, Mogelvang R, Iversen AZ, Galatius S, Fritz-Hansen T, et al. Myocardial Strain Analysis by 2-Dimensional Speckle Tracking Echocardiography Improves Diagnostics of Coronary Artery Stenosis in Stable Angina Pectoris. Circ Cardiovasc Imaging. 2014;7(1):58–65. doi: 10.1161/CIRCIMAGING.113.000989. [DOI] [PubMed] [Google Scholar]
- 184.Skulstad H, Edvardsen T, Urheim S, Rabben SI, Stugaard M, Lyseggen E, et al. Postsystolic Shortening in Ischemic Myocardium: Active Contraction or Passive Recoil? Circulation. 2002;106(6):718–724. doi: 10.1161/01.cir.0000024102.55150.b6. [DOI] [PubMed] [Google Scholar]
- 185.Dahlslett T, Karlsen S, Grenne B, Eek C, Sjøli B, Skulstad H, et al. Early Assessment of Strain Echocardiography Can Accurately Exclude Significant Coronary Artery Stenosis In Suspected Non-St-Segment Elevation Acute Coronary Syndrome. J Am Soc Echocardiogr. 2014;27(5):512–519. doi: 10.1016/j.echo.2014.01.019. [DOI] [PubMed] [Google Scholar]
- 186.Tsai WC, Liu YW, Huang YY, Lin CC, Lee CH, Tsai LM. Diagnostic Value of Segmental Longitudinal Strain by Automated Function Imaging in Coronary Artery Disease without Left Ventricular Dysfunction. J Am Soc Echocardiogr. 2010;23(11):1183–1189. doi: 10.1016/j.echo.2010.08.011. [DOI] [PubMed] [Google Scholar]
- 187.Mada RO, Duchenne J, Voigt JU. Tissue Doppler, Strain and Strain Rate in Ischemic Heart Disease “How I Do It”. 38Cardiovasc Ultrasound. 2014;12 doi: 10.1186/1476-7120-12-38. [DOI] [PMC free article] [PubMed] [Google Scholar]
- 188.Voigt JU, Lindenmeier G, Exner B, Regenfus M, Werner D, Reulbach U, et al. Incidence and Characteristics of Segmental Postsystolic Longitudinal Shortening in Normal, Acutely Ischemic, and Scarred Myocardium. J Am Soc Echocardiogr. 2003;16(5):415–423. doi: 10.1016/s0894-7317(03)00111-1. [DOI] [PubMed] [Google Scholar]
- 189.van Mourik MJW, Zaar DVJ, Smulders MW, Heijman J, Lumens J, Dokter JE, et al. Adding Speckle-Tracking Echocardiography to Visual Assessment of Systolic Wall Motion Abnormalities Improves the Detection of Myocardial Infarction. J Am Soc Echocardiogr. 2019;32(1):65–73. doi: 10.1016/j.echo.2018.09.007. [DOI] [PubMed] [Google Scholar]
- 190.Joyce E, Hoogslag GE, Leong DP, Debonnaire P, Katsanos S, Boden H, et al. Association between Left Ventricular Global Longitudinal Strain and Adverse Left Ventricular Dilatation after ST-Segment-Elevation Myocardial Infarction. Circ Cardiovasc Imaging. 2014;7(1):74–81. doi: 10.1161/CIRCIMAGING.113.000982. [DOI] [PubMed] [Google Scholar]
- 191.Ersbøll M, Valeur N, Mogensen UM, Andersen MJ, Møller JE, Velazquez EJ, et al. Prediction of All-Cause Mortality and Heart Failure Admissions from Global Left Ventricular Longitudinal Strain in Patients with Acute Myocardial Infarction and Preserved Left Ventricular Ejection Fraction. J Am Coll Cardiol. 2013;61(23):2365–2373. doi: 10.1016/j.jacc.2013.02.061. [DOI] [PubMed] [Google Scholar]
- 192.Bertini M, Ng AC, Antoni ML, Nucifora G, Ewe SH, Auger D, et al. Global Longitudinal Strain Predicts Long-Term Survival in Patients with Chronic Ischemic Cardiomyopathy. Circ Cardiovasc Imaging. 2012;5(3):383–391. doi: 10.1161/CIRCIMAGING.111.970434. [DOI] [PubMed] [Google Scholar]
- 193.Haugaa KH, Smedsrud MK, Steen T, Kongsgaard E, Loennechen JP, Skjaerpe T, et al. Mechanical Dispersion Assessed by Myocardial Strain in Patients after Myocardial Infarction for Risk Prediction of Ventricular Arrhythmia. JACC Cardiovasc Imaging. 2010;3(3):247–256. doi: 10.1016/j.jcmg.2009.11.012. [DOI] [PubMed] [Google Scholar]
- 194.Gecmen C, Candan O, Kahyaoglu M, Kalayci A, Cakmak EO, Karaduman A, et al. Echocardiographic Assessment of Right Ventricle Free Wall Strain for Prediction of Right Coronary Artery Proximal Lesion in Patients with Inferior Myocardial Infarction. Int J Cardiovasc Imaging. 2018;34(7):1109–1116. doi: 10.1007/s10554-018-1325-1. [DOI] [PubMed] [Google Scholar]
- 195.Chang WT, Tsai WC, Liu YW, Lee CH, Liu PY, Chen JY, et al. Changes in Right Ventricular Free Wall Strain in Patients with Coronary Artery Disease Involving the Right Coronary Artery. J Am Soc Echocardiogr. 2014;27(3):230–238. doi: 10.1016/j.echo.2013.11.010. [DOI] [PubMed] [Google Scholar]
- 196.Wechalekar AD, Gillmore JD, Hawkins PN. Systemic Amyloidosis. Lancet. 2016;387(10038):2641–2654. doi: 10.1016/S0140-6736(15)01274-X. [DOI] [PubMed] [Google Scholar]
- 197.Vergaro G, Aimo A, Barison A, Genovesi D, Buda G, Passino C, et al. Keys to Early Diagnosis of Cardiac Amyloidosis: Red Flags from Clinical, Laboratory and Imaging Findings. Eur J Prev Cardiol. 2020;27(17):1806–1815. doi: 10.1177/2047487319877708. [DOI] [PubMed] [Google Scholar]
- 198.Ternacle J, Bodez D, Guellich A, Audureau E, Rappeneau S, Lim P, et al. Causes and Consequences of Longitudinal LV Dysfunction Assessed by 2D Strain Echocardiography in Cardiac Amyloidosis. JACC Cardiovasc Imaging. 2016;9(2):126–138. doi: 10.1016/j.jcmg.2015.05.014. [DOI] [PubMed] [Google Scholar]
- 199.Liu D, Hu K, Niemann M, Herrmann S, Cikes M, Störk S, et al. Effect of Combined Systolic and Diastolic Functional Parameter Assessment for Differentiation of Cardiac Amyloidosis from Other Causes of Concentric Left Ventricular Hypertrophy. Circ Cardiovasc Imaging. 2013;6(6):1066–1072. doi: 10.1161/CIRCIMAGING.113.000683. [DOI] [PubMed] [Google Scholar]
- 200.Pagourelias ED, Mirea O, Duchenne J, van Cleemput J, Delforge M, Bogaert J, et al. Echo Parameters for Differential Diagnosis in Cardiac Amyloidosis: A Head-to-Head Comparison of Deformation and Nondeformation Parameters. Circ Cardiovasc Imaging. 2017;10(3):e005588. doi: 10.1161/CIRCIMAGING.116.005588. [DOI] [PubMed] [Google Scholar]
- 201.Arvidsson S, Henein MY, Wikström G, Suhr OB, Lindqvist P. Right Ventricular Involvement in Transthyretin Amyloidosis. Amyloid. 2018;25(3):160–166. doi: 10.1080/13506129.2018.1493989. [DOI] [PubMed] [Google Scholar]
- 202.Bellavia D, Pellikka PA, Dispenzieri A, Scott CG, Al-Zahrani GB, Grogan M, et al. Comparison of Right Ventricular Longitudinal Strain Imaging, Tricuspid Annular Plane Systolic Excursion, and Cardiac Biomarkers for Early Diagnosis of Cardiac Involvement and Risk Stratification in Primary Systematic (AL) Amyloidosis: A 5-Year Cohort Study. Eur Heart J Cardiovasc Imaging. 2012;13(8):680–689. doi: 10.1093/ehjci/jes009. [DOI] [PubMed] [Google Scholar]
- 203.Di Bella G, Minutoli F, Pingitore A, Zito C, Mazzeo A, Aquaro GD, et al. Endocardial and Epicardial Deformations in Cardiac Amyloidosis and Hypertrophic Cardiomyopathy. Circ J. 2011;75(5):1200–1208. doi: 10.1253/circj.cj-10-0844. [DOI] [PubMed] [Google Scholar]
- 204.Sun JP, Stewart WJ, Yang XS, Donnell RO, Leon AR, Felner JM, et al. Differentiation of Hypertrophic Cardiomyopathy and Cardiac Amyloidosis from Other Causes of Ventricular Wall Thickening by two-Dimensional Strain Imaging Echocardiography. Am J Cardiol. 2009;103(3):411–415. doi: 10.1016/j.amjcard.2008.09.102. [DOI] [PubMed] [Google Scholar]
- 205.Cappelli F, Porciani MC, Bergesio F, Perfetto F, De Antoniis F, Cania A, et al. Characteristics of Left Ventricular Rotational Mechanics in Patients with Systemic Amyloidosis, Systemic Hypertension and Normal Left Ventricular Mass. Clin Physiol Funct Imaging. 2011;31(2):159–165. doi: 10.1111/j.1475-097X.2010.00987.x. [DOI] [PubMed] [Google Scholar]
- 206.Porciani MC, Cappelli F, Perfetto F, Ciaccheri M, Castelli G, Ricceri I, et al. Rotational Mechanics of the Left Ventricle in AL Amyloidosis. Echocardiography. 2010;27(9):1061–1068. doi: 10.1111/j.1540-8175.2010.01199.x. [DOI] [PubMed] [Google Scholar]
- 207.Aimo A, Fabiani I, Giannoni A, Mandoli GE, Pastore MC, Vergaro G, et al. Multi-Chamber Speckle Tracking Imaging and Diagnostic Value of Left Atrial Strain in Cardiac Amyloidosis. Eur Heart J Cardiovasc Imaging. 2022;24(1):130–141. doi: 10.1093/ehjci/jeac057. [DOI] [PubMed] [Google Scholar]
- 208.Santarone M, Corrado G, Tagliagambe LM, Manzillo GF, Tadeo G, Spata M, et al. Atrial Thrombosis in Cardiac Amyloidosis: Diagnostic Contribution of Transesophageal Echocardiography. J Am Soc Echocardiogr. 1999;12(6):533–536. doi: 10.1016/s0894-7317(99)70091-x. [DOI] [PubMed] [Google Scholar]
- 209.Bandera F, Martone R, Chacko L, Ganesananthan S, Gilbertson JA, Ponticos M, et al. Clinical Importance of Left Atrial Infiltration in Cardiac Transthyretin Amyloidosis. JACC Cardiovasc Imaging. 2022;15(1):17–29. doi: 10.1016/j.jcmg.2021.06.022. [DOI] [PMC free article] [PubMed] [Google Scholar]
- 210.Feng D, Syed IS, Martinez M, Oh JK, Jaffe AS, Grogan M, et al. Intracardiac Thrombosis and Anticoagulation Therapy in Cardiac Amyloidosis. Circulation. 2009;119(18):2490–2497. doi: 10.1161/CIRCULATIONAHA.108.785014. [DOI] [PubMed] [Google Scholar]
- 211.D’Aloia A, Vizzardi E, Chiari E, Faggiano P, Squeri A, Ugo F, et al. Cardiac Arrest in a Patient with a Mobile Right Atrial Thrombus in Transit and Amyloidosis. Eur J Echocardiogr. 2008;9(1):141–142. doi: 10.1016/j.euje.2007.04.010. [DOI] [PubMed] [Google Scholar]
- 212.Falk RH, Alexander KM, Liao R, Dorbala S. AL (Light-Chain) Cardiac Amyloidosis: A Review of Diagnosis and Therapy. J Am Coll Cardiol. 2016;68(12):1323–1341. doi: 10.1016/j.jacc.2016.06.053. [DOI] [PubMed] [Google Scholar]
- 213.Vitarelli A, Lai S, Petrucci MT, Gaudio C, Capotosto L, Mangieri E, et al. Biventricular Assessment of Light-Chain Amyloidosis Using 3D Speckle Tracking Echocardiography: Differentiation from Other Forms of Myocardial Hypertrophy. Int J Cardiol. 2018;271:371–377. doi: 10.1016/j.ijcard.2018.03.088. [DOI] [PubMed] [Google Scholar]
- 214.Baccouche H, Maunz M, Beck T, Gaa E, Banzhaf M, Knayer U, et al. Differentiating Cardiac Amyloidosis and Hypertrophic Cardiomyopathy by Use of Three-Dimensional Speckle Tracking Echocardiography. Echocardiography. 2012;29(6):668–677. doi: 10.1111/j.1540-8175.2012.01680.x. [DOI] [PubMed] [Google Scholar]
- 215.Clemmensen TS, Eiskjær H, Mikkelsen F, Granstam SO, Flachskampf FA, Sørensen J, et al. Left Ventricular Pressure-Strain-Derived Myocardial Work at Rest and during Exercise in Patients with Cardiac Amyloidosis. J Am Soc Echocardiogr. 2020;33(5):573–582. doi: 10.1016/j.echo.2019.11.018. [DOI] [PubMed] [Google Scholar]
- 216.Giblin GT, Cuddy SAM, González-López E, Sewell A, Murphy A, Dorbala S, et al. Effect of Tafamidis on Global Longitudinal Strain and Myocardial Work in Transthyretin Cardiac Amyloidosis. Eur Heart J Cardiovasc Imaging. 2022;23(8):1029–1039. doi: 10.1093/ehjci/jeac049. [DOI] [PMC free article] [PubMed] [Google Scholar]
- 217.Senapati A, Sperry BW, Grodin JL, Kusunose K, Thavendiranathan P, Jaber W, et al. Prognostic Implication of Relative Regional Strain Ratio in Cardiac Amyloidosis. Heart. 2016;102(10):748–754. doi: 10.1136/heartjnl-2015-308657. [DOI] [PubMed] [Google Scholar]
- 218.Buss SJ, Emami M, Mereles D, Korosoglou G, Kristen AV, Voss A, et al. Longitudinal Left Ventricular Function for Prediction of Survival in Systemic Light-Chain Amyloidosis: Incremental Value Compared with Clinical and Biochemical Markers. J Am Coll Cardiol. 2012;60(12):1067–1076. doi: 10.1016/j.jacc.2012.04.043. [DOI] [PubMed] [Google Scholar]
- 219.Liu Z, Zhang L, Liu M, Wang F, Xiong Y, Tang Z, et al. Myocardial Injury in Multiple Myeloma Patients with Preserved Left Ventricular Ejection Fraction: Noninvasive Left Ventricular Pressure-Strain Myocardial Work. 782580Front Cardiovasc Med. 2022;8 doi: 10.3389/fcvm.2021.782580. [DOI] [PMC free article] [PubMed] [Google Scholar]
- 220.Huntjens PR, Zhang KW, Soyama Y, Karmpalioti M, Lenihan DJ, Gorcsan J., 3rd Prognostic Utility of Echocardiographic Atrial and Ventricular Strain Imaging in Patients With Cardiac Amyloidosis. JACC Cardiovasc Imaging. 2021;14(8):1508–1519. doi: 10.1016/j.jcmg.2021.01.016. [DOI] [PubMed] [Google Scholar]
- 221.Nagueh SF. Anderson-Fabry Disease and Other Lysosomal Storage Disorders. Circulation. 2014;130(13):1081–1090. doi: 10.1161/CIRCULATIONAHA.114.009789. [DOI] [PubMed] [Google Scholar]
- 222.Wu JC, Ho CY, Skali H, Abichandani R, Wilcox WR, Banikazemi M, et al. Cardiovascular Manifestations of Fabry Disease: Relationships between Left Ventricular Hypertrophy, Disease Severity, and Alpha-Galactosidase: A activity. Eur Heart J. 2010;31(9):1088–1097. doi: 10.1093/eurheartj/ehp588. [DOI] [PMC free article] [PubMed] [Google Scholar]
- 223.Pieroni M, Chimenti C, De Cobelli F, Morgante E, Del Maschio A, Gaudio C, et al. Fabry’s Disease Cardiomyopathy: Echocardiographic Detection of Endomyocardial Glycosphingolipid Compartmentalization. J Am Coll Cardiol. 2006;47(8):1663–1671. doi: 10.1016/j.jacc.2005.11.070. [DOI] [PubMed] [Google Scholar]
- 224.Sachdev B, Takenaka T, Teraguchi H, Tei C, Lee P, McKenna WJ, et al. Prevalence of Anderson-Fabry Disease in Male Patients with Late Onset Hypertrophic Cardiomyopathy. Circulation. 2002;105(12):1407–1411. doi: 10.1161/01.cir.0000012626.81324.38. [DOI] [PubMed] [Google Scholar]
- 225.Chimenti C, Pieroni M, Morgante E, Antuzzi D, Russo A, Russo MA, et al. Prevalence of Fabry Disease in Female Patients with Late-Onset Hypertrophic Cardiomyopathy. Circulation. 2004;110(9):1047–1053. doi: 10.1161/01.CIR.0000139847.74101.03. [DOI] [PubMed] [Google Scholar]
- 226.Morris DA, Blaschke D, Canaan-Kühl S, Krebs A, Knobloch G, Walter TC, et al. Global Cardiac Alterations Detected by Speckle-Tracking Echocardiography in Fabry Disease: Left Ventricular, Right Ventricular, and Left Atrial Dysfunction are Common and Linked to Worse Symptomatic Status. Int J Cardiovasc Imaging. 2015;31(2):301–313. doi: 10.1007/s10554-014-0551-4. [DOI] [PubMed] [Google Scholar]
- 227.Nordin S, Kozor R, Vijapurapu R, Augusto JB, Knott KD, Captur G, et al. Myocardial Storage, Inflammation, and Cardiac Phenotype in Fabry Disease After One Year of Enzyme Replacement Therapy. Circ Cardiovasc Imaging. 2019;12(12):e009430. doi: 10.1161/CIRCIMAGING.119.009430. [DOI] [PMC free article] [PubMed] [Google Scholar]
- 228.Germain DP, Hughes DA, Nicholls K, Bichet DG, Giugliani R, Wilcox WR, et al. Treatment of Fabry’s Disease with the Pharmacologic Chaperone Migalastat. N Engl J Med. 2016;375(6):545–555. doi: 10.1056/NEJMoa1510198. [DOI] [PubMed] [Google Scholar]
- 229.Kraigher-Krainer E, Shah AM, Gupta DK, Santos A, Claggett B, Pieske B, et al. Impaired Systolic Function by Strain Imaging in Heart Failure with Preserved Ejection Fraction. J Am Coll Cardiol. 2014;63(5):447–456. doi: 10.1016/j.jacc.2013.09.052. [DOI] [PMC free article] [PubMed] [Google Scholar]
- 230.Hunt SA, Abraham WT, Chin MH, Feldman AM, Francis GS, Ganiats TG, et al. ACC/AHA 2005 Guideline Update for the Diagnosis and Management of Chronic Heart Failure in the Adult: A Report of the American College of Cardiology/American Heart Association Task Force on Practice Guidelines (Writing Committee to Update the 2001 Guidelines for the Evaluation and Management of Heart Failure): Developed in Collaboration with the American College of Chest Physicians and the International Society for Heart and Lung Transplantation: Endorsed by the Heart Rhythm Society. Circulation. 2005;112(12):e154–e235. doi: 10.1161/CIRCULATIONAHA.105.167586. [DOI] [PubMed] [Google Scholar]
- 231.Contaldi C, Imbriaco M, Alcidi G, Ponsiglione A, Santoro C, Puglia M, et al. Assessment of the Relationships between Left Ventricular Filling Pressures and Longitudinal Dysfunction with Myocardial Fibrosis in Uncomplicated Hypertensive Patients. Int J Cardiol. 2016;202:84–86. doi: 10.1016/j.ijcard.2015.08.153. [DOI] [PubMed] [Google Scholar]
- 232.Kishi S, Teixido-Tura G, Ning H, Venkatesh BA, Wu C, Almeida A, et al. Cumulative Blood Pressure in Early Adulthood and Cardiac Dysfunction in Middle Age: The CARDIA Study. J Am Coll Cardiol. 2015;65(25):2679–2687. doi: 10.1016/j.jacc.2015.04.042. [DOI] [PubMed] [Google Scholar]
- 233.Lembo M, Esposito R, Lo Iudice F, Santoro C, Izzo R, De Luca N, et al. Impact of Pulse Pressure on Left Ventricular Global Longitudinal straIn in Normotensive and Newly Diagnosed, Untreated Hypertensive Patients. J Hypertens. 2016;34(6):1201–1207. doi: 10.1097/HJH.0000000000000906. [DOI] [PubMed] [Google Scholar]
- 234.Imbalzano E, Zito C, Carerj S, Oreto G, Mandraffino G, Cusmà-Piccione M, et al. Left Ventricular Function in Hypertension: New Insight by Speckle Tracking Echocardiography. Echocardiography. 2011;28(6):649–657. doi: 10.1111/j.1540-8175.2011.01410.x. [DOI] [PubMed] [Google Scholar]
- 235.Cameli M, Mandoli GE, Lisi E, Ibrahim A, Incampo E, Buccoliero G, et al. Left Atrial, Ventricular and Atrio-Ventricular Strain in Patients with Subclinical Heart Dysfunction. Int J Cardiovasc Imaging. 2019;35(2):249–258. doi: 10.1007/s10554-018-1461-7. [DOI] [PubMed] [Google Scholar]
- 236.Biering-Sørensen T, Biering-Sørensen SR, Olsen FJ, Sengeløv M, Jørgensen PG, Mogelvang R, et al. Global Longitudinal Strain by Echocardiography Predicts Long-Term Risk of Cardiovascular Morbidity and Mortality in a Low-Risk General Population: The Copenhagen City Heart Study. Circ Cardiovasc Imaging. 2017;10(3):e005521. doi: 10.1161/CIRCIMAGING.116.005521. [DOI] [PMC free article] [PubMed] [Google Scholar]
- 237.Xu L, Wang N, Chen X, Liang Y, Zhou H, Yan J. Quantitative Evaluation of Myocardial Layer-Specific Strain Using Two-Dimensional Speckle Tracking Echocardiography among Young Adults with Essential Hypertension in China. Medicine. 2018;97(39):e12448. doi: 10.1097/MD.0000000000012448. [DOI] [PMC free article] [PubMed] [Google Scholar]
- 238.Di Bello V, Talini E, Dell’Omo G, Giannini C, Delle Donne MG, Canale ML, et al. Early Left Ventricular Mechanics Abnormalities in Prehypertension: A Two-Dimensional Strain Echocardiography Study. Am J Hypertens. 2010;23(4):405–412. doi: 10.1038/ajh.2009.258. [DOI] [PubMed] [Google Scholar]
- 239.Kang SJ, Lim HS, Choi BJ, Choi SY, Hwang GS, Yoon MH, et al. Longitudinal Strain and Torsion Assessed by Two-Dimensional Speckle Tracking Correlate with the Serum Level of Tissue Inhibitor of Matrix Metalloproteinase-1, a Marker of Myocardial Fibrosis, in Patients with Hypertension. J Am Soc Echocardiogr. 2008;21(8):907–911. doi: 10.1016/j.echo.2008.01.015. [DOI] [PubMed] [Google Scholar]
- 240.Galderisi M, Lomoriello VS, Santoro A, Esposito R, Olibet M, Raia R, et al. Differences of Myocardial Systolic Deformation and Correlates of Diastolic Function in Competitive Rowers and Young Hypertensives: A Speckle-Tracking Echocardiography Study. J Am Soc Echocardiogr. 2010;23(11):1190–1198. doi: 10.1016/j.echo.2010.07.010. [DOI] [PubMed] [Google Scholar]
- 241.Kosmala W, Plaksej R, Strotmann JM, Weigel C, Herrmann S, Niemann M, et al. Progression of Left Ventricular Functional Abnormalities in Hypertensive Patients with Heart Failure: An Ultrasonic Two-Dimensional Speckle Tracking Study. J Am Soc Echocardiogr. 2008;21(12):1309–1317. doi: 10.1016/j.echo.2008.10.006. [DOI] [PubMed] [Google Scholar]
- 242.Kim SA, Park SM, Kim MN, Shim WJ. Assessment of Left Ventricular Function by Layer-Specific Strain and Its Relationship to Structural Remodelling in Patients with Hypertension. Can J Cardiol. 2016;32(2):211–216. doi: 10.1016/j.cjca.2015.04.025. [DOI] [PubMed] [Google Scholar]
- 243.Lee WH, Liu YW, Yang LT, Tsai WC. Prognostic Value of Longitudinal Strain of Subepicardial Myocardium in Patients with Hypertension. J Hypertens. 2016;34(6):1195–1200. doi: 10.1097/HJH.0000000000000903. [DOI] [PubMed] [Google Scholar]
- 244.Cheng S, McCabe EL, Larson MG, Merz AA, Osypiuk E, Lehman BT, et al. Distinct Aspects of Left Ventricular Mechanical Function are Differentially Associated with Cardiovascular Outcomes and All-Cause Mortality in the Community. J Am Heart Assoc. 2015;4(10):e002071. doi: 10.1161/JAHA.115.002071. [DOI] [PMC free article] [PubMed] [Google Scholar]
- 245.Tadic M, Cuspidi C, Vukomanovic V, Celic V, Tasic I, Stevanovic A, et al. Does Masked Hypertension Impact Left Ventricular Deformation? J Am Soc Hypertens. 2016;10(9):694–701. doi: 10.1016/j.jash.2016.06.032. [DOI] [PubMed] [Google Scholar]
- 246.Tadic M, Cuspidi C, Ivanovic B, Ilic I, Celic V, Kocijancic V. Influence of White-Coat Hypertension on Left Ventricular Deformation 2- and 3-Dimensional Speckle Tracking Study. Hypertension. 2016;67(3):592–596. doi: 10.1161/HYPERTENSIONAHA.115.06822. [DOI] [PubMed] [Google Scholar]
- 247.Kuznetsova T, Nijs E, Cauwenberghs N, Knez J, Thijs L, Haddad F, et al. Temporal Changes in Left Ventricular Longitudinal Strain in General Population: Clinical Correlates and Impact on Cardiac Remodeling. Echocardiography. 2019;36(3):458–468. doi: 10.1111/echo.14246. [DOI] [PubMed] [Google Scholar]
- 248.Drazner MH. The Progression of Hypertensive Heart Disease. Circulation. 2011;123(3):327–334. doi: 10.1161/CIRCULATIONAHA.108.845792. [DOI] [PubMed] [Google Scholar]
- 249.Mizuguchi Y, Oishi Y, Miyoshi H, Iuchi A, Nagase N, Oki T. Concentric Left Ventricular Hypertrophy Brings Deterioration of Systolic Longitudinal, Circumferential, and Radial Myocardial Deformation in Hypertensive Patients with Preserved Left Ventricular Pump Function. J Cardiol. 2010;55(1):23–33. doi: 10.1016/j.jjcc.2009.07.006. [DOI] [PubMed] [Google Scholar]
- 250.Tadic M, Cuspidi C, Majstorovic A, Kocijancic V, Celic V. The Relationship between Left Ventricular Deformation and Different Geometric Patterns According to the Updated Classification: Findings from the Hypertensive Population. J Hypertens. 2015;33(9):1954–1961. doi: 10.1097/HJH.0000000000000618. [DOI] [PubMed] [Google Scholar]
- 251.Bendiab NST, Meziane-Tani A, Ouabdesselam S, Methia N, Latreche S, Henaoui L, et al. Factors Associated with Global Longitudinal Strain Decline in Hypertensive Patients with Normal Left Ventricular Ejection Fraction. Eur J Prev Cardiol. 2017;24(14):1463–1472. doi: 10.1177/2047487317721644. [DOI] [PubMed] [Google Scholar]
- 252.Kouzu H, Yuda S, Muranaka A, Doi T, Yamamoto H, Shimoshige S, et al. Left Ventricular Hypertrophy Causes Different Changes in Longitudinal, Radial, and Circumferential Mechanics in Patients with Hypertension: A Two-Dimensional Speckle Tracking Study. J Am Soc Echocardiogr. 2011;24(2):192–199. doi: 10.1016/j.echo.2010.10.020. [DOI] [PubMed] [Google Scholar]
- 253.Cameli M, Lisi M, Righini FM, Massoni A, Mondillo S. Left Ventricular Remodeling and Torsion Dynamics in Hypertensive Patients. Int J Cardiovasc Imaging. 2013;29(1):79–86. doi: 10.1007/s10554-012-0054-0. [DOI] [PubMed] [Google Scholar]
- 254.Sun JP, Xu TY, Ni XD, Yang XS, Hu JL, Wang SC, et al. Echocardiographic Strain in Hypertrophic Cardiomyopathy and Hypertensive Left Ventricular Hypertrophy. Echocardiography. 2019;36(2):257–265. doi: 10.1111/echo.14222. [DOI] [PubMed] [Google Scholar]
- 255.Tzortzis S, Ikonomidis I, Triantafyllidi H, Trivilou P, Pavlidis G, Katsanos S, et al. Optimal Blood Pressure Control Improves Left Ventricular Torsional Deformation and Vascular Function in Newly Diagnosed Hypertensives: A 3-Year Follow-up Study. J Cardiovasc Transl Res. 2020;13(5):814–825. doi: 10.1007/s12265-019-09951-9. [DOI] [PubMed] [Google Scholar]
- 256.Kotini-Shah P, Cuadros S, Huang F, Colla JS. Strain Analysis for the Identification of Hypertensive Cardiac End-Organ Damage in the Emergency Department. 29Crit Ultrasound J. 2018;10(1) doi: 10.1186/s13089-018-0110-7. [DOI] [PMC free article] [PubMed] [Google Scholar]
- 257.Sera F, Jin Z, Russo C, Lee ES, Schwartz JE, Rundek T, et al. Ambulatory Blood Pressure Control and Subclinical Left Ventricular Dysfunction in Treated Hypertensive Subjects. J Am Coll Cardiol. 2015;66(12):1408–1409. doi: 10.1016/j.jacc.2015.05.083. [DOI] [PMC free article] [PubMed] [Google Scholar]
- 258.Ghorayeb N, Stein R, Daher DJ, Silveira AD, Ritt LEF, Santos DFP, et al. Atualização da Diretriz em Cardiologia do Esporte e do Exercício da Sociedade Brasileira de Cardiologia e da Sociedade Brasileira de Medicina do Esporte - 2019. Arq Bras Cardiol. 2019;112(3):326–368. doi: 10.5935/abc.20190048. [DOI] [PMC free article] [PubMed] [Google Scholar]
- 259.Richand V, Lafitte S, Reant P, Serri K, Lafitte M, Brette S, et al. An Ultrasound Speckle Tracking (Two-Dimensional Strain) Analysis of Myocardial Deformation in Professional Soccer Players Compared with Healthy Subjects and Hypertrophic Cardiomyopathy. Am J Cardiol. 2007;100(1):128–132. doi: 10.1016/j.amjcard.2007.02.063. [DOI] [PubMed] [Google Scholar]
- 260.D’Andrea A, Limongelli G, Caso P, Sarubbi B, Della Pietra A, Brancaccio P, et al. Association between Left Ventricular Structure and Cardiac Performance During Effort in Two Morphological Forms of Athlete’s Heart. Int J Cardiol. 2002 2-3;86:177–184. doi: 10.1016/s0167-5273(02)00194-8. [DOI] [PubMed] [Google Scholar]
- 261.Beaumont A, Grace F, Richards J, Hough J, Oxborough D, Sculthorpe N. Left Ventricular Speckle Tracking-Derived Cardiac Strain and Cardiac Twist Mechanics in Athletes: A Systematic Review and Meta-Analysis of Controlled Studies. Sports Med. 2017;47(6):1145–1170. doi: 10.1007/s40279-016-0644-4. [DOI] [PMC free article] [PubMed] [Google Scholar]
- 262.Saghir M, Areces M, Makan M. Strain Rate Imaging Differentiates Hypertensive Cardiac Hypertrophy from Physiologic Cardiac Hypertrophy (Athlete’s Heart) J Am Soc Echocardiogr. 2007;20(2):151–157. doi: 10.1016/j.echo.2006.08.006. [DOI] [PubMed] [Google Scholar]
- 263.Pena JLB, Santos WC, Araújo SA, Dias GM, Sternick EB. How Echocardiographic Deformation Indices Can Distinguish Different Types of Left Ventricular Hypertrophy. Arq Bras Cardiol. 2018;111(5):758–759. doi: 10.5935/abc.20180223. [DOI] [PMC free article] [PubMed] [Google Scholar]
- 264.Fudge J, Harmon KG, Owens DS, Prutkin JM, Salerno JC, Asif IM, et al. Cardiovascular Screening in Adolescents and Young Adults: A Prospective Study Comparing the Pre-Participation Physical Evaluation Monograph 4th Edition and ECG. Br J Sports Med. 2014;48(15):1172–1178. doi: 10.1136/bjsports-2014-093840. [DOI] [PMC free article] [PubMed] [Google Scholar]
- 265.Zeltser I, Cannon B, Silvana L, Fenrich A, George J, Schleifer J, et al. Lessons Learned from Preparticipation Cardiovascular Screening in a State Funded Program. Am J Cardiol. 2012;110(6):902–908. doi: 10.1016/j.amjcard.2012.05.018. [DOI] [PubMed] [Google Scholar]
- 266.Gianrossi R, Detrano R, Mulvihill D, Lehmann K, Dubach P, Colombo A, et al. Exercise-Induced ST Depression in the Diagnosis of Coronary Artery Disease. A Meta-Analysis. Circulation. 1989;80(1):87–98. doi: 10.1161/01.cir.80.1.87. [DOI] [PubMed] [Google Scholar]
- 267.Corrado D, Schmied C, Basso C, Borjesson M, Schiavon M, Pelliccia A, et al. Risk of Sports: Do we Need a Pre-Participation Screening for Competitive and Leisure Athletes? Eur Heart J. 2011;32(8):934–944. doi: 10.1093/eurheartj/ehq482. [DOI] [PubMed] [Google Scholar]
- 268.Mont L, Pelliccia A, Sharma S, Biffi A, Borjesson M, Terradellas JB, et al. Pre-Participation Cardiovascular Evaluation for Athletic Participants to Prevent Sudden Death: Position Paper from the EHRA and the EACPR, Branches of the ESC. Endorsed by APHRS, HRS, and SOLAECE. Eur J Prev Cardiol. 2017;24(1):41–69. doi: 10.1177/2047487316676042. [DOI] [PubMed] [Google Scholar]
- 269.King G, Almuntaser I, Murphy RT, La Gerche A, Mahoney N, Bennet K, et al. Reduced Right Ventricular Myocardial Strain in the Elite Athlete May Not Be a Consequence of Myocardial Damage. “Cream Masquerades as Skimmed Milk”. Echocardiography. 2013;30(8):929–935. doi: 10.1111/echo.12153. [DOI] [PubMed] [Google Scholar]
- 270.La Gerche A, Burns AT, D’Hooge J, Macisaac AI, Heidbüchel H, Prior DL. Exercise Strain Rate Imaging Demonstrates Normal Right Ventricular Contractile Reserve and Clarifies Ambiguous Resting Measures in Endurance Athletes. J Am Soc Echocardiogr. 2012;25(3):253–262.e1. doi: 10.1016/j.echo.2011.11.023. [DOI] [PubMed] [Google Scholar]
- 271.Franckowiak SC, Dobrosielski DA, Reilley SM, Walston JD, Andersen RE. Maximal Heart Rate Prediction in Adults that are Overweight or Obese. J Strength Cond Res. 2011;25(5):1407–1412. doi: 10.1519/JSC.0b013e3181d682d2. [DOI] [PMC free article] [PubMed] [Google Scholar]
- 272.Vanhees L, Stevens A. Exercise Intensity: A Matter of Measuring or of Talking? J Cardiopulm Rehabil. 2006;26(2):78–79. doi: 10.1097/00008483-200603000-00004. [DOI] [PubMed] [Google Scholar]
- 273.Baggish AL, Wang F, Weiner RB, Elinoff JM, Tournoux F, Boland A, et al. Training-Specific Changes in Cardiac Structure and Function: A Prospective and Longitudinal Assessment of Competitive Athletes. J Appl Physiol. 2008;104(4):1121–1128. doi: 10.1152/japplphysiol.01170.2007. [DOI] [PubMed] [Google Scholar]
- 274.Silva CES. Appropriate Use of Diastolic Function Guideline when Evaluating Athletes: It is not Always what it Seems to Be. Arq Bras Cardiol. 2020;115(1):134–138. doi: 10.36660/abc.20190689. [DOI] [PMC free article] [PubMed] [Google Scholar]
- 275.Pelliccia A, Sharma S, Gati S, Bäck M, Börjesson M, Caselli S, et al. 2020 ESC Guidelines on Sports Cardiology and Exercise in Patients with Cardiovascular Disease. Eur Heart J. 2021;42(1):17–96. doi: 10.1093/eurheartj/ehaa605. [DOI] [PubMed] [Google Scholar]
- 276.Reant P, Labrousse L, Lafitte S, Bor P, Pillois X, Tariosse L, et al. Experimental Validation of Circumferential, Longitudinal, and Radial 2-Dimensional Strain During Dobutamine Stress Echocardiography in Ischemic Conditions. J Am Coll Cardiol. 2008;51(2):149–157. doi: 10.1016/j.jacc.2007.07.088. [DOI] [PubMed] [Google Scholar]
- 277.Yu Y, Villarraga HR, Saleh HK, Cha SS, Pellikka PA. Can Ischemia and Dyssynchrony Be Detected During Early Stages of Dobutamine Stress Echocardiography By 2-Dimensional Speckle Tracking Echocardiography? Int J Cardiovasc Imaging. 2013;29(1):95–102. doi: 10.1007/s10554-012-0074-9. [DOI] [PubMed] [Google Scholar]
- 278.Hanekom L, Cho GY, Leano R, Jeffriess L, Marwick TH. Comparison of Two-Dimensional Speckle and Tissue Doppler Strain Measurement During Dobutamine Stress Echocardiography: An Angiographic Correlation. Eur Heart J. 2007;28(14):1765–1772. doi: 10.1093/eurheartj/ehm188. [DOI] [PubMed] [Google Scholar]
- 279.Paraskevaidis IA, Tsougos E, Panou F, Dagres N, Karatzas D, Boutati E, et al. Diastolic Stress Echocardiography Detects Coronary Artery Disease in Patients with Asymptomatic Type II Diabetes. Coron Artery Dis. 2010;21(2):104–112. doi: 10.1097/MCA.0b013e328335a05d. [DOI] [PubMed] [Google Scholar]
- 280.Ishii K, Imai M, Suyama T, Maenaka M, Nagai T, Kawanami M, et al. Exercise-Induced Post-Ischemic Left Ventricular Delayed Relaxation or Diastolic Stunning: Is It a Reliable Marker in Detecting Coronary Artery Disease? J Am Coll Cardiol. 2009;53(8):698–705. doi: 10.1016/j.jacc.2008.09.057. [DOI] [PubMed] [Google Scholar]
- 281.Rambaldi R, Poldermans D, Bax JJ, Boersma E, Elhendy A, Vletter W, et al. Doppler Tissue Velocity Sampling Improves Diagnostic Accuracy During Dobutamine Stress Echocardiography for the Assessment of Viable Myocardium in Patients with Severe Left Ventricular Dysfunction. Eur Heart J. 2000;21(13):1091–1098. doi: 10.1053/euhj.1999.1857. [DOI] [PubMed] [Google Scholar]
- 282.Gong L, Li D, Chen J, Wang X, Xu T, Li W, et al. Assessment of Myocardial Viability in Patients with Acute Myocardial Infarction by Two-Dimensional Speckle Tracking Echocardiography Combined with Low-Dose Dobutamine Stress Echocardiography. Int J Cardiovasc Imaging. 2013;29(5):1017–1028. doi: 10.1007/s10554-013-0185-y. [DOI] [PubMed] [Google Scholar]
- 283.Rösner A, How OJ, Aarsaether E, Stenberg TA, Andreasen T, Kondratiev TV, et al. High Resolution Speckle Tracking Dobutamine Stress Echocardiography Reveals Heterogeneous Responses in Different Myocardial Layers: Implication for Viability Assessments. J Am Soc Echocardiogr. 2010;23(4):439–447. doi: 10.1016/j.echo.2009.12.023. [DOI] [PubMed] [Google Scholar]
- 284.Voigt JU, Exner B, Schmiedehausen K, Huchzermeyer C, Reulbach U, Nixdorff U, et al. Strain-Rate Imaging During Dobutamine Stress Echocardiography Provides Objective Evidence of Inducible Ischemia. Circulation. 2003;107(16):2120–2126. doi: 10.1161/01.CIR.0000065249.69988.AA. [DOI] [PubMed] [Google Scholar]
- 285.Bountioukos M, Schinkel AF, Bax JJ, Rizzello V, Valkema R, Krenning BJ, et al. Pulsed Wave Tissue Doppler Imaging for the Quantification of Contractile Reserve in Stunned, Hibernating, and Scarred Myocardium. Heart. 2004;90(5):506–510. doi: 10.1136/hrt.2003.018531. [DOI] [PMC free article] [PubMed] [Google Scholar]
- 286.Bartko PE, Heinze G, Graf S, Clavel MA, Khorsand A, Bergler-Klein J, et al. Two-Dimensional Strain for the Assessment of Left Ventricular Function in Low Flow-Low Gradient Aortic Stenosis, Relationship to Hemodynamics, and Outcome: A Substudy of the Multicenter TOPAS Study. Circ Cardiovasc Imaging. 2013;6(2):268–276. doi: 10.1161/CIRCIMAGING.112.980201. [DOI] [PubMed] [Google Scholar]
- 287.Dahou A, Bartko PE, Capoulade R, Clavel MA, Mundigler G, Grondin SL, et al. Usefulness of Global Left Ventricular Longitudinal Strain for Risk Stratification in Low Ejection Fraction, Low-Gradient Aortic Stenosis: Results from the Multicenter True or Pseudo-Severe Aortic Stenosis Study. Circ Cardiovasc Imaging. 2015;8(3):e002117. doi: 10.1161/CIRCIMAGING.114.002117. [DOI] [PubMed] [Google Scholar]
- 288.Hensel KO, Jenke A, Leischik R. Speckle-Tracking and Tissue-Doppler Stress Echocardiography in Arterial Hypertension: A Sensitive Tool for Detection of Subclinical LV Impairment. 472562Biomed Res Int. 2014;2014 doi: 10.1155/2014/472562. [DOI] [PMC free article] [PubMed] [Google Scholar]
- 289.Cadeddu C, Nocco S, Piano D, Deidda M, Cossu E, Baroni MG, et al. Early Impairment of Contractility Reserve in Patients with Insulin Resistance in Comparison with Healthy Subjects. 66Cardiovasc Diabetol. 2013;12 doi: 10.1186/1475-2840-12-66. [DOI] [PMC free article] [PubMed] [Google Scholar]
- 290.Jellis CL, Stanton T, Leano R, Martin J, Marwick TH. Usefulness of at Rest and Exercise Hemodynamics to Detect Subclinical Myocardial Disease in Type 2 Diabetes Mellitus. Am J Cardiol. 2011;107(4):615–621. doi: 10.1016/j.amjcard.2010.10.024. [DOI] [PubMed] [Google Scholar]
- 291.Vitarelli A, Morichetti MC, Capotosto L, De Cicco V, Ricci S, Caranci F, et al. Utility of Strain Echocardiography at Rest and after Stress Testing in Arrhythmogenic Right Ventricular Dysplasia. Am J Cardiol. 2013;111(9):1344–1350. doi: 10.1016/j.amjcard.2013.01.279. [DOI] [PubMed] [Google Scholar]
- 292.Matsumoto K, Tanaka H, Imanishi J, Tatsumi K, Motoji Y, Miyoshi T, et al. Preliminary Observations of Prognostic Value of Left Atrial Functional Reserve During Dobutamine Infusion in Patients with Dilated Cardiomyopathy. J Am Soc Echocardiogr. 2014;27(4):430–439. doi: 10.1016/j.echo.2013.12.016. [DOI] [PubMed] [Google Scholar]
- 293.Yang HS, Mookadam F, Warsame TA, Khandheria BK, Tajik JA, Chandrasekaran K. Evaluation of Right Ventricular Global and Regional Function During Stress Echocardiography Using Novel Velocity Vector Imaging. Eur J Echocardiogr. 2010;11(2):157–164. doi: 10.1093/ejechocard/jep190. [DOI] [PubMed] [Google Scholar]
- 294.D’Ascenzi F, Caselli S, Solari M, Pelliccia A, Cameli M, Focardi M, et al. Novel Echocardiographic Techniques for the Evaluation of Athletes’ Heart: A Focus on Speckle-Tracking Echocardiography. Eur J Prev Cardiol. 2016;23(4):437–446. doi: 10.1177/2047487315586095. [DOI] [PubMed] [Google Scholar]
- 295.Simsek Z, Gundogdu F, Alpaydin S, Gerek Z, Ercis S, Sen I, et al. Analysis of Athletes’ Heart by Tissue Doppler and Strain/Strain Rate Imaging. Int J Cardiovasc Imaging. 2011;27(1):105–111. doi: 10.1007/s10554-010-9669-1. [DOI] [PubMed] [Google Scholar]
- 296.Forsey J, Friedberg MK, Mertens L. Speckle Tracking Echocardiography in Pediatric and Congenital Heart Disease. Echocardiography. 2013;30(4):447–459. doi: 10.1111/echo.12131. [DOI] [PubMed] [Google Scholar]
- 297.Levy PT, Mejia AAS, Machefsky A, Fowler S, Holland MR, Singh GK. Normal Ranges of Right Ventricular Systolic and Diastolic Strain Measures in Children: A Systematic Review and Meta-Analysis. J Am Soc Echocardiogr. 2014;27(5):549. doi: 10.1016/j.echo.2014.01.015. [DOI] [PMC free article] [PubMed] [Google Scholar]
- 298.Levy PT, Machefsky A, Sanchez AA, Patel MD, Rogal S, Fowler S, et al. Reference Ranges of Left Ventricular Strain Measures by Two-Dimensional Speckle-Tracking Echocardiography in Children: A Systematic Review and Meta-Analysis. J Am Soc Echocardiogr. 2016;29(3):209–225.e6. doi: 10.1016/j.echo.2015.11.016. [DOI] [PMC free article] [PubMed] [Google Scholar]
- 299.Kutty S, Padiyath A, Li L, Peng Q, Rangamani S, Schuster A, et al. Functional Maturation of Left and Right Atrial Systolic and Diastolic Performance in Infants, Children, and Adolescents. J Am Soc Echocardiogr. 2013;26(4):398–409.e2. doi: 10.1016/j.echo.2012.12.016. [DOI] [PubMed] [Google Scholar]
- 300.Cantinotti M, Scalese M, Giordano R, Franchi E, Assanta N, Marotta M, et al. Normative Data for Left and Right Ventricular Systolic Strain in Healthy Caucasian Italian Children by Two-Dimensional Speckle-Tracking Echocardiography. J Am Soc Echocardiogr. 2018;31(6):712–720.e6. doi: 10.1016/j.echo.2018.01.006. [DOI] [PubMed] [Google Scholar]
- 301.Cantinotti M, Scalese M, Giordano R, Franchi E, Assanta N, Molinaro S, et al. Left and Right Atrial Strain in Healthy Caucasian Children by Two-Dimensional Speckle-Tracking Echocardiography. J Am Soc Echocardiogr. 2019;32(1):165–168.e3. doi: 10.1016/j.echo.2018.10.002. [DOI] [PubMed] [Google Scholar]
- 302.Muntean I, Benedek T, Melinte M, Suteu C, Togãnel R. Deformation Pattern and Predictive Value of Right Ventricular Longitudinal Strain in Children with Pulmonary Arterial Hypertension. 27Cardiovasc Ultrasound. 2016;14(1) doi: 10.1186/s12947-016-0074-3. [DOI] [PMC free article] [PubMed] [Google Scholar]
- 303.Kühn A, Meierhofer C, Rutz T, Rondak IC, Röhlig C, Schreiber C, et al. Non-Volumetric Echocardiographic Indices and Qualitative Assessment of Right Ventricular Systolic Function in Ebstein’s Anomaly: Comparison with CMR-Derived Ejection Fraction in 49 Patients. Eur Heart J Cardiovasc Imaging. 2016;17(8):930–935. doi: 10.1093/ehjci/jev243. [DOI] [PubMed] [Google Scholar]
- 304.Lipczyńska M, Szymański P, Kumor M, Klisiewicz A, Mazurkiewicz Ł, Hoffman P. Global Longitudinal Strain May Identify Preserved Systolic Function of the Systemic Right Ventricle. Can J Cardiol. 2015;31(6):760–766. doi: 10.1016/j.cjca.2015.02.028. [DOI] [PubMed] [Google Scholar]
- 305.Kowalik E, Mazurkiewicz Ł, Kowalski M, Klisiewicz A, Marczak M, Hoffman P. Echocardiography vs Magnetic Resonance Imaging in Assessing Ventricular Function and Systemic Atrioventricular Valve Status in Adults with Congenitally Corrected Transposition of the Great Arteries. Echocardiography. 2016;33(11):1697–1702. doi: 10.1111/echo.13339. [DOI] [PubMed] [Google Scholar]
- 306.Castaldi B, Vida V, Reffo E, Padalino M, Daniels Q, Stellin G, Milanesi O. Speckle Tracking in ALCAPA Patients after Surgical Repair as Predictor of Residual Coronary Disease. Pediatr Cardiol. 2017;38(4):794–800. doi: 10.1007/s00246-017-1583-z. [DOI] [PubMed] [Google Scholar]
- 307.Park PW, Atz AM, Taylor CL, Chowdhury SM. Speckle-Tracking Echocardiography Improves Pre-operative Risk Stratification Before the Total Cavopulmonary Connection. J Am Soc Echocardiogr. 2017;30(5):478–484. doi: 10.1016/j.echo.2017.01.008. [DOI] [PMC free article] [PubMed] [Google Scholar]
- 308.Meyer P, Filippatos GS, Ahmed MI, Iskandrian AE, Bittner V, Perry GJ, et al. Effects of Right Ventricular Ejection Fraction on Outcomes in Chronic Systolic Heart Failure. Circulation. 2010;121(2):252–258. doi: 10.1161/CIRCULATIONAHA.109.887570. [DOI] [PMC free article] [PubMed] [Google Scholar]
- 309.Ghio S, Gavazzi A, Campana C, Inserra C, Klersy C, Sebastiani R, et al. Independent and Additive Prognostic Value of Right Ventricular Systolic Function and Pulmonary Artery Pressure in Patients with Chronic Heart Failure. J Am Coll Cardiol. 2001;37(1):183–188. doi: 10.1016/s0735-1097(00)01102-5. [DOI] [PubMed] [Google Scholar]
- 310.Haddad F, Doyle R, Murphy DJ, Hunt SA. Right Ventricular Function in Cardiovascular Disease, Part II: Pathophysiology, Clinical Importance, and Management of Right Ventricular Failure. Circulation. 2008;117(13):1717–1731. doi: 10.1161/CIRCULATIONAHA.107.653584. [DOI] [PubMed] [Google Scholar]
- 311.D’Alonzo GE, Barst RJ, Ayres SM, Bergofsky EH, Brundage BH, Detre KM, et al. Survival in Patients with Primary Pulmonary Hypertension. Results from a National Prospective Registry. Ann Intern Med. 1991;115(5):343–349. doi: 10.7326/0003-4819-115-5-343. [DOI] [PubMed] [Google Scholar]
- 312.Forfia PR, Fisher MR, Mathai SC, Housten-Harris T, Hemnes AR, Borlaug BA, et al. Tricuspid Annular Displacement Predicts Survival in Pulmonary Hypertension. Am J Respir Crit Care Med. 2006;174(9):1034–1041. doi: 10.1164/rccm.200604-547OC. [DOI] [PubMed] [Google Scholar]
- 313.Warnes CA. Adult Congenital Heart Disease Importance of the Right Ventricle. J Am Coll Cardiol. 2009;54(21):1903–1910. doi: 10.1016/j.jacc.2009.06.048. [DOI] [PubMed] [Google Scholar]
- 314.Tadic M. Multimodality Evaluation of the Right Ventricle: An Updated Review. Clin Cardiol. 2015;38(12):770–776. doi: 10.1002/clc.22443. [DOI] [PMC free article] [PubMed] [Google Scholar]
- 315.Haddad F, Hunt SA, Rosenthal DN, Murphy DJ. Right Ventricular Function in Cardiovascular Disease, Part I: Anatomy, Physiology, Aging, and Functional Assessment of the Right Ventricle. Circulation. 2008;117(11):1436–1448. doi: 10.1161/CIRCULATIONAHA.107.653576. [DOI] [PubMed] [Google Scholar]
- 316.Zito C, Longobardo L, Cadeddu C, Monte I, Novo G, Dell’Oglio S, et al. Cardiovascular Imaging in the Diagnosis and Monitoring of Cardiotoxicity: Role of Echocardiography. J Cardiovasc Med. 2016;17(Suppl 1):e35–e44. doi: 10.2459/JCM.0000000000000374. [DOI] [PubMed] [Google Scholar]
- 317.Ho SY, Nihoyannopoulos P. Anatomy, Echocardiography, and Normal Right Ventricular Dimensions. Heart. 2006;92(Suppl 1):i2–13. doi: 10.1136/hrt.2005.077875. [DOI] [PMC free article] [PubMed] [Google Scholar]
- 318.Dell’Italia LJ. The Right Ventricle: Anatomy, Physiology, and Clinical Importance. Curr Probl Cardiol. 1991;16(10):653–720. doi: 10.1016/0146-2806(91)90009-y. [DOI] [PubMed] [Google Scholar]
- 319.Santamore WP, Dell’Italia LJ. Ventricular Interdependence: Significant Left Ventricular Contributions to Right Ventricular Systolic Function. Prog Cardiovasc Dis. 1998;40(4):289–308. doi: 10.1016/s0033-0620(98)80049-2. [DOI] [PubMed] [Google Scholar]
- 320.Lu KJ, Chen JX, Profitis K, Kearney LG, DeSilva D, Smith G, et al. Right Ventricular Global Longitudinal Strain is an Independent Predictor of Right Ventricular Function: A Multimodality Study of Cardiac Magnetic Resonance Imaging, Real Time Three-Dimensional Echocardiography and Speckle Tracking Echocardiography. Echocardiography. 2015;32(6):966–974. doi: 10.1111/echo.12783. [DOI] [PubMed] [Google Scholar]
- 321.Wang J, Prakasa K, Bomma C, Tandri H, Dalal D, James C, et al. Comparison of Novel Echocardiographic Parameters of Right Ventricular Function with Ejection Fraction by Cardiac Magnetic Resonance. J Am Soc Echocardiogr. 2007;20(9):1058–1064. doi: 10.1016/j.echo.2007.01.038. [DOI] [PubMed] [Google Scholar]
- 322.Vizzardi E, Bonadei I, Sciatti E, Pezzali N, Farina D, D’Aloia A, et al. Quantitative Analysis of Right Ventricular (RV) Function with Echocardiography in Chronic Heart Failure with No or Mild RV Dysfunction: Comparison with Cardiac Magnetic Resonance Imaging. J Ultrasound Med. 2015;34(2):247–255. doi: 10.7863/ultra.34.2.247. [DOI] [PubMed] [Google Scholar]
- 323.Freed BH, Tsang W, Bhave NM, Patel AR, Weinert L, Yamat M, et al. Right Ventricular Strain in Pulmonary Arterial Hypertension: A 2D Echocardiography and Cardiac Magnetic Resonance Study. Echocardiography. 2015;32(2):257–263. doi: 10.1111/echo.12662. [DOI] [PubMed] [Google Scholar]
- 324.Hulshof HG, Eijsvogels TMH, Kleinnibbelink G, van Dijk AP, George KP, Oxborough DL, et al. Prognostic Value of Right Ventricular Longitudinal Strain in Patients with Pulmonary Hypertension: A Systematic Review and Meta-Analysis. Eur Heart J Cardiovasc Imaging. 2019;20(4):475–484. doi: 10.1093/ehjci/jey120. [DOI] [PubMed] [Google Scholar]
- 325.Houard L, Benaets MB, Ravenstein CM, Rousseau MF, Ahn SA, Amzulescu MS, et al. Additional Prognostic Value of 2D Right Ventricular Speckle-Tracking Strain for Prediction of Survival in Heart Failure and Reduced Ejection Fraction: A Comparative Study With Cardiac Magnetic Resonance. JACC Cardiovasc Imaging. 2019;12(12):2373–2385. doi: 10.1016/j.jcmg.2018.11.028. [DOI] [PubMed] [Google Scholar]
- 326.Medvedofsky D, Koifman E, Jarrett H, Miyoshi T, Rogers T, Ben-Dor I, et al. Association of Right Ventricular Longitudinal Strain with Mortality in Patients Undergoing Transcatheter Aortic Valve Replacement. J Am Soc Echocardiogr. 2020;33(4):452–460. doi: 10.1016/j.echo.2019.11.014. [DOI] [PubMed] [Google Scholar]
- 327.Gandjbakhch E, Redheuil A, Pousset F, Charron P, Frank R. Clinical Diagnosis, Imaging, and Genetics of Arrhythmogenic Right Ventricular Cardiomyopathy/Dysplasia: JACC State-of-the-Art Review. J Am Coll Cardiol. 2018;72(7):784–804. doi: 10.1016/j.jacc.2018.05.065. [DOI] [PubMed] [Google Scholar]
- 328.Prihadi EA, van der Bijl P, Dietz M, Abou R, Vollema EM, Marsan NA, et al. Prognostic Implications of Right Ventricular Free Wall Longitudinal Strain in Patients with Significant Functional Tricuspid Regurgitation. Circ Cardiovasc Imaging. 2019;12(3):e008666. doi: 10.1161/CIRCIMAGING.118.008666. [DOI] [PubMed] [Google Scholar]
- 329.Morris DA, Krisper M, Nakatani S, Köhncke C, Otsuji Y, Belyavskiy E, et al. Normal Range and Usefulness of Right Ventricular Systolic Strain to Detect Subtle Right Ventricular Systolic Abnormalities in Patients with Heart Failure: A Multicentre Study. Eur Heart J Cardiovasc Imaging. 2017;18(2):212–223. doi: 10.1093/ehjci/jew011. [DOI] [PubMed] [Google Scholar]
- 330.Lee JH, Park JH, Park KI, Kim MJ, Kim JH, Ahn MS, et al. A Comparison of Different Techniques of Two-Dimensional Speckle-Tracking Strain Measurements of Right Ventricular Systolic Function in Patients with Acute Pulmonary Embolism. J Cardiovasc Ultrasound. 2014;22(2):65–71. doi: 10.4250/jcu.2014.22.2.65. [DOI] [PMC free article] [PubMed] [Google Scholar]
- 331.Genovese D, Mor-Avi V, Palermo C, Muraru D, Volpato V, Kruse E, et al. Comparison between Four-Chamber and Right Ventricular-Focused Views for the Quantitative Evaluation of Right Ventricular Size and Function. J Am Soc Echocardiogr. 2019;32(4):484–494. doi: 10.1016/j.echo.2018.11.014. [DOI] [PubMed] [Google Scholar]
- 332.Badano LP, Muraru D, Parati G, Haugaa K, Voigt JU. How to do Right Ventricular Strain. Eur Heart J Cardiovasc Imaging. 2020;21(8):825–827. doi: 10.1093/ehjci/jeaa126. [DOI] [PubMed] [Google Scholar]
- 333.Muraru D, Onciul S, Peluso D, Soriani N, Cucchini U, Aruta P, et al. Sex- and Method-Specific Reference Values for Right Ventricular Strain by 2-Dimensional Speckle-Tracking Echocardiography. Circ Cardiovasc Imaging. 2016;9(2):e003866. doi: 10.1161/CIRCIMAGING.115.003866. [DOI] [PubMed] [Google Scholar]
- 334.Focardi M, Cameli M, Carbone SF, Massoni A, De Vito R, Lisi M, et al. Traditional and Innovative Echocardiographic Parameters for the Analysis of Right Ventricular Performance in Comparison with Cardiac Magnetic Resonance. Eur Heart J Cardiovasc Imaging. 2015;16(1):47–52. doi: 10.1093/ehjci/jeu156. [DOI] [PubMed] [Google Scholar]
- 335.Li YD, Wang YD, Zhai ZG, Guo XJ, Wu YF, Yang YH, et al. Relationship between Echocardiographic and Cardiac Magnetic Resonance Imaging-Derived Measures of Right Ventricular Function in Patients with Chronic Thromboembolic Pulmonary Hypertension. Thromb Res. 2015;135(4):602–606. doi: 10.1016/j.thromres.2015.01.008. [DOI] [PubMed] [Google Scholar]
- 336.Leong DP, Grover S, Molaee P, Chakrabarty A, Shirazi M, Cheng YH, et al. Nonvolumetric Echocardiographic Indices of Right Ventricular Systolic Function: Validation with Cardiovascular Magnetic Resonance and Relationship with Functional Capacity. Echocardiography. 2012;29(4):455–463. doi: 10.1111/j.1540-8175.2011.01594.x. [DOI] [PubMed] [Google Scholar]
- 337.Fukuda Y, Tanaka H, Sugiyama D, Ryo K, Onishi T, Fukuya H, et al. Utility of Right Ventricular Free Wall Speckle-Tracking Strain for Evaluation of Right Ventricular Performance in Patients with Pulmonary Hypertension. J Am Soc Echocardiogr. 2011;24(10):1101–1108. doi: 10.1016/j.echo.2011.06.005. [DOI] [PubMed] [Google Scholar]
- 338.Cameli M, Lisi M, Righini FM, Tsioulpas C, Bernazzali S, Maccherini M, et al. Right Ventricular Longitudinal Strain Correlates Well With right Ventricular Stroke Work Index in Patients with Advanced Heart Failure Referred for Heart Transplantation. J Card Fail. 2012;18(3):208–215. doi: 10.1016/j.cardfail.2011.12.002. [DOI] [PubMed] [Google Scholar]
- 339.Grant AD, Smedira NG, Starling RC, Marwick TH. Independent and Incremental Role of Quantitative Right Ventricular Evaluation for the Prediction of Right Ventricular Failure after Left Ventricular Assist Device Implantation. J Am Coll Cardiol. 2012;60(6):521–528. doi: 10.1016/j.jacc.2012.02.073. [DOI] [PubMed] [Google Scholar]
- 340.Mingo-Santos S, Moñivas-Palomero V, Garcia-Lunar I, Mitroi CD, Goirigolzarri-Artaza J, Rivero B, et al. Usefulness of Two-Dimensional Strain Parameters to Diagnose Acute Rejection after Heart Transplantation. J Am Soc Echocardiogr. 2015;28(10):1149–1156. doi: 10.1016/j.echo.2015.06.005. [DOI] [PubMed] [Google Scholar]
- 341.Lemarié J, Huttin O, Girerd N, Mandry D, Juillière Y, Moulin F, et al. Usefulness of Speckle-Tracking Imaging for Right Ventricular Assessment after Acute Myocardial Infarction: A Magnetic Resonance Imaging/Echocardiographic Comparison within the Relation between Aldosterone and Cardiac Remodeling after Myocardial Infarction Study. J Am Soc Echocardiogr. 2015;28(7):818–27.e4. doi: 10.1016/j.echo.2015.02.019. [DOI] [PubMed] [Google Scholar]
- 342.Park JH, Park MM, Farha S, Sharp J, Lundgrin E, Comhair S, et al. Impaired Global Right Ventricular Longitudinal Strain Predicts Long-Term Adverse Outcomes in Patients with Pulmonary Arterial Hypertension. J Cardiovasc Ultrasound. 2015;23(2):91–99. doi: 10.4250/jcu.2015.23.2.91. [DOI] [PMC free article] [PubMed] [Google Scholar]
- 343.Roşca M, Călin A, Beladan CC, Enache R, Mateescu AD, Gurzun MM, et al. Right Ventricular Remodeling, Its Correlates, and Its Clinical Impact in Hypertrophic Cardiomyopathy. J Am Soc echocardiogr. 2015;28(11):1329–1338. doi: 10.1016/j.echo.2015.07.015. [DOI] [PubMed] [Google Scholar]
- 344.Afonso L, Briasoulis A, Mahajan N, Kondur A, Siddiqui F, Siddiqui S, et al. Comparison of Right Ventricular Contractile Abnormalities in Hypertrophic Cardiomyopathy versus Hypertensive Heart Disease Using Two Dimensional Strain Imaging: A Cross-Sectional Study. Int J Cardiovasc Imaging. 2015;31(8):1503–1509. doi: 10.1007/s10554-015-0722-y. [DOI] [PubMed] [Google Scholar]
- 345.Ozdemir AO, Kaya CT, Ozdol C, Candemir B, Turhan S, Dincer I, et al. Two-Dimensional Longitudinal Strain and Strain Rate Imaging for Assessing the Right Ventricular Function in Patients with Mitral Stenosis. Echocardiography. 2010;27(5):525–533. doi: 10.1111/j.1540-8175.2009.01078.x. [DOI] [PubMed] [Google Scholar]
- 346.Roushdy AM, Raafat SS, Shams KA, El-Sayed MH. Immediate and Short-Term Effect of Balloon Mitral Valvuloplasty on Global and Regional Biventricular Function: A Two-Dimensional Strain Echocardiographic Study. Eur Heart J Cardiovasc Imaging. 2016;17(3):316–325. doi: 10.1093/ehjci/jev157. [DOI] [PubMed] [Google Scholar]
- 347.Saraiva RM, Demirkol S, Buakhamsri A, Greenberg N, Popović ZB, Thomas JD, et al. Left Atrial Strain Measured by Two-Dimensional Speckle Tracking Represents a New Tool to Evaluate Left Atrial Function. J Am Soc Echocardiogr. 2010;23(2):172–180. doi: 10.1016/j.echo.2009.11.003. [DOI] [PubMed] [Google Scholar]
- 348.Cameli M, Caputo M, Mondillo S, Ballo P, Palmerini E, Lisi M, et al. Feasibility and Reference Values of Left Atrial Longitudinal Strain Imaging by Two-Dimensional Speckle Tracking. Cardiovasc Ultrasound. 2009;7 doi: 10.1186/1476-7120-7-6. [DOI] [PMC free article] [PubMed] [Google Scholar]
- 349.Hoit BD. Left Atrial Size and Function: Role in Prognosis. J Am Coll Cardiol. 2014;63(6):493–505. doi: 10.1016/j.jacc.2013.10.055. [DOI] [PubMed] [Google Scholar]
- 350.Carluccio E, Biagioli P, Mengoni A, Cerasa MF, Lauciello R, Zuchi C, et al. Left Atrial Reservoir Function and Outcome in Heart Failure with Reduced Ejection Fraction. Circ Cardiovasc Imaging. 2018;11(11):e007696. doi: 10.1161/CIRCIMAGING.118.007696. [DOI] [PubMed] [Google Scholar]
- 351.D’Andrea A, Caso P, Romano S, Scarafile R, Cuomo S, Salerno G, et al. Association between Left Atrial Myocardial Function and Exercise Capacity in Patients with Either Idiopathic or Ischemic Dilated Cardiomyopathy: A Two-Dimensional Speckle Strain Study. Int J Cardiol. 2009;132(3):354–363. doi: 10.1016/j.ijcard.2007.11.102. [DOI] [PubMed] [Google Scholar]
- 352.Cameli M, Lisi M, Mondillo S, Padeletti M, Ballo P, Tsioulpas C, et al. Left Atrial Longitudinal Strain by Speckle Tracking Echocardiography Correlates Well with Left Ventricular Filling Pressures in Patients with Heart Failure. Cardiovasc Ultrasound. 2010;8 doi: 10.1186/1476-7120-8-14. [DOI] [PMC free article] [PubMed] [Google Scholar]
- 353.Valzania C, Gadler F, Boriani G, Rapezzi C, Eriksson MJ. Effect of Cardiac Resynchronization Therapy on Left Atrial Size and Function as Expressed by Speckle Tracking 2-Dimensional Strain. Am J Cardiol. 2016;118(2):237–243. doi: 10.1016/j.amjcard.2016.04.042. [DOI] [PubMed] [Google Scholar]
- 354.Reddy YNV, Obokata M, Egbe A, Yang JH, Pislaru S, Lin G, et al. Left Atrial Strain and Compliance in the Diagnostic Evaluation of Heart Failure with Preserved Ejection Fraction. Eur J Heart Fail. 2019;21(7):891–900. doi: 10.1002/ejhf.1464. [DOI] [PubMed] [Google Scholar]
- 355.Sanchis L, Andrea R, Falces C, Lopez-Sobrino T, Montserrat S, Perez-Villa F, et al. Prognostic Value of Left Atrial Strain in Outpatients with De Novo Heart Failure. J Am Soc Echocardiogr. 2016;29(11):1035–1042.e1. doi: 10.1016/j.echo.2016.07.012. [DOI] [PubMed] [Google Scholar]
- 356.Malagoli A, Rossi L, Bursi F, Zanni A, Sticozzi C, Piepoli MF, et al. Left Atrial Function Predicts Cardiovascular Events in Patients with Chronic Heart Failure with Reduced Ejection Fraction. J Am Soc Echocardiogr. 2019;32(2):248–256. doi: 10.1016/j.echo.2018.08.012. [DOI] [PubMed] [Google Scholar]
- 357.Ancona R, Pinto SC, Caso P, Di Salvo G, Severino S, D’Andrea A, et al. Two-Dimensional Atrial Systolic Strain Imaging Predicts Atrial Fibrillation at 4-Year Follow-up in Asymptomatic Rheumatic Mitral Stenosis. J Am Soc Echocardiogr. 2013;26(3):270–277. doi: 10.1016/j.echo.2012.11.016. [DOI] [PubMed] [Google Scholar]
- 358.Saraiva RM, Pacheco NP, Pereira TOJS, Costa AR, Holanda MT, Sangenis LHC, et al. Left Atrial Structure and Function Predictors of New-Onset Atrial Fibrillation in Patients with Chagas Disease. J Am Soc Echocardiogr. 2020;33(11):1363–74.e1. doi: 10.1016/j.echo.2020.06.003. [DOI] [PubMed] [Google Scholar]
- 359.Kosmala W, Saito M, Kaye G, Negishi K, Linker N, Gammage M, et al. Incremental Value of Left Atrial Structural and Functional Characteristics for Prediction of Atrial Fibrillation in Patients Receiving Cardiac Pacing. Circ Cardiovasc Imaging. 2015;8(4):e002942. doi: 10.1161/CIRCIMAGING.114.002942. [DOI] [PubMed] [Google Scholar]
- 360.Moreno-Ruiz LA, Madrid-Miller A, Martínez-Flores JE, González-Hermosillo JA, Arenas-Fonseca J, Zamorano-Velázquez N, et al. Left Atrial Longitudinal Strain by Speckle Tracking as Independent Predictor of Recurrence after Electrical Cardioversion in Persistent and Long Standing Persistent Non-Valvular Atrial Fibrillation. Int J Cardiovasc Imaging. 2019;35(9):1587–1596. doi: 10.1007/s10554-019-01597-7. [DOI] [PMC free article] [PubMed] [Google Scholar]
- 361.Mochizuki A, Yuda S, Fujito T, Kawamukai M, Muranaka A, Nagahara D, et al. Left Atrial Strain Assessed by Three-Dimensional Speckle Tracking Echocardiography Predicts Atrial Fibrillation Recurrence after Catheter Ablation in Patients with Paroxysmal Atrial Fibrillation. J Echocardiogr. 2017;15(2):79–87. doi: 10.1007/s12574-017-0329-5. [DOI] [PubMed] [Google Scholar]
- 362.Parwani AS, Morris DA, Blaschke F, Huemer M, Pieske B, Haverkamp W, et al. Left Atrial Strain Predicts Recurrence of Atrial Arrhythmias after Catheter Ablation of Persistent Atrial Fibrillation. Open Heart. 2017;4(1):e000572. doi: 10.1136/openhrt-2016-000572. [DOI] [PMC free article] [PubMed] [Google Scholar]
- 363.Nielsen AB, Skaarup KG, Lassen MCH, Djernæs K, Hansen ML, Svendsen JH, et al. Usefulness of Left Atrial Speckle Tracking Echocardiography in Predicting Recurrence of Atrial Fibrillation after Radiofrequency Ablation: A Systematic Review and Meta-Analysis. Int J Cardiovasc Imaging. 2020;36(7):1293–1309. doi: 10.1007/s10554-020-01828-2. [DOI] [PubMed] [Google Scholar]
- 364.Leung M, van Rosendael PJ, Abou R, Marsan NA, Leung DY, Delgado V, et al. Left Atrial Function to Identify Patients with Atrial Fibrillation at High Risk of Stroke: New Insights from a Large Registry. Eur Heart J. 2018;39(16):1416–1425. doi: 10.1093/eurheartj/ehx736. [DOI] [PubMed] [Google Scholar]
- 365.Marques-Alves P, Marinho AV, Domingues C, Baptista R, Castro G, Martins R, et al. Left Atrial Mechanics in Moderate Mitral Valve Disease: Earlier Markers of Damage. Int J Cardiovasc Imaging. 2020;36(1):23–31. doi: 10.1007/s10554-019-01683-w. [DOI] [PubMed] [Google Scholar]
- 366.Cameli M, Sciaccaluga C, Mandoli GE, D’Ascenzi F, Tsioulpas C, Mondillo S. The Role of the Left Atrial Function in the Surgical Management of Aortic and Mitral Valve Disease. Echocardiography. 2019;36(8):1559–1565. doi: 10.1111/echo.14426. [DOI] [PubMed] [Google Scholar]
- 367.Mandoli GE, Pastore MC, Benfari G, Bisleri G, Maccherini M, Lisi G, et al. Left Atrial Strain as a pre-Operative Prognostic Marker for Patients with Severe Mitral Regurgitation. Int J Cardiol. 2021;324:139–145. doi: 10.1016/j.ijcard.2020.09.009. [DOI] [PubMed] [Google Scholar]
- 368.Debonnaire P, Leong DP, Witkowski TG, Al Amri I, Joyce E, Katsanos S, et al. Left Atrial Function by Two-Dimensional Speckle-Tracking Echocardiography in Patients with Severe Organic Mitral Regurgitation: Association with Guidelines-Based Surgical Indication and Postoperative (Long-Term) Survival. J Am Soc Echocardiogr. 2013;26(9):1053–1062. doi: 10.1016/j.echo.2013.05.019. [DOI] [PubMed] [Google Scholar]
- 369.Guichard JB, Nattel S. Atrial Cardiomyopathy: A Useful Notion in Cardiac Disease Management or a Passing Fad? J Am Coll Cardiol. 2017;70(6):756–765. doi: 10.1016/j.jacc.2017.06.033. [DOI] [PubMed] [Google Scholar]
- 370.Antoni ML, Ten Brinke EA, Marsan NA, Atary JZ, Holman ER, van der Wall EE, et al. Comprehensive Assessment of Changes in Left Atrial Volumes and Function after ST-Segment Elevation Acute Myocardial Infarction: Role of Two-Dimensional Speckle-Tracking Strain Imaging. J Am Soc Echocardiogr. 2011;24(10):1126–1133. doi: 10.1016/j.echo.2011.06.017. [DOI] [PubMed] [Google Scholar]
- 371.Antoni ML, ten Brinke EA, Atary JZ, Marsan NA, Holman ER, Schalij MJ, et al. Left Atrial Strain is Related to Adverse Events in Patients after Acute Myocardial Infarction Treated with Primary Percutaneous Coronary Intervention. Heart. 2011;97(16):1332–1337. doi: 10.1136/hrt.2011.227678. [DOI] [PubMed] [Google Scholar]
- 372.Padeletti M, Cameli M, Lisi M, Malandrino A, Zacà V, Mondillo S. Reference Values of Right Atrial Longitudinal Strain Imaging by Two-Dimensional Speckle Tracking. Echocardiography. 2012;29(2):147–152. doi: 10.1111/j.1540-8175.2011.01564.x. [DOI] [PubMed] [Google Scholar]
- 373.Vitarelli A, Mangieri E, Gaudio C, Tanzilli G, Miraldi F, Capotosto L. Right Atrial Function by Speckle Tracking Echocardiography in Atrial Septal Defect: Prediction of Atrial Fibrillation. Clin Cardiol. 2018;41(10):1341–1347. doi: 10.1002/clc.23051. [DOI] [PMC free article] [PubMed] [Google Scholar]
- 374.Alenezi F, Mandawat A, Il’Giovine ZJ, Shaw LK, Siddiqui I, Tapson VF, et al. Clinical Utility and Prognostic Value of Right Atrial Function in Pulmonary Hypertension. Circ Cardiovasc Imaging. 2018;11(11):e006984. doi: 10.1161/CIRCIMAGING.117.006984. [DOI] [PMC free article] [PubMed] [Google Scholar]
- 375.Sengupta PP, Korinek J, Belohlavek M, Narula J, Vannan MA, Jahangir A, et al. Left Ventricular Structure and Function: Basic Science for Cardiac Imaging. J Am Coll Cardiol. 2006;48(10):1988–2001. doi: 10.1016/j.jacc.2006.08.030. [DOI] [PubMed] [Google Scholar]
- 376.Torrent-Guasp F, Ballester M, Buckberg GD, Carreras F, Flotats A, et al. Spatial Orientation of the Ventricular Muscle Band: Physiologic Contribution and Surgical Implications. J Thorac Cardiovasc Surg. 2001;122(2):389–392. doi: 10.1067/mtc.2001.113745. [DOI] [PubMed] [Google Scholar]
- 377.Taber LA, Yang M, Podszus WW. Mechanics of Ventricular Torsion. J Biomech. 1996;29(6):745–752. doi: 10.1016/0021-9290(95)00129-8. [DOI] [PubMed] [Google Scholar]
- 378.Henson RE, Song SK, Pastorek JS, Ackerman JJ, Lorenz CH. Left Ventricular Torsion is Equal in Mice and Humans. Am J Physiol Heart Circ Physiol. 2000;278(4):H1117–H1123. doi: 10.1152/ajpheart.2000.278.4.H1117. [DOI] [PubMed] [Google Scholar]
- 379.Granzier HL, Labeit S. The Giant Protein Titin: A Major Player in Myocardial Mechanics, Signaling, and Disease. Circ Res. 2004;94(3):284–295. doi: 10.1161/01.RES.0000117769.88862.F8. [DOI] [PubMed] [Google Scholar]
- 380.Notomi Y, Martin-Miklovic MG, Oryszak SJ, Shiota T, Deserranno D, Popovic ZB, et al. Enhanced Ventricular Untwisting During Exercise: A Mechanistic Manifestation of Elastic Recoil Described by Doppler Tissue Imaging. Circulation. 2006;113(21):2524–2533. doi: 10.1161/CIRCULATIONAHA.105.596502. [DOI] [PubMed] [Google Scholar]
- 381.Dong SJ, Hees PS, Huang WM, Buffer SA, Jr, Weiss JL, Shapiro EP. Independent Effects of Preload, Afterload, and Contractility on Left Ventricular Torsion. Am J Physiol. 1999;277(3):H1053–H1060. doi: 10.1152/ajpheart.1999.277.3.H1053. [DOI] [PubMed] [Google Scholar]
- 382.Helle-Valle T, Crosby J, Edvardsen T, Lyseggen E, Amundsen BH, Smith HJ, et al. New Noninvasive Method for Assessment of Left Ventricular Rotation: Speckle Tracking Echocardiography. Circulation. 2005;112(20):3149–3156. doi: 10.1161/CIRCULATIONAHA.104.531558. [DOI] [PubMed] [Google Scholar]
- 383.Gayat E, Ahmad H, Weinert L, Lang RM, Mor-Avi V. Reproducibility and Inter-Vendor Variability of Left Ventricular Deformation Measurements by Three-Dimensional Speckle-Tracking Echocardiography. J Am Soc Echocardiogr. 2011;24(8):878–885. doi: 10.1016/j.echo.2011.04.016. [DOI] [PubMed] [Google Scholar]
- 384.Stöhr EJ, Shave RE, Baggish AL, Weiner RB. Left Ventricular Twist Mechanics in the Context of Normal Physiology and Cardiovascular Disease: A Review of Studies Using Speckle Tracking Echocardiography. Am J Physiol Heart Circ Physiol. 2016;311(3):H633–H644. doi: 10.1152/ajpheart.00104.2016. [DOI] [PubMed] [Google Scholar]
- 385.Yancy CW, Jessup M, Bozkurt B, Butler J, Casey DE, Jr, Colvin MM, et al. 2017 ACC/AHA/HFSA Focused Update of the 2013 ACCF/AHA Guideline for the Management of Heart Failure: A Report of the American College of Cardiology/American Heart Association Task Force on Clinical Practice Guidelines and the Heart Failure Society of America. Circulation. 2017;136(6):e137–e161. doi: 10.1161/CIR.0000000000000509. [DOI] [PubMed] [Google Scholar]
- 386.Gorcsan J, 3rd, Tanabe M, Bleeker GB, Suffoletto MS, Thomas NC, Saba S, et al. Combined Longitudinal and Radial Dyssynchrony Predicts Ventricular Response after Resynchronization Therapy. J Am Coll Cardiol. 2007;50(15):1476–1483. doi: 10.1016/j.jacc.2007.06.043. [DOI] [PubMed] [Google Scholar]
- 387.Leenders GE, De Boeck BW, Teske AJ, Meine M, Bogaard MD, Prinzen FW, et al. Septal Rebound Stretch is a Strong Predictor of Outcome after Cardiac Resynchronization Therapy. J Card Fail. 2012;18(5):404–412. doi: 10.1016/j.cardfail.2012.02.001. [DOI] [PubMed] [Google Scholar]
- 388.Risum N, Strauss D, Sogaard P, Loring Z, Hansen TF, Bruun NE, et al. Left Bundle-Branch Block: The Relationship between Electrocardiogram Electrical Activation and Echocardiography Mechanical Contraction. Am Heart J. 2013;166(2):340–348. doi: 10.1016/j.ahj.2013.04.005. [DOI] [PubMed] [Google Scholar]
- 389.van der Bijl P, Vo NM, Kostyukevich MV, Mertens B, Marsan NA, Delgado V, et al. Prognostic Implications of Global, Left Ventricular Myocardial Work Efficiency Before Cardiac Resynchronization Therapy. Eur Heart J Cardiovasc Imaging. 2019;20(12):1388–1394. doi: 10.1093/ehjci/jez095. [DOI] [PubMed] [Google Scholar]
- 390.Khan FZ, Virdee MS, Palmer CR, Pugh PJ, O’Halloran D, Elsik M, et al. Targeted Left Ventricular Lead Placement to Guide Cardiac Resynchronization Therapy: The TARGET Study: A Randomized, Controlled Trial. J Am Coll Cardiol. 2012;59(17):1509–1518. doi: 10.1016/j.jacc.2011.12.030. [DOI] [PubMed] [Google Scholar]
- 391.Marek JJ, Saba S, Onishi T, Ryo K, Schwartzman D, Adelstein EC, et al. Usefulness of Echocardiographically Guided Left Ventricular Lead Placement for Cardiac Resynchronization Therapy in Patients with Intermediate QRS width and Non-Left Bundle Branch Block Morphology. Am J Cardiol. 2014;113(1):107–116. doi: 10.1016/j.amjcard.2013.09.024. [DOI] [PubMed] [Google Scholar]
- 392.Tayal B, Gorcsan J, 3rd, Delgado-Montero A, Marek JJ, Haugaa KH, Ryo K, et al. Mechanical Dyssynchrony by Tissue Doppler Cross-Correlation is Associated with Risk for Complex Ventricular Arrhythmias after Cardiac Resynchronization Therapy. J Am Soc Echocardiogr. 2015;28(12):1474–1481. doi: 10.1016/j.echo.2015.07.021. [DOI] [PubMed] [Google Scholar]
- 393.Chung ES, Leon AR, Tavazzi L, Sun JP, Nihoyannopoulos P, Merlino J, et al. Results of the Predictors of Response to CRT (PROSPECT) trial. Circulation. 2008;117(20):2608–2616. doi: 10.1161/CIRCULATIONAHA.107.743120. [DOI] [PubMed] [Google Scholar]
- 394.Šipula D, Kozák M, Šipula J, Homza M, Plášek J. Cardiac Strains As a Tool for Optimization of Cardiac Resynchronization Therapy in Non-responders: a Pilot Study. Open Med. 2019;14:945–952. doi: 10.1515/med-2019-0111. [DOI] [PMC free article] [PubMed] [Google Scholar]
- 395.Suga H. Total Mechanical Energy of a Ventricle Model and Cardiac Oxygen Consumption. Am J Physiol. 1979;236(3):H498–H505. doi: 10.1152/ajpheart.1979.236.3.H498. [DOI] [PubMed] [Google Scholar]
- 396.Hisano R, Cooper G., 4th Correlation of Force-Length Area with Oxygen Consumption in Ferret Papillary Muscle. Circ Res. 1987;61(3):318–328. doi: 10.1161/01.res.61.3.318. [DOI] [PubMed] [Google Scholar]
- 397.Takaoka H, Takeuchi M, Odake M, Yokoyama M. Assessment of Myocardial Oxygen Consumption (Vo2) and Systolic Pressure-Volume Area (PVA) in Human Hearts. Eur Heart J. 1992;13(Suppl E):85–90. doi: 10.1093/eurheartj/13.suppl_e.85. [DOI] [PubMed] [Google Scholar]
- 398.Russell K, Eriksen M, Aaberge L, Wilhelmsen N, Skulstad H, Remme EW, et al. A Novel Clinical Method for Quantification of Regional Left Ventricular Pressure-Strain Loop Area: A Non-Invasive Index of Myocardial Work. Eur Heart J. 2012;33(6):724–733. doi: 10.1093/eurheartj/ehs016. [DOI] [PMC free article] [PubMed] [Google Scholar]
- 399.Russell K, Opdahl A, Remme EW, Gjesdal O, Skulstad H, Kongsgaard E, et al. Evaluation of Left Ventricular Dyssynchrony by Onset of Active Myocardial Force Generation: A Novel Method that Differentiates between Electrical and Mechanical Etiologies. Circ Cardiovasc Imaging. 2010;3(4):405–414. doi: 10.1161/CIRCIMAGING.109.905539. [DOI] [PubMed] [Google Scholar]
- 400.Gjesdal O, Remme EW, Opdahl A, Skulstad H, Russell K, Kongsgaard E, et al. Mechanisms of Abnormal Systolic Motion of the Interventricular Septum During Left Bundle-Branch Block. Circ Cardiovasc Imaging. 2011;4(3):264–273. doi: 10.1161/CIRCIMAGING.110.961417. [DOI] [PubMed] [Google Scholar]
- 401.Russell K, Smiseth OA, Gjesdal O, Qvigstad E, Norseng PA, Sjaastad I, et al. Mechanism of Prolonged Electromechanical Delay in Late Activated Myocardium During Left Bundle Branch Block. Am J Physiol Heart Circ Physiol. 2011;301(6):H2334–H2343. doi: 10.1152/ajpheart.00644.2011. [DOI] [PubMed] [Google Scholar]
- 402.Sletten OJ, Aalen J, Khan FH, Larsen CK, Inoue K, Remme EW, et al. Myocardial Work Exposes AfterloadDependent Changes in Strain. Eur Heart J Cardiovasc Imaging. 2020;21(Supp 1):i40. doi: 10.1093/ehjci/jez319.036. [DOI] [Google Scholar]
- 403.Manganaro R, Marchetta S, Dulgheru R, Ilardi F, Sugimoto T, Robinet S, et al. Echocardiographic Reference Ranges for Normal Non-Invasive Myocardial Work Indices: Results from the EACVI NORRE Study. Eur Heart J Cardiovasc Imaging. 2019;20(5):582–590. doi: 10.1093/ehjci/jey188. [DOI] [PubMed] [Google Scholar]
- 404.Galli E, John-Matthwes B, Rousseau C, Schnell F, Leclercq C, Donal E. Echocardiographic Reference Ranges for Myocardial Work in Healthy Subjects: A Preliminary Study. Echocardiography. 2019;36(10):1814–1824. doi: 10.1111/echo.14494. [DOI] [PubMed] [Google Scholar]
- 405.Galli E, Leclercq C, Hubert A, Bernard A, Smiseth OA, Mabo P, et al. Role of Myocardial Constructive Work in the Identification of Responders to CRT. Eur Heart J Cardiovasc Imaging. 2018;19(9):1010–1018. doi: 10.1093/ehjci/jex191. [DOI] [PubMed] [Google Scholar]
- 406.Vecera J, Penicka M, Eriksen M, Russell K, Bartunek J, Vanderheyden M, et al. Wasted Septal Work in Left Ventricular Dyssynchrony: A Novel Principle to Predict Response to Cardiac Resynchronization Therapy. Eur Heart J Cardiovasc Imaging. 2016;17(6):624–632. doi: 10.1093/ehjci/jew019. [DOI] [PMC free article] [PubMed] [Google Scholar]
- 407.Edwards NFA, Scalia GM, Shiino K, Sabapathy S, Anderson B, Chamberlain R, et al. Global Myocardial Work Is Superior to Global Longitudinal Strain to Predict Significant Coronary Artery Disease in Patients with Normal Left Ventricular Function and Wall Motion. J Am Soc Echocardiogr. 2019;32(8):947–957. doi: 10.1016/j.echo.2019.02.014. [DOI] [PubMed] [Google Scholar]
- 408.Meimoun P, Abdani S, Stracchi V, Elmkies F, Boulanger J, Botoro T, et al. Usefulness of Noninvasive Myocardial Work to Predict Left Ventricular Recovery and Acute Complications after Acute Anterior Myocardial Infarction Treated by Percutaneous Coronary Intervention. J Am Soc Echocardiogr. 2020;33(10):1180–1190. doi: 10.1016/j.echo.2020.07.008. [DOI] [PubMed] [Google Scholar]
- 409.Lustosa RP, Butcher SC, van der Bijl P, El Mahdiui M, Montero-Cabezas JM, Kostyukevich MV, et al. Global Left Ventricular Myocardial Work Efficiency and Long-Term Prognosis in Patients after ST-Segment-Elevation Myocardial Infarction. Circ Cardiovasc Imaging. 2021;14(3):e012072. doi: 10.1161/CIRCIMAGING.120.012072. [DOI] [PubMed] [Google Scholar]
- 410.Nabeshima Y, Seo Y, Takeuchi M. A Review of Current Trends in Three-Dimensional Analysis of Left Ventricular Myocardial Strain. 23Cardiovasc Ultrasound. 2020;18(1) doi: 10.1186/s12947-020-00204-3. [DOI] [PMC free article] [PubMed] [Google Scholar]
- 411.Muraru D, Cucchini U, Mihăilă S, Miglioranza MH, Aruta P, Cavalli G, et al. Left Ventricular Myocardial Strain by Three-Dimensional Speckle-Tracking Echocardiography in Healthy Subjects: Reference Values and Analysis of Their Physiologic and Technical Determinants. J Am Soc Echocardiogr. 2014;27(8):858–871.e1. doi: 10.1016/j.echo.2014.05.010. [DOI] [PubMed] [Google Scholar]
- 412.Badano LP, Boccalini F, Muraru D, Bianco LD, Peluso D, Bellu R, et al. Current Clinical Applications of Transthoracic Three-Dimensional Echocardiography. J Cardiovasc Ultrasound. 2012;20(1):1–22. doi: 10.4250/jcu.2012.20.1.1. [DOI] [PMC free article] [PubMed] [Google Scholar]
- 413.Mor-Avi V, Lang RM, Badano LP, Belohlavek M, Cardim NM, Derumeaux G, et al. Current and Evolving Echocardiographic Techniques for the Quantitative Evaluation of Cardiac Mechanics: ASE/EAE Consensus Statement on Methodology and Indications Endorsed by the Japanese Society of Echocardiography. J Am Soc Echocardiogr. 2011;24(3):277–313. doi: 10.1016/j.echo.2011.01.015. [DOI] [PubMed] [Google Scholar]
- 414.Teixeira R. Three-Dimensional Speckle Tracking Echocardiography: The Future Is Now. Rev Port Cardiol. 2018 Apr;37(4):339–340. doi: 10.1016/j.repc.2018.03.008. [DOI] [PubMed] [Google Scholar]
- 415.Smith BC, Dobson G, Dawson D, Charalampopoulos A, Grapsa J, Nihoyannopoulos P. Three-Dimensional Speckle Tracking of the Right Ventricle: Toward Optimal Quantification of Right Ventricular Dysfunction in Pulmonary Hypertension. J Am Coll Cardiol. 2014;64(1):41–51. doi: 10.1016/j.jacc.2014.01.084. [DOI] [PubMed] [Google Scholar]
- 416.Cuspidi C, Tadic M, Sala C, Gherbesi E, Grassi G, Mancia G. Left Atrial Function in Elite Athletes: A Meta-Analysis of Two-Dimensional Speckle Tracking Echocardiographic Studies. Clin Cardiol. 2019;42(5):579–587. doi: 10.1002/clc.23180. [DOI] [PMC free article] [PubMed] [Google Scholar]
- 417.Sabatino J, Di Salvo G, Prota C, Bucciarelli V, Josen M, Paredes J, et al. Left Atrial Strain to Identify Diastolic Dysfunction in Children with Cardiomyopathies. J Clin Med. 2019;8(8):1243. doi: 10.3390/jcm8081243. [DOI] [PMC free article] [PubMed] [Google Scholar]
- 418.Simpson RM, Keegan J, Firmin DN. MR Assessment of Regional Myocardial Mechanics. J Magn Reson Imaging. 2013;37(3):576–599. doi: 10.1002/jmri.23756. [DOI] [PubMed] [Google Scholar]
- 419.Andre F, Steen H, Matheis P, Westkott M, Breuninger K, Sander Y, et al. Age- and Gender-Related Normal Left Ventricular Deformation Assessed by Cardiovascular Magnetic Resonance Feature Tracking. 25J Cardiovasc Magn Reson. 2015;17(1) doi: 10.1186/s12968-015-0123-3. [DOI] [PMC free article] [PubMed] [Google Scholar]
- 420.Schuster A, Stahnke VC, Unterberg-Buchwald C, Kowallick JT, Lamata P, Steinmetz M, et al. Cardiovascular Magnetic Resonance Feature-Tracking Assessment of Myocardial Mechanics: Intervendor Agreement and Considerations Regarding Reproducibility. Clin Radiol. 2015;70(9):989–998. doi: 10.1016/j.crad.2015.05.006. [DOI] [PMC free article] [PubMed] [Google Scholar]
- 421.Augustine D, Lewandowski AJ, Lazdam M, Rai A, Francis J, Myerson S, et al. Global and Regional Left Ventricular Myocardial Deformation Measures by Magnetic Resonance Feature Tracking in Healthy Volunteers: Comparison with Tagging and Relevance of Gender. 8J Cardiovasc Magn Reson. 2013;15(1) doi: 10.1186/1532-429X-15-8. [DOI] [PMC free article] [PubMed] [Google Scholar]
- 422.Taylor RJ, Moody WE, Umar F, Edwards NC, Taylor TJ, Stegemann B, et al. Myocardial Strain Measurement with Feature-Tracking Cardiovascular Magnetic resonance: normal values. Eur Heart J Cardiovasc Imaging. 2015;16(8):871–881. doi: 10.1093/ehjci/jev006. [DOI] [PubMed] [Google Scholar]
- 423.Heiberg J, Ringgaard S, Schmidt MR, Redington A, Hjortdal VE. Structural and Functional Alterations of the Right Ventricle are Common in Adults Operated for Ventricular Septal Defect as Toddlers. Eur Heart J Cardiovasc Imaging. 2015;16(5):483–489. doi: 10.1093/ehjci/jeu292. [DOI] [PubMed] [Google Scholar]
- 424.Vo HQ, Marwick TH, Negishi K. MRI-Derived Myocardial Strain Measures in Normal Subjects. JACC Cardiovasc Imaging. 2018 Feb;11(2):196–205. doi: 10.1016/j.jcmg.2016.12.025. Pt 1. [DOI] [PubMed] [Google Scholar]
- 425.Erley J, Genovese D, Tapaskar N, Alvi N, Rashedi N, Besser SA, et al. Echocardiography and Cardiovascular Magnetic Resonance Based Evaluation of Myocardial Strain and Relationship with Late Gadolinium Enhancement. 46J Cardiovasc Magn Reson. 2019;21(1) doi: 10.1186/s12968-019-0559-y. [DOI] [PMC free article] [PubMed] [Google Scholar]
- 426.Buss SJ, Breuninger K, Lehrke S, Voss A, Galuschky C, Lossnitzer D, et al. Assessment of Myocardial Deformation with Cardiac Magnetic Resonance Strain Imaging Improves Risk Stratification in Patients with Dilated Cardiomyopathy. Eur Heart J Cardiovasc Imaging. 2015;16(3):307–315. doi: 10.1093/ehjci/jeu181. [DOI] [PubMed] [Google Scholar]
- 427.Ito H, Ishida M, Makino W, Goto Y, Ichikawa Y, Kitagawa K, et al. Cardiovascular Magnetic Resonance Feature Tracking for Characterization of Patients with Heart Failure with Preserved Ejection Fraction: Correlation of Global Longitudinal Strain with Invasive Diastolic Functional Indices. 42J Cardiovasc Magn Reson. 2020;22(1) doi: 10.1186/s12968-020-00636-w. [DOI] [PMC free article] [PubMed] [Google Scholar]
- 428.Amaki M, Savino J, Ain DL, Sanz J, Pedrizzetti G, Kulkarni H, et al. Diagnostic Concordance of Echocardiography and Cardiac Magnetic Resonance-Based Tissue Tracking for Differentiating Constrictive Pericarditis from Restrictive Cardiomyopathy. Circ Cardiovasc Imaging. 2014;7(5):819–827. doi: 10.1161/CIRCIMAGING.114.002103. [DOI] [PubMed] [Google Scholar]
- 429.Weigand J, Nielsen JC, Sengupta PP, Sanz J, Srivastava S, Uppu S. Feature Tracking-Derived Peak Systolic Strain Compared to Late Gadolinium Enhancement in Troponin-Positive Myocarditis: A Case-Control Study. Pediatr Cardiol. 2016;37(4):696–703. doi: 10.1007/s00246-015-1333-z. [DOI] [PubMed] [Google Scholar]
- 430.Oda S, Utsunomiya D, Nakaura T, Yuki H, Kidoh M, Morita K, et al. Identification and Assessment of Cardiac Amyloidosis by Myocardial Strain Analysis of Cardiac Magnetic Resonance Imaging. Circ J. 2017;81(7):1014–1021. doi: 10.1253/circj.CJ-16-1259. [DOI] [PubMed] [Google Scholar]
- 431.Mathur S, Dreisbach JG, Karur GR, Iwanochko RM, Morel CF, Wasim S, et al. Loss of Base-To-Apex Circumferential Strain Gradient Assessed by Cardiovascular Magnetic Resonance in Fabry Disease: Relationship to T1 Mapping, Late Gadolinium Enhancement and Hypertrophy. 45J Cardiovasc Magn Reson. 2019;21(1) doi: 10.1186/s12968-019-0557-0. [DOI] [PMC free article] [PubMed] [Google Scholar]
- 432.Smith BM, Dorfman AL, Yu S, Russell MW, Agarwal PP, Mahani MG, et al. Relation of Strain by Feature Tracking and Clinical Outcome in Children, Adolescents, and Young Adults with Hypertrophic Cardiomyopathy. Am J Cardiol. 2014;114(8):1275–1280. doi: 10.1016/j.amjcard.2014.07.051. [DOI] [PubMed] [Google Scholar]
- 433.Neisius U, Myerson L, Fahmy AS, Nakamori S, El-Rewaidy H, Joshi G, et al. Cardiovascular Magnetic Resonance Feature Tracking Strain Analysis for Discrimination between Hypertensive Heart Disease and Hypertrophic Cardiomyopathy. PLoS One. 2019;14(8):e0221061. doi: 10.1371/journal.pone.0221061. [DOI] [PMC free article] [PubMed] [Google Scholar]
- 434.Schneeweis C, Qiu J, Schnackenburg B, Berger A, Kelle S, Fleck E, et al. Value of Additional Strain Analysis with Feature Tracking in Dobutamine Stress Cardiovascular Magnetic Resonance for Detecting Coronary Artery Disease. 72J Cardiovasc Magn Reson. 2014;16(1) doi: 10.1186/s12968-014-0072-2. [DOI] [PMC free article] [PubMed] [Google Scholar]
- 435.Reindl M, Tiller C, Holzknecht M, Lechner I, Beck A, Plappert D, et al. Prognostic Implications of Global Longitudinal Strain by Feature-Tracking Cardiac Magnetic Resonance in ST-Elevation Myocardial Infarction. Circ Cardiovasc Imaging. 2019;12(11):e009404. doi: 10.1161/CIRCIMAGING.119.009404. [DOI] [PubMed] [Google Scholar]
- 436.Al Musa T, Uddin A, Swoboda PP, Garg P, Fairbairn TA, Dobson LE, et al. Myocardial Strain and Symptom Severity in Severe Aortic Stenosis: Insights from Cardiovascular Magnetic Resonance. Quant Imaging Med Surg. 2017;7(1):38–47. doi: 10.21037/qims.2017.02.05. [DOI] [PMC free article] [PubMed] [Google Scholar]
- 437.Burris NS, Lima APS, Hope MD, Ordovas KG. Feature Tracking Cardiac MRI Reveals Abnormalities in Ventricular Function in Patients with Bicuspid Aortic Valve and Preserved Ejection Fraction. Tomography. 2018;4(1):26–32. doi: 10.18383/j.tom.2018.00005. [DOI] [PMC free article] [PubMed] [Google Scholar]
- 438.Nakano S, Takahashi M, Kimura F, Senoo T, Saeki T, Ueda S, et al. Cardiac Magnetic Resonance Imaging-Based Myocardial Strain Study for Evaluation of Cardiotoxicity in Breast Cancer Patients Treated with Trastuzumab: A Pilot Study to Evaluate the Feasibility of the Method. Cardiol J. 2016;23(3):270–280. doi: 10.5603/CJ.a2016.0023. [DOI] [PubMed] [Google Scholar]
- 439.Romano S, Judd RM, Kim RJ, Kim HW, Klem I, Heitner JF, et al. Feature-Tracking Global Longitudinal Strain Predicts Death in a Multicenter Population of Patients with Ischemic and Nonischemic Dilated Cardiomyopathy Incremental to Ejection Fraction and Late Gadolinium Enhancement. JACC Cardiovasc Imaging. 2018;11(10):1419–1429. doi: 10.1016/j.jcmg.2017.10.024. [DOI] [PMC free article] [PubMed] [Google Scholar]
- 440.Scatteia A, Baritussio A, Bucciarelli-Ducci C. Strain Imaging Using Cardiac Magnetic Resonance. Heart Fail Rev. 2017;22(4):465–476. doi: 10.1007/s10741-017-9621-8. [DOI] [PMC free article] [PubMed] [Google Scholar]
- 441.Kowallick JT, Kutty S, Edelmann F, Chiribiri A, Villa A, Steinmetz M, et al. Quantification of Left Atrial Strain and Strain Rate Using Cardiovascular Magnetic Resonance Myocardial Feature Tracking: A Feasibility Study. 60J Cardiovasc Magn Reson. 2014;16(1) doi: 10.1186/s12968-014-0060-6. [DOI] [PMC free article] [PubMed] [Google Scholar]
- 442.Habibi M, Chahal H, Opdahl A, Gjesdal O, Helle-Valle TM, Heckbert SR, et al. Association of CMR-Measured LA Function with Heart Failure Development: Results from the MESA Study. JACC Cardiovasc Imaging. 2014;7(6):570–579. doi: 10.1016/j.jcmg.2014.01.016. [DOI] [PMC free article] [PubMed] [Google Scholar]
- 443.Chirinos JA, Sardana M, Ansari B, Satija V, Kuriakose D, Edelstein I, et al. Left Atrial Phasic Function by Cardiac Magnetic Resonance Feature Tracking Is a Strong Predictor of Incident Cardiovascular Events. Circ Cardiovasc Imaging. 2018;11(12):e007512. doi: 10.1161/CIRCIMAGING.117.007512. [DOI] [PMC free article] [PubMed] [Google Scholar]
- 444.Fukui M, Xu J, Abdelkarim I, Sharbaugh MS, Thoma FW, Althouse AD, et al. Global Longitudinal Strain Assessment by Computed Tomography in Severe Aortic Stenosis Patients - Feasibility Using Feature Tracking Analysis. J Cardiovasc Comput Tomogr. 2019;13(2):157–162. doi: 10.1016/j.jcct.2018.10.020. [DOI] [PubMed] [Google Scholar]
- 445.Szilveszter B, Nagy AI, Vattay B, Apor A, Kolossváry M, Bartykowszki A, et al. Left Ventricular and Atrial Strain Imaging with Cardiac Computed Tomography: Validation Against Echocardiography. J Cardiovasc Comput Tomogr. 2020;14(4):363–369. doi: 10.1016/j.jcct.2019.12.004. [DOI] [PubMed] [Google Scholar]
- 446.Han X, Cao Y, Ju Z, Liu J, Li N, Li Y, et al. Assessment of Regional Left Ventricular Myocardial Strain in Patients with Left Anterior Descending Coronary Stenosis Using Computed Tomography Feature Tracking. 362BMC Cardiovasc Disord. 2020;20(1) doi: 10.1186/s12872-020-01644-5. [DOI] [PMC free article] [PubMed] [Google Scholar]


