

Abstract
Background
Aspiration pneumonitis is a syndrome resulting from the inhalation of gastric contents. The incidence in obstetric anaesthesia has fallen, largely due to improved anaesthetic techniques and the increased use of regional anaesthesia at caesarean section. However, aspiration pneumonitis is still a cause of maternal morbidity and mortality, and it is important to use effective prophylaxis.
Objectives
To determine whether interventions given prior to caesarean section reduce the risk of aspiration pneumonitis in women with an uncomplicated pregnancy.
Search methods
We searched the Cochrane Pregnancy and Childbirth Group's Trials Register (30 April 2013).
Selection criteria
Randomised controlled trials were included. Quasi‐randomised trials were excluded.
Data collection and analysis
Review authors independently assessed the studies for inclusion, assessed risk of bias and carried out data extraction. Data entry was checked. Fixed‐effect meta‐analysis was used to combine data where it was reasonable to assume that studies were estimating the same underlying treatment effect. If substantial clinical or statistical heterogeneity was detected, we used random‐effects analysis to produce an overall summary.
Main results
Thirty‐two studies were included in this review. However, only 22 studies, involving 2658 women, provided data for analysis. All the women in the included studies had a caesarean section under general anaesthesia. The studies covered a number of comparisons, but were mostly small and of unclear or poor quality.
When compared with no treatment or placebo, there was a significant reduction in the risk of intragastric pH < 2.5 with antacids (risk ratio (RR) 0.17, 95% confidence interval (CI) 0.09 to 0.32, two studies, 108 women), H2 antagonists (RR 0.09, 95% CI 0.05 to 0.18, two studies, 170 women) and proton pump antagonists (RR 0.26, 95% CI 0.14 to 0.46, one study 80 women). H2 antagonists were associated with a reduced the risk of intragastric pH < 2.5 at intubation when compared with proton pump antagonists (RR 0.39, 95% CI 0.16 to 0.97, one study, 120 women), but compared with antacids the findings were unclear. The combined use of 'antacids plus H2 antagonists' was associated with a significant reduction in the risk of intragastric pH < 2.5 at intubation when compared with placebo (RR 0.02, 95% CI 0.00 to 0.15, one study, 89 women) or compared with antacids alone (RR 0.12, 95% CI 0.02 to 0.92, one study, 119 women).
Authors' conclusions
The quality of the evidence was poor, but the findings suggest that the combination of antacids plus H2 antagonists was more effective than no intervention, and superior to antacids alone in preventing low gastric pH. However, none of the studies assessed potential adverse effects or substantive clinical outcomes. These findings are relevant for all women undergoing caesarean section under general anaesthesia.
Plain language summary
Interventions at caesarean section for reducing the risk of lung damage from inhaling stomach contents during anaesthesia
Stomach contents can regurgitate up the gullet into the wind pipe and enter the lungs when there is no cough reflex, e.g. during general anaesthesia. Solid food can block airways and cause breathing difficulties. The acidic liquid from the stomach can damage the lungs. This is called aspiration pneumonitis or Mendelson’s syndrome. It can lead to serious illness or even death. Many caesarean sections now are undertaken using epidural or spinal anaesthesia, and here the risk is much lower because the woman stays awake and the cough reflex remains intact. A breathing tube, which provides a seal, is normally placed in the windpipe when setting up a general anaesthetic to try to prevent this problem. However, aspiration can still occur before the tube is inserted and when it is removed. It is thought that both the acidity and amount of fluid inhaled contribute to how much damage occurs in the lungs in the event of inhalation of the fluid into the lungs and how sick people become.
Thirty‐two studies were included in this review. However, only 22 studies, involving 2658 women, provided data for analysis, looking at interventions given prior to caesarean section for reducing the risk of aspiration. There were several different drugs and drug combinations being considered and the studies were generally of poor or questionable quality. Antacids (like sodium citrate), H2 receptor antagonists (like ranitidine), proton pump antagonists (like omeprazole), all reduced the acidity of the stomach contents. An antacid plus an H2 receptor antagonist also reduced acidity. In theory, a combination like this, where the antacid acts quickly and the H2 receptor antagonists takes a little longer, should protect at periods of greatest risk, i.e. the beginning and end of the procedure (i.e. intubation and extubation). More research is needed to identify the best combination of drugs and to check for possible adverse effects.
Background
Description of the condition
Aspiration pneumonitis was first described by Mendelson in the 1940s (Mendelson 1946). It occurs when gastric acid gains access to the lungs in the absence of a cough reflex. Although rare, during anaesthesia for caesarean section, aspiration pneumonitis is still a cause of maternal mortality even in well‐resourced countries such as the United Kingdom (CEMD 2001). Aspiration pneumonitis is largely associated with general anaesthesia, with passive regurgitation of gastric contents being the main risk factor. In contrast, vomiting is an active process and is not necessary for aspiration to occur. As regional anaesthesia is now used more frequently for caesarean section, the incidence of aspiration pneumonitis is very rare. However, prophylaxis against acid aspiration (also known as gastric aspiration) and aspiration pneumonitis is still important as there will be situations that require general anaesthesia for caesarean section (for example, emergency caesarean section or where regional anaesthesia has failed or is contraindicated). Restricting food and fluids in labour is another intervention aimed at reducing the risk of aspiration pneumonitis; however, evidence on the effectiveness of this is covered in another Cochrane review (Singata 2002).
Description of the intervention
Several different types of drugs have been used to reduce the risks and effects of acid aspiration. These include antacids, H2 receptor antagonists, proton pump inhibitors and prokinetic drugs, either alone or in combination. This wide range may reflect the absence of an ideal regimen (Grieff 1994; Sweeney 1986; Tordoff 1990).
How the intervention might work
Antacids
Antacids (such as sodium citrate) are alkaline agents used to directly neutralise gastric acid. Antacids are often given just prior to induction of general anaesthesia, and while they increase intragastric pH, they also increase intragastric volume, and may cause more harm than benefit (Bond 1979). It is possible that aspiration of antacid solutions may also cause lung damage. Non‐particulate antacids (such as sodium citrate) are thought to be less likely to increase the risk of severe pneumonitis compared to particulate antacids (magnesium trisilicate) should aspiration occur (Gibbs 1979).
H2 receptor antagonists/inhibitors
H2 receptor antagonists (such as ranitidine) act by inhibiting the secretion of acid into the stomach, which reduces both the volume and acidity of the stomach contents (Thwaites 1999).
Proton pump antagonists
Proton pump antagonists (such as omeprazole) act by blocking the production of stomach acid by interfering with the pump which secretes protons (acid) into the stomach (Browne 1993).
Prokinetic drugs
Prokinetic drugs increase gastric motility and therefore accelerate gastric emptying and reduce gastric volume. The most commonly used prokinetic drug is metoclopramide which may also act as an anti‐emetic (Cohen 1984).
Nasogastric tube aspiration
Nasogastric aspiration or suction is the process of physically draining the stomach's contents using a nasogastric tube, to remove gastric secretions and swallowed air. It can be used in preparation for surgery and to extract gastric liquid for research purposes.
Assessing effectiveness
As aspiration pneumonitis is a rare event, it is difficult to conduct a randomised controlled trial large enough to demonstrate the effectiveness of an intervention to reduce risk. For this reason, clinical trials on prophylactic drugs have focused on the surrogate measures of gastric pH and volume. This is a disadvantage because there is no guarantee that a change in the surrogate measure will reflect a difference in outcome of interest (i.e. aspiration pneumonitis). The pathophysiology of aspiration pneumonitis relates to both the volume and the acidity of the fluid aspirated. An intragastric pH lower than 2.5 and a volume greater than 0.4 mL/kg are the traditionally described criteria for increased risk of severe lung injury and mortality. These criteria were originally described by Mendelson (Mendelson 1946), and were derived from animal experiments (Roberts 1974). However, the evidence that these surrogate measures increase the risk of aspiration pneumonitis in pregnant women undergoing caesarean section under general anaesthesia is absent. Failure to adequately raise intragastric pH and lower intragastric volume may not be due to the specific drug, but due to other factors, such as the time interval between administration and surgery, or to interaction with other drugs. Opioids in particular slow down gastric emptying and can reduce the effectiveness of prophylactic drugs used. Measurements are usually taken just after induction of anaesthesia and just before extubation (removal of the endotracheal tube) to reflect the intragastric conditions at the time of greatest aspiration risk (Ewart 1990b; Gin 1990; Moore 1989; Tripathi 1995).
Why it is important to do this review
The administration of an antacid and H2 receptor antagonist, and sometimes a prokinetic and antiemetic drug (such as metoclopramide, a phenothiazine‐like drug aimed at accelerating gastric emptying and reducing nausea, vomiting and aspiration pneumonitis), has been standard practice prior to caesarean section in maternity units in the United Kingdom (Thomas 2001). However, clinical practice has varied across the world. Some countries including the UK also routinely administer drugs (such as ranitidine) to all women in labour with the aim of reducing the risk of aspiration pneumonitis should anaesthesia be required for caesarean section, even though the evidence for such practice is poor (Gyte 2006). Any pharmacological intervention may produce side effects or serious complications, including anaphylaxis. Pharmacological antiemetics are associated with a number of side effects such as excessive sedation, restlessness, dystonic reactions (abnormal muscle tone) and extra pyramidal symptoms (Numazaki 2000).
There is a need to review the evidence of effectiveness of pharmacological drugs to reduce aspiration pneumonitis for women who have caesarean sections. The evidence of effectiveness of pharmacological and non‐pharmacological interventions to prevent nausea and vomiting for women who have caesarean sections will be considered in a separate review on 'Interventions for reducing nausea and vomiting at caesarean section'.
Objectives
To determine whether interventions given prior to caesarean section reduce the risk of aspiration pneumonitis in women with an uncomplicated pregnancy (i.e. women who had no medical complications other than the obstetric reason for caesarean section).
Methods
Criteria for considering studies for this review
Types of studies
All published or unpublished randomised controlled trials (RCTs), including cluster‐randomised trials. We excluded quasi‐RCTs.
Types of participants
Pregnant women undergoing elective or emergency caesarean section under general or regional anaesthesia.
Types of interventions
Any pharmacological or non‐pharmacological intervention given specifically to prevent aspiration pneumonitis at caesarean section.
Particulate or non‐particulate antacids.
H2 antagonists (e.g. ranitidine).
Proton pump antagonists (e.g. omeprazole).
Prokinetic drugs (e.g. metoclopramide).
Non‐pharmacological interventions.
Comparisons were any of the above interventions versus any other, placebo or no intervention.
Types of outcome measures
Primary outcomes
Incidence of mortality due to aspiration pneumonitis.
Incidence of morbidity due to aspiration pneumonitis.
Low intragastric pH below 2.5, measured after induction of anaesthesia.
Increase of intragastric volume to more than 0.4 mL/kg, measured after induction of anaesthesia.
Secondary outcomes
Women's satisfaction.
Incidence of nausea during caesarean section or the postoperative period.
Incidence of vomiting during caesarean section or the postoperative period.
Side effects ‐ including sedation, restlessness, dystonic reactions and extrapyramidal symptoms.
Adverse event ‐ episodes of hypotension, blood loss, atonic uterus.
Neonatal morbidity ‐ cord blood pH, Apgar scores, neonatal assessment scores and admission to neonatal intensive care unit.
Breastfeeding rates ‐ initiation of breastfeeding and duration of breastfeeding.
Raised intragastric pH above 2.5, measured prior to extubation at the end of anaesthesia.
Reducing of intragastric volume to less than 0.4 mL/kg, measured prior to extubation at the end of anaesthesia.
In order to try to avoid outcome reporting bias in the review, we included studies whether or not they have assessed these specific outcomes listed here. Where included studies have not reported any of our pre‐specified outcomes, we have included them in the review and information can be found in the Characteristics of included studies.
Many trials measured 'at risk of aspiration' as the number of individuals who had both low gastric pH (less than 2.5) and increased gastric volume (greater than 0.4 mL/kg). Although this combined measure was not one of our pre‐specified outcomes, we have included it in this review.
We looked for individual components of 'side effects' and 'adverse events'. To date there are limited data for these outcomes. If more data become available in the future, we will analyse these as composite outcomes.
Search methods for identification of studies
Electronic searches
We searched the Cochrane Pregnancy and Childbirth Group’s Trials Register by contacting the Trials Search Co‐ordinator (30 April 2013).
The Cochrane Pregnancy and Childbirth Group’s Trials Register is maintained by the Trials Search Co‐ordinator and contains trials identified from:
monthly searches of the Cochrane Central Register of Controlled Trials (CENTRAL);
weekly searches of MEDLINE;
weekly searches of Embase;
handsearches of 30 journals and the proceedings of major conferences;
weekly current awareness alerts for a further 44 journals plus monthly BioMed Central email alerts.
Details of the search strategies for CENTRAL, MEDLINE and Embase, the list of handsearched journals and conference proceedings, and the list of journals reviewed via the current awareness service can be found in the ‘Specialized Register’ section within the editorial information about the Cochrane Pregnancy and Childbirth Group.
We did not apply any language restrictions.
Data collection and analysis
For the methods used when assessing the trials identified in the previous version of this review, seeParanjothy 2010.
For this update we used the following methods when assessing the reports identified by the updated search.
Selection of studies
Two review authors independently assessed for inclusion all the potential studies we identified as a result of the search strategy. We resolved any disagreement through discussion or, if required, we consulted a third person.
Data extraction and management
We designed a form to extract data. For eligible studies, at least two review authors extracted the data using the agreed form. We resolved discrepancies through discussion or, if required, we consulted a third person. We entered data into Review Manager software (RevMan 2012) and checked for accuracy.
When information regarding any of the above was unclear, we contacted authors of the original reports to provide further details.
Assessment of risk of bias in included studies
Two review authors independently assessed risk of bias for each study using the criteria outlined in the Cochrane Handbook for Systematic Reviews of Interventions (Higgins 2011). We resolved any disagreement by discussion.
(1) Random sequence generation (checking for possible selection bias)
We described for each included study the method used to generate the allocation sequence in sufficient detail to allow an assessment of whether it should produce comparable groups.
We assessed the method as:
low risk of bias (any truly random process, e.g. random number table; computer random number generator);
high risk of bias (any non‐random process, e.g. odd or even date of birth; hospital or clinic record number);
unclear risk of bias.
(2) Allocation concealment (checking for possible selection bias)
We described for each included study the method used to conceal allocation to interventions prior to assignment and assessed whether intervention allocation could have been foreseen in advance of, or during recruitment, or changed after assignment.
We assessed the methods as:
low risk of bias (e.g. telephone or central randomisation; consecutively numbered sealed opaque envelopes);
high risk of bias (open random allocation; unsealed or non‐opaque envelopes, alternation; date of birth);
unclear risk of bias.
(3.1) Blinding of participants and personnel (checking for possible performance bias)
We described for each included study the methods used, if any, to blind study participants and personnel from knowledge of which intervention a participant received. We considered studies to be at low risk of bias if they were blinded, or if we judged that the lack of blinding would be unlikely to affect results. We assessed blinding separately for different outcomes or classes of outcomes.
We assessed the methods as:
low, high or unclear risk of bias for participants;
low, high or unclear risk of bias for personnel.
(3.2) Blinding of outcome assessment (checking for possible detection bias)
We described for each included study the methods used, if any, to blind outcome assessors from knowledge of which intervention a participant received. We assessed blinding separately for different outcomes or classes of outcomes.
We assessed methods used to blind outcome assessment as:
low, high or unclear risk of bias.
(4) Incomplete outcome data (checking for possible attrition bias due to the amount, nature and handling of incomplete outcome data)
We described for each included study, and for each outcome or class of outcomes, the completeness of data including attrition and exclusions from the analysis. We have stated whether attrition and exclusions were reported and the numbers included in the analysis at each stage (compared with the total randomised participants), reasons for attrition or exclusion where reported, and whether missing data were balanced across groups or were related to outcomes. Where sufficient information was reported, or could be supplied by the trial authors, we planned to re‐include missing data in the analyses undertaken.
We assessed methods as:
low risk of bias (e.g. no missing outcome data; missing outcome data balanced across groups);
high risk of bias (e.g. numbers or reasons for missing data imbalanced across groups; ‘as treated’ analysis done with substantial departure of intervention received from that assigned at randomisation);
unclear risk of bias.
(5) Selective reporting (checking for reporting bias)
We described for each included study how we investigated the possibility of selective outcome reporting bias and what we found.
We assessed the methods as:
low risk of bias (where it is clear that all of the study’s pre‐specified outcomes and all expected outcomes of interest to the review have been reported);
high risk of bias (where not all the study’s pre‐specified outcomes have been reported; one or more reported primary outcomes were not pre‐specified; outcomes of interest are reported incompletely and so cannot be used; study fails to include results of a key outcome that would have been expected to have been reported);
unclear risk of bias.
(6) Other bias (checking for bias due to problems not covered by (1) to (5) above)
We described for each included study any important concerns we had about other possible sources of bias.
We assessed whether each study was free of other problems that could put it at risk of bias:
low risk of other bias;
high risk of other bias;
unclear whether there is risk of other bias.
(7) Overall risk of bias
We have made explicit judgements about whether studies were at high risk of bias, according to the criteria given in the Cochrane Handbook (Higgins 2011). With reference to (1) to (6) above, we assessed the likely magnitude and direction of the bias and whether we consider it likely to impact on the findings. We planned to explore the impact of the level of bias through undertaking sensitivity analyses ‐ seeSensitivity analysis.
Measures of treatment effect
Dichotomous data
For dichotomous data, we presented results as summary risk ratio with 95% confidence intervals.
Continuous data
For continuous data, we used the mean difference if outcomes were measured in the same way between trials. We used the standardised mean difference to combine trials that measured the same outcome, but used different methods.
Unit of analysis issues
Cluster‐randomised trials
We did not identify any cluster‐randomised trials for inclusion. In future updates, we will include cluster‐randomised trials in the analyses along with individually‐randomised trials. We will adjust their sample sizes using the methods described in the Cochrane Handbook [Section 16.3.4] using an estimate of the intracluster correlation co‐efficient (ICC) derived from the trial (if possible), from a similar trial or from a study of a similar population. If we use ICCs from other sources, we will report this and conduct sensitivity analyses to investigate the effect of variation in the ICC. If we identify both cluster‐randomised trials and individually‐randomised trials, we plan to synthesise the relevant information. We will consider it reasonable to combine the results from both if there is little heterogeneity between the study designs and the interaction between the effect of intervention and the choice of randomisation unit is considered to be unlikely.
We will also acknowledge heterogeneity in the randomisation unit and perform a sensitivity analysis to investigate the effects of the randomisation unit.
Cross‐over trials
Cross‐over trials are not a valid study design for inclusion in this review.
Dealing with missing data
For included studies, levels of attrition were noted. We planned to explore the impact of including studies with high levels of missing data in the overall assessment of treatment effect by using sensitivity analysis. However, we felt there were insufficient data within any one comparison to undertake sensitivity analyses by levels of missing data.
For all outcomes, analyses were carried out, as far as possible, on an intention‐to‐treat basis, i.e. we analysed data on all participants with available data in the group to which they are allocated, regardless of whether or not they received the allocated intervention. If in the original reports participants were not analysed in the group to which they were randomised, and there was sufficient information in the trial report, we attempted to restore them to the correct group. We attempted to include all participants randomised to each group in the analyses. The denominator for each outcome in each trial was the number randomised minus any participants whose outcomes were known to be missing.
Assessment of heterogeneity
We assessed statistical heterogeneity in each meta‐analysis using the Tau², I² and Chi² statistics. We regarded heterogeneity as substantial if a Tau² was greater than zero and either an I² was greater than 30% or there was a low P value (less than 0.10) in the Chi² test for heterogeneity. Where we found heterogeneity and random‐effects was used, we have reported the average risk ratio, or average mean difference or average standardised mean difference.
Assessment of reporting biases
Had there been 10 or more studies in a meta‐analysis, we planned to investigate reporting biases (such as publication bias) using funnel plots. We would have assessed funnel plot asymmetry visually. If asymmetry had been suggested by a visual assessment, we would have performed exploratory analyses to investigate it.
Data synthesis
We carried out statistical analysis using the Review Manager software (RevMan 2012). We used fixed‐effect meta‐analysis for combining data where it was reasonable to assume that studies were estimating the same underlying treatment effect: i.e. where trials were examining the same intervention, and the trials’ populations and methods were judged to be sufficiently similar. If there was clinical heterogeneity sufficient to expect that the underlying treatment effects differed between trials, or if substantial statistical heterogeneity was detected, we used random‐effects analysis to produce an overall summary, if this was considered clinically meaningful. If an average treatment effect across trials was not clinically meaningful, we did not combine heterogeneous trials. Where we used random‐effects analyses, the results have been presented as the average treatment effect and its 95% confidence interval, the 95% prediction interval for the underlying treatment effect, and the estimates of Tau² and I².
We combined results of trials using drugs that have the same mechanism of action if the treatment regimens were assessed to be compatible. For example, studies comparing ranitidine versus placebo and famotidine versus placebo were combined to assess the effectiveness of the H2 antagonist class of drugs. We also combined routes of administration, for example, studies comparing intravenous ranitidine and oral ranitidine were combined.
Subgroup analysis and investigation of heterogeneity
If we identified substantial heterogeneity, we planned to investigate it using subgroup analyses and sensitivity analyses and to consider whether an overall summary was meaningful, and if it was, use random‐effects analysis to produce it. However, there were insufficient data to carry out subgroup analysis.
In future updates, if data allow, we will carry out the following subgroup analyses.
Elective versus emergency caesarean section.
Primary outcomes will be used in subgroup analysis.
We will assess subgroup differences by interaction tests available within RevMan (RevMan 2012). We will report the results of subgroup analyses quoting the Chi² statistic and P value, and the interaction test I² value.
Sensitivity analysis
We had planned to carry out sensitivity analyses to explore the effect of trial quality for important outcomes in the review. However, as the majority of studies were of poor quality and there were little data for each comparison, this was not feasible. We will, however, consider doing this in future updates, as more data are accumulated from published randomised controlled trials.
Results
Description of studies
Results of the search
One‐hundred and sixty‐four publications were identified in the search which covered interventions for reducing nausea, vomiting and aspiration pneumonitis at caesarean section. Of these, 33 studies were identified that related to interventions for reducing aspiration pneumonitis and 66 were assigned to the review on nausea and vomiting (Griffiths 2012). Other studies were excluded for a variety of reasons see Excluded studies below.
Included studies
Of the 32 studies that were identified relating to the reduction of aspiration pneumonitis, 22 provided data and involved 2658 women (Dewan 1985; Elhakim 2005; Ewart 1990a; Frank 1984; Hong 2004; Husemeyer 1980; Iqbal 2000; Jasson 1989; Lin 1996; Ormezzano 1990; Orr 1993; Ostheimer 1982; Ozkan 2000; Pickering 1980; Rocke 1994; Rout 1993; Tripathi 1995; Tryba 1983; Wig 1987; Yau 1992; Zoroglu 1999; Zue 1999). Ten of the included studies met the inclusion criteria but could provide no data for the meta‐analyses (Bifarini 1990; Bifarini 1992; Bylsma‐Howell 1983; Fogarty 1992; Hodgkinson 1983; O'Sullivan 1985; Osman 1995; Roper 1981; Stuart 1996; von Braun 1994), see Characteristics of included studies for the reasons.
Two studies are awaiting classification: we have requested additional information from the authors for one study (Karamanlioglu 1995); and we are seeking the full paper for the second paper (Sarat 2007).
Excluded studies
The excluded studies are listed in the reference section under excluded studies and the table Characteristics of excluded studies states the reasons for exclusion from this review. Most of the studies that were excluded assessed interventions for reducing nausea and vomiting at caesarean section rather than reducing the risk of aspiration pneumonitis, though the search strategy included both these circumstances in line with the original protocol. The studies looking at nausea and vomiting are included in the review of interventions for reducing nausea and vomiting at caesarean section (Griffiths 2012).
Risk of bias in included studies
Overall, the quality of studies was difficult to assess. We did not assess any trial protocols so we were unable to assess possible selective reporting bias. In addition, most trials reported only a few outcomes; therefore, it is unclear whether or not there is selective reporting bias. Only one study had both adequate sequence generation and concealment allocation (Orr 1993), and the remainder were unclear with one study having inadequate allocation concealment (Dewan 1985). The assessment of incomplete data showed half the studies having low risk of bias here and in the other half it was unclear. None of the studies met the criteria of low risk of bias on all the assessment criteria (Figure 1).
1.
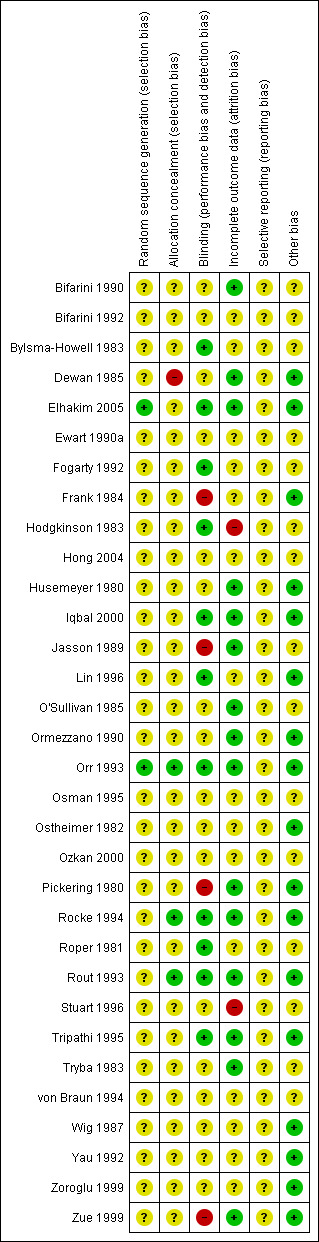
Methodological quality summary: review authors' judgements about each methodological quality item for each included study.
Allocation
Of the studies that provided data, the random sequence generation was adequate in only two studies (Elhakim 2005; Orr 1993), with the remainder of the studies being unclear. Concealment allocation was adequate in only three studies (Orr 1993; Rocke 1994; Rout 1993); in one study it was inadequate (Dewan 1985), and in the rest it was unclear. Thus, there was only one study (Orr 1993) where both generation and concealment were adequate.
Blinding
Of the studies that provided data, blinding was assessed as adequate in 11 studies (Bylsma‐Howell 1983; Elhakim 2005; Fogarty 1992; Hodgkinson 1983; Iqbal 2000; Lin 1996; Orr 1993; Rocke 1994; Roper 1981; Rout 1993; Tripathi 1995), inadequate in four (Frank 1984; Jasson 1989; Pickering 1980; Zue 1999) and unclear in the rest of the studies. This is disappointing for studies assessing drug administration.
Incomplete outcome data
Of the studies that provided data, 15 studies were assessed as having adequate reporting of outcome data (Bifarini 1990; Dewan 1985; Elhakim 2005; Husemeyer 1980; Iqbal 2000; Jasson 1989; O'Sullivan 1985; Ormezzano 1990; Orr 1993; Pickering 1980; Rocke 1994; Rout 1993; Tripathi 1995; Tryba 1983; Zue 1999). Two studies (Hodgkinson 1983; Stuart 1996) were assessed as inadequate and the remainder were assessed as unclear.
Selective reporting
We did not assess the trial protocols so it is unclear if there is any selective reporting bias. Although we did not specifically identify any selective reporting bias, we were unable to exclude the possibility.
Other potential sources of bias
It was unclear whether or not there were other potential sources of bias in 15 studies, primarily due to lack information available to assess this (Bifarini 1990; Bifarini 1992; Bylsma‐Howell 1983; Ewart 1990a; Fogarty 1992; Hodgkinson 1983; Hong 2004; Jasson 1989; O'Sullivan 1985; Osman 1995; Ozkan 2000; Roper 1981; Stuart 1996; Tryba 1983; von Braun 1994).
Effects of interventions
This review includes 22 studies that provide data for 16 meta‐analyses, involving 2658 women.
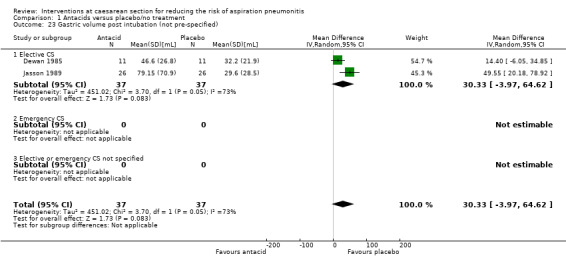
(1) Antacids versus placebo/no treatment (three studies, 168 women)
Three studies compared antacids with placebo (Dewan 1985; Ormezzano 1990; Wig 1987).
The studies were of doubtful quality with sequence generation being unclear in all three studies, and allocation concealment being either unclear in two (Ormezzano 1990; Wig 1987) or inadequate in one (Dewan 1985). Data collection appeared complete in two studies (Dewan 1985; Ormezzano 1990) and unclear in one study (Wig 1987). There appeared to be no other sources of bias apparent in any of the studies.
Primary outcomes
Antacid, compared with placebo, was associated with a statistically significant reduction in:
intragastric pH less than 2.5 at intubation (risk ratio (RR) 0.17, 95% confidence interval (CI) 0.09 to 0.32, two studies, 108 women, Analysis 1.3).
1.3. Analysis.
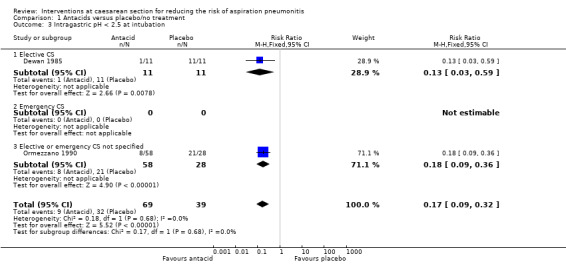
Comparison 1 Antacids versus placebo/no treatment, Outcome 3 Intragastric pH < 2.5 at intubation.
Other primary outcomes were not assessed.
Secondary outcomes
Antacid, compared with placebo, was also associated with a statistically significant reduction in:
intragastric pH less than 2.5 at extubation (RR 0.21, 95% CI 0.09 to 0.48, one study, 86 women, Analysis 1.21).
1.21. Analysis.
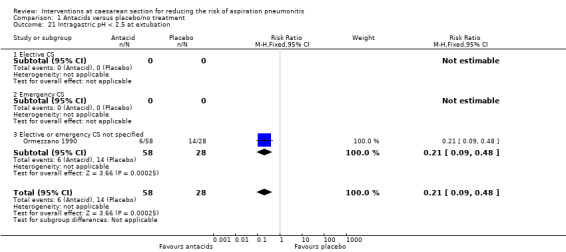
Comparison 1 Antacids versus placebo/no treatment, Outcome 21 Intragastric pH < 2.5 at extubation.
Other secondary outcomes were not assessed.
Outcomes not pre‐specified
There was no statistically significant difference identified for:
'risk of aspiration' (RR 0.07, 95% CI 0.00 to 1.04, one study, 22 women, Analysis 1.25).
1.25. Analysis.
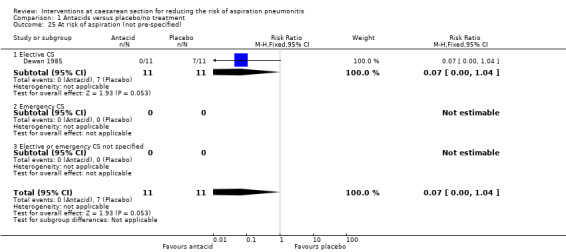
Comparison 1 Antacids versus placebo/no treatment, Outcome 25 At risk of aspiration (not pre‐specified).
For other non‐prespecified outcomes, see Analyses 1.23 to 1.27.
(2) H2 antagonists versus placebo/no treatment (six studies, 385 women)
Six studies compared H2 antagonists with placebo/no treatment (Iqbal 2000; Lin 1996; Ozkan 2000; Tryba 1983; Zoroglu 1999; Zue 1999).
The studies were of doubtful quality with unclear sequence generation and concealment allocation in the six studies. Blinding was adequate in two studies (Iqbal 2000; Lin 1996), inadequate in one study (Zue 1999) and unclear in the remainder. Data collection appeared complete in three studies (Iqbal 2000; Tryba 1983; Zue 1999) and unclear in the remainder of studies. The studies seemed to be free of other sources of bias, although this was difficult to assess due to lack of information in some.
Primary outcomes
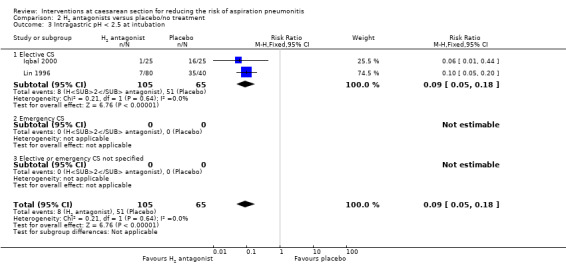
In women undergoing elective caesarean section, H2 antagonists compared with placebo showed a statistically significant reduction in:
intragastric pH less than 2.5 at intubation (RR 0.09, 95% CI 0.05 to 0.18, two studies, 170 women, Analysis 2.3);
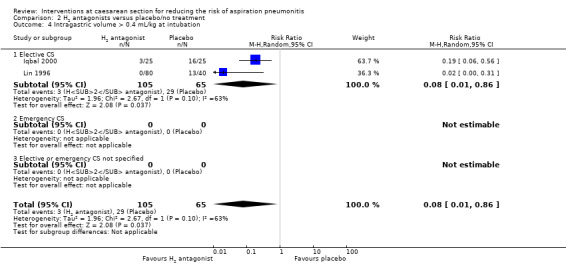
intragastric volume greater than 0.4 mg/kg at intubation (average RR 0.08, 95% CI 0.01 to 0.86, two studies, 170 women, random‐effects [Tau² = 1.96, P = 0.10, I² = 63%], Analysis 2.4).
2.3. Analysis.
Comparison 2 H2 antagonists versus placebo/no treatment, Outcome 3 Intragastric pH < 2.5 at intubation.
2.4. Analysis.
Comparison 2 H2 antagonists versus placebo/no treatment, Outcome 4 Intragastric volume > 0.4 mL/kg at intubation.
Other primary outcomes were not assessed.
Secondary outcomes
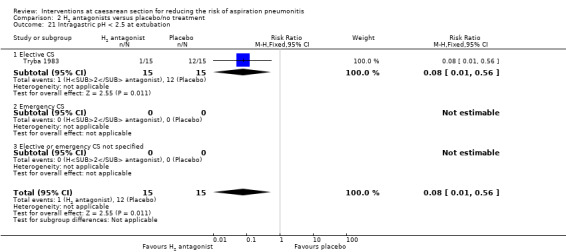
One study reported on intragastric pH at extubation and found a statistically significant reduction in:
risk of pH less than 2.5 (RR 0.08, 95% CI 0.01 to 0.56, one study, 30 women, Analysis 2.21).
2.21. Analysis.
Comparison 2 H2 antagonists versus placebo/no treatment, Outcome 21 Intragastric pH < 2.5 at extubation.
Other secondary outcomes were not assessed.
Outcomes not pre‐specified
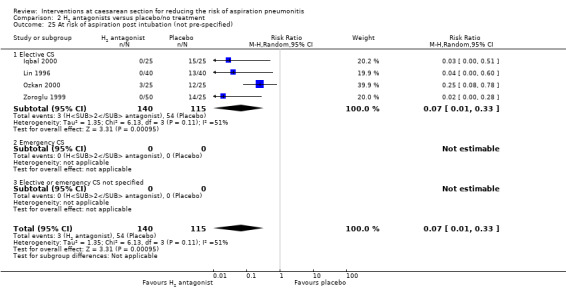
H2 antagonists were associated with a statistically significant reduction in:
'risk of aspiration' at intubation (average RR 0.07, 95% CI 0.01 to 0.33, four studies, 255 women, random‐effects [Tau² = 1.35, P = 0.11, I² = 51%], Analysis 2.25);
'risk of aspiration' at extubation (RR 0.17, 95% CI 0.01 to 4.03, two studies, 125 women [although only one study of 75 women was estimable], Analysis 2.26).
2.25. Analysis.
Comparison 2 H2 antagonists versus placebo/no treatment, Outcome 25 At risk of aspiration post intubation (not pre‐specified).
2.26. Analysis.
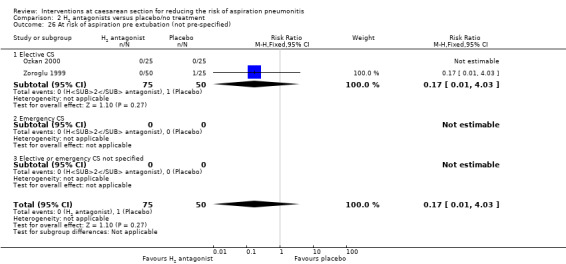
Comparison 2 H2 antagonists versus placebo/no treatment, Outcome 26 At risk of aspiration pre extubation (not pre‐specified).
For other non‐prespecified outcomes see Analyses 2.23 to 2.28.
(3) Proton pump antagonists versus placebo/no treatment (two studies, 130 women)
Two studies (Lin 1996; Ozkan 2000) compared proton pump antagonists with placebo or no treatment. Both of these studies were of doubtful quality as allocation sequence generation, allocation concealment and incomplete data assessment were unclear.
Primary outcomes
Proton pump antagonists, when compared with placebo, were associated with a statistically significant reduction in intragastric pH less than 2.5 at intubation (RR 0.26; 95% CI 0.14, 0.46, one study, 80 women, Analysis 3.3), but no difference in intragastric volume greater than 0.4 mL/kg (RR 0.46, 95% CI 0.19, 1.09, one study, 80 women, Analysis 3.4). Other primary outcomes were not assessed.
3.3. Analysis.
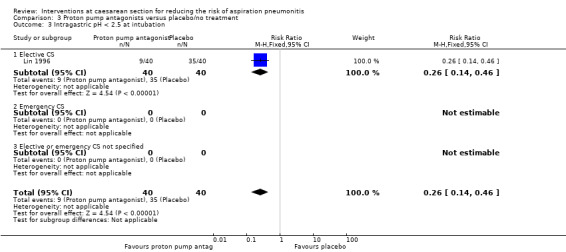
Comparison 3 Proton pump antagonists versus placebo/no treatment, Outcome 3 Intragastric pH < 2.5 at intubation.
3.4. Analysis.
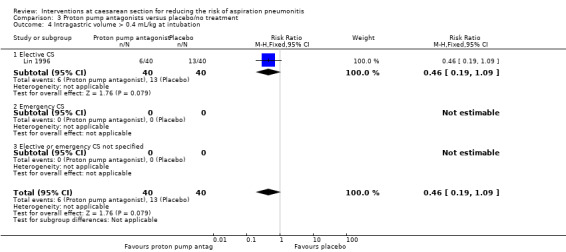
Comparison 3 Proton pump antagonists versus placebo/no treatment, Outcome 4 Intragastric volume > 0.4 mL/kg at intubation.
Secondary outcomes
Neither of these studies reported on our pre‐specified secondary outcomes.
Outcomes not pre‐specified
Proton pump antagonists were associated with a significant reduction in:
'risk of aspiration' compared with placebo (average RR 0.14, 95% CI 0.03 to 0.74, two studies, 130 women, random‐effects [Tau² = 0.60, P = 0.22, I² = 34%], Analysis 3.24).
3.24. Analysis.
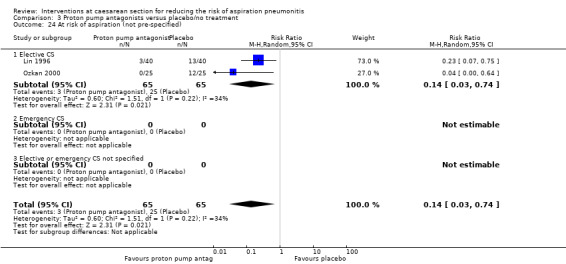
Comparison 3 Proton pump antagonists versus placebo/no treatment, Outcome 24 At risk of aspiration (not pre‐specified).
For other non‐prespecified outcomes, see Analyses 3.23 to 3.27.
(4) Prokinetic drugs versus placebo/no treatment (one study, 50 women)
One study compared a prokinetic drug (metoclopramide) with no treatment (Ozkan 2000). The quality of this study was doubtful as allocation sequence generation, allocation concealment, blinding and incomplete data assessment were unclear.
Primary outcomes
This study did not measure any of the primary outcomes that were pre‐specified in this review.
Secondary outcomes
This study did not measure any of the secondary outcomes that were pre‐specified in this review.
Outcomes not pre‐specified
When prokinetic drugs were compared with no treatment, there was no statistically significant difference identified in:
'risk of aspiration' (RR 0.67, 95% CI 0.33 to 1.35, one study, 50 women, Analysis 4.23). Though it is possible the study was too small to identify a difference.
4.23. Analysis.
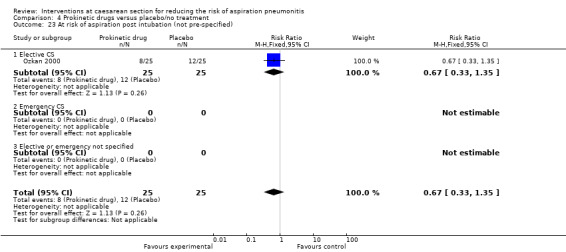
Comparison 4 Prokinetic drugs versus placebo/no treatment, Outcome 23 At risk of aspiration post intubation (not pre‐specified).
(5) Non‐pharmacological interventions versus placebo/no treatment (one study, 40 women)
One study compared the use of intravenous 5% dextrose solution to normal saline solution prior to induction of anaesthesia in 40 women undergoing elective caesarean section in South Korea (Hong 2004). This study was of doubtful quality as there was no information given to assess adequacy of sequence generation, allocation concealment, blinding, incomplete outcome data assessment. It was not clear if the study was free of any other bias, due to the lack of detail available.
Primary outcomes
This study did not report on any of the primary outcomes pre‐specified in this review.
Secondary outcomes
This study did not report on any of the secondary outcomes pre‐specified in this review.
Outcomes not pre‐specified
There was no statistically significant difference identified in:
'risk of aspiration' (not clearly defined) (RR 0.50, 95% CI 0.18 to 1.40, one study, 40 women, Analysis 5.23).
5.23. Analysis.
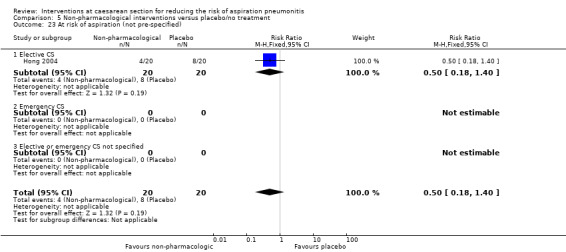
Comparison 5 Non‐pharmacological interventions versus placebo/no treatment, Outcome 23 At risk of aspiration (not pre‐specified).
(6) Antacids + H2 antagonists versus placebo/no treatment (one study, 89 women)
One study compared the use of antacids and H2 antagonists (in combination) with no treatment (Ormezzano 1990). This study was of doubtful quality as sequence generation, allocation concealment and selective reporting bias were unclear. Neither the participants nor the outcome assessors were blinded. However, data completeness were adequately assessed and this study was judged to be free of any other type of bias.
Primary outcomes
The combination of an 'antacid plus an H2 receptor antagonist' compared with placebo showed:
a statistically significant reduction in risk of gastric pH less than 2.5 at intubation (RR 0.02, 95% CI 0.00 to 0.15, one study, 89 women, Analysis 6.3).
6.3. Analysis.
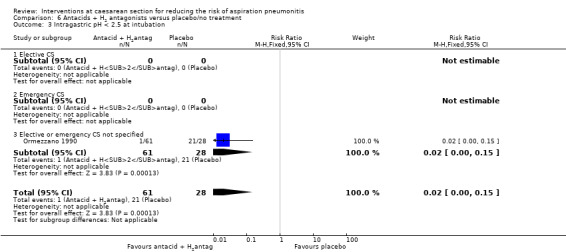
Comparison 6 Antacids + H2 antagonists versus placebo/no treatment, Outcome 3 Intragastric pH < 2.5 at intubation.
Other primary outcomes were not assessed.
Secondary outcomes
The combination also showed a statistically significant reduction in:
risk of gastric pH less than 2.5 at extubation (RR 0.03, 95% CI 0.00 to 0.24, one study, 89 women, Analysis 6.21).
6.21. Analysis.
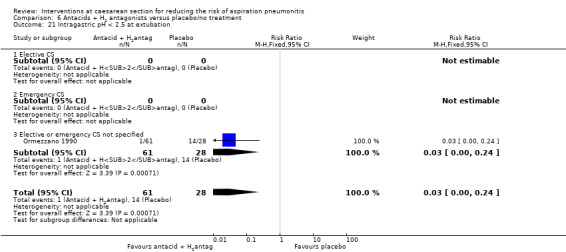
Comparison 6 Antacids + H2 antagonists versus placebo/no treatment, Outcome 21 Intragastric pH < 2.5 at extubation.
Other secondary outcomes were not assessed.
Outcomes not pre‐specified
For non‐prespecified outcomes, see Analyses 6.23 to 6.24.
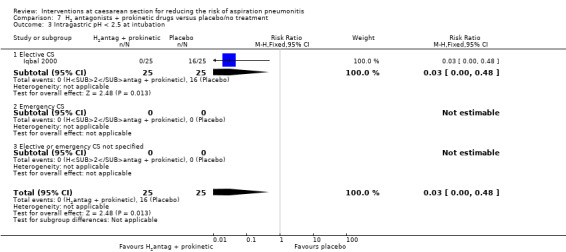
(7) H2 antagonists + prokinetic drugs versus placebo/no treatment (one study, 50 women)
One study compared the use of H2 antagonists plus prokinetic drugs (in combination) with no treatment (Iqbal 2000). This study was of doubtful quality as sequence generation and allocation concealment were unclear. Participants and clinicians were reported to be blinded.
Primary outcomes
The combination of 'H2 antagonists plus prokinetic drugs' were associated with:
a statistically significant reduction gastric pH less than 2.5 after induction (RR 0.03, 95% CI 0.00, 0.48, one study, 50 women, Analysis 7.3).
7.3. Analysis.
Comparison 7 H2 antagonists + prokinetic drugs versus placebo/no treatment, Outcome 3 Intragastric pH < 2.5 at intubation.
Secondary outcomes
This study did not report on any of the secondary outcomes pre‐specified in this review.
Outcomes not pre‐specified
The was a statistically significant reduction in women:
at 'risk of aspiration' (RR 0.03, 95% CI 0.00, 0.51, one study, 50 women, Analysis 7.23).
7.23. Analysis.
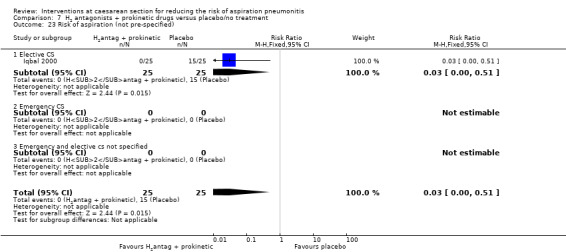
Comparison 7 H2 antagonists + prokinetic drugs versus placebo/no treatment, Outcome 23 Risk of aspiration (not pre‐specified).
For non‐prespecified outcomes, see Analyses 7.24 to 7.26.
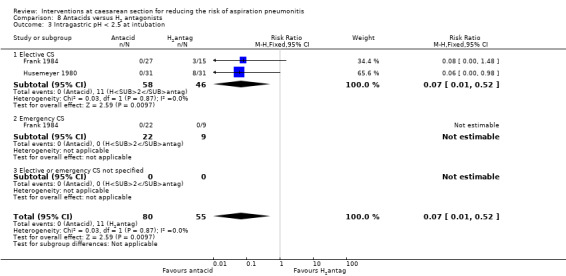
(8) Antacids versus H2 antagonists (four studies, 175 women)
Four studies (Frank 1984; Husemeyer 1980; Ostheimer 1982; Pickering 1980) compared antacids versus H2 antagonists.
All of these studies were of doubtful quality as allocation sequence generation and allocation concealment were unclear and blinding was not done. Two studies (Husemeyer 1980; Pickering 1980) were judged to have adequate incomplete data assessment; while there was not enough information to assess this in the other two studies (Frank 1984; Ostheimer 1982). All four studies were considered to be free of other bias.
Primary outcomes
Compared with H2 receptor antagonists, antacid use was associated with:
a statistically significant reduction in risk of pH less than 2.5 at intubation (RR 0.07, 95% CI 0.01 to 0.52, two studies, 135 women, Analysis 8.3).
8.3. Analysis.
Comparison 8 Antacids versus H2 antagonists, Outcome 3 Intragastric pH < 2.5 at intubation.
One study (Frank 1984) also examined the effect of this comparison in women undergoing emergency caesarean section but did not observe any events (pH less than 2.5 at intubation) in either group. Other primary outcomes were not assessed.
Secondary outcomes
None of the pre‐specified secondary outcomes in this review were reported in these studies.
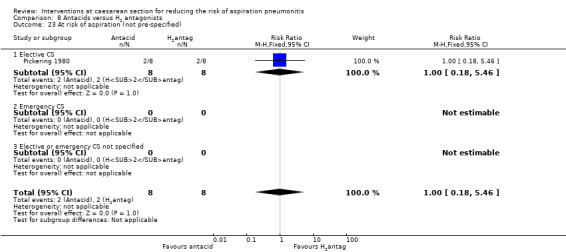
Outcomes not pre‐specified
There was no significant difference identified in:
'risk of aspiration' between the two groups (RR 1.00, 95% CI 0.18, 5.46, one study, 16 women, Analysis 8.23). At risk of aspiration was defined as pH less than 2.5 and gastric volume of at least 25 mL.
8.23. Analysis.
Comparison 8 Antacids versus H2 antagonists, Outcome 23 At risk of aspiration (not pre‐specified).
For other non‐prespecified outcomes, see Analyses 8.24 to 8.26. In contrast to the above finding, these data showed a benefit for H2 receptor antagonists, for the outcome of gastric volume measured as a continuous variable, as expected due to the nature of the treatments. However, one small study (24 women) evaluated gastric pH as a continuous variable and showed a benefit for H2 receptor antagonists (Ostheimer 1982).
(9) Antacids versus prokinetic drugs (no studies)
There were no studies that assessed this comparison.
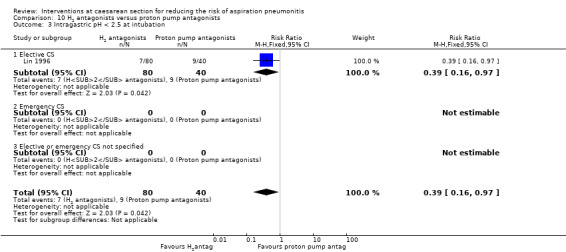
(10) H2 antagonists versus proton pump antagonists (four studies, 332 women)
Four studies (Ewart 1990a; Lin 1996; Tripathi 1995; Yau 1992) compared H2 antagonists with proton pump antagonists.
All of these studies were of doubtful quality as allocation sequence generation and allocation concealment were unclear. Blinding was done only in two studies (Lin 1996; Tripathi 1995). Only one study (Tripathi 1995) was judged to have adequate incomplete data assessment. All four studies were considered to be free of other bias, except for Ewart 1990a where there was not enough information to assess this.
Primary outcomes
Compared with proton pump inhibitors, H2 receptor antagonists showed a statistically significant reduction in:
risk of pH less than 2.5 for women undergoing elective caesarean (RR 0.39, 95% CI 0.16 to 0.97, one study, 120 women, Analysis 10.3).
10.3. Analysis.
Comparison 10 H2 antagonists versus proton pump antagonists, Outcome 3 Intragastric pH < 2.5 at intubation.
Secondary outcomes
None of these studies reported on the secondary outcomes that were pre‐specified in this review.
Outcomes not pre‐specified
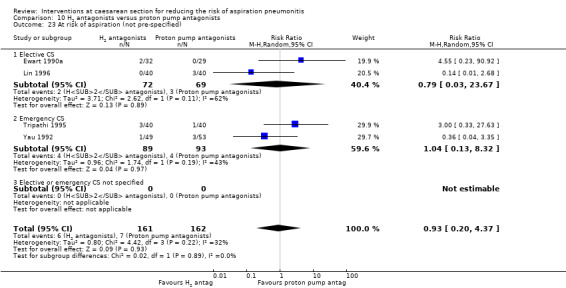
All four studies (Ewart 1990a; Lin 1996; Tripathi 1995; Yau 1992) on women undergoing elective and emergency caesarean section reported on 'at risk of aspiration'.
There was no statistically significant difference in risk identified (average RR 0.93, 95% CI 0.20 to 4.37, four studies, 323 women, random‐effects [Tau² = 0.80, P = 0.22, I² = 32%], Analysis 10.23).
10.23. Analysis.
Comparison 10 H2 antagonists versus proton pump antagonists, Outcome 23 At risk of aspiration (not pre‐specified).
For other non‐prespecified outcomes, see Analyses 10.24 to 10.27.
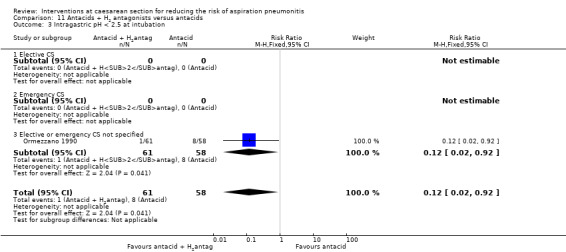
(11) Antacids + H2 antagonists versus antacids (two studies, 714 women)
Two studies compared the combined use of antacids and H2 antagonists versus antacids (Ormezzano 1990; Rout 1993). One study (Rout 1993) was judged to be of good quality with an adequate score on most of the domains that were used to assess risk of bias. In the other study (Ormezzano 1990), sequence generation and allocation were unclear and there was no blinding. However, incomplete outcome data were addressed and the study was judged to be free of other bias.
Primary outcomes
In women undergoing both emergency and elective caesarean section, a combination of antacid plus H2 receptor antagonists compared with antacids alone showed:
a significant reduction in risk of pH less than 2.5 at intubation (RR 0.12, 95% CI 0.02 to 0.92, one study, 119 women, Analysis 11.3).
11.3. Analysis.
Comparison 11 Antacids + H2 antagonists versus antacids, Outcome 3 Intragastric pH < 2.5 at intubation.
Other primary outcomes were not assessed.
Secondary outcomes
None of the secondary outcomes pre‐specified in this review were reported by these studies.
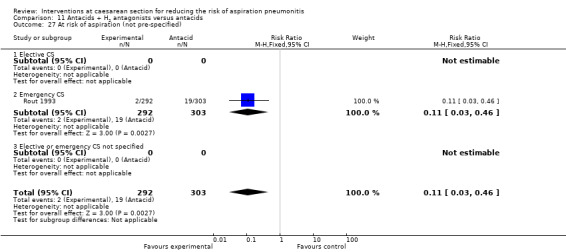
Outcomes not pre‐specified
There was a significant reduction in risk of acid aspiration for women undergoing emergency caesarean section with a combination of antacid plus H2 receptor antagonists compared with antacids alone
(RR 0.11, 95 % CI 0.03 to 0.46, one study, 595 women, Analysis 11.27).
11.27. Analysis.
Comparison 11 Antacids + H2 antagonists versus antacids, Outcome 27 At risk of aspiration (not pre‐specified).
For other non‐prespecified outcomes, see Analyses 11.23 to 11.26.
(12) H2 antagonists + prokinetic drugs versus antacids (no studies)
There were no studies that assessed this comparison.
(13) Proton pump agonists + prokinetics versus proton pump agonists (no studies)
One study assessed this comparison (Orr 1993). This study had adequate sequence generation and allocation concealment.
Primary Outcomes
None of the primary outcomes pre‐specified in this review were reported by this study.
Secondary Outcomes
None of the secondary outcomes pre‐specified in this review were reported by this study.
Outcomes not pre‐specified
This study reported on 'at risk of aspiration' post intubation and pre‐extubation.
There was no statististically significant difference in the risk identified for 'at risk of aspiration' post intubation (RR 0.49, 95%CI 0.15, 1.60, one study, 97 women, Analysis 13.23).
There was no statististically significant difference in the risk identified for 'at risk of aspiration' pre extubation (RR 0.67, 95%CI 0.03, 15.91, one study, 94 women, Analysis 13.24).
13.23. Analysis.
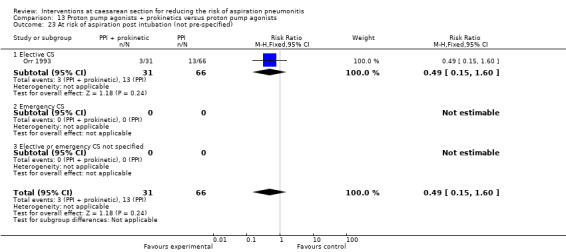
Comparison 13 Proton pump agonists + prokinetics versus proton pump agonists, Outcome 23 At risk of aspiration post intubation (not pre‐specified).
13.24. Analysis.
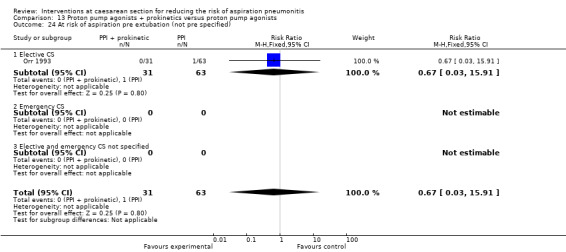
Comparison 13 Proton pump agonists + prokinetics versus proton pump agonists, Outcome 24 At risk of aspiration pre extubation (not pre specified).
(14) H2 antagonist versus tramadol (one study, 60 women)
One study compared H2 receptor antagonists with tramadol (both by intramuscular injection) in 60 women undergoing elective caesarean section (Elhakim 2005). Although most aspects of the assessment of risk of bias were assessed as low risk, allocation concealment was uncertain and this gives an overall uncertain level of risk of bias for the study.
Primary outcomes
Compared with tramadol, H2 antagonists showed a statistically significant increase in:
risk of intragastric volume greater than 0.4mg/kg at intubation (RR 5.00, 95% CI 1.03 to 24.28, one study, 90 women, Analysis 14.4).
14.4. Analysis.
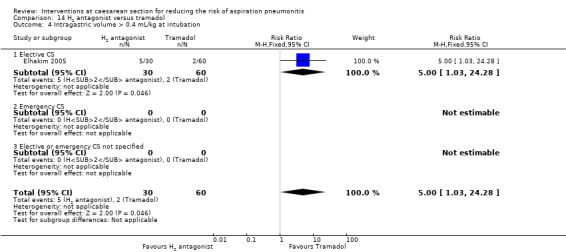
Comparison 14 H2 antagonist versus tramadol, Outcome 4 Intragastric volume > 0.4 mL/kg at intubation.
Other primary outcomes were not assessed.
Secondary outcomes
There was no statistically significant difference identified in:
nausea (RR 1.38, 95% CI 0.64 to 2.93, one study, 60 women, Analysis 14.5). Other secondary outcomes were not assessed.
14.5. Analysis.
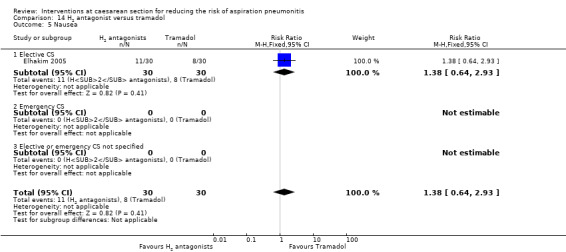
Comparison 14 H2 antagonist versus tramadol, Outcome 5 Nausea.
Outcomes not pre‐specified
This study also included 'at risk of aspiration' defined as gastric volume greater than 0.4 mL/kg and pH less than 2.5, but there were no events observed in either group for this outcome.
(15) Antacids + H2 antagonists versus proton pump antagonists (one study, 109 women)
One study compared antacids plus H2 receptor antagonists with proton pump antagonists in women undergoing emergency caesarean section (Yau 1992). The study was of unclear quality with insufficient information to assess the main aspects of risk of bias.
Primary outcomes
This study did not measure any of the primary outcomes that were pre‐specified in this review.
Secondary outcomes
This study did not measure any of the secondary outcomes that were pre‐specified in this review.
Outcomes not pre‐specified
Compared with proton pump antagonists, H2 receptor antagonists showed a statistically significant reduction in:
'risk of gastric aspiration' (RR 0.12, 95% CI 0.02 to 0.91, one study, 108 women, Analysis 15.23).
15.23. Analysis.
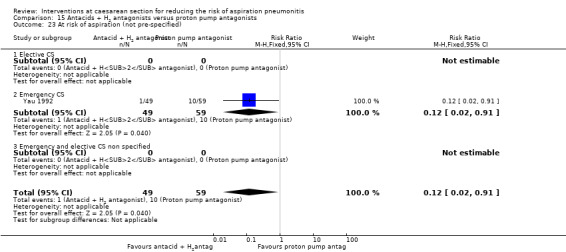
Comparison 15 Antacids + H2 antagonists versus proton pump antagonists, Outcome 23 At risk of aspiration (not pre‐specified).
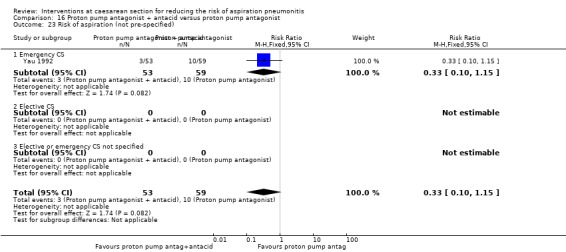
(16) Proton pump antagonist + antacid versus proton pump antagonist (one study, 113 women)
One study assessed proton pump antagonists plus antacids with proton pump antagonist alone in women undergoing emergency caesarean section (Yau 1992). The study was of unclear quality with insufficient information to assess the main aspects of risk of bias.
Primary outcomes
This study did not measure any of the primary outcomes that were pre‐specified in this review.
Secondary outcomes
This study did not measure any of the secondary outcomes that were pre‐specified in this review.
Outcomes not pre‐specified
There was no statistically significant difference identified in:
risk of gastric aspiration between the two interventions (RR 0.33. 95% CI 0.10 to 1.15, one study, 113 women, Analysis 16.23).
16.23. Analysis.
Comparison 16 Proton pump antagonist + antacid versus proton pump antagonist, Outcome 23 Risk of aspiration (not pre‐specified).
(17) H2 antagonist + prokinetic versus H2 antagonist (one study, 50 women)
One study assessed a combination of H2 receptor antagonists plus prokinetic versus H2 receptor antagonists alone in women undergoing elective caesarean section (Iqbal 2000). The study was unclear regarding the randomisation sequence generation and allocation concealment and was thus of unclear quality.
Primary outcomes
This study did not measure any of the primary outcomes that were pre‐specified in this review.
Secondary outcomes
This study did not measure any of the secondary outcomes that were pre‐specified in this review.
Outcomes not pre‐specified
There was no significant difference in risk of gastric aspiration between the two interventions (Analysis 17.23).
17.23. Analysis.
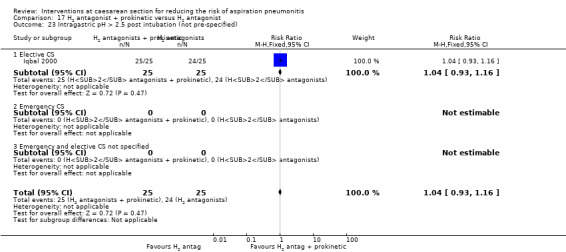
Comparison 17 H2 antagonist + prokinetic versus H2 antagonist, Outcome 23 Intragastric pH > 2.5 post intubation (not pre‐specified).
For non prespecified outcomes, see Analyses 17.24, 17.26 and 17.27.
Discussion
Summary of main results
Although the studies were generally of poor quality, the findings from this review have shown that:
compared with no treatment or placebo, antacids, H2 antagonists and proton pump antagonists each reduce the risk of intragastric pH less than 2.5 at intubation. The studies on prokinetic drugs and non‐pharmacological interventions did not assess this outcome and, in addition, were probably too small to be able identify any differences;
when antacids were compared with H2 antagonists, the findings were unclear as to which drug might be more effective for increasing gastric pH, although antacid use was associated with increase in gastric volume;
H2 antagonists were associated with a reduced risk of intragastric pH less than 2.5 at intubation when compared with proton pump antagonists;
the combination of 'antacids plus H2 antagonists' or 'prokinetic drugs plus H2 antagonists' also reduced the risk of intragastric pH less than 2.5 at intubation, when compared to placebo or no treatment;
when compared to antacid use only, the combination of 'antacids plus H2 antagonists' was associated with a reduction in the risk of intragastric pH less than 2.5 at intubation.
Overall completeness and applicability of evidence
Aspiration pneumonitis is a rare outcome and therefore the primary outcome measure in the studies that we identified were surrogate measures, i.e. intragastric pH and intragastric volume. The validity of these surrogate markers, however, is uncertain as it is based on work on animal experiments from 1974 (Roberts 1974). Many studies have defined and reported high risk of aspiration as a combination of low intragastric pH (less than 2.5) and raised intragastric volume (greater than 25 mL). This combined measure was not a pre‐specified outcome in our review but we have included and presented the data on this for completeness. The studies did not answer the broader question of whether the surrogate markers (of pH and gastric volume) actually correlate with clinical outcome in the context of aspiration pneumonitis.
All but two of the studies that we identified in this review included women who had caesarean section (CS) under general anaesthesia. One study (Lin 1996) studied women who had CS under spinal anaesthesia and the type of anaesthesia used was unclear in one study (Zue 1999). The majority of studies included women who had elective CS (N = 16); five studies included women who had emergency CS, hence we are unable to draw conclusions about the differences between elective and non‐elective CS. The findings of this review are generally applicable for women having CS under general anaesthesia (or those who convert from regional to general anaesthesia). Aspiration under regional anaesthesia is exceptionally rare, but may occur in the presence of other serious clinical problems such as seizures and life‐threatening haemorrhage.
Quality of the evidence
The quality of studies included in this review was generally poor. Only one study was assessed to have adequate sequence generation and concealment allocation (Orr 1993). It was unclear whether or not randomisation sequence generation and allocation concealment were adequate in the majority of studies. The majority of studies were not blinded, although this could have been done feasibly.
Potential biases in the review process
The possibility of introducing bias was present at every stage of reviewing process. We attempted to minimise bias in a number of ways; two review authors assessed eligibility for inclusion, carried out data extraction and assessed risk of bias. Each worked independently. Nevertheless, the process of assessing risk of bias, for example, is not an exact science and includes many personal judgements.
Agreements and disagreements with other studies or reviews
Current practice in the UK mostly includes the administration of the combination of antacids and H2 antagonists prior to CS (Thomas 2001). However, this is not routine practice in many centres worldwide. The findings from this review suggest that the combined use of antacids and H2 antagonists have a role in reducing intragastric pH less than 2.5, and hence possibly in reducing the risk of aspiration pneumonitis during CS, particularly under general anaesthesia.
Authors' conclusions
Implications for practice.
In summary, the quality of the evidence was poor, but the findings suggest that the combination of antacids plus H2 antagonists was shown to be more effective than no intervention, and superior to antacids alone in increasing gastric pH. When a single agent is used, antacids alone are superior to H2 antagonists, which are superior to proton pump inhibitors for increasing gastric pH. The effects of treatments on gastric volume are less consistently reported. These findings are relevant for all women undergoing caesarean section, particularly those under general anaesthesia. Whether women undergoing caesarean section under regional anaesthesia should receive aspiration prophylaxis is a clinical judgement; however, since the treatments are relatively well tolerated, and inexpensive, their use should be strongly considered in view of the potential of benefit, particularly as aspiration still is a cause of maternal mortality.
Implications for research.
This review confirms the efficacy of many of the commonly used aspiration prophylaxis regimens compared with placebo in reducing gastric pH and volume. However, many studies, particularly those examining combinations of different modalities of prophylaxis, were small and of generally poor quality. Large well‐designed studies that include women having emergency and elective caesarean section under regional and general anaesthesia are required to confirm the conclusions of this review.
Further work is required to validate the suitability of surrogate markers (of pH and gastric volume) for clinical outcomes in the context of aspiration pneumonitis.
What's new
| Date | Event | Description |
|---|---|---|
| 6 June 2013 | New citation required but conclusions have not changed | Six new studies were identified from the updated search: one was included (Roper 1981); four were excluded as they did not meet the review inclusion criteria (Hussain 2011; Jabalameli 2011; Khalayleh 2005; Shahriari 2009); and one is awaiting assessment (Sarat 2007). |
| 30 April 2013 | New search has been performed | Search updated. Methods updated. Nine studies previously excluded are now included, although they do not provide any data for analysis (Bifarini 1990; Bifarini 1992; Bylsma‐Howell 1983; Fogarty 1992; Hodgkinson 1983; O'Sullivan 1985; Osman 1995; Stuart 1996; von Braun 1994). |
History
Protocol first published: Issue 4, 2004 Review first published: Issue 1, 2010
| Date | Event | Description |
|---|---|---|
| 11 April 2008 | New citation required and major changes | An editorial decision was taken to split the review into two: those interventions that could be given before surgery to reduce aspiration pneumonitis and those given during or after caesarean section (CS) to reduce nausea and vomiting. We have, therefore, updated the title and the scope of the previously published protocol (Paranjothy 2004) to reflect this decision. |
| 18 February 2008 | Amended | Converted to new review format. |
Acknowledgements
Eugene HC Liu, Department of Anaesthesia, National University Hospital, Singapore, Singapore. Zoe Roberts, Department of Primary Care and Public Health, School of Medicine, Cardiff University.
Alison Ledward, Sara Roden‐Scott, Gillian Kenyon, Edgardo Abalos, Almira Opardija, Julie Arbon and Alex Balistreri for translating articles relevant to this review.
The previous version of this review (Paranjothy 2010) was supported by a grant: the National Instituite for Health Research, UKNIHR NHS Cochrane Collaboration Programme Grant Scheme award for NHS‐prioritised centrally‐managed, pregnancy and childbirth systematic reviews: CPGS02.
The National Institute for Health Research (NIHR) is the largest single funder of the Cochrane Pregnancy and Childbirth Group. The views and opinions expressed therein are those of the authors and do not necessarily reflect those of the NIHR, NHS or the Department of Health.
Data and analyses
Comparison 1. Antacids versus placebo/no treatment.
| Outcome or subgroup title | No. of studies | No. of participants | Statistical method | Effect size |
|---|---|---|---|---|
| 1 Mortality due to aspiration pneumonitis | 0 | 0 | Risk Ratio (M‐H, Fixed, 95% CI) | 0.0 [0.0, 0.0] |
| 1.1 Elective CS | 0 | 0 | Risk Ratio (M‐H, Fixed, 95% CI) | 0.0 [0.0, 0.0] |
| 1.2 Emergency CS | 0 | 0 | Risk Ratio (M‐H, Fixed, 95% CI) | 0.0 [0.0, 0.0] |
| 1.3 Elective or emergency CS not specified | 0 | 0 | Risk Ratio (M‐H, Fixed, 95% CI) | 0.0 [0.0, 0.0] |
| 2 Morbidity due to aspiration pneumonitis | 0 | 0 | Risk Ratio (M‐H, Fixed, 95% CI) | 0.0 [0.0, 0.0] |
| 2.1 Elective CS | 0 | 0 | Risk Ratio (M‐H, Fixed, 95% CI) | 0.0 [0.0, 0.0] |
| 2.2 Emergency CS | 0 | 0 | Risk Ratio (M‐H, Fixed, 95% CI) | 0.0 [0.0, 0.0] |
| 2.3 Elective or emergency CS not specified | 0 | 0 | Risk Ratio (M‐H, Fixed, 95% CI) | 0.0 [0.0, 0.0] |
| 3 Intragastric pH < 2.5 at intubation | 2 | 108 | Risk Ratio (M‐H, Fixed, 95% CI) | 0.17 [0.09, 0.32] |
| 3.1 Elective CS | 1 | 22 | Risk Ratio (M‐H, Fixed, 95% CI) | 0.13 [0.03, 0.59] |
| 3.2 Emergency CS | 0 | 0 | Risk Ratio (M‐H, Fixed, 95% CI) | 0.0 [0.0, 0.0] |
| 3.3 Elective or emergency CS not specified | 1 | 86 | Risk Ratio (M‐H, Fixed, 95% CI) | 0.18 [0.09, 0.36] |
| 4 Intragastric volume > 0.4 mL/kg at intubation | 0 | 0 | Risk Ratio (M‐H, Fixed, 95% CI) | 0.0 [0.0, 0.0] |
| 4.1 Elective CS | 0 | 0 | Risk Ratio (M‐H, Fixed, 95% CI) | 0.0 [0.0, 0.0] |
| 4.2 Emergency CS | 0 | 0 | Risk Ratio (M‐H, Fixed, 95% CI) | 0.0 [0.0, 0.0] |
| 4.3 Elective or emergency CS not specified | 0 | 0 | Risk Ratio (M‐H, Fixed, 95% CI) | 0.0 [0.0, 0.0] |
| 5 Nausea | 0 | 0 | Risk Ratio (M‐H, Fixed, 95% CI) | 0.0 [0.0, 0.0] |
| 5.1 Elective CS | 0 | 0 | Risk Ratio (M‐H, Fixed, 95% CI) | 0.0 [0.0, 0.0] |
| 5.2 Emergency CS | 0 | 0 | Risk Ratio (M‐H, Fixed, 95% CI) | 0.0 [0.0, 0.0] |
| 5.3 Elective or emergency CS not specified | 0 | 0 | Risk Ratio (M‐H, Fixed, 95% CI) | 0.0 [0.0, 0.0] |
| 6 Vomiting | 0 | 0 | Risk Ratio (M‐H, Fixed, 95% CI) | 0.0 [0.0, 0.0] |
| 6.1 Elective CS | 0 | 0 | Risk Ratio (M‐H, Fixed, 95% CI) | 0.0 [0.0, 0.0] |
| 6.2 Emergency CS | 0 | 0 | Risk Ratio (M‐H, Fixed, 95% CI) | 0.0 [0.0, 0.0] |
| 6.3 Elective or emergency CS not specified | 0 | 0 | Risk Ratio (M‐H, Fixed, 95% CI) | 0.0 [0.0, 0.0] |
| 7 Sedation | 0 | 0 | Risk Ratio (M‐H, Fixed, 95% CI) | 0.0 [0.0, 0.0] |
| 7.1 Elective CS | 0 | 0 | Risk Ratio (M‐H, Fixed, 95% CI) | 0.0 [0.0, 0.0] |
| 7.2 Emergency CS | 0 | 0 | Risk Ratio (M‐H, Fixed, 95% CI) | 0.0 [0.0, 0.0] |
| 7.3 Elective or emergency CS not specified | 0 | 0 | Risk Ratio (M‐H, Fixed, 95% CI) | 0.0 [0.0, 0.0] |
| 8 Restlessness | 0 | 0 | Risk Ratio (M‐H, Fixed, 95% CI) | 0.0 [0.0, 0.0] |
| 8.1 Elective CS | 0 | 0 | Risk Ratio (M‐H, Fixed, 95% CI) | 0.0 [0.0, 0.0] |
| 8.2 Emergency CS | 0 | 0 | Risk Ratio (M‐H, Fixed, 95% CI) | 0.0 [0.0, 0.0] |
| 8.3 Elective or emergency CS not specified | 0 | 0 | Risk Ratio (M‐H, Fixed, 95% CI) | 0.0 [0.0, 0.0] |
| 9 Dystonic reactions | 0 | 0 | Risk Ratio (M‐H, Fixed, 95% CI) | 0.0 [0.0, 0.0] |
| 9.1 Elective CS | 0 | 0 | Risk Ratio (M‐H, Fixed, 95% CI) | 0.0 [0.0, 0.0] |
| 9.2 Emergency CS | 0 | 0 | Risk Ratio (M‐H, Fixed, 95% CI) | 0.0 [0.0, 0.0] |
| 9.3 Elective or emergency CS not specified | 0 | 0 | Risk Ratio (M‐H, Fixed, 95% CI) | 0.0 [0.0, 0.0] |
| 10 Extrapyramidal symptoms | 0 | 0 | Risk Ratio (M‐H, Fixed, 95% CI) | 0.0 [0.0, 0.0] |
| 10.1 Elective CS | 0 | 0 | Risk Ratio (M‐H, Fixed, 95% CI) | 0.0 [0.0, 0.0] |
| 10.2 Emergency CS | 0 | 0 | Risk Ratio (M‐H, Fixed, 95% CI) | 0.0 [0.0, 0.0] |
| 10.3 Elective or emergency CS not specified | 0 | 0 | Risk Ratio (M‐H, Fixed, 95% CI) | 0.0 [0.0, 0.0] |
| 11 Hypotension | 0 | 0 | Risk Ratio (M‐H, Fixed, 95% CI) | 0.0 [0.0, 0.0] |
| 11.1 Elective CS | 0 | 0 | Risk Ratio (M‐H, Fixed, 95% CI) | 0.0 [0.0, 0.0] |
| 11.2 Emergency CS | 0 | 0 | Risk Ratio (M‐H, Fixed, 95% CI) | 0.0 [0.0, 0.0] |
| 11.3 Elective or emergency CS not specified | 0 | 0 | Risk Ratio (M‐H, Fixed, 95% CI) | 0.0 [0.0, 0.0] |
| 12 Blood loss | 0 | 0 | Std. Mean Difference (IV, Fixed, 95% CI) | 0.0 [0.0, 0.0] |
| 12.1 Elective CS | 0 | 0 | Std. Mean Difference (IV, Fixed, 95% CI) | 0.0 [0.0, 0.0] |
| 12.2 Emergency CS | 0 | 0 | Std. Mean Difference (IV, Fixed, 95% CI) | 0.0 [0.0, 0.0] |
| 12.3 Elective or emergency CS not specified | 0 | 0 | Std. Mean Difference (IV, Fixed, 95% CI) | 0.0 [0.0, 0.0] |
| 13 Atonic uterus | 0 | 0 | Risk Ratio (M‐H, Fixed, 95% CI) | 0.0 [0.0, 0.0] |
| 13.1 Elective CS | 0 | 0 | Risk Ratio (M‐H, Fixed, 95% CI) | 0.0 [0.0, 0.0] |
| 13.2 Emergency CS | 0 | 0 | Risk Ratio (M‐H, Fixed, 95% CI) | 0.0 [0.0, 0.0] |
| 13.3 Elective or emergency CS not specified | 0 | 0 | Risk Ratio (M‐H, Fixed, 95% CI) | 0.0 [0.0, 0.0] |
| 14 Women's satisfaction | 0 | 0 | Std. Mean Difference (IV, Fixed, 95% CI) | 0.0 [0.0, 0.0] |
| 14.1 Elective CS | 0 | 0 | Std. Mean Difference (IV, Fixed, 95% CI) | 0.0 [0.0, 0.0] |
| 14.2 Emergency CS | 0 | 0 | Std. Mean Difference (IV, Fixed, 95% CI) | 0.0 [0.0, 0.0] |
| 14.3 Elective or emergency CS not specified | 0 | 0 | Std. Mean Difference (IV, Fixed, 95% CI) | 0.0 [0.0, 0.0] |
| 15 Cord blood pH | 0 | 0 | Mean Difference (IV, Fixed, 95% CI) | 0.0 [0.0, 0.0] |
| 15.1 Elective CS | 0 | 0 | Mean Difference (IV, Fixed, 95% CI) | 0.0 [0.0, 0.0] |
| 15.2 Emergency CS | 0 | 0 | Mean Difference (IV, Fixed, 95% CI) | 0.0 [0.0, 0.0] |
| 15.3 Elective or emergency CS not specified | 0 | 0 | Mean Difference (IV, Fixed, 95% CI) | 0.0 [0.0, 0.0] |
| 16 Apgar < 7 at 5 minutes | 0 | 0 | Risk Ratio (M‐H, Fixed, 95% CI) | 0.0 [0.0, 0.0] |
| 16.1 Elective CS | 0 | 0 | Risk Ratio (M‐H, Fixed, 95% CI) | 0.0 [0.0, 0.0] |
| 16.2 Emergency CS | 0 | 0 | Risk Ratio (M‐H, Fixed, 95% CI) | 0.0 [0.0, 0.0] |
| 16.3 Elective or emergency CS not specified | 0 | 0 | Risk Ratio (M‐H, Fixed, 95% CI) | 0.0 [0.0, 0.0] |
| 17 Neonatal assessment scores | 0 | 0 | Std. Mean Difference (IV, Fixed, 95% CI) | 0.0 [0.0, 0.0] |
| 17.1 Elective CS | 0 | 0 | Std. Mean Difference (IV, Fixed, 95% CI) | 0.0 [0.0, 0.0] |
| 17.2 Emergency CS | 0 | 0 | Std. Mean Difference (IV, Fixed, 95% CI) | 0.0 [0.0, 0.0] |
| 17.3 Elective or emergency CS not specified | 0 | 0 | Std. Mean Difference (IV, Fixed, 95% CI) | 0.0 [0.0, 0.0] |
| 18 Admission to neonatal intensive care unitNICU | 0 | 0 | Risk Ratio (M‐H, Fixed, 95% CI) | 0.0 [0.0, 0.0] |
| 18.1 Elective CS | 0 | 0 | Risk Ratio (M‐H, Fixed, 95% CI) | 0.0 [0.0, 0.0] |
| 18.2 Emergency CS | 0 | 0 | Risk Ratio (M‐H, Fixed, 95% CI) | 0.0 [0.0, 0.0] |
| 18.3 Elective or emergency CS not specified | 0 | 0 | Risk Ratio (M‐H, Fixed, 95% CI) | 0.0 [0.0, 0.0] |
| 19 Initiation of breastfeeding | 0 | 0 | Risk Ratio (M‐H, Fixed, 95% CI) | 0.0 [0.0, 0.0] |
| 19.1 Elective CS | 0 | 0 | Risk Ratio (M‐H, Fixed, 95% CI) | 0.0 [0.0, 0.0] |
| 19.2 Emergency CS | 0 | 0 | Risk Ratio (M‐H, Fixed, 95% CI) | 0.0 [0.0, 0.0] |
| 19.3 Elective or emergency CS not specified | 0 | 0 | Risk Ratio (M‐H, Fixed, 95% CI) | 0.0 [0.0, 0.0] |
| 20 Duration of breastfeeding | 0 | 0 | Mean Difference (IV, Fixed, 95% CI) | 0.0 [0.0, 0.0] |
| 20.1 Elective CS | 0 | 0 | Mean Difference (IV, Fixed, 95% CI) | 0.0 [0.0, 0.0] |
| 20.2 Emergency CS | 0 | 0 | Mean Difference (IV, Fixed, 95% CI) | 0.0 [0.0, 0.0] |
| 20.3 Elective or emergency CS not specified | 0 | 0 | Mean Difference (IV, Fixed, 95% CI) | 0.0 [0.0, 0.0] |
| 21 Intragastric pH < 2.5 at extubation | 1 | 86 | Risk Ratio (M‐H, Fixed, 95% CI) | 0.21 [0.09, 0.48] |
| 21.1 Elective CS | 0 | 0 | Risk Ratio (M‐H, Fixed, 95% CI) | 0.0 [0.0, 0.0] |
| 21.2 Emergency CS | 0 | 0 | Risk Ratio (M‐H, Fixed, 95% CI) | 0.0 [0.0, 0.0] |
| 21.3 Elective or emergency CS not specified | 1 | 86 | Risk Ratio (M‐H, Fixed, 95% CI) | 0.21 [0.09, 0.48] |
| 22 Intragastric volume > 0.4 mL/kg at extubation | 0 | 0 | Risk Ratio (M‐H, Fixed, 95% CI) | 0.0 [0.0, 0.0] |
| 22.1 Elective CS | 0 | 0 | Risk Ratio (M‐H, Fixed, 95% CI) | 0.0 [0.0, 0.0] |
| 22.2 Emergency CS | 0 | 0 | Risk Ratio (M‐H, Fixed, 95% CI) | 0.0 [0.0, 0.0] |
| 22.3 Elective or emergency CS not specified | 0 | 0 | Risk Ratio (M‐H, Fixed, 95% CI) | 0.0 [0.0, 0.0] |
| 23 Gastric volume post intubation (not pre‐specified) | 2 | 74 | Mean Difference (IV, Random, 95% CI) | 30.33 [‐3.97, 64.62] |
| 23.1 Elective CS | 2 | 74 | Mean Difference (IV, Random, 95% CI) | 30.33 [‐3.97, 64.62] |
| 23.2 Emergency CS | 0 | 0 | Mean Difference (IV, Random, 95% CI) | 0.0 [0.0, 0.0] |
| 23.3 Elective or emergency CS not specified | 0 | 0 | Mean Difference (IV, Random, 95% CI) | 0.0 [0.0, 0.0] |
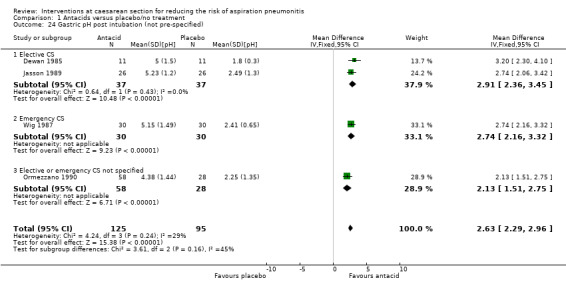
| 24 Gastric pH post intubation (not pre‐specified) | 4 | 220 | Mean Difference (IV, Fixed, 95% CI) | 2.63 [2.29, 2.96] |
| 24.1 Elective CS | 2 | 74 | Mean Difference (IV, Fixed, 95% CI) | 2.91 [2.36, 3.45] |
| 24.2 Emergency CS | 1 | 60 | Mean Difference (IV, Fixed, 95% CI) | 2.74 [2.16, 3.32] |
| 24.3 Elective or emergency CS not specified | 1 | 86 | Mean Difference (IV, Fixed, 95% CI) | 2.13 [1.51, 2.75] |
| 25 At risk of aspiration (not pre‐specified) | 1 | 22 | Risk Ratio (M‐H, Fixed, 95% CI) | 0.07 [0.00, 1.04] |
| 25.1 Elective CS | 1 | 22 | Risk Ratio (M‐H, Fixed, 95% CI) | 0.07 [0.00, 1.04] |
| 25.2 Emergency CS | 0 | 0 | Risk Ratio (M‐H, Fixed, 95% CI) | 0.0 [0.0, 0.0] |
| 25.3 Elective or emergency CS not specified | 0 | 0 | Risk Ratio (M‐H, Fixed, 95% CI) | 0.0 [0.0, 0.0] |
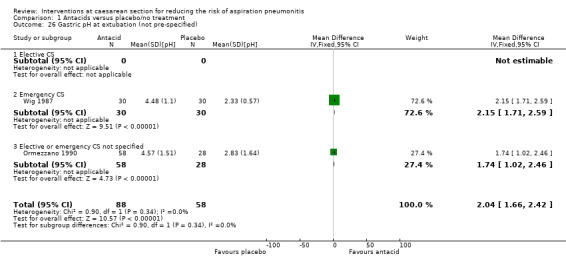
| 26 Gastric pH at extubation (not pre‐specified) | 2 | 146 | Mean Difference (IV, Fixed, 95% CI) | 2.04 [1.66, 2.42] |
| 26.1 Elective CS | 0 | 0 | Mean Difference (IV, Fixed, 95% CI) | 0.0 [0.0, 0.0] |
| 26.2 Emergency CS | 1 | 60 | Mean Difference (IV, Fixed, 95% CI) | 2.15 [1.71, 2.59] |
| 26.3 Elective or emergency CS not specified | 1 | 86 | Mean Difference (IV, Fixed, 95% CI) | 1.74 [1.02, 2.46] |
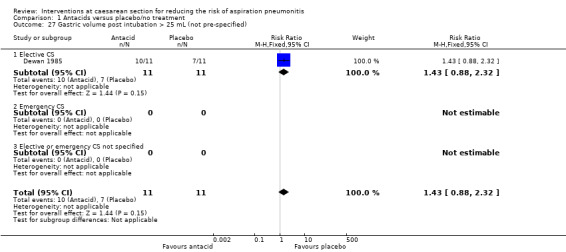
| 27 Gastric volume post intubation > 25 mL (not pre‐specified) | 1 | 22 | Risk Ratio (M‐H, Fixed, 95% CI) | 1.43 [0.88, 2.32] |
| 27.1 Elective CS | 1 | 22 | Risk Ratio (M‐H, Fixed, 95% CI) | 1.43 [0.88, 2.32] |
| 27.2 Emergency CS | 0 | 0 | Risk Ratio (M‐H, Fixed, 95% CI) | 0.0 [0.0, 0.0] |
| 27.3 Elective or emergency CS not specified | 0 | 0 | Risk Ratio (M‐H, Fixed, 95% CI) | 0.0 [0.0, 0.0] |
1.23. Analysis.
Comparison 1 Antacids versus placebo/no treatment, Outcome 23 Gastric volume post intubation (not pre‐specified).
1.24. Analysis.
Comparison 1 Antacids versus placebo/no treatment, Outcome 24 Gastric pH post intubation (not pre‐specified).
1.26. Analysis.
Comparison 1 Antacids versus placebo/no treatment, Outcome 26 Gastric pH at extubation (not pre‐specified).
1.27. Analysis.
Comparison 1 Antacids versus placebo/no treatment, Outcome 27 Gastric volume post intubation > 25 mL (not pre‐specified).
Comparison 2. H2 antagonists versus placebo/no treatment.
| Outcome or subgroup title | No. of studies | No. of participants | Statistical method | Effect size |
|---|---|---|---|---|
| 1 Mortality due to aspiration pneumonitis | 0 | 0 | Risk Ratio (M‐H, Fixed, 95% CI) | 0.0 [0.0, 0.0] |
| 1.1 Elective CS | 0 | 0 | Risk Ratio (M‐H, Fixed, 95% CI) | 0.0 [0.0, 0.0] |
| 1.2 Emergency CS | 0 | 0 | Risk Ratio (M‐H, Fixed, 95% CI) | 0.0 [0.0, 0.0] |
| 1.3 Elective or emergency CS not specified | 0 | 0 | Risk Ratio (M‐H, Fixed, 95% CI) | 0.0 [0.0, 0.0] |
| 2 Morbidity due to aspiration pneumonitis | 0 | 0 | Risk Ratio (M‐H, Fixed, 95% CI) | 0.0 [0.0, 0.0] |
| 2.1 Elective CS | 0 | 0 | Risk Ratio (M‐H, Fixed, 95% CI) | 0.0 [0.0, 0.0] |
| 2.2 Emergency CS | 0 | 0 | Risk Ratio (M‐H, Fixed, 95% CI) | 0.0 [0.0, 0.0] |
| 2.3 Elective or emergency CS not specified | 0 | 0 | Risk Ratio (M‐H, Fixed, 95% CI) | 0.0 [0.0, 0.0] |
| 3 Intragastric pH < 2.5 at intubation | 2 | 170 | Risk Ratio (M‐H, Fixed, 95% CI) | 0.09 [0.05, 0.18] |
| 3.1 Elective CS | 2 | 170 | Risk Ratio (M‐H, Fixed, 95% CI) | 0.09 [0.05, 0.18] |
| 3.2 Emergency CS | 0 | 0 | Risk Ratio (M‐H, Fixed, 95% CI) | 0.0 [0.0, 0.0] |
| 3.3 Elective or emergency CS not specified | 0 | 0 | Risk Ratio (M‐H, Fixed, 95% CI) | 0.0 [0.0, 0.0] |
| 4 Intragastric volume > 0.4 mL/kg at intubation | 2 | 170 | Risk Ratio (M‐H, Random, 95% CI) | 0.08 [0.01, 0.86] |
| 4.1 Elective CS | 2 | 170 | Risk Ratio (M‐H, Random, 95% CI) | 0.08 [0.01, 0.86] |
| 4.2 Emergency CS | 0 | 0 | Risk Ratio (M‐H, Random, 95% CI) | 0.0 [0.0, 0.0] |
| 4.3 Elective or emergency CS not specified | 0 | 0 | Risk Ratio (M‐H, Random, 95% CI) | 0.0 [0.0, 0.0] |
| 5 Nausea | 0 | 0 | Risk Ratio (M‐H, Fixed, 95% CI) | 0.0 [0.0, 0.0] |
| 5.1 Elective CS | 0 | 0 | Risk Ratio (M‐H, Fixed, 95% CI) | 0.0 [0.0, 0.0] |
| 5.2 Emergency CS | 0 | 0 | Risk Ratio (M‐H, Fixed, 95% CI) | 0.0 [0.0, 0.0] |
| 5.3 Elective or emergency CS not specified | 0 | 0 | Risk Ratio (M‐H, Fixed, 95% CI) | 0.0 [0.0, 0.0] |
| 6 Vomiting | 0 | 0 | Risk Ratio (M‐H, Fixed, 95% CI) | 0.0 [0.0, 0.0] |
| 6.1 Elective CS | 0 | 0 | Risk Ratio (M‐H, Fixed, 95% CI) | 0.0 [0.0, 0.0] |
| 6.2 Emergency CS | 0 | 0 | Risk Ratio (M‐H, Fixed, 95% CI) | 0.0 [0.0, 0.0] |
| 6.3 Elective or emergency CS not specified | 0 | 0 | Risk Ratio (M‐H, Fixed, 95% CI) | 0.0 [0.0, 0.0] |
| 7 Sedation | 0 | 0 | Risk Ratio (M‐H, Fixed, 95% CI) | 0.0 [0.0, 0.0] |
| 7.1 Elective CS | 0 | 0 | Risk Ratio (M‐H, Fixed, 95% CI) | 0.0 [0.0, 0.0] |
| 7.2 Emergency CS | 0 | 0 | Risk Ratio (M‐H, Fixed, 95% CI) | 0.0 [0.0, 0.0] |
| 7.3 Elective or emergency CS not specified | 0 | 0 | Risk Ratio (M‐H, Fixed, 95% CI) | 0.0 [0.0, 0.0] |
| 8 Restlessness | 0 | 0 | Risk Ratio (M‐H, Fixed, 95% CI) | 0.0 [0.0, 0.0] |
| 8.1 Elective CS | 0 | 0 | Risk Ratio (M‐H, Fixed, 95% CI) | 0.0 [0.0, 0.0] |
| 8.2 Emergency CS | 0 | 0 | Risk Ratio (M‐H, Fixed, 95% CI) | 0.0 [0.0, 0.0] |
| 8.3 Elective or emergency CS not specified | 0 | 0 | Risk Ratio (M‐H, Fixed, 95% CI) | 0.0 [0.0, 0.0] |
| 9 Dystonic reactions | 0 | 0 | Risk Ratio (M‐H, Fixed, 95% CI) | 0.0 [0.0, 0.0] |
| 9.1 Elective CS | 0 | 0 | Risk Ratio (M‐H, Fixed, 95% CI) | 0.0 [0.0, 0.0] |
| 9.2 Emergency CS | 0 | 0 | Risk Ratio (M‐H, Fixed, 95% CI) | 0.0 [0.0, 0.0] |
| 9.3 Elective or emergency CS not specified | 0 | 0 | Risk Ratio (M‐H, Fixed, 95% CI) | 0.0 [0.0, 0.0] |
| 10 Extrapyramidal symptoms | 0 | 0 | Risk Ratio (M‐H, Fixed, 95% CI) | 0.0 [0.0, 0.0] |
| 10.1 Elective CS | 0 | 0 | Risk Ratio (M‐H, Fixed, 95% CI) | 0.0 [0.0, 0.0] |
| 10.2 Emergency CS | 0 | 0 | Risk Ratio (M‐H, Fixed, 95% CI) | 0.0 [0.0, 0.0] |
| 10.3 Elective or emergency CS not specified | 0 | 0 | Risk Ratio (M‐H, Fixed, 95% CI) | 0.0 [0.0, 0.0] |
| 11 Hypotension | 0 | 0 | Risk Ratio (M‐H, Fixed, 95% CI) | 0.0 [0.0, 0.0] |
| 11.1 Elective CS | 0 | 0 | Risk Ratio (M‐H, Fixed, 95% CI) | 0.0 [0.0, 0.0] |
| 11.2 Emergency CS | 0 | 0 | Risk Ratio (M‐H, Fixed, 95% CI) | 0.0 [0.0, 0.0] |
| 11.3 Elective or emergency CS not specified | 0 | 0 | Risk Ratio (M‐H, Fixed, 95% CI) | 0.0 [0.0, 0.0] |
| 12 Blood loss | 0 | 0 | Std. Mean Difference (IV, Fixed, 95% CI) | 0.0 [0.0, 0.0] |
| 12.1 Elective CS | 0 | 0 | Std. Mean Difference (IV, Fixed, 95% CI) | 0.0 [0.0, 0.0] |
| 12.2 Emergency CS | 0 | 0 | Std. Mean Difference (IV, Fixed, 95% CI) | 0.0 [0.0, 0.0] |
| 12.3 Elective or emergency CS not specified | 0 | 0 | Std. Mean Difference (IV, Fixed, 95% CI) | 0.0 [0.0, 0.0] |
| 13 Atonic uterus | 0 | 0 | Risk Ratio (M‐H, Fixed, 95% CI) | 0.0 [0.0, 0.0] |
| 13.1 Elective CS | 0 | 0 | Risk Ratio (M‐H, Fixed, 95% CI) | 0.0 [0.0, 0.0] |
| 13.2 Emergency CS | 0 | 0 | Risk Ratio (M‐H, Fixed, 95% CI) | 0.0 [0.0, 0.0] |
| 13.3 Elective or emergency CS not specified | 0 | 0 | Risk Ratio (M‐H, Fixed, 95% CI) | 0.0 [0.0, 0.0] |
| 14 Women's satisfaction | 0 | 0 | Std. Mean Difference (IV, Fixed, 95% CI) | 0.0 [0.0, 0.0] |
| 14.1 Elective CS | 0 | 0 | Std. Mean Difference (IV, Fixed, 95% CI) | 0.0 [0.0, 0.0] |
| 14.2 Emergency CS | 0 | 0 | Std. Mean Difference (IV, Fixed, 95% CI) | 0.0 [0.0, 0.0] |
| 14.3 Elective or emergency CS not specified | 0 | 0 | Std. Mean Difference (IV, Fixed, 95% CI) | 0.0 [0.0, 0.0] |
| 15 Cord blood pH | 0 | 0 | Mean Difference (IV, Fixed, 95% CI) | 0.0 [0.0, 0.0] |
| 15.1 Elective CS | 0 | 0 | Mean Difference (IV, Fixed, 95% CI) | 0.0 [0.0, 0.0] |
| 15.2 Emergency CS | 0 | 0 | Mean Difference (IV, Fixed, 95% CI) | 0.0 [0.0, 0.0] |
| 15.3 Elective or emergency CS not specified | 0 | 0 | Mean Difference (IV, Fixed, 95% CI) | 0.0 [0.0, 0.0] |
| 16 Apgar < 7 at 5 minutes | 0 | 0 | Risk Ratio (M‐H, Fixed, 95% CI) | 0.0 [0.0, 0.0] |
| 16.1 Elective CS | 0 | 0 | Risk Ratio (M‐H, Fixed, 95% CI) | 0.0 [0.0, 0.0] |
| 16.2 Emergency CS | 0 | 0 | Risk Ratio (M‐H, Fixed, 95% CI) | 0.0 [0.0, 0.0] |
| 16.3 Elective or emergency CS not specified | 0 | 0 | Risk Ratio (M‐H, Fixed, 95% CI) | 0.0 [0.0, 0.0] |
| 17 Neonatal assessment scores | 0 | 0 | Std. Mean Difference (IV, Fixed, 95% CI) | 0.0 [0.0, 0.0] |
| 17.1 Elective CS | 0 | 0 | Std. Mean Difference (IV, Fixed, 95% CI) | 0.0 [0.0, 0.0] |
| 17.2 Emergency CS | 0 | 0 | Std. Mean Difference (IV, Fixed, 95% CI) | 0.0 [0.0, 0.0] |
| 17.3 Elective or emergency CS not specified | 0 | 0 | Std. Mean Difference (IV, Fixed, 95% CI) | 0.0 [0.0, 0.0] |
| 18 Admission to NICU | 0 | 0 | Risk Ratio (M‐H, Fixed, 95% CI) | 0.0 [0.0, 0.0] |
| 18.1 Elective CS | 0 | 0 | Risk Ratio (M‐H, Fixed, 95% CI) | 0.0 [0.0, 0.0] |
| 18.2 Emergency CS | 0 | 0 | Risk Ratio (M‐H, Fixed, 95% CI) | 0.0 [0.0, 0.0] |
| 18.3 Elective or emergency CS not specified | 0 | 0 | Risk Ratio (M‐H, Fixed, 95% CI) | 0.0 [0.0, 0.0] |
| 19 Initiation of breastfeeding | 0 | 0 | Risk Ratio (M‐H, Fixed, 95% CI) | 0.0 [0.0, 0.0] |
| 19.1 Elective CS | 0 | 0 | Risk Ratio (M‐H, Fixed, 95% CI) | 0.0 [0.0, 0.0] |
| 19.2 Emergency CS | 0 | 0 | Risk Ratio (M‐H, Fixed, 95% CI) | 0.0 [0.0, 0.0] |
| 19.3 Elective or emergency CS not specified | 0 | 0 | Risk Ratio (M‐H, Fixed, 95% CI) | 0.0 [0.0, 0.0] |
| 20 Duration of breastfeeding | 0 | 0 | Std. Mean Difference (IV, Fixed, 95% CI) | 0.0 [0.0, 0.0] |
| 20.1 Elective CS | 0 | 0 | Std. Mean Difference (IV, Fixed, 95% CI) | 0.0 [0.0, 0.0] |
| 20.2 Emergency CS | 0 | 0 | Std. Mean Difference (IV, Fixed, 95% CI) | 0.0 [0.0, 0.0] |
| 20.3 Elective or emergency CS not specified | 0 | 0 | Std. Mean Difference (IV, Fixed, 95% CI) | 0.0 [0.0, 0.0] |
| 21 Intragastric pH < 2.5 at extubation | 1 | 30 | Risk Ratio (M‐H, Fixed, 95% CI) | 0.08 [0.01, 0.56] |
| 21.1 Elective CS | 1 | 30 | Risk Ratio (M‐H, Fixed, 95% CI) | 0.08 [0.01, 0.56] |
| 21.2 Emergency CS | 0 | 0 | Risk Ratio (M‐H, Fixed, 95% CI) | 0.0 [0.0, 0.0] |
| 21.3 Elective or emergency CS not specified | 0 | 0 | Risk Ratio (M‐H, Fixed, 95% CI) | 0.0 [0.0, 0.0] |
| 22 Intragastric volume > 20 mL at extubation (not pre‐specified) | 1 | 30 | Risk Ratio (M‐H, Fixed, 95% CI) | 0.33 [0.11, 0.99] |
| 22.1 Elective CS | 1 | 30 | Risk Ratio (M‐H, Fixed, 95% CI) | 0.33 [0.11, 0.99] |
| 22.2 Emergency CS | 0 | 0 | Risk Ratio (M‐H, Fixed, 95% CI) | 0.0 [0.0, 0.0] |
| 22.3 Elective or emergency CS not specified | 0 | 0 | Risk Ratio (M‐H, Fixed, 95% CI) | 0.0 [0.0, 0.0] |
| 23 Gastric pH at intubation (not pre‐specified) | 3 | 160 | Mean Difference (IV, Random, 95% CI) | 3.31 [1.82, 4.81] |
| 23.1 Elective CS | 2 | 100 | Mean Difference (IV, Random, 95% CI) | 2.59 [2.04, 3.14] |
| 23.2 Emergency CS | 1 | 60 | Mean Difference (IV, Random, 95% CI) | 4.43 [3.97, 4.89] |
| 23.3 Elective or emergency CS not specified | 0 | 0 | Mean Difference (IV, Random, 95% CI) | 0.0 [0.0, 0.0] |
| 24 Gastric pH at extubation (not pre‐specified) | 2 | 110 | Mean Difference (IV, Random, 95% CI) | 3.56 [2.25, 4.87] |
| 24.1 Elective CS | 1 | 50 | Mean Difference (IV, Random, 95% CI) | 2.86 [2.13, 3.59] |
| 24.2 Emergency CS | 1 | 60 | Mean Difference (IV, Random, 95% CI) | 4.20 [3.70, 4.70] |
| 24.3 Elective or emergency CS not specified | 0 | 0 | Mean Difference (IV, Random, 95% CI) | 0.0 [0.0, 0.0] |
| 25 At risk of aspiration post intubation (not pre‐specified) | 4 | 255 | Risk Ratio (M‐H, Random, 95% CI) | 0.07 [0.01, 0.33] |
| 25.1 Elective CS | 4 | 255 | Risk Ratio (M‐H, Random, 95% CI) | 0.07 [0.01, 0.33] |
| 25.2 Emergency CS | 0 | 0 | Risk Ratio (M‐H, Random, 95% CI) | 0.0 [0.0, 0.0] |
| 25.3 Elective or emergency CS not specified | 0 | 0 | Risk Ratio (M‐H, Random, 95% CI) | 0.0 [0.0, 0.0] |
| 26 At risk of aspiration pre extubation (not pre‐specified) | 2 | 125 | Risk Ratio (M‐H, Fixed, 95% CI) | 0.17 [0.01, 4.03] |
| 26.1 Elective CS | 2 | 125 | Risk Ratio (M‐H, Fixed, 95% CI) | 0.17 [0.01, 4.03] |
| 26.2 Emergency CS | 0 | 0 | Risk Ratio (M‐H, Fixed, 95% CI) | 0.0 [0.0, 0.0] |
| 26.3 Elective or emergency CS not specified | 0 | 0 | Risk Ratio (M‐H, Fixed, 95% CI) | 0.0 [0.0, 0.0] |
| 27 Gastric volume post intubation (not pre‐specified) | 2 | 100 | Mean Difference (IV, Fixed, 95% CI) | ‐14.06 [‐18.68, ‐9.45] |
| 27.1 Elective CS | 2 | 100 | Mean Difference (IV, Fixed, 95% CI) | ‐14.06 [‐18.68, ‐9.45] |
| 27.2 Emergency CS | 0 | 0 | Mean Difference (IV, Fixed, 95% CI) | 0.0 [0.0, 0.0] |
| 27.3 Emergency and elective CS not specified | 0 | 0 | Mean Difference (IV, Fixed, 95% CI) | 0.0 [0.0, 0.0] |
| 28 Gastric volume pre‐extubation (not pre‐specified) | 1 | 50 | Mean Difference (IV, Fixed, 95% CI) | ‐3.70 [‐6.17, ‐1.23] |
| 28.1 Elective CS | 1 | 50 | Mean Difference (IV, Fixed, 95% CI) | ‐3.70 [‐6.17, ‐1.23] |
| 28.2 Emergency CS | 0 | 0 | Mean Difference (IV, Fixed, 95% CI) | 0.0 [0.0, 0.0] |
| 28.3 Emergency and elective CS not specified | 0 | 0 | Mean Difference (IV, Fixed, 95% CI) | 0.0 [0.0, 0.0] |
2.22. Analysis.
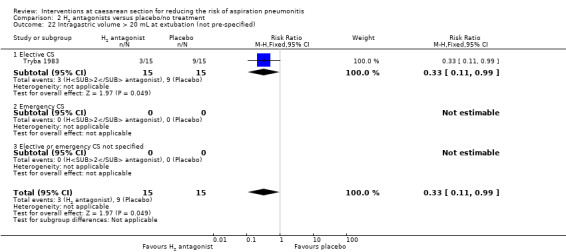
Comparison 2 H2 antagonists versus placebo/no treatment, Outcome 22 Intragastric volume > 20 mL at extubation (not pre‐specified).
2.23. Analysis.
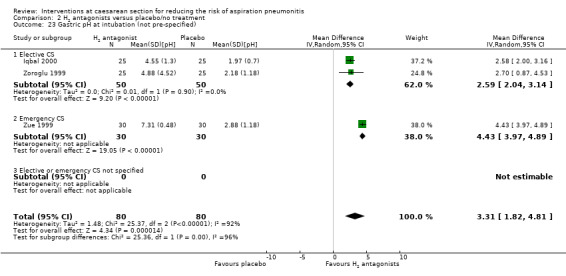
Comparison 2 H2 antagonists versus placebo/no treatment, Outcome 23 Gastric pH at intubation (not pre‐specified).
2.24. Analysis.
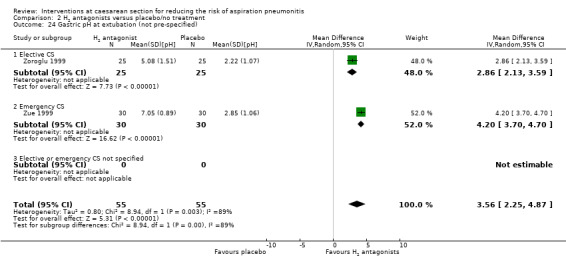
Comparison 2 H2 antagonists versus placebo/no treatment, Outcome 24 Gastric pH at extubation (not pre‐specified).
2.27. Analysis.
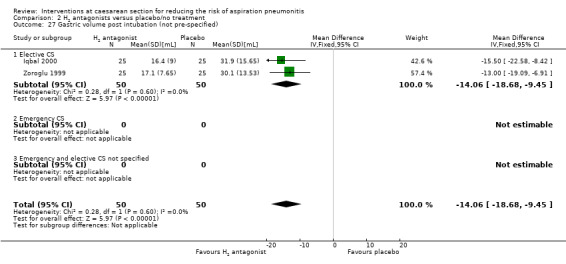
Comparison 2 H2 antagonists versus placebo/no treatment, Outcome 27 Gastric volume post intubation (not pre‐specified).
2.28. Analysis.
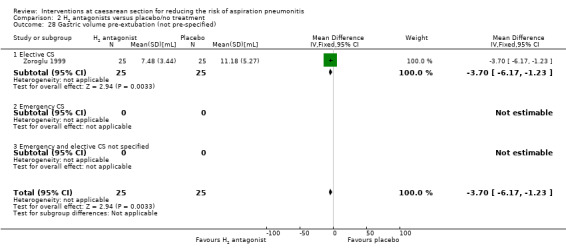
Comparison 2 H2 antagonists versus placebo/no treatment, Outcome 28 Gastric volume pre‐extubation (not pre‐specified).
Comparison 3. Proton pump antagonists versus placebo/no treatment.
| Outcome or subgroup title | No. of studies | No. of participants | Statistical method | Effect size |
|---|---|---|---|---|
| 1 Mortality due to aspiration pneumonitis | 0 | 0 | Risk Ratio (M‐H, Fixed, 95% CI) | 0.0 [0.0, 0.0] |
| 1.1 Elective CS | 0 | 0 | Risk Ratio (M‐H, Fixed, 95% CI) | 0.0 [0.0, 0.0] |
| 1.2 Emergency CS | 0 | 0 | Risk Ratio (M‐H, Fixed, 95% CI) | 0.0 [0.0, 0.0] |
| 1.3 Elective or emergency CS not specified | 0 | 0 | Risk Ratio (M‐H, Fixed, 95% CI) | 0.0 [0.0, 0.0] |
| 2 Morbidity due to aspiration pneumonitis | 0 | 0 | Risk Ratio (M‐H, Fixed, 95% CI) | 0.0 [0.0, 0.0] |
| 2.1 Elective CS | 0 | 0 | Risk Ratio (M‐H, Fixed, 95% CI) | 0.0 [0.0, 0.0] |
| 2.2 Emergency CS | 0 | 0 | Risk Ratio (M‐H, Fixed, 95% CI) | 0.0 [0.0, 0.0] |
| 2.3 Elective or emergency CS not specified | 0 | 0 | Risk Ratio (M‐H, Fixed, 95% CI) | 0.0 [0.0, 0.0] |
| 3 Intragastric pH < 2.5 at intubation | 1 | 80 | Risk Ratio (M‐H, Fixed, 95% CI) | 0.26 [0.14, 0.46] |
| 3.1 Elective CS | 1 | 80 | Risk Ratio (M‐H, Fixed, 95% CI) | 0.26 [0.14, 0.46] |
| 3.2 Emergency CS | 0 | 0 | Risk Ratio (M‐H, Fixed, 95% CI) | 0.0 [0.0, 0.0] |
| 3.3 Elective or emergency CS not specified | 0 | 0 | Risk Ratio (M‐H, Fixed, 95% CI) | 0.0 [0.0, 0.0] |
| 4 Intragastric volume > 0.4 mL/kg at intubation | 1 | 80 | Risk Ratio (M‐H, Fixed, 95% CI) | 0.46 [0.19, 1.09] |
| 4.1 Elective CS | 1 | 80 | Risk Ratio (M‐H, Fixed, 95% CI) | 0.46 [0.19, 1.09] |
| 4.2 Emergency CS | 0 | 0 | Risk Ratio (M‐H, Fixed, 95% CI) | 0.0 [0.0, 0.0] |
| 4.3 Elective or emergency CS not specified | 0 | 0 | Risk Ratio (M‐H, Fixed, 95% CI) | 0.0 [0.0, 0.0] |
| 5 Nausea | 0 | 0 | Risk Ratio (M‐H, Fixed, 95% CI) | 0.0 [0.0, 0.0] |
| 5.1 Elective CS | 0 | 0 | Risk Ratio (M‐H, Fixed, 95% CI) | 0.0 [0.0, 0.0] |
| 5.2 Emergency CS | 0 | 0 | Risk Ratio (M‐H, Fixed, 95% CI) | 0.0 [0.0, 0.0] |
| 5.3 Elective or emergency CS not specified | 0 | 0 | Risk Ratio (M‐H, Fixed, 95% CI) | 0.0 [0.0, 0.0] |
| 6 Vomiting | 0 | 0 | Risk Ratio (M‐H, Fixed, 95% CI) | 0.0 [0.0, 0.0] |
| 6.1 Elective CS | 0 | 0 | Risk Ratio (M‐H, Fixed, 95% CI) | 0.0 [0.0, 0.0] |
| 6.2 Emergency CS | 0 | 0 | Risk Ratio (M‐H, Fixed, 95% CI) | 0.0 [0.0, 0.0] |
| 6.3 Elective or emergency CS not specified | 0 | 0 | Risk Ratio (M‐H, Fixed, 95% CI) | 0.0 [0.0, 0.0] |
| 7 Sedation | 0 | 0 | Risk Ratio (M‐H, Fixed, 95% CI) | 0.0 [0.0, 0.0] |
| 7.1 Elective CS | 0 | 0 | Risk Ratio (M‐H, Fixed, 95% CI) | 0.0 [0.0, 0.0] |
| 7.2 Emergency CS | 0 | 0 | Risk Ratio (M‐H, Fixed, 95% CI) | 0.0 [0.0, 0.0] |
| 7.3 Elective or emergency CS not specified | 0 | 0 | Risk Ratio (M‐H, Fixed, 95% CI) | 0.0 [0.0, 0.0] |
| 8 Restlessness | 0 | 0 | Risk Ratio (M‐H, Fixed, 95% CI) | 0.0 [0.0, 0.0] |
| 8.1 Elective CS | 0 | 0 | Risk Ratio (M‐H, Fixed, 95% CI) | 0.0 [0.0, 0.0] |
| 8.2 Emergency CS | 0 | 0 | Risk Ratio (M‐H, Fixed, 95% CI) | 0.0 [0.0, 0.0] |
| 8.3 Elective or emergency CS not specified | 0 | 0 | Risk Ratio (M‐H, Fixed, 95% CI) | 0.0 [0.0, 0.0] |
| 9 Dystonic reactions | 0 | 0 | Risk Ratio (M‐H, Fixed, 95% CI) | 0.0 [0.0, 0.0] |
| 9.1 Elective CS | 0 | 0 | Risk Ratio (M‐H, Fixed, 95% CI) | 0.0 [0.0, 0.0] |
| 9.2 Emergency CS | 0 | 0 | Risk Ratio (M‐H, Fixed, 95% CI) | 0.0 [0.0, 0.0] |
| 9.3 Elective or emergency CS not specified | 0 | 0 | Risk Ratio (M‐H, Fixed, 95% CI) | 0.0 [0.0, 0.0] |
| 10 Extrapyramidal symptoms | 0 | 0 | Risk Ratio (M‐H, Fixed, 95% CI) | 0.0 [0.0, 0.0] |
| 10.1 Elective CS | 0 | 0 | Risk Ratio (M‐H, Fixed, 95% CI) | 0.0 [0.0, 0.0] |
| 10.2 Emergency CS | 0 | 0 | Risk Ratio (M‐H, Fixed, 95% CI) | 0.0 [0.0, 0.0] |
| 10.3 Elective or emergency CS not specified | 0 | 0 | Risk Ratio (M‐H, Fixed, 95% CI) | 0.0 [0.0, 0.0] |
| 11 Hypotension | 0 | 0 | Risk Ratio (M‐H, Fixed, 95% CI) | 0.0 [0.0, 0.0] |
| 11.1 Elective CS | 0 | 0 | Risk Ratio (M‐H, Fixed, 95% CI) | 0.0 [0.0, 0.0] |
| 11.2 Emergency CS | 0 | 0 | Risk Ratio (M‐H, Fixed, 95% CI) | 0.0 [0.0, 0.0] |
| 11.3 Elective or emergency CS not specified | 0 | 0 | Risk Ratio (M‐H, Fixed, 95% CI) | 0.0 [0.0, 0.0] |
| 12 Blood loss | 0 | 0 | Std. Mean Difference (IV, Fixed, 95% CI) | 0.0 [0.0, 0.0] |
| 12.1 Elective CS | 0 | 0 | Std. Mean Difference (IV, Fixed, 95% CI) | 0.0 [0.0, 0.0] |
| 12.2 Emergency CS | 0 | 0 | Std. Mean Difference (IV, Fixed, 95% CI) | 0.0 [0.0, 0.0] |
| 12.3 Elective or emergency CS not specified | 0 | 0 | Std. Mean Difference (IV, Fixed, 95% CI) | 0.0 [0.0, 0.0] |
| 13 Atonic uterus | 0 | 0 | Risk Ratio (M‐H, Fixed, 95% CI) | 0.0 [0.0, 0.0] |
| 13.1 Elective CS | 0 | 0 | Risk Ratio (M‐H, Fixed, 95% CI) | 0.0 [0.0, 0.0] |
| 13.2 Emergency CS | 0 | 0 | Risk Ratio (M‐H, Fixed, 95% CI) | 0.0 [0.0, 0.0] |
| 13.3 Elective or emergency CS not specified | 0 | 0 | Risk Ratio (M‐H, Fixed, 95% CI) | 0.0 [0.0, 0.0] |
| 14 Women's satisfaction | 0 | 0 | Std. Mean Difference (IV, Fixed, 95% CI) | 0.0 [0.0, 0.0] |
| 14.1 Elective CS | 0 | 0 | Std. Mean Difference (IV, Fixed, 95% CI) | 0.0 [0.0, 0.0] |
| 14.2 Emergency CS | 0 | 0 | Std. Mean Difference (IV, Fixed, 95% CI) | 0.0 [0.0, 0.0] |
| 14.3 Elective or emergency CS not specified | 0 | 0 | Std. Mean Difference (IV, Fixed, 95% CI) | 0.0 [0.0, 0.0] |
| 15 Cord blood pH | 0 | 0 | Mean Difference (IV, Fixed, 95% CI) | 0.0 [0.0, 0.0] |
| 15.1 Elective CS | 0 | 0 | Mean Difference (IV, Fixed, 95% CI) | 0.0 [0.0, 0.0] |
| 15.2 Emergency CS | 0 | 0 | Mean Difference (IV, Fixed, 95% CI) | 0.0 [0.0, 0.0] |
| 15.3 Elective or emergency CS not specified | 0 | 0 | Mean Difference (IV, Fixed, 95% CI) | 0.0 [0.0, 0.0] |
| 16 Apgar < 7 at 5 minutes | 0 | 0 | Risk Ratio (M‐H, Fixed, 95% CI) | 0.0 [0.0, 0.0] |
| 16.1 Elective CS | 0 | 0 | Risk Ratio (M‐H, Fixed, 95% CI) | 0.0 [0.0, 0.0] |
| 16.2 Emergency CS | 0 | 0 | Risk Ratio (M‐H, Fixed, 95% CI) | 0.0 [0.0, 0.0] |
| 16.3 Elective or emergency CS not specified | 0 | 0 | Risk Ratio (M‐H, Fixed, 95% CI) | 0.0 [0.0, 0.0] |
| 17 Neonatal assessment scores | 0 | 0 | Std. Mean Difference (IV, Fixed, 95% CI) | 0.0 [0.0, 0.0] |
| 17.1 Elective CS | 0 | 0 | Std. Mean Difference (IV, Fixed, 95% CI) | 0.0 [0.0, 0.0] |
| 17.2 Emergency CS | 0 | 0 | Std. Mean Difference (IV, Fixed, 95% CI) | 0.0 [0.0, 0.0] |
| 17.3 Elective or emergency CS not specified | 0 | 0 | Std. Mean Difference (IV, Fixed, 95% CI) | 0.0 [0.0, 0.0] |
| 18 Admission to NICU | 0 | 0 | Risk Ratio (M‐H, Fixed, 95% CI) | 0.0 [0.0, 0.0] |
| 18.1 Elective CS | 0 | 0 | Risk Ratio (M‐H, Fixed, 95% CI) | 0.0 [0.0, 0.0] |
| 18.2 Emergency CS | 0 | 0 | Risk Ratio (M‐H, Fixed, 95% CI) | 0.0 [0.0, 0.0] |
| 18.3 Elective or emergency CS not specified | 0 | 0 | Risk Ratio (M‐H, Fixed, 95% CI) | 0.0 [0.0, 0.0] |
| 19 Initiation of breastfeeding | 0 | 0 | Risk Ratio (M‐H, Fixed, 95% CI) | 0.0 [0.0, 0.0] |
| 19.1 Elective CS | 0 | 0 | Risk Ratio (M‐H, Fixed, 95% CI) | 0.0 [0.0, 0.0] |
| 19.2 Emergency CS | 0 | 0 | Risk Ratio (M‐H, Fixed, 95% CI) | 0.0 [0.0, 0.0] |
| 19.3 Elective or emergency CS not specified | 0 | 0 | Risk Ratio (M‐H, Fixed, 95% CI) | 0.0 [0.0, 0.0] |
| 20 Duration of breastfeeding | 0 | 0 | Std. Mean Difference (IV, Fixed, 95% CI) | 0.0 [0.0, 0.0] |
| 20.1 Elective CS | 0 | 0 | Std. Mean Difference (IV, Fixed, 95% CI) | 0.0 [0.0, 0.0] |
| 20.2 Emergency CS | 0 | 0 | Std. Mean Difference (IV, Fixed, 95% CI) | 0.0 [0.0, 0.0] |
| 20.3 Elective or emergency CS not specified | 0 | 0 | Std. Mean Difference (IV, Fixed, 95% CI) | 0.0 [0.0, 0.0] |
| 21 Intragastric pH > 2.5 at extubation | 0 | 0 | Risk Ratio (M‐H, Fixed, 95% CI) | 0.0 [0.0, 0.0] |
| 21.1 Elective CS | 0 | 0 | Risk Ratio (M‐H, Fixed, 95% CI) | 0.0 [0.0, 0.0] |
| 21.2 Emergency CS | 0 | 0 | Risk Ratio (M‐H, Fixed, 95% CI) | 0.0 [0.0, 0.0] |
| 21.3 Elective or emergency CS not specified | 0 | 0 | Risk Ratio (M‐H, Fixed, 95% CI) | 0.0 [0.0, 0.0] |
| 22 Intragastric volume < 0.4 mL/kg at extubation | 0 | 0 | Risk Ratio (M‐H, Fixed, 95% CI) | 0.0 [0.0, 0.0] |
| 22.1 Elective CS | 0 | 0 | Risk Ratio (M‐H, Fixed, 95% CI) | 0.0 [0.0, 0.0] |
| 22.2 Emergency CS | 0 | 0 | Risk Ratio (M‐H, Fixed, 95% CI) | 0.0 [0.0, 0.0] |
| 22.3 Elective or emergency CS not specified | 0 | 0 | Risk Ratio (M‐H, Fixed, 95% CI) | 0.0 [0.0, 0.0] |
| 23 Gastric pH at intubation (not pre‐specified) | 1 | 80 | Mean Difference (IV, Fixed, 95% CI) | 3.27 [2.82, 3.72] |
| 23.1 Elective CS | 1 | 80 | Mean Difference (IV, Fixed, 95% CI) | 3.27 [2.82, 3.72] |
| 23.2 Emergency CS | 0 | 0 | Mean Difference (IV, Fixed, 95% CI) | 0.0 [0.0, 0.0] |
| 23.3 Elective or emergency CS not specified | 0 | 0 | Mean Difference (IV, Fixed, 95% CI) | 0.0 [0.0, 0.0] |
| 24 At risk of aspiration (not pre‐specified) | 2 | 130 | Risk Ratio (M‐H, Random, 95% CI) | 0.14 [0.03, 0.74] |
| 24.1 Elective CS | 2 | 130 | Risk Ratio (M‐H, Random, 95% CI) | 0.14 [0.03, 0.74] |
| 24.2 Emergency CS | 0 | 0 | Risk Ratio (M‐H, Random, 95% CI) | 0.0 [0.0, 0.0] |
| 24.3 Elective or emergency CS not specified | 0 | 0 | Risk Ratio (M‐H, Random, 95% CI) | 0.0 [0.0, 0.0] |
| 25 Gastric volume at intubation (not pre‐specified) | 1 | 80 | Mean Difference (IV, Fixed, 95% CI) | ‐0.25 [‐0.30, ‐0.20] |
| 25.1 Elective CS | 1 | 80 | Mean Difference (IV, Fixed, 95% CI) | ‐0.25 [‐0.30, ‐0.20] |
| 25.2 Emergency CS | 0 | 0 | Mean Difference (IV, Fixed, 95% CI) | 0.0 [0.0, 0.0] |
| 25.3 Emergency and elective CS not specified | 0 | 0 | Mean Difference (IV, Fixed, 95% CI) | 0.0 [0.0, 0.0] |
| 26 Gastric pH pre extubation (not pre‐specified) | 0 | 0 | Mean Difference (IV, Fixed, 95% CI) | 0.0 [0.0, 0.0] |
| 26.1 Elective CS | 0 | 0 | Mean Difference (IV, Fixed, 95% CI) | 0.0 [0.0, 0.0] |
| 26.2 Emergency CS | 0 | 0 | Mean Difference (IV, Fixed, 95% CI) | 0.0 [0.0, 0.0] |
| 26.3 Emergency and elective CS not specified | 0 | 0 | Mean Difference (IV, Fixed, 95% CI) | 0.0 [0.0, 0.0] |
| 27 Gastric volume pre extubation (not pre‐specified) | 0 | 0 | Mean Difference (IV, Fixed, 95% CI) | 0.0 [0.0, 0.0] |
| 27.1 Elective CS | 0 | 0 | Mean Difference (IV, Fixed, 95% CI) | 0.0 [0.0, 0.0] |
| 27.2 Emergency CS | 0 | 0 | Mean Difference (IV, Fixed, 95% CI) | 0.0 [0.0, 0.0] |
| 27.3 Emergency and elective CS not specified | 0 | 0 | Mean Difference (IV, Fixed, 95% CI) | 0.0 [0.0, 0.0] |
3.23. Analysis.
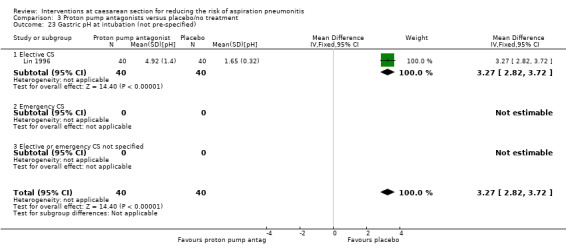
Comparison 3 Proton pump antagonists versus placebo/no treatment, Outcome 23 Gastric pH at intubation (not pre‐specified).
3.25. Analysis.
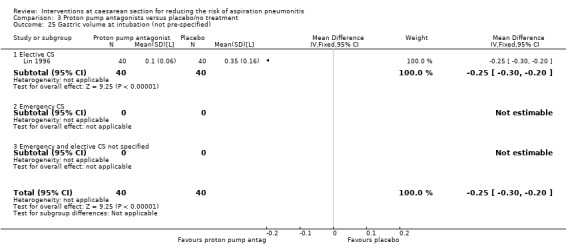
Comparison 3 Proton pump antagonists versus placebo/no treatment, Outcome 25 Gastric volume at intubation (not pre‐specified).
Comparison 4. Prokinetic drugs versus placebo/no treatment.
| Outcome or subgroup title | No. of studies | No. of participants | Statistical method | Effect size |
|---|---|---|---|---|
| 1 Mortality due to aspiration pneumonitis | 0 | 0 | Risk Ratio (M‐H, Fixed, 95% CI) | 0.0 [0.0, 0.0] |
| 1.1 Elective CS | 0 | 0 | Risk Ratio (M‐H, Fixed, 95% CI) | 0.0 [0.0, 0.0] |
| 1.2 Emergency CS | 0 | 0 | Risk Ratio (M‐H, Fixed, 95% CI) | 0.0 [0.0, 0.0] |
| 1.3 Elective or emergency CS not specified | 0 | 0 | Risk Ratio (M‐H, Fixed, 95% CI) | 0.0 [0.0, 0.0] |
| 2 Morbidity due to aspiration pneumonitis | 0 | 0 | Risk Ratio (M‐H, Fixed, 95% CI) | 0.0 [0.0, 0.0] |
| 2.1 Elective CS | 0 | 0 | Risk Ratio (M‐H, Fixed, 95% CI) | 0.0 [0.0, 0.0] |
| 2.2 Emergency CS | 0 | 0 | Risk Ratio (M‐H, Fixed, 95% CI) | 0.0 [0.0, 0.0] |
| 2.3 Elective or emergency CS not specified | 0 | 0 | Risk Ratio (M‐H, Fixed, 95% CI) | 0.0 [0.0, 0.0] |
| 3 Intragastric pH > 2.5 at intubation | 0 | 0 | Risk Ratio (M‐H, Fixed, 95% CI) | 0.0 [0.0, 0.0] |
| 3.1 Elective CS | 0 | 0 | Risk Ratio (M‐H, Fixed, 95% CI) | 0.0 [0.0, 0.0] |
| 3.2 Emergency CS | 0 | 0 | Risk Ratio (M‐H, Fixed, 95% CI) | 0.0 [0.0, 0.0] |
| 3.3 Elective or emergency CS not specified | 0 | 0 | Risk Ratio (M‐H, Fixed, 95% CI) | 0.0 [0.0, 0.0] |
| 4 Intragastric volume < 0.4 mL/kg at intubation | 0 | 0 | Risk Ratio (M‐H, Fixed, 95% CI) | 0.0 [0.0, 0.0] |
| 4.1 Elective CS | 0 | 0 | Risk Ratio (M‐H, Fixed, 95% CI) | 0.0 [0.0, 0.0] |
| 4.2 Emergency CS | 0 | 0 | Risk Ratio (M‐H, Fixed, 95% CI) | 0.0 [0.0, 0.0] |
| 4.3 Elective or emergency CS not specified | 0 | 0 | Risk Ratio (M‐H, Fixed, 95% CI) | 0.0 [0.0, 0.0] |
| 5 Nausea | 0 | 0 | Risk Ratio (M‐H, Fixed, 95% CI) | 0.0 [0.0, 0.0] |
| 5.1 Elective CS | 0 | 0 | Risk Ratio (M‐H, Fixed, 95% CI) | 0.0 [0.0, 0.0] |
| 5.2 Emergency CS | 0 | 0 | Risk Ratio (M‐H, Fixed, 95% CI) | 0.0 [0.0, 0.0] |
| 5.3 Elective or emergency CS not specified | 0 | 0 | Risk Ratio (M‐H, Fixed, 95% CI) | 0.0 [0.0, 0.0] |
| 6 Vomiting | 0 | 0 | Risk Ratio (M‐H, Fixed, 95% CI) | 0.0 [0.0, 0.0] |
| 6.1 Elective CS | 0 | 0 | Risk Ratio (M‐H, Fixed, 95% CI) | 0.0 [0.0, 0.0] |
| 6.2 Emergency CS | 0 | 0 | Risk Ratio (M‐H, Fixed, 95% CI) | 0.0 [0.0, 0.0] |
| 6.3 Elective or emergency CS not specified | 0 | 0 | Risk Ratio (M‐H, Fixed, 95% CI) | 0.0 [0.0, 0.0] |
| 7 Sedation | 0 | 0 | Risk Ratio (M‐H, Fixed, 95% CI) | 0.0 [0.0, 0.0] |
| 7.1 Elective CS | 0 | 0 | Risk Ratio (M‐H, Fixed, 95% CI) | 0.0 [0.0, 0.0] |
| 7.2 Emergency CS | 0 | 0 | Risk Ratio (M‐H, Fixed, 95% CI) | 0.0 [0.0, 0.0] |
| 7.3 Elective or emergency CS not specified | 0 | 0 | Risk Ratio (M‐H, Fixed, 95% CI) | 0.0 [0.0, 0.0] |
| 8 Restlessness | 0 | 0 | Risk Ratio (M‐H, Fixed, 95% CI) | 0.0 [0.0, 0.0] |
| 8.1 Elective CS | 0 | 0 | Risk Ratio (M‐H, Fixed, 95% CI) | 0.0 [0.0, 0.0] |
| 8.2 Emergency CS | 0 | 0 | Risk Ratio (M‐H, Fixed, 95% CI) | 0.0 [0.0, 0.0] |
| 8.3 Elective or emergency CS not specified | 0 | 0 | Risk Ratio (M‐H, Fixed, 95% CI) | 0.0 [0.0, 0.0] |
| 9 Dystonic reactions | 0 | 0 | Risk Ratio (M‐H, Fixed, 95% CI) | 0.0 [0.0, 0.0] |
| 9.1 Elective CS | 0 | 0 | Risk Ratio (M‐H, Fixed, 95% CI) | 0.0 [0.0, 0.0] |
| 9.2 Emergency CS | 0 | 0 | Risk Ratio (M‐H, Fixed, 95% CI) | 0.0 [0.0, 0.0] |
| 9.3 Elective or emergency CS not specified | 0 | 0 | Risk Ratio (M‐H, Fixed, 95% CI) | 0.0 [0.0, 0.0] |
| 10 Extrapyramidal symptoms | 0 | 0 | Risk Ratio (M‐H, Fixed, 95% CI) | 0.0 [0.0, 0.0] |
| 10.1 Elective CS | 0 | 0 | Risk Ratio (M‐H, Fixed, 95% CI) | 0.0 [0.0, 0.0] |
| 10.2 Emergency CS | 0 | 0 | Risk Ratio (M‐H, Fixed, 95% CI) | 0.0 [0.0, 0.0] |
| 10.3 Elective or emergency CS not specified | 0 | 0 | Risk Ratio (M‐H, Fixed, 95% CI) | 0.0 [0.0, 0.0] |
| 11 Hypotension | 0 | 0 | Risk Ratio (M‐H, Fixed, 95% CI) | 0.0 [0.0, 0.0] |
| 11.1 Elective CS | 0 | 0 | Risk Ratio (M‐H, Fixed, 95% CI) | 0.0 [0.0, 0.0] |
| 11.2 Emergency CS | 0 | 0 | Risk Ratio (M‐H, Fixed, 95% CI) | 0.0 [0.0, 0.0] |
| 11.3 Elective or emergency CS not specified | 0 | 0 | Risk Ratio (M‐H, Fixed, 95% CI) | 0.0 [0.0, 0.0] |
| 12 Blood loss | 0 | 0 | Std. Mean Difference (IV, Fixed, 95% CI) | 0.0 [0.0, 0.0] |
| 12.1 Elective CS | 0 | 0 | Std. Mean Difference (IV, Fixed, 95% CI) | 0.0 [0.0, 0.0] |
| 12.2 Emergency CS | 0 | 0 | Std. Mean Difference (IV, Fixed, 95% CI) | 0.0 [0.0, 0.0] |
| 12.3 Elective or emergency CS not specified | 0 | 0 | Std. Mean Difference (IV, Fixed, 95% CI) | 0.0 [0.0, 0.0] |
| 13 Atonic uterus | 0 | 0 | Risk Ratio (M‐H, Fixed, 95% CI) | 0.0 [0.0, 0.0] |
| 13.1 Elective CS | 0 | 0 | Risk Ratio (M‐H, Fixed, 95% CI) | 0.0 [0.0, 0.0] |
| 13.2 Emergency CS | 0 | 0 | Risk Ratio (M‐H, Fixed, 95% CI) | 0.0 [0.0, 0.0] |
| 13.3 Elective or emergency CS not specified | 0 | 0 | Risk Ratio (M‐H, Fixed, 95% CI) | 0.0 [0.0, 0.0] |
| 14 Women's satisfaction | 0 | 0 | Std. Mean Difference (IV, Fixed, 95% CI) | 0.0 [0.0, 0.0] |
| 14.1 Elective CS | 0 | 0 | Std. Mean Difference (IV, Fixed, 95% CI) | 0.0 [0.0, 0.0] |
| 14.2 Emergency CS | 0 | 0 | Std. Mean Difference (IV, Fixed, 95% CI) | 0.0 [0.0, 0.0] |
| 14.3 Elective or emergency CS not specified | 0 | 0 | Std. Mean Difference (IV, Fixed, 95% CI) | 0.0 [0.0, 0.0] |
| 15 Cord blood pH | 0 | 0 | Mean Difference (IV, Fixed, 95% CI) | 0.0 [0.0, 0.0] |
| 15.1 Elective CS | 0 | 0 | Mean Difference (IV, Fixed, 95% CI) | 0.0 [0.0, 0.0] |
| 15.2 Emergency CS | 0 | 0 | Mean Difference (IV, Fixed, 95% CI) | 0.0 [0.0, 0.0] |
| 15.3 Elective or emergency CS not specified | 0 | 0 | Mean Difference (IV, Fixed, 95% CI) | 0.0 [0.0, 0.0] |
| 16 Apgar < 7 at 5 minutes | 0 | 0 | Risk Ratio (M‐H, Fixed, 95% CI) | 0.0 [0.0, 0.0] |
| 16.1 Elective CS | 0 | 0 | Risk Ratio (M‐H, Fixed, 95% CI) | 0.0 [0.0, 0.0] |
| 16.2 Emergency CS | 0 | 0 | Risk Ratio (M‐H, Fixed, 95% CI) | 0.0 [0.0, 0.0] |
| 16.3 Elective or emergency CS not specified | 0 | 0 | Risk Ratio (M‐H, Fixed, 95% CI) | 0.0 [0.0, 0.0] |
| 17 Neonatal assessment scores | 0 | 0 | Std. Mean Difference (IV, Fixed, 95% CI) | 0.0 [0.0, 0.0] |
| 17.1 Elective CS | 0 | 0 | Std. Mean Difference (IV, Fixed, 95% CI) | 0.0 [0.0, 0.0] |
| 17.2 Emergency CS | 0 | 0 | Std. Mean Difference (IV, Fixed, 95% CI) | 0.0 [0.0, 0.0] |
| 17.3 Elective or emergency CS not specified | 0 | 0 | Std. Mean Difference (IV, Fixed, 95% CI) | 0.0 [0.0, 0.0] |
| 18 Admission to NICU | 0 | 0 | Risk Ratio (M‐H, Fixed, 95% CI) | 0.0 [0.0, 0.0] |
| 18.1 Elective CS | 0 | 0 | Risk Ratio (M‐H, Fixed, 95% CI) | 0.0 [0.0, 0.0] |
| 18.2 Emergency CS | 0 | 0 | Risk Ratio (M‐H, Fixed, 95% CI) | 0.0 [0.0, 0.0] |
| 18.3 Elective or emergency CS not specified | 0 | 0 | Risk Ratio (M‐H, Fixed, 95% CI) | 0.0 [0.0, 0.0] |
| 19 Initiation of breastfeeding | 0 | 0 | Risk Ratio (M‐H, Fixed, 95% CI) | 0.0 [0.0, 0.0] |
| 19.1 Elective CS | 0 | 0 | Risk Ratio (M‐H, Fixed, 95% CI) | 0.0 [0.0, 0.0] |
| 19.2 Emergency CS | 0 | 0 | Risk Ratio (M‐H, Fixed, 95% CI) | 0.0 [0.0, 0.0] |
| 19.3 Elective or emergency CS not specified | 0 | 0 | Risk Ratio (M‐H, Fixed, 95% CI) | 0.0 [0.0, 0.0] |
| 20 Duration of breastfeeding | 0 | 0 | Std. Mean Difference (IV, Fixed, 95% CI) | 0.0 [0.0, 0.0] |
| 20.1 Elective CS | 0 | 0 | Std. Mean Difference (IV, Fixed, 95% CI) | 0.0 [0.0, 0.0] |
| 20.2 Emergency CS | 0 | 0 | Std. Mean Difference (IV, Fixed, 95% CI) | 0.0 [0.0, 0.0] |
| 20.3 Elective or emergency CS not specified | 0 | 0 | Std. Mean Difference (IV, Fixed, 95% CI) | 0.0 [0.0, 0.0] |
| 21 Intragastric pH > 2.5 at extubation | 0 | 0 | Risk Ratio (M‐H, Fixed, 95% CI) | 0.0 [0.0, 0.0] |
| 21.1 Elective CS | 0 | 0 | Risk Ratio (M‐H, Fixed, 95% CI) | 0.0 [0.0, 0.0] |
| 21.2 Emergency CS | 0 | 0 | Risk Ratio (M‐H, Fixed, 95% CI) | 0.0 [0.0, 0.0] |
| 21.3 Elective or emergency CS not specified | 0 | 0 | Risk Ratio (M‐H, Fixed, 95% CI) | 0.0 [0.0, 0.0] |
| 22 Intragastric volume < 0.4 mL/kg at extubation | 0 | 0 | Risk Ratio (M‐H, Fixed, 95% CI) | 0.0 [0.0, 0.0] |
| 22.1 Elective CS | 0 | 0 | Risk Ratio (M‐H, Fixed, 95% CI) | 0.0 [0.0, 0.0] |
| 22.2 Emergency CS | 0 | 0 | Risk Ratio (M‐H, Fixed, 95% CI) | 0.0 [0.0, 0.0] |
| 22.3 Elective or emergency CS not specified | 0 | 0 | Risk Ratio (M‐H, Fixed, 95% CI) | 0.0 [0.0, 0.0] |
| 23 At risk of aspiration post intubation (not pre‐specified) | 1 | 50 | Risk Ratio (M‐H, Fixed, 95% CI) | 0.67 [0.33, 1.35] |
| 23.1 Elective CS | 1 | 50 | Risk Ratio (M‐H, Fixed, 95% CI) | 0.67 [0.33, 1.35] |
| 23.2 Emergency CS | 0 | 0 | Risk Ratio (M‐H, Fixed, 95% CI) | 0.0 [0.0, 0.0] |
| 23.3 Elective or emergency not specified | 0 | 0 | Risk Ratio (M‐H, Fixed, 95% CI) | 0.0 [0.0, 0.0] |
| 24 At risk of aspiration pre‐extubation (not pre‐specified) | 1 | 50 | Risk Ratio (M‐H, Fixed, 95% CI) | 0.0 [0.0, 0.0] |
| 24.1 Elective CS | 1 | 50 | Risk Ratio (M‐H, Fixed, 95% CI) | 0.0 [0.0, 0.0] |
| 24.2 Emergency CS | 0 | 0 | Risk Ratio (M‐H, Fixed, 95% CI) | 0.0 [0.0, 0.0] |
| 24.3 Elective or emergency nor specified | 0 | 0 | Risk Ratio (M‐H, Fixed, 95% CI) | 0.0 [0.0, 0.0] |
4.24. Analysis.
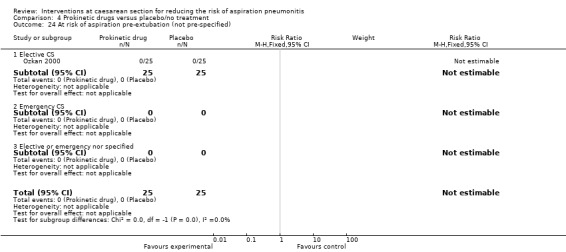
Comparison 4 Prokinetic drugs versus placebo/no treatment, Outcome 24 At risk of aspiration pre‐extubation (not pre‐specified).
Comparison 5. Non‐pharmacological interventions versus placebo/no treatment.
| Outcome or subgroup title | No. of studies | No. of participants | Statistical method | Effect size |
|---|---|---|---|---|
| 1 Mortality due to aspiration pneumonitis | 0 | 0 | Risk Ratio (M‐H, Fixed, 95% CI) | 0.0 [0.0, 0.0] |
| 1.1 Elective CS | 0 | 0 | Risk Ratio (M‐H, Fixed, 95% CI) | 0.0 [0.0, 0.0] |
| 1.2 Emergency CS | 0 | 0 | Risk Ratio (M‐H, Fixed, 95% CI) | 0.0 [0.0, 0.0] |
| 1.3 Elective or emergency CS not specified | 0 | 0 | Risk Ratio (M‐H, Fixed, 95% CI) | 0.0 [0.0, 0.0] |
| 2 Morbidity due to aspiration pneumonitis | 0 | 0 | Risk Ratio (M‐H, Fixed, 95% CI) | 0.0 [0.0, 0.0] |
| 2.1 Elective CS | 0 | 0 | Risk Ratio (M‐H, Fixed, 95% CI) | 0.0 [0.0, 0.0] |
| 2.2 Emergency CS | 0 | 0 | Risk Ratio (M‐H, Fixed, 95% CI) | 0.0 [0.0, 0.0] |
| 2.3 Elective or emergency CS not specified | 0 | 0 | Risk Ratio (M‐H, Fixed, 95% CI) | 0.0 [0.0, 0.0] |
| 3 Intragastric pH < 2.5 at intubation | 0 | 0 | Risk Ratio (M‐H, Fixed, 95% CI) | 0.0 [0.0, 0.0] |
| 3.1 Elective CS | 0 | 0 | Risk Ratio (M‐H, Fixed, 95% CI) | 0.0 [0.0, 0.0] |
| 3.2 Emergency CS | 0 | 0 | Risk Ratio (M‐H, Fixed, 95% CI) | 0.0 [0.0, 0.0] |
| 3.3 Elective or emergency CS not specified | 0 | 0 | Risk Ratio (M‐H, Fixed, 95% CI) | 0.0 [0.0, 0.0] |
| 4 Intragastric volume < 0.4 mL/kg at intubation | 0 | 0 | Risk Ratio (M‐H, Fixed, 95% CI) | 0.0 [0.0, 0.0] |
| 4.1 Elective CS | 0 | 0 | Risk Ratio (M‐H, Fixed, 95% CI) | 0.0 [0.0, 0.0] |
| 4.2 Emergency CS | 0 | 0 | Risk Ratio (M‐H, Fixed, 95% CI) | 0.0 [0.0, 0.0] |
| 4.3 Elective or emergency CS not specified | 0 | 0 | Risk Ratio (M‐H, Fixed, 95% CI) | 0.0 [0.0, 0.0] |
| 5 Nausea | 0 | 0 | Risk Ratio (M‐H, Fixed, 95% CI) | 0.0 [0.0, 0.0] |
| 5.1 Elective CS | 0 | 0 | Risk Ratio (M‐H, Fixed, 95% CI) | 0.0 [0.0, 0.0] |
| 5.2 Emergency CS | 0 | 0 | Risk Ratio (M‐H, Fixed, 95% CI) | 0.0 [0.0, 0.0] |
| 5.3 Elective or emergency CS not specified | 0 | 0 | Risk Ratio (M‐H, Fixed, 95% CI) | 0.0 [0.0, 0.0] |
| 6 Vomiting | 0 | 0 | Risk Ratio (M‐H, Fixed, 95% CI) | 0.0 [0.0, 0.0] |
| 6.1 Elective CS | 0 | 0 | Risk Ratio (M‐H, Fixed, 95% CI) | 0.0 [0.0, 0.0] |
| 6.2 Emergency CS | 0 | 0 | Risk Ratio (M‐H, Fixed, 95% CI) | 0.0 [0.0, 0.0] |
| 6.3 Elective or emergency CS not specified | 0 | 0 | Risk Ratio (M‐H, Fixed, 95% CI) | 0.0 [0.0, 0.0] |
| 7 Sedation | 0 | 0 | Risk Ratio (M‐H, Fixed, 95% CI) | 0.0 [0.0, 0.0] |
| 7.1 Elective CS | 0 | 0 | Risk Ratio (M‐H, Fixed, 95% CI) | 0.0 [0.0, 0.0] |
| 7.2 Emergency CS | 0 | 0 | Risk Ratio (M‐H, Fixed, 95% CI) | 0.0 [0.0, 0.0] |
| 7.3 Elective or emergency CS not specified | 0 | 0 | Risk Ratio (M‐H, Fixed, 95% CI) | 0.0 [0.0, 0.0] |
| 8 Restlessness | 0 | 0 | Risk Ratio (M‐H, Fixed, 95% CI) | 0.0 [0.0, 0.0] |
| 8.1 Elective CS | 0 | 0 | Risk Ratio (M‐H, Fixed, 95% CI) | 0.0 [0.0, 0.0] |
| 8.2 Emergency CS | 0 | 0 | Risk Ratio (M‐H, Fixed, 95% CI) | 0.0 [0.0, 0.0] |
| 8.3 Elective or emergency CS not specified | 0 | 0 | Risk Ratio (M‐H, Fixed, 95% CI) | 0.0 [0.0, 0.0] |
| 9 Dystonic reactions | 0 | 0 | Risk Ratio (M‐H, Fixed, 95% CI) | 0.0 [0.0, 0.0] |
| 9.1 Elective CS | 0 | 0 | Risk Ratio (M‐H, Fixed, 95% CI) | 0.0 [0.0, 0.0] |
| 9.2 Emergency CS | 0 | 0 | Risk Ratio (M‐H, Fixed, 95% CI) | 0.0 [0.0, 0.0] |
| 9.3 Elective or emergency CS not specified | 0 | 0 | Risk Ratio (M‐H, Fixed, 95% CI) | 0.0 [0.0, 0.0] |
| 10 Extrapyramidal symptoms | 0 | 0 | Risk Ratio (M‐H, Fixed, 95% CI) | 0.0 [0.0, 0.0] |
| 10.1 Elective CS | 0 | 0 | Risk Ratio (M‐H, Fixed, 95% CI) | 0.0 [0.0, 0.0] |
| 10.2 Emergency CS | 0 | 0 | Risk Ratio (M‐H, Fixed, 95% CI) | 0.0 [0.0, 0.0] |
| 10.3 Elective or emergency CS not specified | 0 | 0 | Risk Ratio (M‐H, Fixed, 95% CI) | 0.0 [0.0, 0.0] |
| 11 Hypotension | 0 | 0 | Risk Ratio (M‐H, Fixed, 95% CI) | 0.0 [0.0, 0.0] |
| 11.1 Elective CS | 0 | 0 | Risk Ratio (M‐H, Fixed, 95% CI) | 0.0 [0.0, 0.0] |
| 11.2 Emergency CS | 0 | 0 | Risk Ratio (M‐H, Fixed, 95% CI) | 0.0 [0.0, 0.0] |
| 11.3 Elective or emergency CS not specified | 0 | 0 | Risk Ratio (M‐H, Fixed, 95% CI) | 0.0 [0.0, 0.0] |
| 12 Blood loss | 0 | 0 | Std. Mean Difference (IV, Fixed, 95% CI) | 0.0 [0.0, 0.0] |
| 12.1 Elective CS | 0 | 0 | Std. Mean Difference (IV, Fixed, 95% CI) | 0.0 [0.0, 0.0] |
| 12.2 Emergency CS | 0 | 0 | Std. Mean Difference (IV, Fixed, 95% CI) | 0.0 [0.0, 0.0] |
| 12.3 Elective or emergency CS not specified | 0 | 0 | Std. Mean Difference (IV, Fixed, 95% CI) | 0.0 [0.0, 0.0] |
| 13 Atonic uterus | 0 | 0 | Risk Ratio (M‐H, Fixed, 95% CI) | 0.0 [0.0, 0.0] |
| 13.1 Elective CS | 0 | 0 | Risk Ratio (M‐H, Fixed, 95% CI) | 0.0 [0.0, 0.0] |
| 13.2 Emergency CS | 0 | 0 | Risk Ratio (M‐H, Fixed, 95% CI) | 0.0 [0.0, 0.0] |
| 13.3 Elective or emergency CS not specified | 0 | 0 | Risk Ratio (M‐H, Fixed, 95% CI) | 0.0 [0.0, 0.0] |
| 14 Women's satisfaction | 0 | 0 | Std. Mean Difference (IV, Fixed, 95% CI) | 0.0 [0.0, 0.0] |
| 14.1 Elective CS | 0 | 0 | Std. Mean Difference (IV, Fixed, 95% CI) | 0.0 [0.0, 0.0] |
| 14.2 Emergency CS | 0 | 0 | Std. Mean Difference (IV, Fixed, 95% CI) | 0.0 [0.0, 0.0] |
| 14.3 Elective or emergency CS not specified | 0 | 0 | Std. Mean Difference (IV, Fixed, 95% CI) | 0.0 [0.0, 0.0] |
| 15 Cord blood pH | 0 | 0 | Mean Difference (IV, Fixed, 95% CI) | 0.0 [0.0, 0.0] |
| 15.1 Elective CS | 0 | 0 | Mean Difference (IV, Fixed, 95% CI) | 0.0 [0.0, 0.0] |
| 15.2 Emergency CS | 0 | 0 | Mean Difference (IV, Fixed, 95% CI) | 0.0 [0.0, 0.0] |
| 15.3 Elective or emergency CS not specified | 0 | 0 | Mean Difference (IV, Fixed, 95% CI) | 0.0 [0.0, 0.0] |
| 16 Apgar < 7 at 5 minutes | 0 | 0 | Risk Ratio (M‐H, Fixed, 95% CI) | 0.0 [0.0, 0.0] |
| 16.1 Elective CS | 0 | 0 | Risk Ratio (M‐H, Fixed, 95% CI) | 0.0 [0.0, 0.0] |
| 16.2 Emergency CS | 0 | 0 | Risk Ratio (M‐H, Fixed, 95% CI) | 0.0 [0.0, 0.0] |
| 16.3 Elective or emergency CS not specified | 0 | 0 | Risk Ratio (M‐H, Fixed, 95% CI) | 0.0 [0.0, 0.0] |
| 17 Neonatal assessment scores | 0 | 0 | Std. Mean Difference (IV, Fixed, 95% CI) | 0.0 [0.0, 0.0] |
| 17.1 Elective CS | 0 | 0 | Std. Mean Difference (IV, Fixed, 95% CI) | 0.0 [0.0, 0.0] |
| 17.2 Emergency CS | 0 | 0 | Std. Mean Difference (IV, Fixed, 95% CI) | 0.0 [0.0, 0.0] |
| 17.3 Elective or emergency CS not specified | 0 | 0 | Std. Mean Difference (IV, Fixed, 95% CI) | 0.0 [0.0, 0.0] |
| 18 Admission to NICU | 0 | 0 | Risk Ratio (M‐H, Fixed, 95% CI) | 0.0 [0.0, 0.0] |
| 18.1 Elective CS | 0 | 0 | Risk Ratio (M‐H, Fixed, 95% CI) | 0.0 [0.0, 0.0] |
| 18.2 Emergency CS | 0 | 0 | Risk Ratio (M‐H, Fixed, 95% CI) | 0.0 [0.0, 0.0] |
| 18.3 Elective or emergency CS not specified | 0 | 0 | Risk Ratio (M‐H, Fixed, 95% CI) | 0.0 [0.0, 0.0] |
| 19 Initiation of breastfeeding | 0 | 0 | Risk Ratio (M‐H, Fixed, 95% CI) | 0.0 [0.0, 0.0] |
| 19.1 Elective CS | 0 | 0 | Risk Ratio (M‐H, Fixed, 95% CI) | 0.0 [0.0, 0.0] |
| 19.2 Emergency CS | 0 | 0 | Risk Ratio (M‐H, Fixed, 95% CI) | 0.0 [0.0, 0.0] |
| 19.3 Elective or emergency CS not specified | 0 | 0 | Risk Ratio (M‐H, Fixed, 95% CI) | 0.0 [0.0, 0.0] |
| 20 Duration of breastfeeding | 0 | 0 | Std. Mean Difference (IV, Fixed, 95% CI) | 0.0 [0.0, 0.0] |
| 20.1 Elective CS | 0 | 0 | Std. Mean Difference (IV, Fixed, 95% CI) | 0.0 [0.0, 0.0] |
| 20.2 Emergency CS | 0 | 0 | Std. Mean Difference (IV, Fixed, 95% CI) | 0.0 [0.0, 0.0] |
| 20.3 Elective or emergency CS not specified | 0 | 0 | Std. Mean Difference (IV, Fixed, 95% CI) | 0.0 [0.0, 0.0] |
| 21 Intragastric pH < 2.5 at extubation | 0 | 0 | Risk Ratio (M‐H, Fixed, 95% CI) | 0.0 [0.0, 0.0] |
| 21.1 Elective CS | 0 | 0 | Risk Ratio (M‐H, Fixed, 95% CI) | 0.0 [0.0, 0.0] |
| 21.2 Emergency CS | 0 | 0 | Risk Ratio (M‐H, Fixed, 95% CI) | 0.0 [0.0, 0.0] |
| 21.3 Elective or emergency CS not specified | 0 | 0 | Risk Ratio (M‐H, Fixed, 95% CI) | 0.0 [0.0, 0.0] |
| 22 Intragastric volume < 0.4 mL/kg at extubation | 0 | 0 | Risk Ratio (M‐H, Fixed, 95% CI) | 0.0 [0.0, 0.0] |
| 22.1 Elective CS | 0 | 0 | Risk Ratio (M‐H, Fixed, 95% CI) | 0.0 [0.0, 0.0] |
| 22.2 Emergency CS | 0 | 0 | Risk Ratio (M‐H, Fixed, 95% CI) | 0.0 [0.0, 0.0] |
| 22.3 Elective or emergency CS not specified | 0 | 0 | Risk Ratio (M‐H, Fixed, 95% CI) | 0.0 [0.0, 0.0] |
| 23 At risk of aspiration (not pre‐specified) | 1 | 40 | Risk Ratio (M‐H, Fixed, 95% CI) | 0.5 [0.18, 1.40] |
| 23.1 Elective CS | 1 | 40 | Risk Ratio (M‐H, Fixed, 95% CI) | 0.5 [0.18, 1.40] |
| 23.2 Emergency CS | 0 | 0 | Risk Ratio (M‐H, Fixed, 95% CI) | 0.0 [0.0, 0.0] |
| 23.3 Elective or emergency CS not specified | 0 | 0 | Risk Ratio (M‐H, Fixed, 95% CI) | 0.0 [0.0, 0.0] |
Comparison 6. Antacids + H2 antagonists versus placebo/no treatment.
| Outcome or subgroup title | No. of studies | No. of participants | Statistical method | Effect size |
|---|---|---|---|---|
| 1 Mortality due to aspiration pneumonitis | 0 | 0 | Risk Ratio (M‐H, Fixed, 95% CI) | 0.0 [0.0, 0.0] |
| 1.1 Elective CS | 0 | 0 | Risk Ratio (M‐H, Fixed, 95% CI) | 0.0 [0.0, 0.0] |
| 1.2 Emergency CS | 0 | 0 | Risk Ratio (M‐H, Fixed, 95% CI) | 0.0 [0.0, 0.0] |
| 1.3 Elective or emergency CS not specified | 0 | 0 | Risk Ratio (M‐H, Fixed, 95% CI) | 0.0 [0.0, 0.0] |
| 2 Morbidity due to aspiration pneumonitis | 0 | 0 | Risk Ratio (M‐H, Fixed, 95% CI) | 0.0 [0.0, 0.0] |
| 2.1 Elective CS | 0 | 0 | Risk Ratio (M‐H, Fixed, 95% CI) | 0.0 [0.0, 0.0] |
| 2.2 Emergency CS | 0 | 0 | Risk Ratio (M‐H, Fixed, 95% CI) | 0.0 [0.0, 0.0] |
| 2.3 Elective or emergency CS not specified | 0 | 0 | Risk Ratio (M‐H, Fixed, 95% CI) | 0.0 [0.0, 0.0] |
| 3 Intragastric pH < 2.5 at intubation | 1 | 89 | Risk Ratio (M‐H, Fixed, 95% CI) | 0.02 [0.00, 0.15] |
| 3.1 Elective CS | 0 | 0 | Risk Ratio (M‐H, Fixed, 95% CI) | 0.0 [0.0, 0.0] |
| 3.2 Emergency CS | 0 | 0 | Risk Ratio (M‐H, Fixed, 95% CI) | 0.0 [0.0, 0.0] |
| 3.3 Elective or emergency CS not specified | 1 | 89 | Risk Ratio (M‐H, Fixed, 95% CI) | 0.02 [0.00, 0.15] |
| 4 Intragastric volume < 0.4 mL/kg at intubation | 0 | 0 | Risk Ratio (M‐H, Fixed, 95% CI) | 0.0 [0.0, 0.0] |
| 4.1 Elective CS | 0 | 0 | Risk Ratio (M‐H, Fixed, 95% CI) | 0.0 [0.0, 0.0] |
| 4.2 Emergency CS | 0 | 0 | Risk Ratio (M‐H, Fixed, 95% CI) | 0.0 [0.0, 0.0] |
| 4.3 Elective or emergency CS not specified | 0 | 0 | Risk Ratio (M‐H, Fixed, 95% CI) | 0.0 [0.0, 0.0] |
| 5 Nausea | 0 | 0 | Risk Ratio (M‐H, Fixed, 95% CI) | 0.0 [0.0, 0.0] |
| 5.1 Elective CS | 0 | 0 | Risk Ratio (M‐H, Fixed, 95% CI) | 0.0 [0.0, 0.0] |
| 5.2 Emergency CS | 0 | 0 | Risk Ratio (M‐H, Fixed, 95% CI) | 0.0 [0.0, 0.0] |
| 5.3 Elective or emergency CS not specified | 0 | 0 | Risk Ratio (M‐H, Fixed, 95% CI) | 0.0 [0.0, 0.0] |
| 6 Vomiting | 0 | 0 | Risk Ratio (M‐H, Fixed, 95% CI) | 0.0 [0.0, 0.0] |
| 6.1 Elective CS | 0 | 0 | Risk Ratio (M‐H, Fixed, 95% CI) | 0.0 [0.0, 0.0] |
| 6.2 Emergency CS | 0 | 0 | Risk Ratio (M‐H, Fixed, 95% CI) | 0.0 [0.0, 0.0] |
| 6.3 Elective or emergency CS not specified | 0 | 0 | Risk Ratio (M‐H, Fixed, 95% CI) | 0.0 [0.0, 0.0] |
| 7 Sedation | 0 | 0 | Risk Ratio (M‐H, Fixed, 95% CI) | 0.0 [0.0, 0.0] |
| 7.1 Elective CS | 0 | 0 | Risk Ratio (M‐H, Fixed, 95% CI) | 0.0 [0.0, 0.0] |
| 7.2 Emergency CS | 0 | 0 | Risk Ratio (M‐H, Fixed, 95% CI) | 0.0 [0.0, 0.0] |
| 7.3 Elective or emergency CS not specified | 0 | 0 | Risk Ratio (M‐H, Fixed, 95% CI) | 0.0 [0.0, 0.0] |
| 8 Restlessness | 0 | 0 | Risk Ratio (M‐H, Fixed, 95% CI) | 0.0 [0.0, 0.0] |
| 8.1 Elective CS | 0 | 0 | Risk Ratio (M‐H, Fixed, 95% CI) | 0.0 [0.0, 0.0] |
| 8.2 Emergency CS | 0 | 0 | Risk Ratio (M‐H, Fixed, 95% CI) | 0.0 [0.0, 0.0] |
| 8.3 Elective or emergency CS not specified | 0 | 0 | Risk Ratio (M‐H, Fixed, 95% CI) | 0.0 [0.0, 0.0] |
| 9 Dystonic reactions | 0 | 0 | Risk Ratio (M‐H, Fixed, 95% CI) | 0.0 [0.0, 0.0] |
| 9.1 Elective CS | 0 | 0 | Risk Ratio (M‐H, Fixed, 95% CI) | 0.0 [0.0, 0.0] |
| 9.2 Emergency CS | 0 | 0 | Risk Ratio (M‐H, Fixed, 95% CI) | 0.0 [0.0, 0.0] |
| 9.3 Elective or emergency CS not specified | 0 | 0 | Risk Ratio (M‐H, Fixed, 95% CI) | 0.0 [0.0, 0.0] |
| 10 Extrapyramidal symptoms | 0 | 0 | Risk Ratio (M‐H, Fixed, 95% CI) | 0.0 [0.0, 0.0] |
| 10.1 Elective CS | 0 | 0 | Risk Ratio (M‐H, Fixed, 95% CI) | 0.0 [0.0, 0.0] |
| 10.2 Emergency CS | 0 | 0 | Risk Ratio (M‐H, Fixed, 95% CI) | 0.0 [0.0, 0.0] |
| 10.3 Elective or emergency CS not specified | 0 | 0 | Risk Ratio (M‐H, Fixed, 95% CI) | 0.0 [0.0, 0.0] |
| 11 Hypotension | 0 | 0 | Risk Ratio (M‐H, Fixed, 95% CI) | 0.0 [0.0, 0.0] |
| 11.1 Elective CS | 0 | 0 | Risk Ratio (M‐H, Fixed, 95% CI) | 0.0 [0.0, 0.0] |
| 11.2 Emergency CS | 0 | 0 | Risk Ratio (M‐H, Fixed, 95% CI) | 0.0 [0.0, 0.0] |
| 11.3 Elective or emergency CS not specified | 0 | 0 | Risk Ratio (M‐H, Fixed, 95% CI) | 0.0 [0.0, 0.0] |
| 12 Blood loss | 0 | 0 | Std. Mean Difference (IV, Fixed, 95% CI) | 0.0 [0.0, 0.0] |
| 12.1 Elective CS | 0 | 0 | Std. Mean Difference (IV, Fixed, 95% CI) | 0.0 [0.0, 0.0] |
| 12.2 Emergency CS | 0 | 0 | Std. Mean Difference (IV, Fixed, 95% CI) | 0.0 [0.0, 0.0] |
| 12.3 Elective or emergency CS not specified | 0 | 0 | Std. Mean Difference (IV, Fixed, 95% CI) | 0.0 [0.0, 0.0] |
| 13 Atonic uterus | 0 | 0 | Risk Ratio (M‐H, Fixed, 95% CI) | 0.0 [0.0, 0.0] |
| 13.1 Elective CS | 0 | 0 | Risk Ratio (M‐H, Fixed, 95% CI) | 0.0 [0.0, 0.0] |
| 13.2 Emergency CS | 0 | 0 | Risk Ratio (M‐H, Fixed, 95% CI) | 0.0 [0.0, 0.0] |
| 13.3 Elective or emergency CS not specified | 0 | 0 | Risk Ratio (M‐H, Fixed, 95% CI) | 0.0 [0.0, 0.0] |
| 14 Women's satisfaction | 0 | 0 | Std. Mean Difference (IV, Fixed, 95% CI) | 0.0 [0.0, 0.0] |
| 14.1 Elective CS | 0 | 0 | Std. Mean Difference (IV, Fixed, 95% CI) | 0.0 [0.0, 0.0] |
| 14.2 Emergency CS | 0 | 0 | Std. Mean Difference (IV, Fixed, 95% CI) | 0.0 [0.0, 0.0] |
| 14.3 Elective or emergency CS not specified | 0 | 0 | Std. Mean Difference (IV, Fixed, 95% CI) | 0.0 [0.0, 0.0] |
| 15 Cord blood pH | 0 | 0 | Mean Difference (IV, Fixed, 95% CI) | 0.0 [0.0, 0.0] |
| 15.1 Elective CS | 0 | 0 | Mean Difference (IV, Fixed, 95% CI) | 0.0 [0.0, 0.0] |
| 15.2 Emergency CS | 0 | 0 | Mean Difference (IV, Fixed, 95% CI) | 0.0 [0.0, 0.0] |
| 15.3 Elective or emergency CS not specified | 0 | 0 | Mean Difference (IV, Fixed, 95% CI) | 0.0 [0.0, 0.0] |
| 16 Apgar < 7 at 5 minutes | 0 | 0 | Risk Ratio (M‐H, Fixed, 95% CI) | 0.0 [0.0, 0.0] |
| 16.1 Elective CS | 0 | 0 | Risk Ratio (M‐H, Fixed, 95% CI) | 0.0 [0.0, 0.0] |
| 16.2 Emergency CS | 0 | 0 | Risk Ratio (M‐H, Fixed, 95% CI) | 0.0 [0.0, 0.0] |
| 16.3 Elective or emergency CS not specified | 0 | 0 | Risk Ratio (M‐H, Fixed, 95% CI) | 0.0 [0.0, 0.0] |
| 17 Neonatal assessment scores | 0 | 0 | Std. Mean Difference (IV, Fixed, 95% CI) | 0.0 [0.0, 0.0] |
| 17.1 Elective CS | 0 | 0 | Std. Mean Difference (IV, Fixed, 95% CI) | 0.0 [0.0, 0.0] |
| 17.2 Emergency CS | 0 | 0 | Std. Mean Difference (IV, Fixed, 95% CI) | 0.0 [0.0, 0.0] |
| 17.3 Elective or emergency CS not specified | 0 | 0 | Std. Mean Difference (IV, Fixed, 95% CI) | 0.0 [0.0, 0.0] |
| 18 Admission to NICU | 0 | 0 | Risk Ratio (M‐H, Fixed, 95% CI) | 0.0 [0.0, 0.0] |
| 18.1 Elective CS | 0 | 0 | Risk Ratio (M‐H, Fixed, 95% CI) | 0.0 [0.0, 0.0] |
| 18.2 Emergency CS | 0 | 0 | Risk Ratio (M‐H, Fixed, 95% CI) | 0.0 [0.0, 0.0] |
| 18.3 Elective or emergency CS not specified | 0 | 0 | Risk Ratio (M‐H, Fixed, 95% CI) | 0.0 [0.0, 0.0] |
| 19 Initiation of breastfeeding | 0 | 0 | Risk Ratio (M‐H, Fixed, 95% CI) | 0.0 [0.0, 0.0] |
| 19.1 Elective CS | 0 | 0 | Risk Ratio (M‐H, Fixed, 95% CI) | 0.0 [0.0, 0.0] |
| 19.2 Emergency CS | 0 | 0 | Risk Ratio (M‐H, Fixed, 95% CI) | 0.0 [0.0, 0.0] |
| 19.3 Elective or emergency CS not specified | 0 | 0 | Risk Ratio (M‐H, Fixed, 95% CI) | 0.0 [0.0, 0.0] |
| 20 Duration of breastfeeding | 0 | 0 | Std. Mean Difference (IV, Fixed, 95% CI) | 0.0 [0.0, 0.0] |
| 20.1 Elective CS | 0 | 0 | Std. Mean Difference (IV, Fixed, 95% CI) | 0.0 [0.0, 0.0] |
| 20.2 Emergency CS | 0 | 0 | Std. Mean Difference (IV, Fixed, 95% CI) | 0.0 [0.0, 0.0] |
| 20.3 Elective or emergency CS not specified | 0 | 0 | Std. Mean Difference (IV, Fixed, 95% CI) | 0.0 [0.0, 0.0] |
| 21 Intragastric pH < 2.5 at extubation | 1 | 89 | Risk Ratio (M‐H, Fixed, 95% CI) | 0.03 [0.00, 0.24] |
| 21.1 Elective CS | 0 | 0 | Risk Ratio (M‐H, Fixed, 95% CI) | 0.0 [0.0, 0.0] |
| 21.2 Emergency CS | 0 | 0 | Risk Ratio (M‐H, Fixed, 95% CI) | 0.0 [0.0, 0.0] |
| 21.3 Elective or emergency CS not specified | 1 | 89 | Risk Ratio (M‐H, Fixed, 95% CI) | 0.03 [0.00, 0.24] |
| 22 Intragastric volume < 0.4 mL/kg at extubation | 0 | 0 | Risk Ratio (M‐H, Fixed, 95% CI) | 0.0 [0.0, 0.0] |
| 22.1 Elective CS | 0 | 0 | Risk Ratio (M‐H, Fixed, 95% CI) | 0.0 [0.0, 0.0] |
| 22.2 Emergency CS | 0 | 0 | Risk Ratio (M‐H, Fixed, 95% CI) | 0.0 [0.0, 0.0] |
| 22.3 Elective or emergency CS not specified | 0 | 0 | Risk Ratio (M‐H, Fixed, 95% CI) | 0.0 [0.0, 0.0] |
| 23 Intragastric pH post intubation (not pre‐specified) | 1 | 89 | Mean Difference (IV, Fixed, 95% CI) | 2.82 [2.25, 3.39] |
| 23.1 Elective CS | 0 | 0 | Mean Difference (IV, Fixed, 95% CI) | 0.0 [0.0, 0.0] |
| 23.2 Emergency CS | 0 | 0 | Mean Difference (IV, Fixed, 95% CI) | 0.0 [0.0, 0.0] |
| 23.3 Elective or emergency CS not specified | 1 | 89 | Mean Difference (IV, Fixed, 95% CI) | 2.82 [2.25, 3.39] |
| 24 Intragastric pH at extubation (not pre‐specified) | 1 | 89 | Mean Difference (IV, Fixed, 95% CI) | 2.54 [1.85, 3.23] |
| 24.1 Emergency CS | 0 | 0 | Mean Difference (IV, Fixed, 95% CI) | 0.0 [0.0, 0.0] |
| 24.2 Elective CS | 0 | 0 | Mean Difference (IV, Fixed, 95% CI) | 0.0 [0.0, 0.0] |
| 24.3 Emergency or elective CS not specified | 1 | 89 | Mean Difference (IV, Fixed, 95% CI) | 2.54 [1.85, 3.23] |
6.23. Analysis.
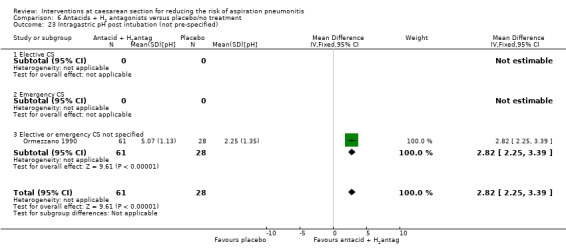
Comparison 6 Antacids + H2 antagonists versus placebo/no treatment, Outcome 23 Intragastric pH post intubation (not pre‐specified).
6.24. Analysis.
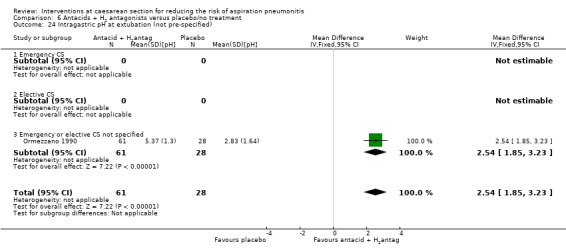
Comparison 6 Antacids + H2 antagonists versus placebo/no treatment, Outcome 24 Intragastric pH at extubation (not pre‐specified).
Comparison 7. H2 antagonists + prokinetic drugs versus placebo/no treatment.
| Outcome or subgroup title | No. of studies | No. of participants | Statistical method | Effect size |
|---|---|---|---|---|
| 1 Mortality due to aspiration pneumonitis | 0 | 0 | Risk Ratio (M‐H, Fixed, 95% CI) | 0.0 [0.0, 0.0] |
| 1.1 Elective CS | 0 | 0 | Risk Ratio (M‐H, Fixed, 95% CI) | 0.0 [0.0, 0.0] |
| 1.2 Emergency CS | 0 | 0 | Risk Ratio (M‐H, Fixed, 95% CI) | 0.0 [0.0, 0.0] |
| 1.3 Elective or emergency CS not specified | 0 | 0 | Risk Ratio (M‐H, Fixed, 95% CI) | 0.0 [0.0, 0.0] |
| 2 Morbidity due to aspiration pneumonitis | 0 | 0 | Risk Ratio (M‐H, Fixed, 95% CI) | 0.0 [0.0, 0.0] |
| 2.1 Elective CS | 0 | 0 | Risk Ratio (M‐H, Fixed, 95% CI) | 0.0 [0.0, 0.0] |
| 2.2 Emergency CS | 0 | 0 | Risk Ratio (M‐H, Fixed, 95% CI) | 0.0 [0.0, 0.0] |
| 2.3 Elective or emergency CS not specified | 0 | 0 | Risk Ratio (M‐H, Fixed, 95% CI) | 0.0 [0.0, 0.0] |
| 3 Intragastric pH < 2.5 at intubation | 1 | 50 | Risk Ratio (M‐H, Fixed, 95% CI) | 0.03 [0.00, 0.48] |
| 3.1 Elective CS | 1 | 50 | Risk Ratio (M‐H, Fixed, 95% CI) | 0.03 [0.00, 0.48] |
| 3.2 Emergency CS | 0 | 0 | Risk Ratio (M‐H, Fixed, 95% CI) | 0.0 [0.0, 0.0] |
| 3.3 Elective or emergency CS not specified | 0 | 0 | Risk Ratio (M‐H, Fixed, 95% CI) | 0.0 [0.0, 0.0] |
| 4 Intragastric volume < 0.4 mL/kg at intubation | 0 | 0 | Risk Ratio (M‐H, Fixed, 95% CI) | 0.0 [0.0, 0.0] |
| 4.1 Elective CS | 0 | 0 | Risk Ratio (M‐H, Fixed, 95% CI) | 0.0 [0.0, 0.0] |
| 4.2 Emergency CS | 0 | 0 | Risk Ratio (M‐H, Fixed, 95% CI) | 0.0 [0.0, 0.0] |
| 4.3 Elective or emergency CS not specified | 0 | 0 | Risk Ratio (M‐H, Fixed, 95% CI) | 0.0 [0.0, 0.0] |
| 5 Nausea | 0 | 0 | Risk Ratio (M‐H, Fixed, 95% CI) | 0.0 [0.0, 0.0] |
| 5.1 Elective CS | 0 | 0 | Risk Ratio (M‐H, Fixed, 95% CI) | 0.0 [0.0, 0.0] |
| 5.2 Emergency CS | 0 | 0 | Risk Ratio (M‐H, Fixed, 95% CI) | 0.0 [0.0, 0.0] |
| 5.3 Elective or emergency CS not specified | 0 | 0 | Risk Ratio (M‐H, Fixed, 95% CI) | 0.0 [0.0, 0.0] |
| 6 Vomiting | 0 | 0 | Risk Ratio (M‐H, Fixed, 95% CI) | 0.0 [0.0, 0.0] |
| 6.1 Elective CS | 0 | 0 | Risk Ratio (M‐H, Fixed, 95% CI) | 0.0 [0.0, 0.0] |
| 6.2 Emergency CS | 0 | 0 | Risk Ratio (M‐H, Fixed, 95% CI) | 0.0 [0.0, 0.0] |
| 6.3 Elective or emergency CS not specified | 0 | 0 | Risk Ratio (M‐H, Fixed, 95% CI) | 0.0 [0.0, 0.0] |
| 7 Sedation | 0 | 0 | Risk Ratio (M‐H, Fixed, 95% CI) | 0.0 [0.0, 0.0] |
| 7.1 Elective CS | 0 | 0 | Risk Ratio (M‐H, Fixed, 95% CI) | 0.0 [0.0, 0.0] |
| 7.2 Emergency CS | 0 | 0 | Risk Ratio (M‐H, Fixed, 95% CI) | 0.0 [0.0, 0.0] |
| 7.3 Elective or emergency CS not specified | 0 | 0 | Risk Ratio (M‐H, Fixed, 95% CI) | 0.0 [0.0, 0.0] |
| 8 Restlessness | 0 | 0 | Risk Ratio (M‐H, Fixed, 95% CI) | 0.0 [0.0, 0.0] |
| 8.1 Elective CS | 0 | 0 | Risk Ratio (M‐H, Fixed, 95% CI) | 0.0 [0.0, 0.0] |
| 8.2 Emergency CS | 0 | 0 | Risk Ratio (M‐H, Fixed, 95% CI) | 0.0 [0.0, 0.0] |
| 8.3 Elective or emergency CS not specified | 0 | 0 | Risk Ratio (M‐H, Fixed, 95% CI) | 0.0 [0.0, 0.0] |
| 9 Dystonic reactions | 0 | 0 | Risk Ratio (M‐H, Fixed, 95% CI) | 0.0 [0.0, 0.0] |
| 9.1 Elective CS | 0 | 0 | Risk Ratio (M‐H, Fixed, 95% CI) | 0.0 [0.0, 0.0] |
| 9.2 Emergency CS | 0 | 0 | Risk Ratio (M‐H, Fixed, 95% CI) | 0.0 [0.0, 0.0] |
| 9.3 Elective or emergency CS not specified | 0 | 0 | Risk Ratio (M‐H, Fixed, 95% CI) | 0.0 [0.0, 0.0] |
| 10 Extrapyramidal symptoms | 0 | 0 | Risk Ratio (M‐H, Fixed, 95% CI) | 0.0 [0.0, 0.0] |
| 10.1 Elective CS | 0 | 0 | Risk Ratio (M‐H, Fixed, 95% CI) | 0.0 [0.0, 0.0] |
| 10.2 Emergency CS | 0 | 0 | Risk Ratio (M‐H, Fixed, 95% CI) | 0.0 [0.0, 0.0] |
| 10.3 Elective or emergency CS not specified | 0 | 0 | Risk Ratio (M‐H, Fixed, 95% CI) | 0.0 [0.0, 0.0] |
| 11 Hypotension | 0 | 0 | Risk Ratio (M‐H, Fixed, 95% CI) | 0.0 [0.0, 0.0] |
| 11.1 Elective CS | 0 | 0 | Risk Ratio (M‐H, Fixed, 95% CI) | 0.0 [0.0, 0.0] |
| 11.2 Emergency CS | 0 | 0 | Risk Ratio (M‐H, Fixed, 95% CI) | 0.0 [0.0, 0.0] |
| 11.3 Elective or emergency CS not specified | 0 | 0 | Risk Ratio (M‐H, Fixed, 95% CI) | 0.0 [0.0, 0.0] |
| 12 Blood loss | 0 | 0 | Std. Mean Difference (IV, Fixed, 95% CI) | 0.0 [0.0, 0.0] |
| 12.1 Elective CS | 0 | 0 | Std. Mean Difference (IV, Fixed, 95% CI) | 0.0 [0.0, 0.0] |
| 12.2 Emergency CS | 0 | 0 | Std. Mean Difference (IV, Fixed, 95% CI) | 0.0 [0.0, 0.0] |
| 12.3 Elective or emergency CS not specified | 0 | 0 | Std. Mean Difference (IV, Fixed, 95% CI) | 0.0 [0.0, 0.0] |
| 13 Atonic uterus | 0 | 0 | Risk Ratio (M‐H, Fixed, 95% CI) | 0.0 [0.0, 0.0] |
| 13.1 Elective CS | 0 | 0 | Risk Ratio (M‐H, Fixed, 95% CI) | 0.0 [0.0, 0.0] |
| 13.2 Emergency CS | 0 | 0 | Risk Ratio (M‐H, Fixed, 95% CI) | 0.0 [0.0, 0.0] |
| 13.3 Elective or emergency CS not specified | 0 | 0 | Risk Ratio (M‐H, Fixed, 95% CI) | 0.0 [0.0, 0.0] |
| 14 Women's satisfaction | 0 | 0 | Std. Mean Difference (IV, Fixed, 95% CI) | 0.0 [0.0, 0.0] |
| 14.1 Elective CS | 0 | 0 | Std. Mean Difference (IV, Fixed, 95% CI) | 0.0 [0.0, 0.0] |
| 14.2 Emergency CS | 0 | 0 | Std. Mean Difference (IV, Fixed, 95% CI) | 0.0 [0.0, 0.0] |
| 14.3 Elective or emergency CS not specified | 0 | 0 | Std. Mean Difference (IV, Fixed, 95% CI) | 0.0 [0.0, 0.0] |
| 15 Cord blood pH | 0 | 0 | Mean Difference (IV, Fixed, 95% CI) | 0.0 [0.0, 0.0] |
| 15.1 Elective CS | 0 | 0 | Mean Difference (IV, Fixed, 95% CI) | 0.0 [0.0, 0.0] |
| 15.2 Emergency CS | 0 | 0 | Mean Difference (IV, Fixed, 95% CI) | 0.0 [0.0, 0.0] |
| 15.3 Elective or emergency CS not specified | 0 | 0 | Mean Difference (IV, Fixed, 95% CI) | 0.0 [0.0, 0.0] |
| 16 Apgar < 7 at 5 minutes | 0 | 0 | Risk Ratio (M‐H, Fixed, 95% CI) | 0.0 [0.0, 0.0] |
| 16.1 Elective CS | 0 | 0 | Risk Ratio (M‐H, Fixed, 95% CI) | 0.0 [0.0, 0.0] |
| 16.2 Emergency CS | 0 | 0 | Risk Ratio (M‐H, Fixed, 95% CI) | 0.0 [0.0, 0.0] |
| 16.3 Elective or emergency CS not specified | 0 | 0 | Risk Ratio (M‐H, Fixed, 95% CI) | 0.0 [0.0, 0.0] |
| 17 Neonatal assessment scores | 0 | 0 | Std. Mean Difference (IV, Fixed, 95% CI) | 0.0 [0.0, 0.0] |
| 17.1 Elective CS | 0 | 0 | Std. Mean Difference (IV, Fixed, 95% CI) | 0.0 [0.0, 0.0] |
| 17.2 Emergency CS | 0 | 0 | Std. Mean Difference (IV, Fixed, 95% CI) | 0.0 [0.0, 0.0] |
| 17.3 Elective or emergency CS not specified | 0 | 0 | Std. Mean Difference (IV, Fixed, 95% CI) | 0.0 [0.0, 0.0] |
| 18 Admission to NICU | 0 | 0 | Risk Ratio (M‐H, Fixed, 95% CI) | 0.0 [0.0, 0.0] |
| 18.1 Elective CS | 0 | 0 | Risk Ratio (M‐H, Fixed, 95% CI) | 0.0 [0.0, 0.0] |
| 18.2 Emergency CS | 0 | 0 | Risk Ratio (M‐H, Fixed, 95% CI) | 0.0 [0.0, 0.0] |
| 18.3 Elective or emergency CS not specified | 0 | 0 | Risk Ratio (M‐H, Fixed, 95% CI) | 0.0 [0.0, 0.0] |
| 19 Initiation of breastfeeding | 0 | 0 | Risk Ratio (M‐H, Fixed, 95% CI) | 0.0 [0.0, 0.0] |
| 19.1 Elective CS | 0 | 0 | Risk Ratio (M‐H, Fixed, 95% CI) | 0.0 [0.0, 0.0] |
| 19.2 Emergency CS | 0 | 0 | Risk Ratio (M‐H, Fixed, 95% CI) | 0.0 [0.0, 0.0] |
| 19.3 Elective or emergency CS not specified | 0 | 0 | Risk Ratio (M‐H, Fixed, 95% CI) | 0.0 [0.0, 0.0] |
| 20 Duration of breastfeeding | 0 | 0 | Std. Mean Difference (IV, Fixed, 95% CI) | 0.0 [0.0, 0.0] |
| 20.1 Elective CS | 0 | 0 | Std. Mean Difference (IV, Fixed, 95% CI) | 0.0 [0.0, 0.0] |
| 20.2 Emergency CS | 0 | 0 | Std. Mean Difference (IV, Fixed, 95% CI) | 0.0 [0.0, 0.0] |
| 20.3 Elective or emergency CS not specified | 0 | 0 | Std. Mean Difference (IV, Fixed, 95% CI) | 0.0 [0.0, 0.0] |
| 21 Intragastric pH > 2.5 at extubation | 0 | 0 | Risk Ratio (M‐H, Fixed, 95% CI) | 0.0 [0.0, 0.0] |
| 21.1 Elective CS | 0 | 0 | Risk Ratio (M‐H, Fixed, 95% CI) | 0.0 [0.0, 0.0] |
| 21.2 Emergency CS | 0 | 0 | Risk Ratio (M‐H, Fixed, 95% CI) | 0.0 [0.0, 0.0] |
| 21.3 Elective or emergency CS not specified | 0 | 0 | Risk Ratio (M‐H, Fixed, 95% CI) | 0.0 [0.0, 0.0] |
| 22 Intragastric volume < 0.4 mL/kg at extubation | 0 | 0 | Risk Ratio (M‐H, Fixed, 95% CI) | 0.0 [0.0, 0.0] |
| 22.1 Elective CS | 0 | 0 | Risk Ratio (M‐H, Fixed, 95% CI) | 0.0 [0.0, 0.0] |
| 22.2 Emergency CS | 0 | 0 | Risk Ratio (M‐H, Fixed, 95% CI) | 0.0 [0.0, 0.0] |
| 22.3 Elective or emergency CS not specified | 0 | 0 | Risk Ratio (M‐H, Fixed, 95% CI) | 0.0 [0.0, 0.0] |
| 23 Risk of aspiration (not pre‐specified) | 1 | 50 | Risk Ratio (M‐H, Fixed, 95% CI) | 0.03 [0.00, 0.51] |
| 23.1 Elective CS | 1 | 50 | Risk Ratio (M‐H, Fixed, 95% CI) | 0.03 [0.00, 0.51] |
| 23.2 Emergency CS | 0 | 0 | Risk Ratio (M‐H, Fixed, 95% CI) | 0.0 [0.0, 0.0] |
| 23.3 Emergency and elective cs not specified | 0 | 0 | Risk Ratio (M‐H, Fixed, 95% CI) | 0.0 [0.0, 0.0] |
| 24 Gastric pH post intubation (not pre‐specified) | 1 | 50 | Mean Difference (IV, Fixed, 95% CI) | 3.17 [2.57, 3.77] |
| 24.1 Elective CS | 1 | 50 | Mean Difference (IV, Fixed, 95% CI) | 3.17 [2.57, 3.77] |
| 24.2 Emergency CS | 0 | 0 | Mean Difference (IV, Fixed, 95% CI) | 0.0 [0.0, 0.0] |
| 24.3 Emergency and elective CS not specified | 0 | 0 | Mean Difference (IV, Fixed, 95% CI) | 0.0 [0.0, 0.0] |
| 25 Gastric volume post intubation (not pre‐specified) | 1 | 50 | Mean Difference (IV, Fixed, 95% CI) | ‐14.20 [‐20.92, ‐7.48] |
| 25.1 Elective CS | 1 | 50 | Mean Difference (IV, Fixed, 95% CI) | ‐14.20 [‐20.92, ‐7.48] |
| 25.2 Emergency CS | 0 | 0 | Mean Difference (IV, Fixed, 95% CI) | 0.0 [0.0, 0.0] |
| 25.3 Emergency and elective CS not specified | 0 | 0 | Mean Difference (IV, Fixed, 95% CI) | 0.0 [0.0, 0.0] |
| 26 Gastric volume < 25 mL after induction | 1 | 50 | Risk Ratio (M‐H, Fixed, 95% CI) | 2.11 [1.20, 3.72] |
| 26.1 Elective CS | 1 | 50 | Risk Ratio (M‐H, Fixed, 95% CI) | 2.11 [1.20, 3.72] |
| 26.2 Emergency CS | 0 | 0 | Risk Ratio (M‐H, Fixed, 95% CI) | 0.0 [0.0, 0.0] |
| 26.3 Elective or emergency CS not specified | 0 | 0 | Risk Ratio (M‐H, Fixed, 95% CI) | 0.0 [0.0, 0.0] |
7.24. Analysis.
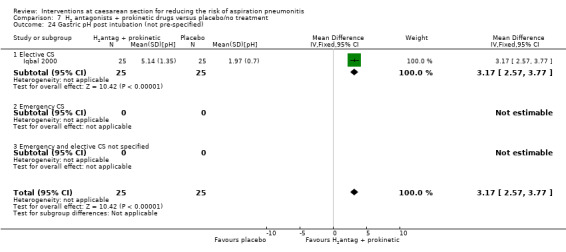
Comparison 7 H2 antagonists + prokinetic drugs versus placebo/no treatment, Outcome 24 Gastric pH post intubation (not pre‐specified).
7.25. Analysis.
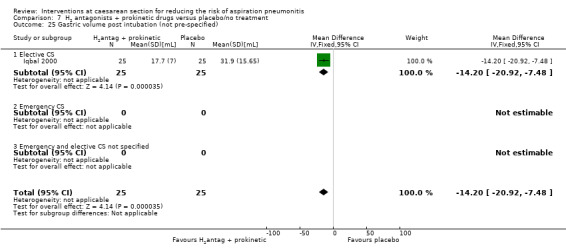
Comparison 7 H2 antagonists + prokinetic drugs versus placebo/no treatment, Outcome 25 Gastric volume post intubation (not pre‐specified).
7.26. Analysis.
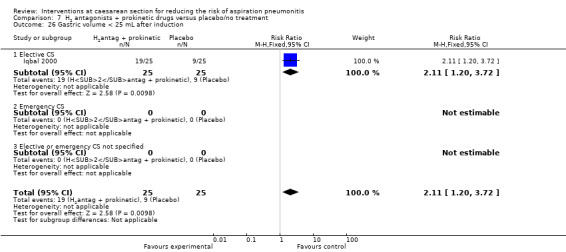
Comparison 7 H2 antagonists + prokinetic drugs versus placebo/no treatment, Outcome 26 Gastric volume < 25 mL after induction.
Comparison 8. Antacids versus H2 antagonists.
| Outcome or subgroup title | No. of studies | No. of participants | Statistical method | Effect size |
|---|---|---|---|---|
| 1 Mortality due to aspiration pneumonitis | 0 | 0 | Risk Ratio (M‐H, Fixed, 95% CI) | 0.0 [0.0, 0.0] |
| 1.1 Elective CS | 0 | 0 | Risk Ratio (M‐H, Fixed, 95% CI) | 0.0 [0.0, 0.0] |
| 1.2 Emergency CS | 0 | 0 | Risk Ratio (M‐H, Fixed, 95% CI) | 0.0 [0.0, 0.0] |
| 1.3 Elective or emergency CS not specified | 0 | 0 | Risk Ratio (M‐H, Fixed, 95% CI) | 0.0 [0.0, 0.0] |
| 2 Morbidity due to aspiration pneumonitis | 0 | 0 | Risk Ratio (M‐H, Fixed, 95% CI) | 0.0 [0.0, 0.0] |
| 2.1 Elective CS | 0 | 0 | Risk Ratio (M‐H, Fixed, 95% CI) | 0.0 [0.0, 0.0] |
| 2.2 Emergency CS | 0 | 0 | Risk Ratio (M‐H, Fixed, 95% CI) | 0.0 [0.0, 0.0] |
| 2.3 Elective or emergency CS not specified | 0 | 0 | Risk Ratio (M‐H, Fixed, 95% CI) | 0.0 [0.0, 0.0] |
| 3 Intragastric pH < 2.5 at intubation | 2 | 135 | Risk Ratio (M‐H, Fixed, 95% CI) | 0.07 [0.01, 0.52] |
| 3.1 Elective CS | 2 | 104 | Risk Ratio (M‐H, Fixed, 95% CI) | 0.07 [0.01, 0.52] |
| 3.2 Emergency CS | 1 | 31 | Risk Ratio (M‐H, Fixed, 95% CI) | 0.0 [0.0, 0.0] |
| 3.3 Elective or emergency CS not specified | 0 | 0 | Risk Ratio (M‐H, Fixed, 95% CI) | 0.0 [0.0, 0.0] |
| 4 Intragastric volume < 0.4 mL/kg at intubation | 0 | 0 | Risk Ratio (M‐H, Fixed, 95% CI) | 0.0 [0.0, 0.0] |
| 4.1 Elective CS | 0 | 0 | Risk Ratio (M‐H, Fixed, 95% CI) | 0.0 [0.0, 0.0] |
| 4.2 Emergency CS | 0 | 0 | Risk Ratio (M‐H, Fixed, 95% CI) | 0.0 [0.0, 0.0] |
| 4.3 Elective or emergency CS not specified | 0 | 0 | Risk Ratio (M‐H, Fixed, 95% CI) | 0.0 [0.0, 0.0] |
| 5 Nausea | 0 | 0 | Risk Ratio (M‐H, Fixed, 95% CI) | 0.0 [0.0, 0.0] |
| 5.1 Elective CS | 0 | 0 | Risk Ratio (M‐H, Fixed, 95% CI) | 0.0 [0.0, 0.0] |
| 5.2 Emergency CS | 0 | 0 | Risk Ratio (M‐H, Fixed, 95% CI) | 0.0 [0.0, 0.0] |
| 5.3 Elective or emergency CS not specified | 0 | 0 | Risk Ratio (M‐H, Fixed, 95% CI) | 0.0 [0.0, 0.0] |
| 6 Vomiting | 0 | 0 | Risk Ratio (M‐H, Fixed, 95% CI) | 0.0 [0.0, 0.0] |
| 6.1 Elective CS | 0 | 0 | Risk Ratio (M‐H, Fixed, 95% CI) | 0.0 [0.0, 0.0] |
| 6.2 Emergency CS | 0 | 0 | Risk Ratio (M‐H, Fixed, 95% CI) | 0.0 [0.0, 0.0] |
| 6.3 Elective or emergency CS not specified | 0 | 0 | Risk Ratio (M‐H, Fixed, 95% CI) | 0.0 [0.0, 0.0] |
| 7 Sedation | 0 | 0 | Risk Ratio (M‐H, Fixed, 95% CI) | 0.0 [0.0, 0.0] |
| 7.1 Elective CS | 0 | 0 | Risk Ratio (M‐H, Fixed, 95% CI) | 0.0 [0.0, 0.0] |
| 7.2 Emergency CS | 0 | 0 | Risk Ratio (M‐H, Fixed, 95% CI) | 0.0 [0.0, 0.0] |
| 7.3 Elective or emergency CS not specified | 0 | 0 | Risk Ratio (M‐H, Fixed, 95% CI) | 0.0 [0.0, 0.0] |
| 8 Restlessness | 0 | 0 | Risk Ratio (M‐H, Fixed, 95% CI) | 0.0 [0.0, 0.0] |
| 8.1 Elective CS | 0 | 0 | Risk Ratio (M‐H, Fixed, 95% CI) | 0.0 [0.0, 0.0] |
| 8.2 Emergency CS | 0 | 0 | Risk Ratio (M‐H, Fixed, 95% CI) | 0.0 [0.0, 0.0] |
| 8.3 Elective or emergency CS not specified | 0 | 0 | Risk Ratio (M‐H, Fixed, 95% CI) | 0.0 [0.0, 0.0] |
| 9 Dystonic reactions | 0 | 0 | Risk Ratio (M‐H, Fixed, 95% CI) | 0.0 [0.0, 0.0] |
| 9.1 Elective CS | 0 | 0 | Risk Ratio (M‐H, Fixed, 95% CI) | 0.0 [0.0, 0.0] |
| 9.2 Emergency CS | 0 | 0 | Risk Ratio (M‐H, Fixed, 95% CI) | 0.0 [0.0, 0.0] |
| 9.3 Elective or emergency CS not specified | 0 | 0 | Risk Ratio (M‐H, Fixed, 95% CI) | 0.0 [0.0, 0.0] |
| 10 Extrapyramidal symptoms | 0 | 0 | Risk Ratio (M‐H, Fixed, 95% CI) | 0.0 [0.0, 0.0] |
| 10.1 Elective CS | 0 | 0 | Risk Ratio (M‐H, Fixed, 95% CI) | 0.0 [0.0, 0.0] |
| 10.2 Emergency CS | 0 | 0 | Risk Ratio (M‐H, Fixed, 95% CI) | 0.0 [0.0, 0.0] |
| 10.3 Elective or emergency CS not specified | 0 | 0 | Risk Ratio (M‐H, Fixed, 95% CI) | 0.0 [0.0, 0.0] |
| 11 Hypotension | 0 | 0 | Risk Ratio (M‐H, Fixed, 95% CI) | 0.0 [0.0, 0.0] |
| 11.1 Elective CS | 0 | 0 | Risk Ratio (M‐H, Fixed, 95% CI) | 0.0 [0.0, 0.0] |
| 11.2 Emergency CS | 0 | 0 | Risk Ratio (M‐H, Fixed, 95% CI) | 0.0 [0.0, 0.0] |
| 11.3 Elective or emergency CS not specified | 0 | 0 | Risk Ratio (M‐H, Fixed, 95% CI) | 0.0 [0.0, 0.0] |
| 12 Blood loss | 0 | 0 | Std. Mean Difference (IV, Fixed, 95% CI) | 0.0 [0.0, 0.0] |
| 12.1 Elective CS | 0 | 0 | Std. Mean Difference (IV, Fixed, 95% CI) | 0.0 [0.0, 0.0] |
| 12.2 Emergency CS | 0 | 0 | Std. Mean Difference (IV, Fixed, 95% CI) | 0.0 [0.0, 0.0] |
| 12.3 Elective or emergency CS not specified | 0 | 0 | Std. Mean Difference (IV, Fixed, 95% CI) | 0.0 [0.0, 0.0] |
| 13 Atonic uterus | 0 | 0 | Risk Ratio (M‐H, Fixed, 95% CI) | 0.0 [0.0, 0.0] |
| 13.1 Elective CS | 0 | 0 | Risk Ratio (M‐H, Fixed, 95% CI) | 0.0 [0.0, 0.0] |
| 13.2 Emergency CS | 0 | 0 | Risk Ratio (M‐H, Fixed, 95% CI) | 0.0 [0.0, 0.0] |
| 13.3 Elective or emergency CS not specified | 0 | 0 | Risk Ratio (M‐H, Fixed, 95% CI) | 0.0 [0.0, 0.0] |
| 14 Women's satisfaction | 0 | 0 | Std. Mean Difference (IV, Fixed, 95% CI) | 0.0 [0.0, 0.0] |
| 14.1 Elective CS | 0 | 0 | Std. Mean Difference (IV, Fixed, 95% CI) | 0.0 [0.0, 0.0] |
| 14.2 Emergency CS | 0 | 0 | Std. Mean Difference (IV, Fixed, 95% CI) | 0.0 [0.0, 0.0] |
| 14.3 Elective or emergency CS not specified | 0 | 0 | Std. Mean Difference (IV, Fixed, 95% CI) | 0.0 [0.0, 0.0] |
| 15 Cord blood pH | 0 | 0 | Mean Difference (IV, Fixed, 95% CI) | 0.0 [0.0, 0.0] |
| 15.1 Elective CS | 0 | 0 | Mean Difference (IV, Fixed, 95% CI) | 0.0 [0.0, 0.0] |
| 15.2 Emergency CS | 0 | 0 | Mean Difference (IV, Fixed, 95% CI) | 0.0 [0.0, 0.0] |
| 15.3 Elective or emergency CS not specified | 0 | 0 | Mean Difference (IV, Fixed, 95% CI) | 0.0 [0.0, 0.0] |
| 16 Apgar < 7 at 5 minutes | 0 | 0 | Risk Ratio (M‐H, Fixed, 95% CI) | 0.0 [0.0, 0.0] |
| 16.1 Elective CS | 0 | 0 | Risk Ratio (M‐H, Fixed, 95% CI) | 0.0 [0.0, 0.0] |
| 16.2 Emergency CS | 0 | 0 | Risk Ratio (M‐H, Fixed, 95% CI) | 0.0 [0.0, 0.0] |
| 16.3 Elective or emergency CS not specified | 0 | 0 | Risk Ratio (M‐H, Fixed, 95% CI) | 0.0 [0.0, 0.0] |
| 17 Neonatal assessment scores | 0 | 0 | Std. Mean Difference (IV, Fixed, 95% CI) | 0.0 [0.0, 0.0] |
| 17.1 Elective CS | 0 | 0 | Std. Mean Difference (IV, Fixed, 95% CI) | 0.0 [0.0, 0.0] |
| 17.2 Emergency CS | 0 | 0 | Std. Mean Difference (IV, Fixed, 95% CI) | 0.0 [0.0, 0.0] |
| 17.3 Elective or emergency CS not specified | 0 | 0 | Std. Mean Difference (IV, Fixed, 95% CI) | 0.0 [0.0, 0.0] |
| 18 Admission to NICU | 0 | 0 | Risk Ratio (M‐H, Fixed, 95% CI) | 0.0 [0.0, 0.0] |
| 18.1 Elective CS | 0 | 0 | Risk Ratio (M‐H, Fixed, 95% CI) | 0.0 [0.0, 0.0] |
| 18.2 Emergency CS | 0 | 0 | Risk Ratio (M‐H, Fixed, 95% CI) | 0.0 [0.0, 0.0] |
| 18.3 Elective or emergency CS not specified | 0 | 0 | Risk Ratio (M‐H, Fixed, 95% CI) | 0.0 [0.0, 0.0] |
| 19 Initiation of breastfeeding | 0 | 0 | Risk Ratio (M‐H, Fixed, 95% CI) | 0.0 [0.0, 0.0] |
| 19.1 Elective CS | 0 | 0 | Risk Ratio (M‐H, Fixed, 95% CI) | 0.0 [0.0, 0.0] |
| 19.2 Emergency CS | 0 | 0 | Risk Ratio (M‐H, Fixed, 95% CI) | 0.0 [0.0, 0.0] |
| 19.3 Elective or emergency CS not specified | 0 | 0 | Risk Ratio (M‐H, Fixed, 95% CI) | 0.0 [0.0, 0.0] |
| 20 Duration of breastfeeding | 0 | 0 | Std. Mean Difference (IV, Fixed, 95% CI) | 0.0 [0.0, 0.0] |
| 20.1 Elective CS | 0 | 0 | Std. Mean Difference (IV, Fixed, 95% CI) | 0.0 [0.0, 0.0] |
| 20.2 Emergency CS | 0 | 0 | Std. Mean Difference (IV, Fixed, 95% CI) | 0.0 [0.0, 0.0] |
| 20.3 Elective or emergency CS not specified | 0 | 0 | Std. Mean Difference (IV, Fixed, 95% CI) | 0.0 [0.0, 0.0] |
| 21 Intragastric pH > 2.5 at extubation | 0 | 0 | Risk Ratio (M‐H, Fixed, 95% CI) | 0.0 [0.0, 0.0] |
| 21.1 Elective CS | 0 | 0 | Risk Ratio (M‐H, Fixed, 95% CI) | 0.0 [0.0, 0.0] |
| 21.2 Emergency CS | 0 | 0 | Risk Ratio (M‐H, Fixed, 95% CI) | 0.0 [0.0, 0.0] |
| 21.3 Elective or emergency CS not specified | 0 | 0 | Risk Ratio (M‐H, Fixed, 95% CI) | 0.0 [0.0, 0.0] |
| 22 Intragastric volume < 0.4 mL/kg at extubation | 0 | 0 | Risk Ratio (M‐H, Fixed, 95% CI) | 0.0 [0.0, 0.0] |
| 22.1 Elective CS | 0 | 0 | Risk Ratio (M‐H, Fixed, 95% CI) | 0.0 [0.0, 0.0] |
| 22.2 Emergency CS | 0 | 0 | Risk Ratio (M‐H, Fixed, 95% CI) | 0.0 [0.0, 0.0] |
| 22.3 Elective or emergency CS not specified | 0 | 0 | Risk Ratio (M‐H, Fixed, 95% CI) | 0.0 [0.0, 0.0] |
| 23 At risk of aspiration (not pre‐specified) | 1 | 16 | Risk Ratio (M‐H, Fixed, 95% CI) | 1.0 [0.18, 5.46] |
| 23.1 Elective CS | 1 | 16 | Risk Ratio (M‐H, Fixed, 95% CI) | 1.0 [0.18, 5.46] |
| 23.2 Emergency CS | 0 | 0 | Risk Ratio (M‐H, Fixed, 95% CI) | 0.0 [0.0, 0.0] |
| 23.3 Elective or emergency CS not specified | 0 | 0 | Risk Ratio (M‐H, Fixed, 95% CI) | 0.0 [0.0, 0.0] |
| 24 Gastric volume at intubation (not pre‐specified) | 3 | 102 | Std. Mean Difference (IV, Random, 95% CI) | 0.75 [0.34, 1.16] |
| 24.1 Elective CS | 3 | 102 | Std. Mean Difference (IV, Random, 95% CI) | 0.75 [0.34, 1.16] |
| 24.2 Emergency CS | 0 | 0 | Std. Mean Difference (IV, Random, 95% CI) | 0.0 [0.0, 0.0] |
| 24.3 Elective or emergency CS not specified | 0 | 0 | Std. Mean Difference (IV, Random, 95% CI) | 0.0 [0.0, 0.0] |
| 25 Gastric pH at intubation (not pre‐specified) | 1 | 24 | Mean Difference (IV, Fixed, 95% CI) | ‐3.02 [‐4.52, ‐1.52] |
| 25.1 Elective CS | 1 | 24 | Mean Difference (IV, Fixed, 95% CI) | ‐3.02 [‐4.52, ‐1.52] |
| 25.2 Emergency CS | 0 | 0 | Mean Difference (IV, Fixed, 95% CI) | 0.0 [0.0, 0.0] |
| 25.3 Elective or emergency CS not specified | 0 | 0 | Mean Difference (IV, Fixed, 95% CI) | 0.0 [0.0, 0.0] |
| 26 Gastric pH at extubation (not pre‐specified) | 1 | 24 | Mean Difference (IV, Fixed, 95% CI) | ‐2.32 [‐4.00, ‐0.64] |
| 26.1 Elective CS | 1 | 24 | Mean Difference (IV, Fixed, 95% CI) | ‐2.32 [‐4.00, ‐0.64] |
| 26.2 Emergenct CS | 0 | 0 | Mean Difference (IV, Fixed, 95% CI) | 0.0 [0.0, 0.0] |
| 26.3 Elective or emergency CS not specified | 0 | 0 | Mean Difference (IV, Fixed, 95% CI) | 0.0 [0.0, 0.0] |
8.24. Analysis.
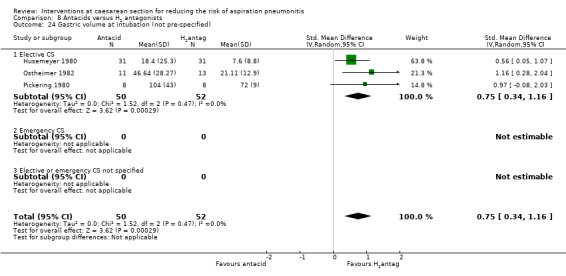
Comparison 8 Antacids versus H2 antagonists, Outcome 24 Gastric volume at intubation (not pre‐specified).
8.25. Analysis.
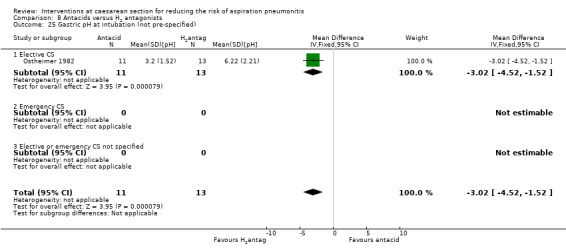
Comparison 8 Antacids versus H2 antagonists, Outcome 25 Gastric pH at intubation (not pre‐specified).
8.26. Analysis.
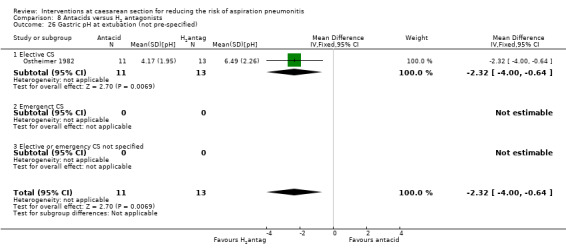
Comparison 8 Antacids versus H2 antagonists, Outcome 26 Gastric pH at extubation (not pre‐specified).
Comparison 9. Antacids versus prokinetic drugs.
| Outcome or subgroup title | No. of studies | No. of participants | Statistical method | Effect size |
|---|---|---|---|---|
| 1 Mortality due to aspiration pneumonitis | 0 | 0 | Risk Ratio (M‐H, Fixed, 95% CI) | 0.0 [0.0, 0.0] |
| 1.1 Elective CS | 0 | 0 | Risk Ratio (M‐H, Fixed, 95% CI) | 0.0 [0.0, 0.0] |
| 1.2 Emergency CS | 0 | 0 | Risk Ratio (M‐H, Fixed, 95% CI) | 0.0 [0.0, 0.0] |
| 1.3 Elective or emergency CS not specified | 0 | 0 | Risk Ratio (M‐H, Fixed, 95% CI) | 0.0 [0.0, 0.0] |
| 2 Morbidity due to aspiration pneumonitis | 0 | 0 | Risk Ratio (M‐H, Fixed, 95% CI) | 0.0 [0.0, 0.0] |
| 2.1 Elective CS | 0 | 0 | Risk Ratio (M‐H, Fixed, 95% CI) | 0.0 [0.0, 0.0] |
| 2.2 Emergency CS | 0 | 0 | Risk Ratio (M‐H, Fixed, 95% CI) | 0.0 [0.0, 0.0] |
| 2.3 Elective or emergency CS not specified | 0 | 0 | Risk Ratio (M‐H, Fixed, 95% CI) | 0.0 [0.0, 0.0] |
| 3 Intragastric pH > 2.5 at intubation | 0 | 0 | Risk Ratio (M‐H, Fixed, 95% CI) | 0.0 [0.0, 0.0] |
| 3.1 Elective CS | 0 | 0 | Risk Ratio (M‐H, Fixed, 95% CI) | 0.0 [0.0, 0.0] |
| 3.2 Emergency CS | 0 | 0 | Risk Ratio (M‐H, Fixed, 95% CI) | 0.0 [0.0, 0.0] |
| 3.3 Elective or emergency CS not specified | 0 | 0 | Risk Ratio (M‐H, Fixed, 95% CI) | 0.0 [0.0, 0.0] |
| 4 Intragastric volume < 0.4 mL/kg at intubation | 0 | 0 | Risk Ratio (M‐H, Fixed, 95% CI) | 0.0 [0.0, 0.0] |
| 4.1 Elective CS | 0 | 0 | Risk Ratio (M‐H, Fixed, 95% CI) | 0.0 [0.0, 0.0] |
| 4.2 Emergency CS | 0 | 0 | Risk Ratio (M‐H, Fixed, 95% CI) | 0.0 [0.0, 0.0] |
| 4.3 Elective or emergency CS not specified | 0 | 0 | Risk Ratio (M‐H, Fixed, 95% CI) | 0.0 [0.0, 0.0] |
| 5 Nausea | 0 | 0 | Risk Ratio (M‐H, Fixed, 95% CI) | 0.0 [0.0, 0.0] |
| 5.1 Elective CS | 0 | 0 | Risk Ratio (M‐H, Fixed, 95% CI) | 0.0 [0.0, 0.0] |
| 5.2 Emergency CS | 0 | 0 | Risk Ratio (M‐H, Fixed, 95% CI) | 0.0 [0.0, 0.0] |
| 5.3 Elective or emergency CS not specified | 0 | 0 | Risk Ratio (M‐H, Fixed, 95% CI) | 0.0 [0.0, 0.0] |
| 6 Vomiting | 0 | 0 | Risk Ratio (M‐H, Fixed, 95% CI) | 0.0 [0.0, 0.0] |
| 6.1 Elective CS | 0 | 0 | Risk Ratio (M‐H, Fixed, 95% CI) | 0.0 [0.0, 0.0] |
| 6.2 Emergency CS | 0 | 0 | Risk Ratio (M‐H, Fixed, 95% CI) | 0.0 [0.0, 0.0] |
| 6.3 Elective or emergency CS not specified | 0 | 0 | Risk Ratio (M‐H, Fixed, 95% CI) | 0.0 [0.0, 0.0] |
| 7 Sedation | 0 | 0 | Risk Ratio (M‐H, Fixed, 95% CI) | 0.0 [0.0, 0.0] |
| 7.1 Elective CS | 0 | 0 | Risk Ratio (M‐H, Fixed, 95% CI) | 0.0 [0.0, 0.0] |
| 7.2 Emergency CS | 0 | 0 | Risk Ratio (M‐H, Fixed, 95% CI) | 0.0 [0.0, 0.0] |
| 7.3 Elective or emergency CS not specified | 0 | 0 | Risk Ratio (M‐H, Fixed, 95% CI) | 0.0 [0.0, 0.0] |
| 8 Restlessness | 0 | 0 | Risk Ratio (M‐H, Fixed, 95% CI) | 0.0 [0.0, 0.0] |
| 8.1 Elective CS | 0 | 0 | Risk Ratio (M‐H, Fixed, 95% CI) | 0.0 [0.0, 0.0] |
| 8.2 Emergency CS | 0 | 0 | Risk Ratio (M‐H, Fixed, 95% CI) | 0.0 [0.0, 0.0] |
| 8.3 Elective or emergency CS not specified | 0 | 0 | Risk Ratio (M‐H, Fixed, 95% CI) | 0.0 [0.0, 0.0] |
| 9 Dystonic reactions | 0 | 0 | Risk Ratio (M‐H, Fixed, 95% CI) | 0.0 [0.0, 0.0] |
| 9.1 Elective CS | 0 | 0 | Risk Ratio (M‐H, Fixed, 95% CI) | 0.0 [0.0, 0.0] |
| 9.2 Emergency CS | 0 | 0 | Risk Ratio (M‐H, Fixed, 95% CI) | 0.0 [0.0, 0.0] |
| 9.3 Elective or emergency CS not specified | 0 | 0 | Risk Ratio (M‐H, Fixed, 95% CI) | 0.0 [0.0, 0.0] |
| 10 Extrapyramidal symptoms | 0 | 0 | Risk Ratio (M‐H, Fixed, 95% CI) | 0.0 [0.0, 0.0] |
| 10.1 Elective CS | 0 | 0 | Risk Ratio (M‐H, Fixed, 95% CI) | 0.0 [0.0, 0.0] |
| 10.2 Emergency CS | 0 | 0 | Risk Ratio (M‐H, Fixed, 95% CI) | 0.0 [0.0, 0.0] |
| 10.3 Elective or emergency CS not specified | 0 | 0 | Risk Ratio (M‐H, Fixed, 95% CI) | 0.0 [0.0, 0.0] |
| 11 Hypotension | 0 | 0 | Risk Ratio (M‐H, Fixed, 95% CI) | 0.0 [0.0, 0.0] |
| 11.1 Elective CS | 0 | 0 | Risk Ratio (M‐H, Fixed, 95% CI) | 0.0 [0.0, 0.0] |
| 11.2 Emergency CS | 0 | 0 | Risk Ratio (M‐H, Fixed, 95% CI) | 0.0 [0.0, 0.0] |
| 11.3 Elective or emergency CS not specified | 0 | 0 | Risk Ratio (M‐H, Fixed, 95% CI) | 0.0 [0.0, 0.0] |
| 12 Blood loss | 0 | 0 | Std. Mean Difference (IV, Fixed, 95% CI) | 0.0 [0.0, 0.0] |
| 12.1 Elective CS | 0 | 0 | Std. Mean Difference (IV, Fixed, 95% CI) | 0.0 [0.0, 0.0] |
| 12.2 Emergency CS | 0 | 0 | Std. Mean Difference (IV, Fixed, 95% CI) | 0.0 [0.0, 0.0] |
| 12.3 Elective or emergency CS not specified | 0 | 0 | Std. Mean Difference (IV, Fixed, 95% CI) | 0.0 [0.0, 0.0] |
| 13 Atonic uterus | 0 | 0 | Risk Ratio (M‐H, Fixed, 95% CI) | 0.0 [0.0, 0.0] |
| 13.1 Elective CS | 0 | 0 | Risk Ratio (M‐H, Fixed, 95% CI) | 0.0 [0.0, 0.0] |
| 13.2 Emergency CS | 0 | 0 | Risk Ratio (M‐H, Fixed, 95% CI) | 0.0 [0.0, 0.0] |
| 13.3 Elective or emergency CS not specified | 0 | 0 | Risk Ratio (M‐H, Fixed, 95% CI) | 0.0 [0.0, 0.0] |
| 14 Women's satisfaction | 0 | 0 | Std. Mean Difference (IV, Fixed, 95% CI) | 0.0 [0.0, 0.0] |
| 14.1 Elective CS | 0 | 0 | Std. Mean Difference (IV, Fixed, 95% CI) | 0.0 [0.0, 0.0] |
| 14.2 Emergency CS | 0 | 0 | Std. Mean Difference (IV, Fixed, 95% CI) | 0.0 [0.0, 0.0] |
| 14.3 Elective or emergency CS not specified | 0 | 0 | Std. Mean Difference (IV, Fixed, 95% CI) | 0.0 [0.0, 0.0] |
| 15 Cord blood pH | 0 | 0 | Mean Difference (IV, Fixed, 95% CI) | 0.0 [0.0, 0.0] |
| 15.1 Elective CS | 0 | 0 | Mean Difference (IV, Fixed, 95% CI) | 0.0 [0.0, 0.0] |
| 15.2 Emergency CS | 0 | 0 | Mean Difference (IV, Fixed, 95% CI) | 0.0 [0.0, 0.0] |
| 15.3 Elective or emergency CS not specified | 0 | 0 | Mean Difference (IV, Fixed, 95% CI) | 0.0 [0.0, 0.0] |
| 16 Apgar < 7 at 5 minutes | 0 | 0 | Risk Ratio (M‐H, Fixed, 95% CI) | 0.0 [0.0, 0.0] |
| 16.1 Elective CS | 0 | 0 | Risk Ratio (M‐H, Fixed, 95% CI) | 0.0 [0.0, 0.0] |
| 16.2 Emergency CS | 0 | 0 | Risk Ratio (M‐H, Fixed, 95% CI) | 0.0 [0.0, 0.0] |
| 16.3 Elective or emergency CS not specified | 0 | 0 | Risk Ratio (M‐H, Fixed, 95% CI) | 0.0 [0.0, 0.0] |
| 17 Neonatal assessment scores | 0 | 0 | Std. Mean Difference (IV, Fixed, 95% CI) | 0.0 [0.0, 0.0] |
| 17.1 Elective CS | 0 | 0 | Std. Mean Difference (IV, Fixed, 95% CI) | 0.0 [0.0, 0.0] |
| 17.2 Emergency CS | 0 | 0 | Std. Mean Difference (IV, Fixed, 95% CI) | 0.0 [0.0, 0.0] |
| 17.3 Elective or emergency CS not specified | 0 | 0 | Std. Mean Difference (IV, Fixed, 95% CI) | 0.0 [0.0, 0.0] |
| 18 Admission to NICU | 0 | 0 | Risk Ratio (M‐H, Fixed, 95% CI) | 0.0 [0.0, 0.0] |
| 18.1 Elective CS | 0 | 0 | Risk Ratio (M‐H, Fixed, 95% CI) | 0.0 [0.0, 0.0] |
| 18.2 Emergency CS | 0 | 0 | Risk Ratio (M‐H, Fixed, 95% CI) | 0.0 [0.0, 0.0] |
| 18.3 Elective or emergency CS not specified | 0 | 0 | Risk Ratio (M‐H, Fixed, 95% CI) | 0.0 [0.0, 0.0] |
| 19 Initiation of breastfeeding | 0 | 0 | Risk Ratio (M‐H, Fixed, 95% CI) | 0.0 [0.0, 0.0] |
| 19.1 Elective CS | 0 | 0 | Risk Ratio (M‐H, Fixed, 95% CI) | 0.0 [0.0, 0.0] |
| 19.2 Emergency CS | 0 | 0 | Risk Ratio (M‐H, Fixed, 95% CI) | 0.0 [0.0, 0.0] |
| 19.3 Elective or emergency CS not specified | 0 | 0 | Risk Ratio (M‐H, Fixed, 95% CI) | 0.0 [0.0, 0.0] |
| 20 Duration of breastfeeding | 0 | 0 | Std. Mean Difference (IV, Fixed, 95% CI) | 0.0 [0.0, 0.0] |
| 20.1 Elective CS | 0 | 0 | Std. Mean Difference (IV, Fixed, 95% CI) | 0.0 [0.0, 0.0] |
| 20.2 Emergency CS | 0 | 0 | Std. Mean Difference (IV, Fixed, 95% CI) | 0.0 [0.0, 0.0] |
| 20.3 Elective or emergency CS not specified | 0 | 0 | Std. Mean Difference (IV, Fixed, 95% CI) | 0.0 [0.0, 0.0] |
| 21 Intragastric pH > 2.5 at extubation | 0 | 0 | Risk Ratio (M‐H, Fixed, 95% CI) | 0.0 [0.0, 0.0] |
| 21.1 Elective CS | 0 | 0 | Risk Ratio (M‐H, Fixed, 95% CI) | 0.0 [0.0, 0.0] |
| 21.2 Emergency CS | 0 | 0 | Risk Ratio (M‐H, Fixed, 95% CI) | 0.0 [0.0, 0.0] |
| 21.3 Elective or emergency CS not specified | 0 | 0 | Risk Ratio (M‐H, Fixed, 95% CI) | 0.0 [0.0, 0.0] |
| 22 Intragastric volume < 0.4 mL/kg at extubation | 0 | 0 | Risk Ratio (M‐H, Fixed, 95% CI) | 0.0 [0.0, 0.0] |
| 22.1 Elective CS | 0 | 0 | Risk Ratio (M‐H, Fixed, 95% CI) | 0.0 [0.0, 0.0] |
| 22.2 Emergency CS | 0 | 0 | Risk Ratio (M‐H, Fixed, 95% CI) | 0.0 [0.0, 0.0] |
| 22.3 Elective or emergency CS not specified | 0 | 0 | Risk Ratio (M‐H, Fixed, 95% CI) | 0.0 [0.0, 0.0] |
Comparison 10. H2 antagonists versus proton pump antagonists.
| Outcome or subgroup title | No. of studies | No. of participants | Statistical method | Effect size |
|---|---|---|---|---|
| 1 Mortality due to aspiration pneumonitis | 0 | 0 | Risk Ratio (M‐H, Fixed, 95% CI) | 0.0 [0.0, 0.0] |
| 1.1 Elective CS | 0 | 0 | Risk Ratio (M‐H, Fixed, 95% CI) | 0.0 [0.0, 0.0] |
| 1.2 Emergency CS | 0 | 0 | Risk Ratio (M‐H, Fixed, 95% CI) | 0.0 [0.0, 0.0] |
| 1.3 Elective or emergency CS not specified | 0 | 0 | Risk Ratio (M‐H, Fixed, 95% CI) | 0.0 [0.0, 0.0] |
| 2 Morbidity due to aspiration pneumonitis | 0 | 0 | Risk Ratio (M‐H, Fixed, 95% CI) | 0.0 [0.0, 0.0] |
| 2.1 Elective CS | 0 | 0 | Risk Ratio (M‐H, Fixed, 95% CI) | 0.0 [0.0, 0.0] |
| 2.2 Emergency CS | 0 | 0 | Risk Ratio (M‐H, Fixed, 95% CI) | 0.0 [0.0, 0.0] |
| 2.3 Elective or emergency CS not specified | 0 | 0 | Risk Ratio (M‐H, Fixed, 95% CI) | 0.0 [0.0, 0.0] |
| 3 Intragastric pH < 2.5 at intubation | 1 | 120 | Risk Ratio (M‐H, Fixed, 95% CI) | 0.39 [0.16, 0.97] |
| 3.1 Elective CS | 1 | 120 | Risk Ratio (M‐H, Fixed, 95% CI) | 0.39 [0.16, 0.97] |
| 3.2 Emergency CS | 0 | 0 | Risk Ratio (M‐H, Fixed, 95% CI) | 0.0 [0.0, 0.0] |
| 3.3 Elective or emergency CS not specified | 0 | 0 | Risk Ratio (M‐H, Fixed, 95% CI) | 0.0 [0.0, 0.0] |
| 4 Intragastric volume < 0.4 mL/kg at intubation | 1 | 120 | Risk Ratio (M‐H, Fixed, 95% CI) | 1.18 [1.03, 1.35] |
| 4.1 Elective CS | 1 | 120 | Risk Ratio (M‐H, Fixed, 95% CI) | 1.18 [1.03, 1.35] |
| 4.2 Emergency CS | 0 | 0 | Risk Ratio (M‐H, Fixed, 95% CI) | 0.0 [0.0, 0.0] |
| 4.3 Elective or emergency CS not specified | 0 | 0 | Risk Ratio (M‐H, Fixed, 95% CI) | 0.0 [0.0, 0.0] |
| 5 Nausea | 0 | 0 | Risk Ratio (M‐H, Fixed, 95% CI) | 0.0 [0.0, 0.0] |
| 5.1 Elective CS | 0 | 0 | Risk Ratio (M‐H, Fixed, 95% CI) | 0.0 [0.0, 0.0] |
| 5.2 Emergency CS | 0 | 0 | Risk Ratio (M‐H, Fixed, 95% CI) | 0.0 [0.0, 0.0] |
| 5.3 Elective or emergency CS not specified | 0 | 0 | Risk Ratio (M‐H, Fixed, 95% CI) | 0.0 [0.0, 0.0] |
| 6 Vomiting | 0 | 0 | Risk Ratio (M‐H, Fixed, 95% CI) | 0.0 [0.0, 0.0] |
| 6.1 Elective CS | 0 | 0 | Risk Ratio (M‐H, Fixed, 95% CI) | 0.0 [0.0, 0.0] |
| 6.2 Emergency CS | 0 | 0 | Risk Ratio (M‐H, Fixed, 95% CI) | 0.0 [0.0, 0.0] |
| 6.3 Elective or emergency CS not specified | 0 | 0 | Risk Ratio (M‐H, Fixed, 95% CI) | 0.0 [0.0, 0.0] |
| 7 Sedation | 0 | 0 | Risk Ratio (M‐H, Fixed, 95% CI) | 0.0 [0.0, 0.0] |
| 7.1 Elective CS | 0 | 0 | Risk Ratio (M‐H, Fixed, 95% CI) | 0.0 [0.0, 0.0] |
| 7.2 Emergency CS | 0 | 0 | Risk Ratio (M‐H, Fixed, 95% CI) | 0.0 [0.0, 0.0] |
| 7.3 Elective or emergency CS not specified | 0 | 0 | Risk Ratio (M‐H, Fixed, 95% CI) | 0.0 [0.0, 0.0] |
| 8 Restlessness | 0 | 0 | Risk Ratio (M‐H, Fixed, 95% CI) | 0.0 [0.0, 0.0] |
| 8.1 Elective CS | 0 | 0 | Risk Ratio (M‐H, Fixed, 95% CI) | 0.0 [0.0, 0.0] |
| 8.2 Emergency CS | 0 | 0 | Risk Ratio (M‐H, Fixed, 95% CI) | 0.0 [0.0, 0.0] |
| 8.3 Elective or emergency CS not specified | 0 | 0 | Risk Ratio (M‐H, Fixed, 95% CI) | 0.0 [0.0, 0.0] |
| 9 Dystonic reactions | 0 | 0 | Risk Ratio (M‐H, Fixed, 95% CI) | 0.0 [0.0, 0.0] |
| 9.1 Elective CS | 0 | 0 | Risk Ratio (M‐H, Fixed, 95% CI) | 0.0 [0.0, 0.0] |
| 9.2 Emergency CS | 0 | 0 | Risk Ratio (M‐H, Fixed, 95% CI) | 0.0 [0.0, 0.0] |
| 9.3 Elective or emergency CS not specified | 0 | 0 | Risk Ratio (M‐H, Fixed, 95% CI) | 0.0 [0.0, 0.0] |
| 10 Extrapyramidal symptoms | 0 | 0 | Risk Ratio (M‐H, Fixed, 95% CI) | 0.0 [0.0, 0.0] |
| 10.1 Elective CS | 0 | 0 | Risk Ratio (M‐H, Fixed, 95% CI) | 0.0 [0.0, 0.0] |
| 10.2 Emergency CS | 0 | 0 | Risk Ratio (M‐H, Fixed, 95% CI) | 0.0 [0.0, 0.0] |
| 10.3 Elective or emergency CS not specified | 0 | 0 | Risk Ratio (M‐H, Fixed, 95% CI) | 0.0 [0.0, 0.0] |
| 11 Hypotension | 0 | 0 | Risk Ratio (M‐H, Fixed, 95% CI) | 0.0 [0.0, 0.0] |
| 11.1 Elective CS | 0 | 0 | Risk Ratio (M‐H, Fixed, 95% CI) | 0.0 [0.0, 0.0] |
| 11.2 Emergency CS | 0 | 0 | Risk Ratio (M‐H, Fixed, 95% CI) | 0.0 [0.0, 0.0] |
| 11.3 Elective or emergency CS not specified | 0 | 0 | Risk Ratio (M‐H, Fixed, 95% CI) | 0.0 [0.0, 0.0] |
| 12 Blood loss | 0 | 0 | Std. Mean Difference (IV, Fixed, 95% CI) | 0.0 [0.0, 0.0] |
| 12.1 Elective CS | 0 | 0 | Std. Mean Difference (IV, Fixed, 95% CI) | 0.0 [0.0, 0.0] |
| 12.2 Emergency CS | 0 | 0 | Std. Mean Difference (IV, Fixed, 95% CI) | 0.0 [0.0, 0.0] |
| 12.3 Elective or emergency CS not specified | 0 | 0 | Std. Mean Difference (IV, Fixed, 95% CI) | 0.0 [0.0, 0.0] |
| 13 Atonic uterus | 0 | 0 | Risk Ratio (M‐H, Fixed, 95% CI) | 0.0 [0.0, 0.0] |
| 13.1 Elective CS | 0 | 0 | Risk Ratio (M‐H, Fixed, 95% CI) | 0.0 [0.0, 0.0] |
| 13.2 Emergency CS | 0 | 0 | Risk Ratio (M‐H, Fixed, 95% CI) | 0.0 [0.0, 0.0] |
| 13.3 Elective or emergency CS not specified | 0 | 0 | Risk Ratio (M‐H, Fixed, 95% CI) | 0.0 [0.0, 0.0] |
| 14 Women's satisfaction | 0 | 0 | Std. Mean Difference (IV, Fixed, 95% CI) | 0.0 [0.0, 0.0] |
| 14.1 Elective CS | 0 | 0 | Std. Mean Difference (IV, Fixed, 95% CI) | 0.0 [0.0, 0.0] |
| 14.2 Emergency CS | 0 | 0 | Std. Mean Difference (IV, Fixed, 95% CI) | 0.0 [0.0, 0.0] |
| 14.3 Elective or emergency CS not specified | 0 | 0 | Std. Mean Difference (IV, Fixed, 95% CI) | 0.0 [0.0, 0.0] |
| 15 Cord blood pH | 0 | 0 | Mean Difference (IV, Fixed, 95% CI) | 0.0 [0.0, 0.0] |
| 15.1 Elective CS | 0 | 0 | Mean Difference (IV, Fixed, 95% CI) | 0.0 [0.0, 0.0] |
| 15.2 Emergency CS | 0 | 0 | Mean Difference (IV, Fixed, 95% CI) | 0.0 [0.0, 0.0] |
| 15.3 Elective or emergency CS not specified | 0 | 0 | Mean Difference (IV, Fixed, 95% CI) | 0.0 [0.0, 0.0] |
| 16 Apgar < 7 at 5 minutes | 0 | 0 | Risk Ratio (M‐H, Fixed, 95% CI) | 0.0 [0.0, 0.0] |
| 16.1 Elective CS | 0 | 0 | Risk Ratio (M‐H, Fixed, 95% CI) | 0.0 [0.0, 0.0] |
| 16.2 Emergency CS | 0 | 0 | Risk Ratio (M‐H, Fixed, 95% CI) | 0.0 [0.0, 0.0] |
| 16.3 Elective or emergency CS not specified | 0 | 0 | Risk Ratio (M‐H, Fixed, 95% CI) | 0.0 [0.0, 0.0] |
| 17 Neonatal assessment scores | 0 | 0 | Std. Mean Difference (IV, Fixed, 95% CI) | 0.0 [0.0, 0.0] |
| 17.1 Elective CS | 0 | 0 | Std. Mean Difference (IV, Fixed, 95% CI) | 0.0 [0.0, 0.0] |
| 17.2 Emergency CS | 0 | 0 | Std. Mean Difference (IV, Fixed, 95% CI) | 0.0 [0.0, 0.0] |
| 17.3 Elective or emergency CS not specified | 0 | 0 | Std. Mean Difference (IV, Fixed, 95% CI) | 0.0 [0.0, 0.0] |
| 18 Admission to NICU | 0 | 0 | Risk Ratio (M‐H, Fixed, 95% CI) | 0.0 [0.0, 0.0] |
| 18.1 Elective CS | 0 | 0 | Risk Ratio (M‐H, Fixed, 95% CI) | 0.0 [0.0, 0.0] |
| 18.2 Emergency CS | 0 | 0 | Risk Ratio (M‐H, Fixed, 95% CI) | 0.0 [0.0, 0.0] |
| 18.3 Elective or emergency CS not specified | 0 | 0 | Risk Ratio (M‐H, Fixed, 95% CI) | 0.0 [0.0, 0.0] |
| 19 Initiation of breastfeeding | 0 | 0 | Risk Ratio (M‐H, Fixed, 95% CI) | 0.0 [0.0, 0.0] |
| 19.1 Elective CS | 0 | 0 | Risk Ratio (M‐H, Fixed, 95% CI) | 0.0 [0.0, 0.0] |
| 19.2 Emergency CS | 0 | 0 | Risk Ratio (M‐H, Fixed, 95% CI) | 0.0 [0.0, 0.0] |
| 19.3 Elective or emergency CS not specified | 0 | 0 | Risk Ratio (M‐H, Fixed, 95% CI) | 0.0 [0.0, 0.0] |
| 20 Duration of breastfeeding | 0 | 0 | Std. Mean Difference (IV, Fixed, 95% CI) | 0.0 [0.0, 0.0] |
| 20.1 Elective CS | 0 | 0 | Std. Mean Difference (IV, Fixed, 95% CI) | 0.0 [0.0, 0.0] |
| 20.2 Emergency CS | 0 | 0 | Std. Mean Difference (IV, Fixed, 95% CI) | 0.0 [0.0, 0.0] |
| 20.3 Elective or emergency CS not specified | 0 | 0 | Std. Mean Difference (IV, Fixed, 95% CI) | 0.0 [0.0, 0.0] |
| 21 Intragastric pH > 2.5 at extubation | 0 | 0 | Risk Ratio (M‐H, Fixed, 95% CI) | 0.0 [0.0, 0.0] |
| 21.1 Elective CS | 0 | 0 | Risk Ratio (M‐H, Fixed, 95% CI) | 0.0 [0.0, 0.0] |
| 21.2 Emergency CS | 0 | 0 | Risk Ratio (M‐H, Fixed, 95% CI) | 0.0 [0.0, 0.0] |
| 21.3 Elective or emergency CS not specified | 0 | 0 | Risk Ratio (M‐H, Fixed, 95% CI) | 0.0 [0.0, 0.0] |
| 22 Intragastric volume < 0.4 mL/kg at extubation | 0 | 0 | Risk Ratio (M‐H, Fixed, 95% CI) | 0.0 [0.0, 0.0] |
| 22.1 Elective CS | 0 | 0 | Risk Ratio (M‐H, Fixed, 95% CI) | 0.0 [0.0, 0.0] |
| 22.2 Emergency CS | 0 | 0 | Risk Ratio (M‐H, Fixed, 95% CI) | 0.0 [0.0, 0.0] |
| 22.3 Elective or emergency CS not specified | 0 | 0 | Risk Ratio (M‐H, Fixed, 95% CI) | 0.0 [0.0, 0.0] |
| 23 At risk of aspiration (not pre‐specified) | 4 | 323 | Risk Ratio (M‐H, Random, 95% CI) | 0.93 [0.20, 4.37] |
| 23.1 Elective CS | 2 | 141 | Risk Ratio (M‐H, Random, 95% CI) | 0.79 [0.03, 23.67] |
| 23.2 Emergency CS | 2 | 182 | Risk Ratio (M‐H, Random, 95% CI) | 1.04 [0.13, 8.32] |
| 23.3 Elective or emergency CS not specified | 0 | 0 | Risk Ratio (M‐H, Random, 95% CI) | 0.0 [0.0, 0.0] |
| 24 Gastric pH post intubation (not pre‐specified) | 1 | 80 | Mean Difference (IV, Fixed, 95% CI) | ‐0.68 [‐1.28, ‐0.08] |
| 24.1 Elective CS | 0 | 0 | Mean Difference (IV, Fixed, 95% CI) | 0.0 [0.0, 0.0] |
| 24.2 Emergency CS | 1 | 80 | Mean Difference (IV, Fixed, 95% CI) | ‐0.68 [‐1.28, ‐0.08] |
| 24.3 Emergency and elective CS not specified | 0 | 0 | Mean Difference (IV, Fixed, 95% CI) | 0.0 [0.0, 0.0] |
| 25 Gastric volume post intubation (not pre‐specified) | 1 | 80 | Mean Difference (IV, Fixed, 95% CI) | 2.35 [‐0.79, 5.49] |
| 25.1 Elective CS | 0 | 0 | Mean Difference (IV, Fixed, 95% CI) | 0.0 [0.0, 0.0] |
| 25.2 Emergency CS | 1 | 80 | Mean Difference (IV, Fixed, 95% CI) | 2.35 [‐0.79, 5.49] |
| 25.3 Emergency and elective CS not specified | 0 | 0 | Mean Difference (IV, Fixed, 95% CI) | 0.0 [0.0, 0.0] |
| 26 Gastric pH pre extubation (not pre‐specified) | 1 | 80 | Mean Difference (IV, Fixed, 95% CI) | ‐0.65 [‐1.22, ‐0.08] |
| 26.1 Elective CS | 0 | 0 | Mean Difference (IV, Fixed, 95% CI) | 0.0 [0.0, 0.0] |
| 26.2 Emergency CS | 1 | 80 | Mean Difference (IV, Fixed, 95% CI) | ‐0.65 [‐1.22, ‐0.08] |
| 26.3 Emergency and elective CS not specified | 0 | 0 | Mean Difference (IV, Fixed, 95% CI) | 0.0 [0.0, 0.0] |
| 27 Gastric volume post extubation (not pre‐specified) | 1 | 80 | Mean Difference (IV, Fixed, 95% CI) | ‐1.08 [‐2.47, 0.31] |
| 27.1 Elective CS | 0 | 0 | Mean Difference (IV, Fixed, 95% CI) | 0.0 [0.0, 0.0] |
| 27.2 Emergency CS | 1 | 80 | Mean Difference (IV, Fixed, 95% CI) | ‐1.08 [‐2.47, 0.31] |
| 27.3 Emergency and elective CS not specified | 0 | 0 | Mean Difference (IV, Fixed, 95% CI) | 0.0 [0.0, 0.0] |
10.4. Analysis.
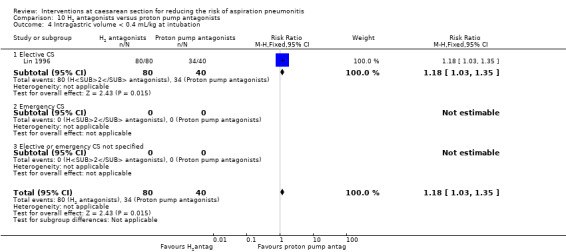
Comparison 10 H2 antagonists versus proton pump antagonists, Outcome 4 Intragastric volume < 0.4 mL/kg at intubation.
10.24. Analysis.
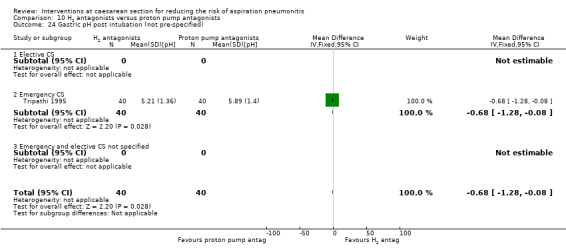
Comparison 10 H2 antagonists versus proton pump antagonists, Outcome 24 Gastric pH post intubation (not pre‐specified).
10.25. Analysis.
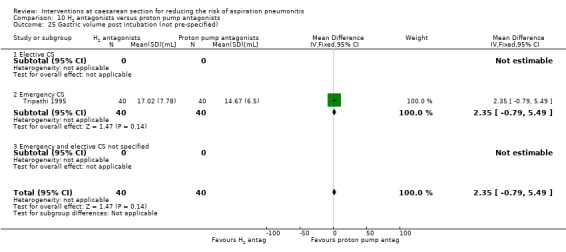
Comparison 10 H2 antagonists versus proton pump antagonists, Outcome 25 Gastric volume post intubation (not pre‐specified).
10.26. Analysis.
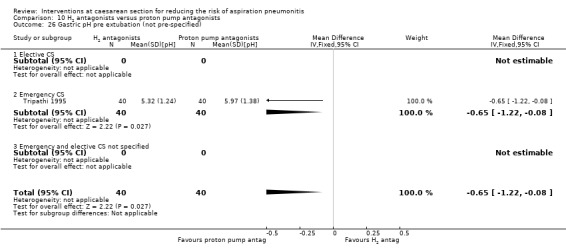
Comparison 10 H2 antagonists versus proton pump antagonists, Outcome 26 Gastric pH pre extubation (not pre‐specified).
10.27. Analysis.

Comparison 10 H2 antagonists versus proton pump antagonists, Outcome 27 Gastric volume post extubation (not pre‐specified).
Comparison 11. Antacids + H2 antagonists versus antacids.
| Outcome or subgroup title | No. of studies | No. of participants | Statistical method | Effect size |
|---|---|---|---|---|
| 1 Mortality due to aspiration pneumonitis | 0 | 0 | Risk Ratio (M‐H, Fixed, 95% CI) | 0.0 [0.0, 0.0] |
| 1.1 Elective CS | 0 | 0 | Risk Ratio (M‐H, Fixed, 95% CI) | 0.0 [0.0, 0.0] |
| 1.2 Emergency CS | 0 | 0 | Risk Ratio (M‐H, Fixed, 95% CI) | 0.0 [0.0, 0.0] |
| 1.3 Elective or emergency CS not specified | 0 | 0 | Risk Ratio (M‐H, Fixed, 95% CI) | 0.0 [0.0, 0.0] |
| 2 Morbidity due to aspiration pneumonitis | 0 | 0 | Risk Ratio (M‐H, Fixed, 95% CI) | 0.0 [0.0, 0.0] |
| 2.1 Elective CS | 0 | 0 | Risk Ratio (M‐H, Fixed, 95% CI) | 0.0 [0.0, 0.0] |
| 2.2 Emergency CS | 0 | 0 | Risk Ratio (M‐H, Fixed, 95% CI) | 0.0 [0.0, 0.0] |
| 2.3 Elective or emergency CS not specified | 0 | 0 | Risk Ratio (M‐H, Fixed, 95% CI) | 0.0 [0.0, 0.0] |
| 3 Intragastric pH < 2.5 at intubation | 1 | 119 | Risk Ratio (M‐H, Fixed, 95% CI) | 0.12 [0.02, 0.92] |
| 3.1 Elective CS | 0 | 0 | Risk Ratio (M‐H, Fixed, 95% CI) | 0.0 [0.0, 0.0] |
| 3.2 Emergency CS | 0 | 0 | Risk Ratio (M‐H, Fixed, 95% CI) | 0.0 [0.0, 0.0] |
| 3.3 Elective or emergency CS not specified | 1 | 119 | Risk Ratio (M‐H, Fixed, 95% CI) | 0.12 [0.02, 0.92] |
| 4 Intragastric volume < 0.4 mL/kg at intubation | 0 | 0 | Risk Ratio (M‐H, Fixed, 95% CI) | 0.0 [0.0, 0.0] |
| 4.1 Elective CS | 0 | 0 | Risk Ratio (M‐H, Fixed, 95% CI) | 0.0 [0.0, 0.0] |
| 4.2 Emergency CS | 0 | 0 | Risk Ratio (M‐H, Fixed, 95% CI) | 0.0 [0.0, 0.0] |
| 4.3 Elective or emergency CS not specified | 0 | 0 | Risk Ratio (M‐H, Fixed, 95% CI) | 0.0 [0.0, 0.0] |
| 5 Nausea | 0 | 0 | Risk Ratio (M‐H, Fixed, 95% CI) | 0.0 [0.0, 0.0] |
| 5.1 Elective CS | 0 | 0 | Risk Ratio (M‐H, Fixed, 95% CI) | 0.0 [0.0, 0.0] |
| 5.2 Emergency CS | 0 | 0 | Risk Ratio (M‐H, Fixed, 95% CI) | 0.0 [0.0, 0.0] |
| 5.3 Elective or emergency CS not specified | 0 | 0 | Risk Ratio (M‐H, Fixed, 95% CI) | 0.0 [0.0, 0.0] |
| 6 Vomiting | 0 | 0 | Risk Ratio (M‐H, Fixed, 95% CI) | 0.0 [0.0, 0.0] |
| 6.1 Elective CS | 0 | 0 | Risk Ratio (M‐H, Fixed, 95% CI) | 0.0 [0.0, 0.0] |
| 6.2 Emergency CS | 0 | 0 | Risk Ratio (M‐H, Fixed, 95% CI) | 0.0 [0.0, 0.0] |
| 6.3 Elective or emergency CS not specified | 0 | 0 | Risk Ratio (M‐H, Fixed, 95% CI) | 0.0 [0.0, 0.0] |
| 7 Sedation | 0 | 0 | Risk Ratio (M‐H, Fixed, 95% CI) | 0.0 [0.0, 0.0] |
| 7.1 Elective CS | 0 | 0 | Risk Ratio (M‐H, Fixed, 95% CI) | 0.0 [0.0, 0.0] |
| 7.2 Emergency CS | 0 | 0 | Risk Ratio (M‐H, Fixed, 95% CI) | 0.0 [0.0, 0.0] |
| 7.3 Elective or emergency CS not specified | 0 | 0 | Risk Ratio (M‐H, Fixed, 95% CI) | 0.0 [0.0, 0.0] |
| 8 Restlessness | 0 | 0 | Risk Ratio (M‐H, Fixed, 95% CI) | 0.0 [0.0, 0.0] |
| 8.1 Elective CS | 0 | 0 | Risk Ratio (M‐H, Fixed, 95% CI) | 0.0 [0.0, 0.0] |
| 8.2 Emergency CS | 0 | 0 | Risk Ratio (M‐H, Fixed, 95% CI) | 0.0 [0.0, 0.0] |
| 8.3 Elective or emergency CS not specified | 0 | 0 | Risk Ratio (M‐H, Fixed, 95% CI) | 0.0 [0.0, 0.0] |
| 9 Dystonic reactions | 0 | 0 | Risk Ratio (M‐H, Fixed, 95% CI) | 0.0 [0.0, 0.0] |
| 9.1 Elective CS | 0 | 0 | Risk Ratio (M‐H, Fixed, 95% CI) | 0.0 [0.0, 0.0] |
| 9.2 Emergency CS | 0 | 0 | Risk Ratio (M‐H, Fixed, 95% CI) | 0.0 [0.0, 0.0] |
| 9.3 Elective or emergency CS not specified | 0 | 0 | Risk Ratio (M‐H, Fixed, 95% CI) | 0.0 [0.0, 0.0] |
| 10 Extrapyramidal symptoms | 0 | 0 | Risk Ratio (M‐H, Fixed, 95% CI) | 0.0 [0.0, 0.0] |
| 10.1 Elective CS | 0 | 0 | Risk Ratio (M‐H, Fixed, 95% CI) | 0.0 [0.0, 0.0] |
| 10.2 Emergency CS | 0 | 0 | Risk Ratio (M‐H, Fixed, 95% CI) | 0.0 [0.0, 0.0] |
| 10.3 Elective or emergency CS not specified | 0 | 0 | Risk Ratio (M‐H, Fixed, 95% CI) | 0.0 [0.0, 0.0] |
| 11 Hypotension | 0 | 0 | Risk Ratio (M‐H, Fixed, 95% CI) | 0.0 [0.0, 0.0] |
| 11.1 Elective CS | 0 | 0 | Risk Ratio (M‐H, Fixed, 95% CI) | 0.0 [0.0, 0.0] |
| 11.2 Emergency CS | 0 | 0 | Risk Ratio (M‐H, Fixed, 95% CI) | 0.0 [0.0, 0.0] |
| 11.3 Elective or emergency CS not specified | 0 | 0 | Risk Ratio (M‐H, Fixed, 95% CI) | 0.0 [0.0, 0.0] |
| 12 Blood loss | 0 | 0 | Std. Mean Difference (IV, Fixed, 95% CI) | 0.0 [0.0, 0.0] |
| 12.1 Elective CS | 0 | 0 | Std. Mean Difference (IV, Fixed, 95% CI) | 0.0 [0.0, 0.0] |
| 12.2 Emergency CS | 0 | 0 | Std. Mean Difference (IV, Fixed, 95% CI) | 0.0 [0.0, 0.0] |
| 12.3 Elective or emergency CS not specified | 0 | 0 | Std. Mean Difference (IV, Fixed, 95% CI) | 0.0 [0.0, 0.0] |
| 13 Atonic uterus | 0 | 0 | Risk Ratio (M‐H, Fixed, 95% CI) | 0.0 [0.0, 0.0] |
| 13.1 Elective CS | 0 | 0 | Risk Ratio (M‐H, Fixed, 95% CI) | 0.0 [0.0, 0.0] |
| 13.2 Emergency CS | 0 | 0 | Risk Ratio (M‐H, Fixed, 95% CI) | 0.0 [0.0, 0.0] |
| 13.3 Elective or emergency CS not specified | 0 | 0 | Risk Ratio (M‐H, Fixed, 95% CI) | 0.0 [0.0, 0.0] |
| 14 Women's satisfaction | 0 | 0 | Std. Mean Difference (IV, Fixed, 95% CI) | 0.0 [0.0, 0.0] |
| 14.1 Elective CS | 0 | 0 | Std. Mean Difference (IV, Fixed, 95% CI) | 0.0 [0.0, 0.0] |
| 14.2 Emergency CS | 0 | 0 | Std. Mean Difference (IV, Fixed, 95% CI) | 0.0 [0.0, 0.0] |
| 14.3 Elective or emergency CS not specified | 0 | 0 | Std. Mean Difference (IV, Fixed, 95% CI) | 0.0 [0.0, 0.0] |
| 15 Cord blood pH | 0 | 0 | Mean Difference (IV, Fixed, 95% CI) | 0.0 [0.0, 0.0] |
| 15.1 Elective CS | 0 | 0 | Mean Difference (IV, Fixed, 95% CI) | 0.0 [0.0, 0.0] |
| 15.2 Emergency CS | 0 | 0 | Mean Difference (IV, Fixed, 95% CI) | 0.0 [0.0, 0.0] |
| 15.3 Elective or emergency CS not specified | 0 | 0 | Mean Difference (IV, Fixed, 95% CI) | 0.0 [0.0, 0.0] |
| 16 Apgar < 7 at 5 minutes | 0 | 0 | Risk Ratio (M‐H, Fixed, 95% CI) | 0.0 [0.0, 0.0] |
| 16.1 Elective CS | 0 | 0 | Risk Ratio (M‐H, Fixed, 95% CI) | 0.0 [0.0, 0.0] |
| 16.2 Emergency CS | 0 | 0 | Risk Ratio (M‐H, Fixed, 95% CI) | 0.0 [0.0, 0.0] |
| 16.3 Elective or emergency CS not specified | 0 | 0 | Risk Ratio (M‐H, Fixed, 95% CI) | 0.0 [0.0, 0.0] |
| 17 Neonatal assessment scores | 0 | 0 | Std. Mean Difference (IV, Fixed, 95% CI) | 0.0 [0.0, 0.0] |
| 17.1 Elective CS | 0 | 0 | Std. Mean Difference (IV, Fixed, 95% CI) | 0.0 [0.0, 0.0] |
| 17.2 Emergency CS | 0 | 0 | Std. Mean Difference (IV, Fixed, 95% CI) | 0.0 [0.0, 0.0] |
| 17.3 Elective or emergency CS not specified | 0 | 0 | Std. Mean Difference (IV, Fixed, 95% CI) | 0.0 [0.0, 0.0] |
| 18 Admission to NICU | 0 | 0 | Risk Ratio (M‐H, Fixed, 95% CI) | 0.0 [0.0, 0.0] |
| 18.1 Elective CS | 0 | 0 | Risk Ratio (M‐H, Fixed, 95% CI) | 0.0 [0.0, 0.0] |
| 18.2 Emergency CS | 0 | 0 | Risk Ratio (M‐H, Fixed, 95% CI) | 0.0 [0.0, 0.0] |
| 18.3 Elective or emergency CS not specified | 0 | 0 | Risk Ratio (M‐H, Fixed, 95% CI) | 0.0 [0.0, 0.0] |
| 19 Initiation of breastfeeding | 0 | 0 | Risk Ratio (M‐H, Fixed, 95% CI) | 0.0 [0.0, 0.0] |
| 19.1 Elective CS | 0 | 0 | Risk Ratio (M‐H, Fixed, 95% CI) | 0.0 [0.0, 0.0] |
| 19.2 Emergency CS | 0 | 0 | Risk Ratio (M‐H, Fixed, 95% CI) | 0.0 [0.0, 0.0] |
| 19.3 Elective or emergency CS not specified | 0 | 0 | Risk Ratio (M‐H, Fixed, 95% CI) | 0.0 [0.0, 0.0] |
| 20 Duration of breastfeeding | 0 | 0 | Std. Mean Difference (IV, Fixed, 95% CI) | 0.0 [0.0, 0.0] |
| 20.1 Elective CS | 0 | 0 | Std. Mean Difference (IV, Fixed, 95% CI) | 0.0 [0.0, 0.0] |
| 20.2 Emergency CS | 0 | 0 | Std. Mean Difference (IV, Fixed, 95% CI) | 0.0 [0.0, 0.0] |
| 20.3 Elective or emergency CS not specified | 0 | 0 | Std. Mean Difference (IV, Fixed, 95% CI) | 0.0 [0.0, 0.0] |
| 21 Intragastric pH < 2.5 at extubation | 1 | 119 | Risk Ratio (M‐H, Fixed, 95% CI) | 0.16 [0.02, 1.28] |
| 21.1 Elective CS | 0 | 0 | Risk Ratio (M‐H, Fixed, 95% CI) | 0.0 [0.0, 0.0] |
| 21.2 Emergency CS | 0 | 0 | Risk Ratio (M‐H, Fixed, 95% CI) | 0.0 [0.0, 0.0] |
| 21.3 Elective or emergency CS not specified | 1 | 119 | Risk Ratio (M‐H, Fixed, 95% CI) | 0.16 [0.02, 1.28] |
| 22 Intragastric volume < 0.4 mL/kg at extubation | 0 | 0 | Risk Ratio (M‐H, Fixed, 95% CI) | 0.0 [0.0, 0.0] |
| 22.1 Elective CS | 0 | 0 | Risk Ratio (M‐H, Fixed, 95% CI) | 0.0 [0.0, 0.0] |
| 22.2 Emergency CS | 0 | 0 | Risk Ratio (M‐H, Fixed, 95% CI) | 0.0 [0.0, 0.0] |
| 22.3 Elective or emergency CS not specified | 0 | 0 | Risk Ratio (M‐H, Fixed, 95% CI) | 0.0 [0.0, 0.0] |
| 23 Post Intubation pH (not pre‐specified) | 2 | 672 | Mean Difference (IV, Random, 95% CI) | 0.43 [0.07, 0.79] |
| 23.1 Elective CS | 0 | 0 | Mean Difference (IV, Random, 95% CI) | 0.0 [0.0, 0.0] |
| 23.2 Emergency CS | 1 | 553 | Mean Difference (IV, Random, 95% CI) | 0.30 [0.14, 0.46] |
| 23.3 Emergency or Elective CS non specified | 1 | 119 | Mean Difference (IV, Random, 95% CI) | 0.69 [0.22, 1.16] |
| 24 Pre extubation pH (not pre‐specified) | 2 | 597 | Mean Difference (IV, Fixed, 95% CI) | 0.71 [0.53, 0.89] |
| 24.1 Elective CS | 0 | 0 | Mean Difference (IV, Fixed, 95% CI) | 0.0 [0.0, 0.0] |
| 24.2 Emergency CS | 1 | 478 | Mean Difference (IV, Fixed, 95% CI) | 0.70 [0.51, 0.89] |
| 24.3 Elective or emergency CS non specified | 1 | 119 | Mean Difference (IV, Fixed, 95% CI) | 0.80 [0.29, 1.31] |
| 25 Post intubation gastric volume (not pre‐specified) | 1 | 586 | Mean Difference (IV, Fixed, 95% CI) | ‐1.0 [‐8.75, 6.75] |
| 25.1 Elective CS | 0 | 0 | Mean Difference (IV, Fixed, 95% CI) | 0.0 [0.0, 0.0] |
| 25.2 Emergency CS | 1 | 586 | Mean Difference (IV, Fixed, 95% CI) | ‐1.0 [‐8.75, 6.75] |
| 25.3 Elective or emergency CS not specified | 0 | 0 | Mean Difference (IV, Fixed, 95% CI) | 0.0 [0.0, 0.0] |
| 26 Pre‐extubation gastric volume (not pre‐specified) | 1 | 568 | Mean Difference (IV, Fixed, 95% CI) | ‐2.0 [‐5.21, 1.21] |
| 26.1 Elective CS | 0 | 0 | Mean Difference (IV, Fixed, 95% CI) | 0.0 [0.0, 0.0] |
| 26.2 Emergency CS | 1 | 568 | Mean Difference (IV, Fixed, 95% CI) | ‐2.0 [‐5.21, 1.21] |
| 26.3 Elective or emergency CS not specified | 0 | 0 | Mean Difference (IV, Fixed, 95% CI) | 0.0 [0.0, 0.0] |
| 27 At risk of aspiration (not pre‐specified) | 1 | 595 | Risk Ratio (M‐H, Fixed, 95% CI) | 0.11 [0.03, 0.46] |
| 27.1 Elective CS | 0 | 0 | Risk Ratio (M‐H, Fixed, 95% CI) | 0.0 [0.0, 0.0] |
| 27.2 Emergency CS | 1 | 595 | Risk Ratio (M‐H, Fixed, 95% CI) | 0.11 [0.03, 0.46] |
| 27.3 Elective or emergency CS not specified | 0 | 0 | Risk Ratio (M‐H, Fixed, 95% CI) | 0.0 [0.0, 0.0] |
11.21. Analysis.
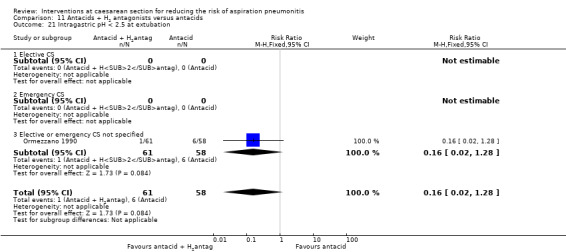
Comparison 11 Antacids + H2 antagonists versus antacids, Outcome 21 Intragastric pH < 2.5 at extubation.
11.23. Analysis.
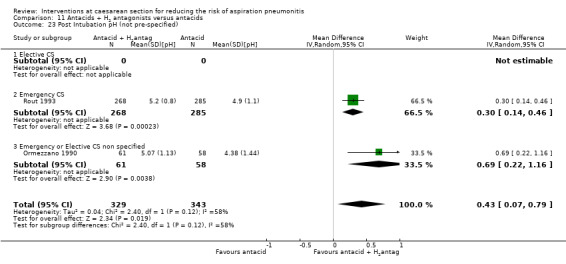
Comparison 11 Antacids + H2 antagonists versus antacids, Outcome 23 Post Intubation pH (not pre‐specified).
11.24. Analysis.
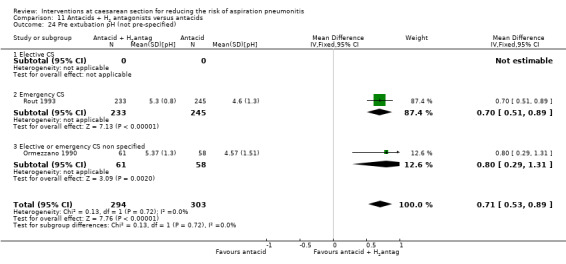
Comparison 11 Antacids + H2 antagonists versus antacids, Outcome 24 Pre extubation pH (not pre‐specified).
11.25. Analysis.
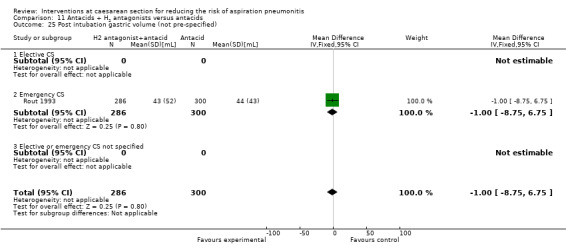
Comparison 11 Antacids + H2 antagonists versus antacids, Outcome 25 Post intubation gastric volume (not pre‐specified).
11.26. Analysis.

Comparison 11 Antacids + H2 antagonists versus antacids, Outcome 26 Pre‐extubation gastric volume (not pre‐specified).
Comparison 12. H2 antagonists + prokinetic drugs versus antacids.
| Outcome or subgroup title | No. of studies | No. of participants | Statistical method | Effect size |
|---|---|---|---|---|
| 1 Mortality due to aspiration pneumonitis | 0 | 0 | Risk Ratio (M‐H, Fixed, 95% CI) | 0.0 [0.0, 0.0] |
| 1.1 Elective CS | 0 | 0 | Risk Ratio (M‐H, Fixed, 95% CI) | 0.0 [0.0, 0.0] |
| 1.2 Emergency CS | 0 | 0 | Risk Ratio (M‐H, Fixed, 95% CI) | 0.0 [0.0, 0.0] |
| 1.3 Elective or emergency CS not specified | 0 | 0 | Risk Ratio (M‐H, Fixed, 95% CI) | 0.0 [0.0, 0.0] |
| 2 Morbidity due to aspiration pneumonitis | 0 | 0 | Risk Ratio (M‐H, Fixed, 95% CI) | 0.0 [0.0, 0.0] |
| 2.1 Elective CS | 0 | 0 | Risk Ratio (M‐H, Fixed, 95% CI) | 0.0 [0.0, 0.0] |
| 2.2 Emergency CS | 0 | 0 | Risk Ratio (M‐H, Fixed, 95% CI) | 0.0 [0.0, 0.0] |
| 2.3 Elective or emergency CS not specified | 0 | 0 | Risk Ratio (M‐H, Fixed, 95% CI) | 0.0 [0.0, 0.0] |
| 3 Intragastric pH > 2.5 at intubation | 0 | 0 | Risk Ratio (M‐H, Fixed, 95% CI) | 0.0 [0.0, 0.0] |
| 3.1 Elective CS | 0 | 0 | Risk Ratio (M‐H, Fixed, 95% CI) | 0.0 [0.0, 0.0] |
| 3.2 Emergency CS | 0 | 0 | Risk Ratio (M‐H, Fixed, 95% CI) | 0.0 [0.0, 0.0] |
| 3.3 Elective or emergency CS not specified | 0 | 0 | Risk Ratio (M‐H, Fixed, 95% CI) | 0.0 [0.0, 0.0] |
| 4 Intragastric volume < 0.4 mL/kg at intubation | 0 | 0 | Risk Ratio (M‐H, Fixed, 95% CI) | 0.0 [0.0, 0.0] |
| 4.1 Elective CS | 0 | 0 | Risk Ratio (M‐H, Fixed, 95% CI) | 0.0 [0.0, 0.0] |
| 4.2 Emergency CS | 0 | 0 | Risk Ratio (M‐H, Fixed, 95% CI) | 0.0 [0.0, 0.0] |
| 4.3 Elective or emergency CS not specified | 0 | 0 | Risk Ratio (M‐H, Fixed, 95% CI) | 0.0 [0.0, 0.0] |
| 5 Nausea | 0 | 0 | Risk Ratio (M‐H, Fixed, 95% CI) | 0.0 [0.0, 0.0] |
| 5.1 Elective CS | 0 | 0 | Risk Ratio (M‐H, Fixed, 95% CI) | 0.0 [0.0, 0.0] |
| 5.2 Emergency CS | 0 | 0 | Risk Ratio (M‐H, Fixed, 95% CI) | 0.0 [0.0, 0.0] |
| 5.3 Elective or emergency CS not specified | 0 | 0 | Risk Ratio (M‐H, Fixed, 95% CI) | 0.0 [0.0, 0.0] |
| 6 Vomiting | 0 | 0 | Risk Ratio (M‐H, Fixed, 95% CI) | 0.0 [0.0, 0.0] |
| 6.1 Elective CS | 0 | 0 | Risk Ratio (M‐H, Fixed, 95% CI) | 0.0 [0.0, 0.0] |
| 6.2 Emergency CS | 0 | 0 | Risk Ratio (M‐H, Fixed, 95% CI) | 0.0 [0.0, 0.0] |
| 6.3 Elective or emergency CS not specified | 0 | 0 | Risk Ratio (M‐H, Fixed, 95% CI) | 0.0 [0.0, 0.0] |
| 7 Sedation | 0 | 0 | Risk Ratio (M‐H, Fixed, 95% CI) | 0.0 [0.0, 0.0] |
| 7.1 Elective CS | 0 | 0 | Risk Ratio (M‐H, Fixed, 95% CI) | 0.0 [0.0, 0.0] |
| 7.2 Emergency CS | 0 | 0 | Risk Ratio (M‐H, Fixed, 95% CI) | 0.0 [0.0, 0.0] |
| 7.3 Elective or emergency CS not specified | 0 | 0 | Risk Ratio (M‐H, Fixed, 95% CI) | 0.0 [0.0, 0.0] |
| 8 Restlessness | 0 | 0 | Risk Ratio (M‐H, Fixed, 95% CI) | 0.0 [0.0, 0.0] |
| 8.1 Elective CS | 0 | 0 | Risk Ratio (M‐H, Fixed, 95% CI) | 0.0 [0.0, 0.0] |
| 8.2 Emergency CS | 0 | 0 | Risk Ratio (M‐H, Fixed, 95% CI) | 0.0 [0.0, 0.0] |
| 8.3 Elective or emergency CS not specified | 0 | 0 | Risk Ratio (M‐H, Fixed, 95% CI) | 0.0 [0.0, 0.0] |
| 9 Dystonic reactions | 0 | 0 | Risk Ratio (M‐H, Fixed, 95% CI) | 0.0 [0.0, 0.0] |
| 9.1 Elective CS | 0 | 0 | Risk Ratio (M‐H, Fixed, 95% CI) | 0.0 [0.0, 0.0] |
| 9.2 Emergency CS | 0 | 0 | Risk Ratio (M‐H, Fixed, 95% CI) | 0.0 [0.0, 0.0] |
| 9.3 Elective or emergency CS not specified | 0 | 0 | Risk Ratio (M‐H, Fixed, 95% CI) | 0.0 [0.0, 0.0] |
| 10 Extrapyramidal symptoms | 0 | 0 | Risk Ratio (M‐H, Fixed, 95% CI) | 0.0 [0.0, 0.0] |
| 10.1 Elective CS | 0 | 0 | Risk Ratio (M‐H, Fixed, 95% CI) | 0.0 [0.0, 0.0] |
| 10.2 Emergency CS | 0 | 0 | Risk Ratio (M‐H, Fixed, 95% CI) | 0.0 [0.0, 0.0] |
| 10.3 Elective or emergency CS not specified | 0 | 0 | Risk Ratio (M‐H, Fixed, 95% CI) | 0.0 [0.0, 0.0] |
| 11 Hypotension | 0 | 0 | Risk Ratio (M‐H, Fixed, 95% CI) | 0.0 [0.0, 0.0] |
| 11.1 Elective CS | 0 | 0 | Risk Ratio (M‐H, Fixed, 95% CI) | 0.0 [0.0, 0.0] |
| 11.2 Emergency CS | 0 | 0 | Risk Ratio (M‐H, Fixed, 95% CI) | 0.0 [0.0, 0.0] |
| 11.3 Elective or emergency CS not specified | 0 | 0 | Risk Ratio (M‐H, Fixed, 95% CI) | 0.0 [0.0, 0.0] |
| 12 Blood loss | 0 | 0 | Std. Mean Difference (IV, Fixed, 95% CI) | 0.0 [0.0, 0.0] |
| 12.1 Elective CS | 0 | 0 | Std. Mean Difference (IV, Fixed, 95% CI) | 0.0 [0.0, 0.0] |
| 12.2 Emergency CS | 0 | 0 | Std. Mean Difference (IV, Fixed, 95% CI) | 0.0 [0.0, 0.0] |
| 12.3 Elective or emergency CS not specified | 0 | 0 | Std. Mean Difference (IV, Fixed, 95% CI) | 0.0 [0.0, 0.0] |
| 13 Atonic uterus | 0 | 0 | Risk Ratio (M‐H, Fixed, 95% CI) | 0.0 [0.0, 0.0] |
| 13.1 Elective CS | 0 | 0 | Risk Ratio (M‐H, Fixed, 95% CI) | 0.0 [0.0, 0.0] |
| 13.2 Emergency CS | 0 | 0 | Risk Ratio (M‐H, Fixed, 95% CI) | 0.0 [0.0, 0.0] |
| 13.3 Elective or emergency CS not specified | 0 | 0 | Risk Ratio (M‐H, Fixed, 95% CI) | 0.0 [0.0, 0.0] |
| 14 Women's satisfaction | 0 | 0 | Std. Mean Difference (IV, Fixed, 95% CI) | 0.0 [0.0, 0.0] |
| 14.1 Elective CS | 0 | 0 | Std. Mean Difference (IV, Fixed, 95% CI) | 0.0 [0.0, 0.0] |
| 14.2 Emergency CS | 0 | 0 | Std. Mean Difference (IV, Fixed, 95% CI) | 0.0 [0.0, 0.0] |
| 14.3 Elective or emergency CS not specified | 0 | 0 | Std. Mean Difference (IV, Fixed, 95% CI) | 0.0 [0.0, 0.0] |
| 15 Cord blood pH | 0 | 0 | Mean Difference (IV, Fixed, 95% CI) | 0.0 [0.0, 0.0] |
| 15.1 Elective CS | 0 | 0 | Mean Difference (IV, Fixed, 95% CI) | 0.0 [0.0, 0.0] |
| 15.2 Emergency CS | 0 | 0 | Mean Difference (IV, Fixed, 95% CI) | 0.0 [0.0, 0.0] |
| 15.3 Elective or emergency CS not specified | 0 | 0 | Mean Difference (IV, Fixed, 95% CI) | 0.0 [0.0, 0.0] |
| 16 Apgar < 7 at 5 minutes | 0 | 0 | Risk Ratio (M‐H, Fixed, 95% CI) | 0.0 [0.0, 0.0] |
| 16.1 Elective CS | 0 | 0 | Risk Ratio (M‐H, Fixed, 95% CI) | 0.0 [0.0, 0.0] |
| 16.2 Emergency CS | 0 | 0 | Risk Ratio (M‐H, Fixed, 95% CI) | 0.0 [0.0, 0.0] |
| 16.3 Elective or emergency CS not specified | 0 | 0 | Risk Ratio (M‐H, Fixed, 95% CI) | 0.0 [0.0, 0.0] |
| 17 Neonatal assessment scores | 0 | 0 | Std. Mean Difference (IV, Fixed, 95% CI) | 0.0 [0.0, 0.0] |
| 17.1 Elective CS | 0 | 0 | Std. Mean Difference (IV, Fixed, 95% CI) | 0.0 [0.0, 0.0] |
| 17.2 Emergency CS | 0 | 0 | Std. Mean Difference (IV, Fixed, 95% CI) | 0.0 [0.0, 0.0] |
| 17.3 Elective or emergency CS not specified | 0 | 0 | Std. Mean Difference (IV, Fixed, 95% CI) | 0.0 [0.0, 0.0] |
| 18 Admission to NICU | 0 | 0 | Risk Ratio (M‐H, Fixed, 95% CI) | 0.0 [0.0, 0.0] |
| 18.1 Elective CS | 0 | 0 | Risk Ratio (M‐H, Fixed, 95% CI) | 0.0 [0.0, 0.0] |
| 18.2 Emergency CS | 0 | 0 | Risk Ratio (M‐H, Fixed, 95% CI) | 0.0 [0.0, 0.0] |
| 18.3 Elective or emergency CS not specified | 0 | 0 | Risk Ratio (M‐H, Fixed, 95% CI) | 0.0 [0.0, 0.0] |
| 19 Initiation of breastfeeding | 0 | 0 | Risk Ratio (M‐H, Fixed, 95% CI) | 0.0 [0.0, 0.0] |
| 19.1 Elective CS | 0 | 0 | Risk Ratio (M‐H, Fixed, 95% CI) | 0.0 [0.0, 0.0] |
| 19.2 Emergency CS | 0 | 0 | Risk Ratio (M‐H, Fixed, 95% CI) | 0.0 [0.0, 0.0] |
| 19.3 Elective or emergency CS not specified | 0 | 0 | Risk Ratio (M‐H, Fixed, 95% CI) | 0.0 [0.0, 0.0] |
| 20 Duration of breastfeeding | 0 | 0 | Std. Mean Difference (IV, Fixed, 95% CI) | 0.0 [0.0, 0.0] |
| 20.1 Elective CS | 0 | 0 | Std. Mean Difference (IV, Fixed, 95% CI) | 0.0 [0.0, 0.0] |
| 20.2 Emergency CS | 0 | 0 | Std. Mean Difference (IV, Fixed, 95% CI) | 0.0 [0.0, 0.0] |
| 20.3 Elective or emergency CS not specified | 0 | 0 | Std. Mean Difference (IV, Fixed, 95% CI) | 0.0 [0.0, 0.0] |
| 21 Intragastric pH > 2.5 at extubation | 0 | 0 | Risk Ratio (M‐H, Fixed, 95% CI) | 0.0 [0.0, 0.0] |
| 21.1 Elective CS | 0 | 0 | Risk Ratio (M‐H, Fixed, 95% CI) | 0.0 [0.0, 0.0] |
| 21.2 Emergency CS | 0 | 0 | Risk Ratio (M‐H, Fixed, 95% CI) | 0.0 [0.0, 0.0] |
| 21.3 Elective or emergency CS not specified | 0 | 0 | Risk Ratio (M‐H, Fixed, 95% CI) | 0.0 [0.0, 0.0] |
| 22 Intragastric volume < 0.4 mL/kg at extubation | 0 | 0 | Risk Ratio (M‐H, Fixed, 95% CI) | 0.0 [0.0, 0.0] |
| 22.1 Elective CS | 0 | 0 | Risk Ratio (M‐H, Fixed, 95% CI) | 0.0 [0.0, 0.0] |
| 22.2 Emergency CS | 0 | 0 | Risk Ratio (M‐H, Fixed, 95% CI) | 0.0 [0.0, 0.0] |
| 22.3 Elective or emergency CS not specified | 0 | 0 | Risk Ratio (M‐H, Fixed, 95% CI) | 0.0 [0.0, 0.0] |
Comparison 13. Proton pump agonists + prokinetics versus proton pump agonists.
| Outcome or subgroup title | No. of studies | No. of participants | Statistical method | Effect size |
|---|---|---|---|---|
| 1 Mortality due to aspiration pneumonitis | 0 | 0 | Risk Ratio (M‐H, Fixed, 95% CI) | 0.0 [0.0, 0.0] |
| 1.1 Elective CS | 0 | 0 | Risk Ratio (M‐H, Fixed, 95% CI) | 0.0 [0.0, 0.0] |
| 1.2 Emergency CS | 0 | 0 | Risk Ratio (M‐H, Fixed, 95% CI) | 0.0 [0.0, 0.0] |
| 1.3 Elective or emergency CS not specified | 0 | 0 | Risk Ratio (M‐H, Fixed, 95% CI) | 0.0 [0.0, 0.0] |
| 2 Morbidity due to aspiration pneumonitis | 0 | 0 | Risk Ratio (M‐H, Fixed, 95% CI) | 0.0 [0.0, 0.0] |
| 2.1 Elective CS | 0 | 0 | Risk Ratio (M‐H, Fixed, 95% CI) | 0.0 [0.0, 0.0] |
| 2.2 Emergency CS | 0 | 0 | Risk Ratio (M‐H, Fixed, 95% CI) | 0.0 [0.0, 0.0] |
| 2.3 Elective or emergency CS not specified | 0 | 0 | Risk Ratio (M‐H, Fixed, 95% CI) | 0.0 [0.0, 0.0] |
| 3 Intragastric pH > 2.5 at intubation | 0 | 0 | Risk Ratio (M‐H, Fixed, 95% CI) | 0.0 [0.0, 0.0] |
| 3.1 Elective CS | 0 | 0 | Risk Ratio (M‐H, Fixed, 95% CI) | 0.0 [0.0, 0.0] |
| 3.2 Emergency CS | 0 | 0 | Risk Ratio (M‐H, Fixed, 95% CI) | 0.0 [0.0, 0.0] |
| 3.3 Elective or emergency CS not specified | 0 | 0 | Risk Ratio (M‐H, Fixed, 95% CI) | 0.0 [0.0, 0.0] |
| 4 Intragastric volume < 0.4 mL/kg at intubation | 0 | 0 | Risk Ratio (M‐H, Fixed, 95% CI) | 0.0 [0.0, 0.0] |
| 4.1 Elective CS | 0 | 0 | Risk Ratio (M‐H, Fixed, 95% CI) | 0.0 [0.0, 0.0] |
| 4.2 Emergency CS | 0 | 0 | Risk Ratio (M‐H, Fixed, 95% CI) | 0.0 [0.0, 0.0] |
| 4.3 Elective or emergency CS not specified | 0 | 0 | Risk Ratio (M‐H, Fixed, 95% CI) | 0.0 [0.0, 0.0] |
| 5 Nausea | 0 | 0 | Risk Ratio (M‐H, Fixed, 95% CI) | 0.0 [0.0, 0.0] |
| 5.1 Elective CS | 0 | 0 | Risk Ratio (M‐H, Fixed, 95% CI) | 0.0 [0.0, 0.0] |
| 5.2 Emergency CS | 0 | 0 | Risk Ratio (M‐H, Fixed, 95% CI) | 0.0 [0.0, 0.0] |
| 5.3 Elective or emergency CS not specified | 0 | 0 | Risk Ratio (M‐H, Fixed, 95% CI) | 0.0 [0.0, 0.0] |
| 6 Vomiting | 0 | 0 | Risk Ratio (M‐H, Fixed, 95% CI) | 0.0 [0.0, 0.0] |
| 6.1 Elective CS | 0 | 0 | Risk Ratio (M‐H, Fixed, 95% CI) | 0.0 [0.0, 0.0] |
| 6.2 Emergency CS | 0 | 0 | Risk Ratio (M‐H, Fixed, 95% CI) | 0.0 [0.0, 0.0] |
| 6.3 Elective or emergency CS not specified | 0 | 0 | Risk Ratio (M‐H, Fixed, 95% CI) | 0.0 [0.0, 0.0] |
| 7 Sedation | 0 | 0 | Risk Ratio (M‐H, Fixed, 95% CI) | 0.0 [0.0, 0.0] |
| 7.1 Elective CS | 0 | 0 | Risk Ratio (M‐H, Fixed, 95% CI) | 0.0 [0.0, 0.0] |
| 7.2 Emergency CS | 0 | 0 | Risk Ratio (M‐H, Fixed, 95% CI) | 0.0 [0.0, 0.0] |
| 7.3 Elective or emergency CS not specified | 0 | 0 | Risk Ratio (M‐H, Fixed, 95% CI) | 0.0 [0.0, 0.0] |
| 8 Restlessness | 0 | 0 | Risk Ratio (M‐H, Fixed, 95% CI) | 0.0 [0.0, 0.0] |
| 8.1 Elective CS | 0 | 0 | Risk Ratio (M‐H, Fixed, 95% CI) | 0.0 [0.0, 0.0] |
| 8.2 Emergency CS | 0 | 0 | Risk Ratio (M‐H, Fixed, 95% CI) | 0.0 [0.0, 0.0] |
| 8.3 Elective or emergency CS not specified | 0 | 0 | Risk Ratio (M‐H, Fixed, 95% CI) | 0.0 [0.0, 0.0] |
| 9 Dystonic reactions | 0 | 0 | Risk Ratio (M‐H, Fixed, 95% CI) | 0.0 [0.0, 0.0] |
| 9.1 Elective CS | 0 | 0 | Risk Ratio (M‐H, Fixed, 95% CI) | 0.0 [0.0, 0.0] |
| 9.2 Emergency CS | 0 | 0 | Risk Ratio (M‐H, Fixed, 95% CI) | 0.0 [0.0, 0.0] |
| 9.3 Elective or emergency CS not specified | 0 | 0 | Risk Ratio (M‐H, Fixed, 95% CI) | 0.0 [0.0, 0.0] |
| 10 Extrapyramidal symptoms | 0 | 0 | Risk Ratio (M‐H, Fixed, 95% CI) | 0.0 [0.0, 0.0] |
| 10.1 Elective CS | 0 | 0 | Risk Ratio (M‐H, Fixed, 95% CI) | 0.0 [0.0, 0.0] |
| 10.2 Emergency CS | 0 | 0 | Risk Ratio (M‐H, Fixed, 95% CI) | 0.0 [0.0, 0.0] |
| 10.3 Elective or emergency CS not specified | 0 | 0 | Risk Ratio (M‐H, Fixed, 95% CI) | 0.0 [0.0, 0.0] |
| 11 Hypotension | 0 | 0 | Risk Ratio (M‐H, Fixed, 95% CI) | 0.0 [0.0, 0.0] |
| 11.1 Elective CS | 0 | 0 | Risk Ratio (M‐H, Fixed, 95% CI) | 0.0 [0.0, 0.0] |
| 11.2 Emergency CS | 0 | 0 | Risk Ratio (M‐H, Fixed, 95% CI) | 0.0 [0.0, 0.0] |
| 11.3 Elective or emergency CS not specified | 0 | 0 | Risk Ratio (M‐H, Fixed, 95% CI) | 0.0 [0.0, 0.0] |
| 12 Blood loss | 0 | 0 | Std. Mean Difference (IV, Fixed, 95% CI) | 0.0 [0.0, 0.0] |
| 12.1 Elective CS | 0 | 0 | Std. Mean Difference (IV, Fixed, 95% CI) | 0.0 [0.0, 0.0] |
| 12.2 Emergency CS | 0 | 0 | Std. Mean Difference (IV, Fixed, 95% CI) | 0.0 [0.0, 0.0] |
| 12.3 Elective or emergency CS not specified | 0 | 0 | Std. Mean Difference (IV, Fixed, 95% CI) | 0.0 [0.0, 0.0] |
| 13 Atonic uterus | 0 | 0 | Risk Ratio (M‐H, Fixed, 95% CI) | 0.0 [0.0, 0.0] |
| 13.1 Elective CS | 0 | 0 | Risk Ratio (M‐H, Fixed, 95% CI) | 0.0 [0.0, 0.0] |
| 13.2 Emergency CS | 0 | 0 | Risk Ratio (M‐H, Fixed, 95% CI) | 0.0 [0.0, 0.0] |
| 13.3 Elective or emergency CS not specified | 0 | 0 | Risk Ratio (M‐H, Fixed, 95% CI) | 0.0 [0.0, 0.0] |
| 14 Women's satisfaction | 0 | 0 | Std. Mean Difference (IV, Fixed, 95% CI) | 0.0 [0.0, 0.0] |
| 14.1 Elective CS | 0 | 0 | Std. Mean Difference (IV, Fixed, 95% CI) | 0.0 [0.0, 0.0] |
| 14.2 Emergency CS | 0 | 0 | Std. Mean Difference (IV, Fixed, 95% CI) | 0.0 [0.0, 0.0] |
| 14.3 Elective or emergency CS not specified | 0 | 0 | Std. Mean Difference (IV, Fixed, 95% CI) | 0.0 [0.0, 0.0] |
| 15 Cord blood pH | 0 | 0 | Mean Difference (IV, Fixed, 95% CI) | 0.0 [0.0, 0.0] |
| 15.1 Elective CS | 0 | 0 | Mean Difference (IV, Fixed, 95% CI) | 0.0 [0.0, 0.0] |
| 15.2 Emergency CS | 0 | 0 | Mean Difference (IV, Fixed, 95% CI) | 0.0 [0.0, 0.0] |
| 15.3 Elective or emergency CS not specified | 0 | 0 | Mean Difference (IV, Fixed, 95% CI) | 0.0 [0.0, 0.0] |
| 16 Apgar < 7 at 5 minutes | 0 | 0 | Risk Ratio (M‐H, Fixed, 95% CI) | 0.0 [0.0, 0.0] |
| 16.1 Elective CS | 0 | 0 | Risk Ratio (M‐H, Fixed, 95% CI) | 0.0 [0.0, 0.0] |
| 16.2 Emergency CS | 0 | 0 | Risk Ratio (M‐H, Fixed, 95% CI) | 0.0 [0.0, 0.0] |
| 16.3 Elective or emergency CS not specified | 0 | 0 | Risk Ratio (M‐H, Fixed, 95% CI) | 0.0 [0.0, 0.0] |
| 17 Neonatal assessment scores | 0 | 0 | Std. Mean Difference (IV, Fixed, 95% CI) | 0.0 [0.0, 0.0] |
| 17.1 Elective CS | 0 | 0 | Std. Mean Difference (IV, Fixed, 95% CI) | 0.0 [0.0, 0.0] |
| 17.2 Emergency CS | 0 | 0 | Std. Mean Difference (IV, Fixed, 95% CI) | 0.0 [0.0, 0.0] |
| 17.3 Elective or emergency CS not specified | 0 | 0 | Std. Mean Difference (IV, Fixed, 95% CI) | 0.0 [0.0, 0.0] |
| 18 Admission to NICU | 0 | 0 | Risk Ratio (M‐H, Fixed, 95% CI) | 0.0 [0.0, 0.0] |
| 18.1 Elective CS | 0 | 0 | Risk Ratio (M‐H, Fixed, 95% CI) | 0.0 [0.0, 0.0] |
| 18.2 Emergency CS | 0 | 0 | Risk Ratio (M‐H, Fixed, 95% CI) | 0.0 [0.0, 0.0] |
| 18.3 Elective or emergency CS not specified | 0 | 0 | Risk Ratio (M‐H, Fixed, 95% CI) | 0.0 [0.0, 0.0] |
| 19 Initiation of breastfeeding | 0 | 0 | Risk Ratio (M‐H, Fixed, 95% CI) | 0.0 [0.0, 0.0] |
| 19.1 Elective CS | 0 | 0 | Risk Ratio (M‐H, Fixed, 95% CI) | 0.0 [0.0, 0.0] |
| 19.2 Emergency CS | 0 | 0 | Risk Ratio (M‐H, Fixed, 95% CI) | 0.0 [0.0, 0.0] |
| 19.3 Elective or emergency CS not specified | 0 | 0 | Risk Ratio (M‐H, Fixed, 95% CI) | 0.0 [0.0, 0.0] |
| 20 Duration of breastfeeding | 0 | 0 | Std. Mean Difference (IV, Fixed, 95% CI) | 0.0 [0.0, 0.0] |
| 20.1 Elective CS | 0 | 0 | Std. Mean Difference (IV, Fixed, 95% CI) | 0.0 [0.0, 0.0] |
| 20.2 Emergency CS | 0 | 0 | Std. Mean Difference (IV, Fixed, 95% CI) | 0.0 [0.0, 0.0] |
| 20.3 Elective or emergency CS not specified | 0 | 0 | Std. Mean Difference (IV, Fixed, 95% CI) | 0.0 [0.0, 0.0] |
| 21 Intragastric pH > 2.5 at extubation | 0 | 0 | Risk Ratio (M‐H, Fixed, 95% CI) | 0.0 [0.0, 0.0] |
| 21.1 Elective CS | 0 | 0 | Risk Ratio (M‐H, Fixed, 95% CI) | 0.0 [0.0, 0.0] |
| 21.2 Emergency CS | 0 | 0 | Risk Ratio (M‐H, Fixed, 95% CI) | 0.0 [0.0, 0.0] |
| 21.3 Elective or emergency CS not specified | 0 | 0 | Risk Ratio (M‐H, Fixed, 95% CI) | 0.0 [0.0, 0.0] |
| 22 Intragastric volume < 0.4 mL/kg at extubation | 0 | 0 | Risk Ratio (M‐H, Fixed, 95% CI) | 0.0 [0.0, 0.0] |
| 22.1 Elective CS | 0 | 0 | Risk Ratio (M‐H, Fixed, 95% CI) | 0.0 [0.0, 0.0] |
| 22.2 Emergency CS | 0 | 0 | Risk Ratio (M‐H, Fixed, 95% CI) | 0.0 [0.0, 0.0] |
| 22.3 Elective or emergency CS not specified | 0 | 0 | Risk Ratio (M‐H, Fixed, 95% CI) | 0.0 [0.0, 0.0] |
| 23 At risk of aspiration post intubation (not pre‐specified) | 1 | 97 | Risk Ratio (M‐H, Fixed, 95% CI) | 0.49 [0.15, 1.60] |
| 23.1 Elective CS | 1 | 97 | Risk Ratio (M‐H, Fixed, 95% CI) | 0.49 [0.15, 1.60] |
| 23.2 Emergency CS | 0 | 0 | Risk Ratio (M‐H, Fixed, 95% CI) | 0.0 [0.0, 0.0] |
| 23.3 Elective or emergency CS not specified | 0 | 0 | Risk Ratio (M‐H, Fixed, 95% CI) | 0.0 [0.0, 0.0] |
| 24 At risk of aspiration pre extubation (not pre specified) | 1 | 94 | Risk Ratio (M‐H, Fixed, 95% CI) | 0.67 [0.03, 15.91] |
| 24.1 Elective CS | 1 | 94 | Risk Ratio (M‐H, Fixed, 95% CI) | 0.67 [0.03, 15.91] |
| 24.2 Emergency CS | 0 | 0 | Risk Ratio (M‐H, Fixed, 95% CI) | 0.0 [0.0, 0.0] |
| 24.3 Elective and emergency CS not specified | 0 | 0 | Risk Ratio (M‐H, Fixed, 95% CI) | 0.0 [0.0, 0.0] |
Comparison 14. H2 antagonist versus tramadol.
| Outcome or subgroup title | No. of studies | No. of participants | Statistical method | Effect size |
|---|---|---|---|---|
| 1 Mortality due to aspiration pneumonitis | 0 | 0 | Risk Ratio (M‐H, Fixed, 95% CI) | 0.0 [0.0, 0.0] |
| 1.1 Elective CS | 0 | 0 | Risk Ratio (M‐H, Fixed, 95% CI) | 0.0 [0.0, 0.0] |
| 1.2 Emergency CS | 0 | 0 | Risk Ratio (M‐H, Fixed, 95% CI) | 0.0 [0.0, 0.0] |
| 1.3 Elective or emergency CS not specified | 0 | 0 | Risk Ratio (M‐H, Fixed, 95% CI) | 0.0 [0.0, 0.0] |
| 2 Morbidity due to aspiration pneumonitis | 0 | 0 | Risk Ratio (M‐H, Fixed, 95% CI) | 0.0 [0.0, 0.0] |
| 2.1 Elective CS | 0 | 0 | Risk Ratio (M‐H, Fixed, 95% CI) | 0.0 [0.0, 0.0] |
| 2.2 Emergency CS | 0 | 0 | Risk Ratio (M‐H, Fixed, 95% CI) | 0.0 [0.0, 0.0] |
| 2.3 Elective or emergency CS not specified | 0 | 0 | Risk Ratio (M‐H, Fixed, 95% CI) | 0.0 [0.0, 0.0] |
| 3 Intragastric pH < 2.5 at intubation | 0 | 0 | Risk Ratio (M‐H, Fixed, 95% CI) | 0.0 [0.0, 0.0] |
| 3.1 Elective CS | 0 | 0 | Risk Ratio (M‐H, Fixed, 95% CI) | 0.0 [0.0, 0.0] |
| 3.2 Emergency CS | 0 | 0 | Risk Ratio (M‐H, Fixed, 95% CI) | 0.0 [0.0, 0.0] |
| 3.3 Elective or emergency CS not specified | 0 | 0 | Risk Ratio (M‐H, Fixed, 95% CI) | 0.0 [0.0, 0.0] |
| 4 Intragastric volume > 0.4 mL/kg at intubation | 1 | 90 | Risk Ratio (M‐H, Fixed, 95% CI) | 5.0 [1.03, 24.28] |
| 4.1 Elective CS | 1 | 90 | Risk Ratio (M‐H, Fixed, 95% CI) | 5.0 [1.03, 24.28] |
| 4.2 Emergency CS | 0 | 0 | Risk Ratio (M‐H, Fixed, 95% CI) | 0.0 [0.0, 0.0] |
| 4.3 Elective or emergency CS not specified | 0 | 0 | Risk Ratio (M‐H, Fixed, 95% CI) | 0.0 [0.0, 0.0] |
| 5 Nausea | 1 | 60 | Risk Ratio (M‐H, Fixed, 95% CI) | 1.38 [0.64, 2.93] |
| 5.1 Elective CS | 1 | 60 | Risk Ratio (M‐H, Fixed, 95% CI) | 1.38 [0.64, 2.93] |
| 5.2 Emergency CS | 0 | 0 | Risk Ratio (M‐H, Fixed, 95% CI) | 0.0 [0.0, 0.0] |
| 5.3 Elective or emergency CS not specified | 0 | 0 | Risk Ratio (M‐H, Fixed, 95% CI) | 0.0 [0.0, 0.0] |
| 6 Vomiting | 0 | 0 | Risk Ratio (M‐H, Fixed, 95% CI) | 0.0 [0.0, 0.0] |
| 6.1 Elective CS | 0 | 0 | Risk Ratio (M‐H, Fixed, 95% CI) | 0.0 [0.0, 0.0] |
| 6.2 Emergency CS | 0 | 0 | Risk Ratio (M‐H, Fixed, 95% CI) | 0.0 [0.0, 0.0] |
| 6.3 Emergency and elective CS non specified | 0 | 0 | Risk Ratio (M‐H, Fixed, 95% CI) | 0.0 [0.0, 0.0] |
| 7 Sedation | 0 | 0 | Risk Ratio (M‐H, Fixed, 95% CI) | 0.0 [0.0, 0.0] |
| 7.1 Elective CS | 0 | 0 | Risk Ratio (M‐H, Fixed, 95% CI) | 0.0 [0.0, 0.0] |
| 7.2 Emergency CS | 0 | 0 | Risk Ratio (M‐H, Fixed, 95% CI) | 0.0 [0.0, 0.0] |
| 7.3 Elective or emergency CS not specified | 0 | 0 | Risk Ratio (M‐H, Fixed, 95% CI) | 0.0 [0.0, 0.0] |
| 8 Restlessness | 0 | 0 | Risk Ratio (M‐H, Fixed, 95% CI) | 0.0 [0.0, 0.0] |
| 8.1 Elective CS | 0 | 0 | Risk Ratio (M‐H, Fixed, 95% CI) | 0.0 [0.0, 0.0] |
| 8.2 Emergency CS | 0 | 0 | Risk Ratio (M‐H, Fixed, 95% CI) | 0.0 [0.0, 0.0] |
| 8.3 Elective or emergency CS not specified | 0 | 0 | Risk Ratio (M‐H, Fixed, 95% CI) | 0.0 [0.0, 0.0] |
| 9 Dystonic reactions | 0 | 0 | Risk Ratio (M‐H, Fixed, 95% CI) | 0.0 [0.0, 0.0] |
| 9.1 Elective CS | 0 | 0 | Risk Ratio (M‐H, Fixed, 95% CI) | 0.0 [0.0, 0.0] |
| 9.2 Emergency CS | 0 | 0 | Risk Ratio (M‐H, Fixed, 95% CI) | 0.0 [0.0, 0.0] |
| 9.3 Elective or emergency CS not specified | 0 | 0 | Risk Ratio (M‐H, Fixed, 95% CI) | 0.0 [0.0, 0.0] |
| 10 Extrapyramidal symptoms | 0 | 0 | Risk Ratio (M‐H, Fixed, 95% CI) | 0.0 [0.0, 0.0] |
| 10.1 Elective CS | 0 | 0 | Risk Ratio (M‐H, Fixed, 95% CI) | 0.0 [0.0, 0.0] |
| 10.2 Emergency CS | 0 | 0 | Risk Ratio (M‐H, Fixed, 95% CI) | 0.0 [0.0, 0.0] |
| 10.3 Elective or emergency CS not specified | 0 | 0 | Risk Ratio (M‐H, Fixed, 95% CI) | 0.0 [0.0, 0.0] |
| 11 Hypotension | 0 | 0 | Risk Ratio (M‐H, Fixed, 95% CI) | 0.0 [0.0, 0.0] |
| 11.1 Elective CS | 0 | 0 | Risk Ratio (M‐H, Fixed, 95% CI) | 0.0 [0.0, 0.0] |
| 11.2 Emergency CS | 0 | 0 | Risk Ratio (M‐H, Fixed, 95% CI) | 0.0 [0.0, 0.0] |
| 11.3 Elective or emergency CS not specified | 0 | 0 | Risk Ratio (M‐H, Fixed, 95% CI) | 0.0 [0.0, 0.0] |
| 12 Blood loss | 0 | 0 | Std. Mean Difference (IV, Fixed, 95% CI) | 0.0 [0.0, 0.0] |
| 12.1 Elective CS | 0 | 0 | Std. Mean Difference (IV, Fixed, 95% CI) | 0.0 [0.0, 0.0] |
| 12.2 Emergency CS | 0 | 0 | Std. Mean Difference (IV, Fixed, 95% CI) | 0.0 [0.0, 0.0] |
| 12.3 Elective or emergency CS not specified | 0 | 0 | Std. Mean Difference (IV, Fixed, 95% CI) | 0.0 [0.0, 0.0] |
| 13 Atonic uterus | 0 | 0 | Risk Ratio (M‐H, Fixed, 95% CI) | 0.0 [0.0, 0.0] |
| 13.1 Elective CS | 0 | 0 | Risk Ratio (M‐H, Fixed, 95% CI) | 0.0 [0.0, 0.0] |
| 13.2 Emergency CS | 0 | 0 | Risk Ratio (M‐H, Fixed, 95% CI) | 0.0 [0.0, 0.0] |
| 13.3 Elective or emergency CS not specified | 0 | 0 | Risk Ratio (M‐H, Fixed, 95% CI) | 0.0 [0.0, 0.0] |
| 14 Women's satisfaction | 0 | 0 | Std. Mean Difference (IV, Fixed, 95% CI) | 0.0 [0.0, 0.0] |
| 14.1 Elective CS | 0 | 0 | Std. Mean Difference (IV, Fixed, 95% CI) | 0.0 [0.0, 0.0] |
| 14.2 Emergency CS | 0 | 0 | Std. Mean Difference (IV, Fixed, 95% CI) | 0.0 [0.0, 0.0] |
| 14.3 Elective or emergency CS not specified | 0 | 0 | Std. Mean Difference (IV, Fixed, 95% CI) | 0.0 [0.0, 0.0] |
| 15 Cord blood pH | 0 | 0 | Mean Difference (IV, Fixed, 95% CI) | 0.0 [0.0, 0.0] |
| 15.1 Elective CS | 0 | 0 | Mean Difference (IV, Fixed, 95% CI) | 0.0 [0.0, 0.0] |
| 15.2 Emergency CS | 0 | 0 | Mean Difference (IV, Fixed, 95% CI) | 0.0 [0.0, 0.0] |
| 15.3 Elective or emergency CS not specified | 0 | 0 | Mean Difference (IV, Fixed, 95% CI) | 0.0 [0.0, 0.0] |
| 16 Apgar score < 7 at 5 mins | 0 | 0 | Risk Ratio (M‐H, Fixed, 95% CI) | 0.0 [0.0, 0.0] |
| 16.1 Emergency CS | 0 | 0 | Risk Ratio (M‐H, Fixed, 95% CI) | 0.0 [0.0, 0.0] |
| 16.2 Elective CS | 0 | 0 | Risk Ratio (M‐H, Fixed, 95% CI) | 0.0 [0.0, 0.0] |
| 16.3 Emergency and elective CS non specified | 0 | 0 | Risk Ratio (M‐H, Fixed, 95% CI) | 0.0 [0.0, 0.0] |
| 17 Neonatal assessment scores | 0 | 0 | Std. Mean Difference (IV, Fixed, 95% CI) | 0.0 [0.0, 0.0] |
| 17.1 Elective CS | 0 | 0 | Std. Mean Difference (IV, Fixed, 95% CI) | 0.0 [0.0, 0.0] |
| 17.2 Emergency CS | 0 | 0 | Std. Mean Difference (IV, Fixed, 95% CI) | 0.0 [0.0, 0.0] |
| 17.3 Elective or emergency CS not specified | 0 | 0 | Std. Mean Difference (IV, Fixed, 95% CI) | 0.0 [0.0, 0.0] |
| 18 Admission to NICU | 0 | 0 | Risk Ratio (M‐H, Fixed, 95% CI) | 0.0 [0.0, 0.0] |
| 18.1 Elective CS | 0 | 0 | Risk Ratio (M‐H, Fixed, 95% CI) | 0.0 [0.0, 0.0] |
| 18.2 Emergency CS | 0 | 0 | Risk Ratio (M‐H, Fixed, 95% CI) | 0.0 [0.0, 0.0] |
| 18.3 Elective or emergency CS not specified | 0 | 0 | Risk Ratio (M‐H, Fixed, 95% CI) | 0.0 [0.0, 0.0] |
| 19 Initiation of breastfeeding | 0 | 0 | Risk Ratio (M‐H, Fixed, 95% CI) | 0.0 [0.0, 0.0] |
| 19.1 Elective CS | 0 | 0 | Risk Ratio (M‐H, Fixed, 95% CI) | 0.0 [0.0, 0.0] |
| 19.2 Emergency CS | 0 | 0 | Risk Ratio (M‐H, Fixed, 95% CI) | 0.0 [0.0, 0.0] |
| 19.3 Elective or emergency CS not specified | 0 | 0 | Risk Ratio (M‐H, Fixed, 95% CI) | 0.0 [0.0, 0.0] |
| 20 Duration of breastfeeding | 0 | 0 | Std. Mean Difference (IV, Fixed, 95% CI) | 0.0 [0.0, 0.0] |
| 20.1 Elective CS | 0 | 0 | Std. Mean Difference (IV, Fixed, 95% CI) | 0.0 [0.0, 0.0] |
| 20.2 Emergency CS | 0 | 0 | Std. Mean Difference (IV, Fixed, 95% CI) | 0.0 [0.0, 0.0] |
| 20.3 Elective or emergency CS not specified | 0 | 0 | Std. Mean Difference (IV, Fixed, 95% CI) | 0.0 [0.0, 0.0] |
| 21 Intragastric pH < 2.5 at extubation | 0 | 0 | Risk Ratio (M‐H, Fixed, 95% CI) | 0.0 [0.0, 0.0] |
| 21.1 Elective CS | 0 | 0 | Risk Ratio (M‐H, Fixed, 95% CI) | 0.0 [0.0, 0.0] |
| 21.2 Emergency CS | 0 | 0 | Risk Ratio (M‐H, Fixed, 95% CI) | 0.0 [0.0, 0.0] |
| 21.3 Elective or emergency CS not specified | 0 | 0 | Risk Ratio (M‐H, Fixed, 95% CI) | 0.0 [0.0, 0.0] |
| 22 Intragastric volume > 0.4 mL/kg at extubation | 1 | 60 | Risk Ratio (M‐H, Fixed, 95% CI) | 3.0 [0.33, 27.23] |
| 22.1 Elective CS | 1 | 60 | Risk Ratio (M‐H, Fixed, 95% CI) | 3.0 [0.33, 27.23] |
| 22.2 Emergency CS | 0 | 0 | Risk Ratio (M‐H, Fixed, 95% CI) | 0.0 [0.0, 0.0] |
| 22.3 Elective or emergency CS not specified | 0 | 0 | Risk Ratio (M‐H, Fixed, 95% CI) | 0.0 [0.0, 0.0] |
| 23 At risk post intubation (not pre‐specified) | 1 | 60 | Risk Ratio (M‐H, Fixed, 95% CI) | 0.0 [0.0, 0.0] |
| 23.1 Elective CS | 1 | 60 | Risk Ratio (M‐H, Fixed, 95% CI) | 0.0 [0.0, 0.0] |
| 23.2 Emergency CS | 0 | 0 | Risk Ratio (M‐H, Fixed, 95% CI) | 0.0 [0.0, 0.0] |
| 23.3 Emergency and elective CS non specified | 0 | 0 | Risk Ratio (M‐H, Fixed, 95% CI) | 0.0 [0.0, 0.0] |
| 24 At risk pre extubation (not pre‐specified) | 1 | 60 | Risk Ratio (M‐H, Fixed, 95% CI) | 0.0 [0.0, 0.0] |
| 24.1 Elective CS | 1 | 60 | Risk Ratio (M‐H, Fixed, 95% CI) | 0.0 [0.0, 0.0] |
| 24.2 Emergency CS | 0 | 0 | Risk Ratio (M‐H, Fixed, 95% CI) | 0.0 [0.0, 0.0] |
| 24.3 Emergency or elective CS non specified | 0 | 0 | Risk Ratio (M‐H, Fixed, 95% CI) | 0.0 [0.0, 0.0] |
| 25 Nausea 24hours post op (not pre‐specified) | 1 | 60 | Risk Ratio (M‐H, Fixed, 95% CI) | 1.43 [0.63, 3.25] |
| 25.1 Elective CS | 1 | 60 | Risk Ratio (M‐H, Fixed, 95% CI) | 1.43 [0.63, 3.25] |
| 25.2 Emergency CS | 0 | 0 | Risk Ratio (M‐H, Fixed, 95% CI) | 0.0 [0.0, 0.0] |
| 25.3 Emergency and elective CS non specified | 0 | 0 | Risk Ratio (M‐H, Fixed, 95% CI) | 0.0 [0.0, 0.0] |
14.22. Analysis.
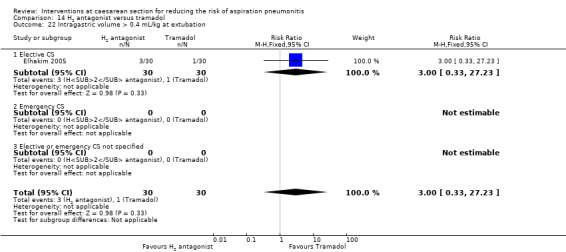
Comparison 14 H2 antagonist versus tramadol, Outcome 22 Intragastric volume > 0.4 mL/kg at extubation.
14.23. Analysis.
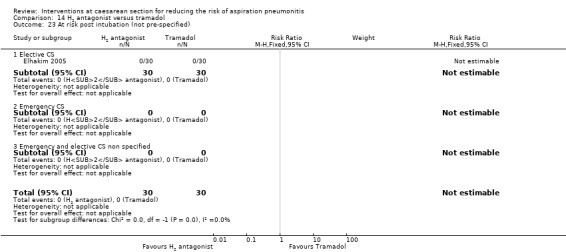
Comparison 14 H2 antagonist versus tramadol, Outcome 23 At risk post intubation (not pre‐specified).
14.24. Analysis.

Comparison 14 H2 antagonist versus tramadol, Outcome 24 At risk pre extubation (not pre‐specified).
14.25. Analysis.
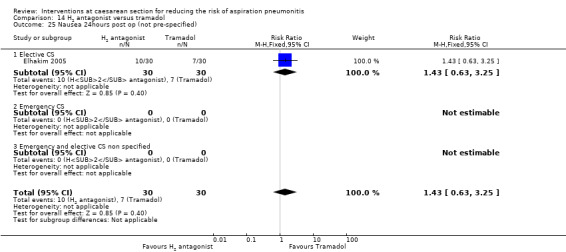
Comparison 14 H2 antagonist versus tramadol, Outcome 25 Nausea 24hours post op (not pre‐specified).
Comparison 15. Antacids + H2 antagonists versus proton pump antagonists.
| Outcome or subgroup title | No. of studies | No. of participants | Statistical method | Effect size |
|---|---|---|---|---|
| 1 Mortality due to aspiration pneumonitis | 0 | 0 | Risk Ratio (M‐H, Fixed, 95% CI) | 0.0 [0.0, 0.0] |
| 1.1 Elective CS | 0 | 0 | Risk Ratio (M‐H, Fixed, 95% CI) | 0.0 [0.0, 0.0] |
| 1.2 Emergency CS | 0 | 0 | Risk Ratio (M‐H, Fixed, 95% CI) | 0.0 [0.0, 0.0] |
| 1.3 Elective or emergency CS not specified | 0 | 0 | Risk Ratio (M‐H, Fixed, 95% CI) | 0.0 [0.0, 0.0] |
| 2 Morbidity due to aspiration pneumonitis | 0 | 0 | Risk Ratio (M‐H, Fixed, 95% CI) | 0.0 [0.0, 0.0] |
| 2.1 Elective CS | 0 | 0 | Risk Ratio (M‐H, Fixed, 95% CI) | 0.0 [0.0, 0.0] |
| 2.2 Emergency CS | 0 | 0 | Risk Ratio (M‐H, Fixed, 95% CI) | 0.0 [0.0, 0.0] |
| 2.3 Elective or emergency CS not specified | 0 | 0 | Risk Ratio (M‐H, Fixed, 95% CI) | 0.0 [0.0, 0.0] |
| 3 Intragastric pH < 2.5 at intubation | 0 | 0 | Risk Ratio (M‐H, Fixed, 95% CI) | 0.0 [0.0, 0.0] |
| 3.1 Elective CS | 0 | 0 | Risk Ratio (M‐H, Fixed, 95% CI) | 0.0 [0.0, 0.0] |
| 3.2 Emergency CS | 0 | 0 | Risk Ratio (M‐H, Fixed, 95% CI) | 0.0 [0.0, 0.0] |
| 3.3 Elective or emergency CS not specified | 0 | 0 | Risk Ratio (M‐H, Fixed, 95% CI) | 0.0 [0.0, 0.0] |
| 4 Intragastric volume > 0.4 mL/kg at intubation | 0 | 0 | Risk Ratio (M‐H, Fixed, 95% CI) | 0.0 [0.0, 0.0] |
| 4.1 Elective CS | 0 | 0 | Risk Ratio (M‐H, Fixed, 95% CI) | 0.0 [0.0, 0.0] |
| 4.2 Emergency CS | 0 | 0 | Risk Ratio (M‐H, Fixed, 95% CI) | 0.0 [0.0, 0.0] |
| 4.3 Elective or emergency CS not specified | 0 | 0 | Risk Ratio (M‐H, Fixed, 95% CI) | 0.0 [0.0, 0.0] |
| 5 Nausea | 0 | 0 | Risk Ratio (M‐H, Fixed, 95% CI) | 0.0 [0.0, 0.0] |
| 5.1 Elective CS | 0 | 0 | Risk Ratio (M‐H, Fixed, 95% CI) | 0.0 [0.0, 0.0] |
| 5.2 Emergency CS | 0 | 0 | Risk Ratio (M‐H, Fixed, 95% CI) | 0.0 [0.0, 0.0] |
| 5.3 Elective or emergency CS not specified | 0 | 0 | Risk Ratio (M‐H, Fixed, 95% CI) | 0.0 [0.0, 0.0] |
| 6 Vomiting | 0 | 0 | Risk Ratio (M‐H, Fixed, 95% CI) | 0.0 [0.0, 0.0] |
| 6.1 Elective CS | 0 | 0 | Risk Ratio (M‐H, Fixed, 95% CI) | 0.0 [0.0, 0.0] |
| 6.2 Emergency CS | 0 | 0 | Risk Ratio (M‐H, Fixed, 95% CI) | 0.0 [0.0, 0.0] |
| 6.3 Emergency and elective CS non specified | 0 | 0 | Risk Ratio (M‐H, Fixed, 95% CI) | 0.0 [0.0, 0.0] |
| 7 Sedation | 0 | 0 | Risk Ratio (M‐H, Fixed, 95% CI) | 0.0 [0.0, 0.0] |
| 7.1 Elective CS | 0 | 0 | Risk Ratio (M‐H, Fixed, 95% CI) | 0.0 [0.0, 0.0] |
| 7.2 Emergency CS | 0 | 0 | Risk Ratio (M‐H, Fixed, 95% CI) | 0.0 [0.0, 0.0] |
| 7.3 Elective or emergency CS not specified | 0 | 0 | Risk Ratio (M‐H, Fixed, 95% CI) | 0.0 [0.0, 0.0] |
| 8 Restlessness | 0 | 0 | Risk Ratio (M‐H, Fixed, 95% CI) | 0.0 [0.0, 0.0] |
| 8.1 Elective CS | 0 | 0 | Risk Ratio (M‐H, Fixed, 95% CI) | 0.0 [0.0, 0.0] |
| 8.2 Emergency CS | 0 | 0 | Risk Ratio (M‐H, Fixed, 95% CI) | 0.0 [0.0, 0.0] |
| 8.3 Elective or emergency CS not specified | 0 | 0 | Risk Ratio (M‐H, Fixed, 95% CI) | 0.0 [0.0, 0.0] |
| 9 Dystonic reactions | 0 | 0 | Risk Ratio (M‐H, Fixed, 95% CI) | 0.0 [0.0, 0.0] |
| 9.1 Elective CS | 0 | 0 | Risk Ratio (M‐H, Fixed, 95% CI) | 0.0 [0.0, 0.0] |
| 9.2 Emergency CS | 0 | 0 | Risk Ratio (M‐H, Fixed, 95% CI) | 0.0 [0.0, 0.0] |
| 9.3 Elective or emergency CS not specified | 0 | 0 | Risk Ratio (M‐H, Fixed, 95% CI) | 0.0 [0.0, 0.0] |
| 10 Extrapyramidal symptoms | 0 | 0 | Risk Ratio (M‐H, Fixed, 95% CI) | 0.0 [0.0, 0.0] |
| 10.1 Elective CS | 0 | 0 | Risk Ratio (M‐H, Fixed, 95% CI) | 0.0 [0.0, 0.0] |
| 10.2 Emergency CS | 0 | 0 | Risk Ratio (M‐H, Fixed, 95% CI) | 0.0 [0.0, 0.0] |
| 10.3 Elective or emergency CS not specified | 0 | 0 | Risk Ratio (M‐H, Fixed, 95% CI) | 0.0 [0.0, 0.0] |
| 11 Hypotension | 0 | 0 | Risk Ratio (M‐H, Fixed, 95% CI) | 0.0 [0.0, 0.0] |
| 11.1 Elective CS | 0 | 0 | Risk Ratio (M‐H, Fixed, 95% CI) | 0.0 [0.0, 0.0] |
| 11.2 Emergency CS | 0 | 0 | Risk Ratio (M‐H, Fixed, 95% CI) | 0.0 [0.0, 0.0] |
| 11.3 Elective or emergency CS not specified | 0 | 0 | Risk Ratio (M‐H, Fixed, 95% CI) | 0.0 [0.0, 0.0] |
| 12 Blood loss | 0 | 0 | Std. Mean Difference (IV, Fixed, 95% CI) | 0.0 [0.0, 0.0] |
| 12.1 Elective CS | 0 | 0 | Std. Mean Difference (IV, Fixed, 95% CI) | 0.0 [0.0, 0.0] |
| 12.2 Emergency CS | 0 | 0 | Std. Mean Difference (IV, Fixed, 95% CI) | 0.0 [0.0, 0.0] |
| 12.3 Elective or emergency CS not specified | 0 | 0 | Std. Mean Difference (IV, Fixed, 95% CI) | 0.0 [0.0, 0.0] |
| 13 Atonic uterus | 0 | 0 | Risk Ratio (M‐H, Fixed, 95% CI) | 0.0 [0.0, 0.0] |
| 13.1 Elective CS | 0 | 0 | Risk Ratio (M‐H, Fixed, 95% CI) | 0.0 [0.0, 0.0] |
| 13.2 Emergency CS | 0 | 0 | Risk Ratio (M‐H, Fixed, 95% CI) | 0.0 [0.0, 0.0] |
| 13.3 Elective or emergency CS not specified | 0 | 0 | Risk Ratio (M‐H, Fixed, 95% CI) | 0.0 [0.0, 0.0] |
| 14 Women's satisfaction | 0 | 0 | Std. Mean Difference (IV, Fixed, 95% CI) | 0.0 [0.0, 0.0] |
| 14.1 Elective CS | 0 | 0 | Std. Mean Difference (IV, Fixed, 95% CI) | 0.0 [0.0, 0.0] |
| 14.2 Emergency CS | 0 | 0 | Std. Mean Difference (IV, Fixed, 95% CI) | 0.0 [0.0, 0.0] |
| 14.3 Elective or emergency CS not specified | 0 | 0 | Std. Mean Difference (IV, Fixed, 95% CI) | 0.0 [0.0, 0.0] |
| 15 Cord blood pH | 0 | 0 | Mean Difference (IV, Fixed, 95% CI) | 0.0 [0.0, 0.0] |
| 15.1 Elective CS | 0 | 0 | Mean Difference (IV, Fixed, 95% CI) | 0.0 [0.0, 0.0] |
| 15.2 Emergency CS | 0 | 0 | Mean Difference (IV, Fixed, 95% CI) | 0.0 [0.0, 0.0] |
| 15.3 Elective or emergency CS not specified | 0 | 0 | Mean Difference (IV, Fixed, 95% CI) | 0.0 [0.0, 0.0] |
| 16 Apgar score < 7 at 5 mins | 0 | 0 | Risk Ratio (M‐H, Fixed, 95% CI) | 0.0 [0.0, 0.0] |
| 16.1 Emergency CS | 0 | 0 | Risk Ratio (M‐H, Fixed, 95% CI) | 0.0 [0.0, 0.0] |
| 16.2 Elective CS | 0 | 0 | Risk Ratio (M‐H, Fixed, 95% CI) | 0.0 [0.0, 0.0] |
| 16.3 Emergency and elective CS non specified | 0 | 0 | Risk Ratio (M‐H, Fixed, 95% CI) | 0.0 [0.0, 0.0] |
| 17 Neonatal assessment scores | 0 | 0 | Std. Mean Difference (IV, Fixed, 95% CI) | 0.0 [0.0, 0.0] |
| 17.1 Elective CS | 0 | 0 | Std. Mean Difference (IV, Fixed, 95% CI) | 0.0 [0.0, 0.0] |
| 17.2 Emergency CS | 0 | 0 | Std. Mean Difference (IV, Fixed, 95% CI) | 0.0 [0.0, 0.0] |
| 17.3 Elective or emergency CS not specified | 0 | 0 | Std. Mean Difference (IV, Fixed, 95% CI) | 0.0 [0.0, 0.0] |
| 18 Admission to NICU | 0 | 0 | Risk Ratio (M‐H, Fixed, 95% CI) | 0.0 [0.0, 0.0] |
| 18.1 Elective CS | 0 | 0 | Risk Ratio (M‐H, Fixed, 95% CI) | 0.0 [0.0, 0.0] |
| 18.2 Emergency CS | 0 | 0 | Risk Ratio (M‐H, Fixed, 95% CI) | 0.0 [0.0, 0.0] |
| 18.3 Elective or emergency CS not specified | 0 | 0 | Risk Ratio (M‐H, Fixed, 95% CI) | 0.0 [0.0, 0.0] |
| 19 Initiation of breastfeeding | 0 | 0 | Risk Ratio (M‐H, Fixed, 95% CI) | 0.0 [0.0, 0.0] |
| 19.1 Elective CS | 0 | 0 | Risk Ratio (M‐H, Fixed, 95% CI) | 0.0 [0.0, 0.0] |
| 19.2 Emergency CS | 0 | 0 | Risk Ratio (M‐H, Fixed, 95% CI) | 0.0 [0.0, 0.0] |
| 19.3 Elective or emergency CS not specified | 0 | 0 | Risk Ratio (M‐H, Fixed, 95% CI) | 0.0 [0.0, 0.0] |
| 20 Duration of breastfeeding | 0 | 0 | Std. Mean Difference (IV, Fixed, 95% CI) | 0.0 [0.0, 0.0] |
| 20.1 Elective CS | 0 | 0 | Std. Mean Difference (IV, Fixed, 95% CI) | 0.0 [0.0, 0.0] |
| 20.2 Emergency CS | 0 | 0 | Std. Mean Difference (IV, Fixed, 95% CI) | 0.0 [0.0, 0.0] |
| 20.3 Elective or emergency CS not specified | 0 | 0 | Std. Mean Difference (IV, Fixed, 95% CI) | 0.0 [0.0, 0.0] |
| 21 Intragastric pH < 2.5 at extubation | 0 | 0 | Risk Ratio (M‐H, Fixed, 95% CI) | 0.0 [0.0, 0.0] |
| 21.1 Elective CS | 0 | 0 | Risk Ratio (M‐H, Fixed, 95% CI) | 0.0 [0.0, 0.0] |
| 21.2 Emergency CS | 0 | 0 | Risk Ratio (M‐H, Fixed, 95% CI) | 0.0 [0.0, 0.0] |
| 21.3 Elective or emergency CS not specified | 0 | 0 | Risk Ratio (M‐H, Fixed, 95% CI) | 0.0 [0.0, 0.0] |
| 22 Intragastric volume > 0.4 mL/kg at extubation | 0 | 0 | Risk Ratio (M‐H, Fixed, 95% CI) | 0.0 [0.0, 0.0] |
| 22.1 Elective CS | 0 | 0 | Risk Ratio (M‐H, Fixed, 95% CI) | 0.0 [0.0, 0.0] |
| 22.2 Emergency CS | 0 | 0 | Risk Ratio (M‐H, Fixed, 95% CI) | 0.0 [0.0, 0.0] |
| 22.3 Elective or emergency CS not specified | 0 | 0 | Risk Ratio (M‐H, Fixed, 95% CI) | 0.0 [0.0, 0.0] |
| 23 At risk of aspiration (not pre‐specified) | 1 | 108 | Risk Ratio (M‐H, Fixed, 95% CI) | 0.12 [0.02, 0.91] |
| 23.1 Elective CS | 0 | 0 | Risk Ratio (M‐H, Fixed, 95% CI) | 0.0 [0.0, 0.0] |
| 23.2 Emergency CS | 1 | 108 | Risk Ratio (M‐H, Fixed, 95% CI) | 0.12 [0.02, 0.91] |
| 23.3 Emergency and elective CS non specified | 0 | 0 | Risk Ratio (M‐H, Fixed, 95% CI) | 0.0 [0.0, 0.0] |
Comparison 16. Proton pump antagonist + antacid versus proton pump antagonist.
| Outcome or subgroup title | No. of studies | No. of participants | Statistical method | Effect size |
|---|---|---|---|---|
| 1 Mortality due to aspiration pneumonitis | 0 | 0 | Risk Ratio (M‐H, Fixed, 95% CI) | 0.0 [0.0, 0.0] |
| 1.1 Elective CS | 0 | 0 | Risk Ratio (M‐H, Fixed, 95% CI) | 0.0 [0.0, 0.0] |
| 1.2 Emergency CS | 0 | 0 | Risk Ratio (M‐H, Fixed, 95% CI) | 0.0 [0.0, 0.0] |
| 1.3 Elective or emergency CS not specified | 0 | 0 | Risk Ratio (M‐H, Fixed, 95% CI) | 0.0 [0.0, 0.0] |
| 2 Morbidity due to aspiration pneumonitis | 0 | 0 | Risk Ratio (M‐H, Fixed, 95% CI) | 0.0 [0.0, 0.0] |
| 2.1 Elective CS | 0 | 0 | Risk Ratio (M‐H, Fixed, 95% CI) | 0.0 [0.0, 0.0] |
| 2.2 Emergency CS | 0 | 0 | Risk Ratio (M‐H, Fixed, 95% CI) | 0.0 [0.0, 0.0] |
| 2.3 Elective or emergency CS not specified | 0 | 0 | Risk Ratio (M‐H, Fixed, 95% CI) | 0.0 [0.0, 0.0] |
| 3 Intragastric pH < 2.5 at intubation | 0 | 0 | Risk Ratio (M‐H, Fixed, 95% CI) | 0.0 [0.0, 0.0] |
| 3.1 Elective CS | 0 | 0 | Risk Ratio (M‐H, Fixed, 95% CI) | 0.0 [0.0, 0.0] |
| 3.2 Emergency CS | 0 | 0 | Risk Ratio (M‐H, Fixed, 95% CI) | 0.0 [0.0, 0.0] |
| 3.3 Elective or emergency CS not specified | 0 | 0 | Risk Ratio (M‐H, Fixed, 95% CI) | 0.0 [0.0, 0.0] |
| 4 Intragastric volume > 0.4 mL/kg at intubation | 0 | 0 | Risk Ratio (M‐H, Fixed, 95% CI) | 0.0 [0.0, 0.0] |
| 4.1 Elective CS | 0 | 0 | Risk Ratio (M‐H, Fixed, 95% CI) | 0.0 [0.0, 0.0] |
| 4.2 Emergency CS | 0 | 0 | Risk Ratio (M‐H, Fixed, 95% CI) | 0.0 [0.0, 0.0] |
| 4.3 Elective or emergency CS not specified | 0 | 0 | Risk Ratio (M‐H, Fixed, 95% CI) | 0.0 [0.0, 0.0] |
| 5 Nausea | 0 | 0 | Risk Ratio (M‐H, Fixed, 95% CI) | 0.0 [0.0, 0.0] |
| 5.1 Elective CS | 0 | 0 | Risk Ratio (M‐H, Fixed, 95% CI) | 0.0 [0.0, 0.0] |
| 5.2 Emergency CS | 0 | 0 | Risk Ratio (M‐H, Fixed, 95% CI) | 0.0 [0.0, 0.0] |
| 5.3 Elective or emergency CS not specified | 0 | 0 | Risk Ratio (M‐H, Fixed, 95% CI) | 0.0 [0.0, 0.0] |
| 6 Vomiting | 0 | 0 | Risk Ratio (M‐H, Fixed, 95% CI) | 0.0 [0.0, 0.0] |
| 6.1 Elective CS | 0 | 0 | Risk Ratio (M‐H, Fixed, 95% CI) | 0.0 [0.0, 0.0] |
| 6.2 Emergency CS | 0 | 0 | Risk Ratio (M‐H, Fixed, 95% CI) | 0.0 [0.0, 0.0] |
| 6.3 Emergency and elective CS non specified | 0 | 0 | Risk Ratio (M‐H, Fixed, 95% CI) | 0.0 [0.0, 0.0] |
| 7 Sedation | 0 | 0 | Risk Ratio (M‐H, Fixed, 95% CI) | 0.0 [0.0, 0.0] |
| 7.1 Elective CS | 0 | 0 | Risk Ratio (M‐H, Fixed, 95% CI) | 0.0 [0.0, 0.0] |
| 7.2 Emergency CS | 0 | 0 | Risk Ratio (M‐H, Fixed, 95% CI) | 0.0 [0.0, 0.0] |
| 7.3 Elective or emergency CS not specified | 0 | 0 | Risk Ratio (M‐H, Fixed, 95% CI) | 0.0 [0.0, 0.0] |
| 8 Restlessness | 0 | 0 | Risk Ratio (M‐H, Fixed, 95% CI) | 0.0 [0.0, 0.0] |
| 8.1 Elective CS | 0 | 0 | Risk Ratio (M‐H, Fixed, 95% CI) | 0.0 [0.0, 0.0] |
| 8.2 Emergency CS | 0 | 0 | Risk Ratio (M‐H, Fixed, 95% CI) | 0.0 [0.0, 0.0] |
| 8.3 Elective or emergency CS not specified | 0 | 0 | Risk Ratio (M‐H, Fixed, 95% CI) | 0.0 [0.0, 0.0] |
| 9 Dystonic reactions | 0 | 0 | Risk Ratio (M‐H, Fixed, 95% CI) | 0.0 [0.0, 0.0] |
| 9.1 Elective CS | 0 | 0 | Risk Ratio (M‐H, Fixed, 95% CI) | 0.0 [0.0, 0.0] |
| 9.2 Emergency CS | 0 | 0 | Risk Ratio (M‐H, Fixed, 95% CI) | 0.0 [0.0, 0.0] |
| 9.3 Elective or emergency CS not specified | 0 | 0 | Risk Ratio (M‐H, Fixed, 95% CI) | 0.0 [0.0, 0.0] |
| 10 Extrapyramidal symptoms | 0 | 0 | Risk Ratio (M‐H, Fixed, 95% CI) | 0.0 [0.0, 0.0] |
| 10.1 Elective CS | 0 | 0 | Risk Ratio (M‐H, Fixed, 95% CI) | 0.0 [0.0, 0.0] |
| 10.2 Emergency CS | 0 | 0 | Risk Ratio (M‐H, Fixed, 95% CI) | 0.0 [0.0, 0.0] |
| 10.3 Elective or emergency CS not specified | 0 | 0 | Risk Ratio (M‐H, Fixed, 95% CI) | 0.0 [0.0, 0.0] |
| 11 Hypotension | 0 | 0 | Risk Ratio (M‐H, Fixed, 95% CI) | 0.0 [0.0, 0.0] |
| 11.1 Elective CS | 0 | 0 | Risk Ratio (M‐H, Fixed, 95% CI) | 0.0 [0.0, 0.0] |
| 11.2 Emergency CS | 0 | 0 | Risk Ratio (M‐H, Fixed, 95% CI) | 0.0 [0.0, 0.0] |
| 11.3 Elective or emergency CS not specified | 0 | 0 | Risk Ratio (M‐H, Fixed, 95% CI) | 0.0 [0.0, 0.0] |
| 12 Blood loss | 0 | 0 | Std. Mean Difference (IV, Fixed, 95% CI) | 0.0 [0.0, 0.0] |
| 12.1 Elective CS | 0 | 0 | Std. Mean Difference (IV, Fixed, 95% CI) | 0.0 [0.0, 0.0] |
| 12.2 Emergency CS | 0 | 0 | Std. Mean Difference (IV, Fixed, 95% CI) | 0.0 [0.0, 0.0] |
| 12.3 Elective or emergency CS not specified | 0 | 0 | Std. Mean Difference (IV, Fixed, 95% CI) | 0.0 [0.0, 0.0] |
| 13 Atonic uterus | 0 | 0 | Risk Ratio (M‐H, Fixed, 95% CI) | 0.0 [0.0, 0.0] |
| 13.1 Elective CS | 0 | 0 | Risk Ratio (M‐H, Fixed, 95% CI) | 0.0 [0.0, 0.0] |
| 13.2 Emergency CS | 0 | 0 | Risk Ratio (M‐H, Fixed, 95% CI) | 0.0 [0.0, 0.0] |
| 13.3 Elective or emergency CS not specified | 0 | 0 | Risk Ratio (M‐H, Fixed, 95% CI) | 0.0 [0.0, 0.0] |
| 14 Women's satisfaction | 0 | 0 | Std. Mean Difference (IV, Fixed, 95% CI) | 0.0 [0.0, 0.0] |
| 14.1 Elective CS | 0 | 0 | Std. Mean Difference (IV, Fixed, 95% CI) | 0.0 [0.0, 0.0] |
| 14.2 Emergency CS | 0 | 0 | Std. Mean Difference (IV, Fixed, 95% CI) | 0.0 [0.0, 0.0] |
| 14.3 Elective or emergency CS not specified | 0 | 0 | Std. Mean Difference (IV, Fixed, 95% CI) | 0.0 [0.0, 0.0] |
| 15 Cord blood pH | 0 | 0 | Mean Difference (IV, Fixed, 95% CI) | 0.0 [0.0, 0.0] |
| 15.1 Elective CS | 0 | 0 | Mean Difference (IV, Fixed, 95% CI) | 0.0 [0.0, 0.0] |
| 15.2 Emergency CS | 0 | 0 | Mean Difference (IV, Fixed, 95% CI) | 0.0 [0.0, 0.0] |
| 15.3 Elective or emergency CS not specified | 0 | 0 | Mean Difference (IV, Fixed, 95% CI) | 0.0 [0.0, 0.0] |
| 16 Apgar score < 7 at 5 mins | 0 | 0 | Risk Ratio (M‐H, Fixed, 95% CI) | 0.0 [0.0, 0.0] |
| 16.1 Emergency CS | 0 | 0 | Risk Ratio (M‐H, Fixed, 95% CI) | 0.0 [0.0, 0.0] |
| 16.2 Elective CS | 0 | 0 | Risk Ratio (M‐H, Fixed, 95% CI) | 0.0 [0.0, 0.0] |
| 16.3 Emergency and elective CS non specified | 0 | 0 | Risk Ratio (M‐H, Fixed, 95% CI) | 0.0 [0.0, 0.0] |
| 17 Neonatal assessment scores | 0 | 0 | Std. Mean Difference (IV, Fixed, 95% CI) | 0.0 [0.0, 0.0] |
| 17.1 Elective CS | 0 | 0 | Std. Mean Difference (IV, Fixed, 95% CI) | 0.0 [0.0, 0.0] |
| 17.2 Emergency CS | 0 | 0 | Std. Mean Difference (IV, Fixed, 95% CI) | 0.0 [0.0, 0.0] |
| 17.3 Elective or emergency CS not specified | 0 | 0 | Std. Mean Difference (IV, Fixed, 95% CI) | 0.0 [0.0, 0.0] |
| 18 Admission to NICU | 0 | 0 | Risk Ratio (M‐H, Fixed, 95% CI) | 0.0 [0.0, 0.0] |
| 18.1 Elective CS | 0 | 0 | Risk Ratio (M‐H, Fixed, 95% CI) | 0.0 [0.0, 0.0] |
| 18.2 Emergency CS | 0 | 0 | Risk Ratio (M‐H, Fixed, 95% CI) | 0.0 [0.0, 0.0] |
| 18.3 Elective or emergency CS not specified | 0 | 0 | Risk Ratio (M‐H, Fixed, 95% CI) | 0.0 [0.0, 0.0] |
| 19 Initiation of breastfeeding | 0 | 0 | Risk Ratio (M‐H, Fixed, 95% CI) | 0.0 [0.0, 0.0] |
| 19.1 Elective CS | 0 | 0 | Risk Ratio (M‐H, Fixed, 95% CI) | 0.0 [0.0, 0.0] |
| 19.2 Emergency CS | 0 | 0 | Risk Ratio (M‐H, Fixed, 95% CI) | 0.0 [0.0, 0.0] |
| 19.3 Elective or emergency CS not specified | 0 | 0 | Risk Ratio (M‐H, Fixed, 95% CI) | 0.0 [0.0, 0.0] |
| 20 Duration of breastfeeding | 0 | 0 | Std. Mean Difference (IV, Fixed, 95% CI) | 0.0 [0.0, 0.0] |
| 20.1 Elective CS | 0 | 0 | Std. Mean Difference (IV, Fixed, 95% CI) | 0.0 [0.0, 0.0] |
| 20.2 Emergency CS | 0 | 0 | Std. Mean Difference (IV, Fixed, 95% CI) | 0.0 [0.0, 0.0] |
| 20.3 Elective or emergency CS not specified | 0 | 0 | Std. Mean Difference (IV, Fixed, 95% CI) | 0.0 [0.0, 0.0] |
| 21 Intragastric pH < 2.5 at extubation | 0 | 0 | Risk Ratio (M‐H, Fixed, 95% CI) | 0.0 [0.0, 0.0] |
| 21.1 Elective CS | 0 | 0 | Risk Ratio (M‐H, Fixed, 95% CI) | 0.0 [0.0, 0.0] |
| 21.2 Emergency CS | 0 | 0 | Risk Ratio (M‐H, Fixed, 95% CI) | 0.0 [0.0, 0.0] |
| 21.3 Elective or emergency CS not specified | 0 | 0 | Risk Ratio (M‐H, Fixed, 95% CI) | 0.0 [0.0, 0.0] |
| 22 Intragastric volume > 0.4 mL/kg at extubation | 0 | 0 | Risk Ratio (M‐H, Fixed, 95% CI) | 0.0 [0.0, 0.0] |
| 22.1 Elective CS | 0 | 0 | Risk Ratio (M‐H, Fixed, 95% CI) | 0.0 [0.0, 0.0] |
| 22.2 Emergency CS | 0 | 0 | Risk Ratio (M‐H, Fixed, 95% CI) | 0.0 [0.0, 0.0] |
| 22.3 Elective or emergency CS not specified | 0 | 0 | Risk Ratio (M‐H, Fixed, 95% CI) | 0.0 [0.0, 0.0] |
| 23 Risk of aspiration (not pre‐specified) | 1 | 112 | Risk Ratio (M‐H, Fixed, 95% CI) | 0.33 [0.10, 1.15] |
| 23.1 Emergency CS | 1 | 112 | Risk Ratio (M‐H, Fixed, 95% CI) | 0.33 [0.10, 1.15] |
| 23.2 Elective CS | 0 | 0 | Risk Ratio (M‐H, Fixed, 95% CI) | 0.0 [0.0, 0.0] |
| 23.3 Elective or emergency CS not specified | 0 | 0 | Risk Ratio (M‐H, Fixed, 95% CI) | 0.0 [0.0, 0.0] |
Comparison 17. H2 antagonist + prokinetic versus H2 antagonist.
| Outcome or subgroup title | No. of studies | No. of participants | Statistical method | Effect size |
|---|---|---|---|---|
| 1 Mortality due to aspiration pneumonitis | 0 | 0 | Risk Ratio (M‐H, Fixed, 95% CI) | 0.0 [0.0, 0.0] |
| 1.1 Elective CS | 0 | 0 | Risk Ratio (M‐H, Fixed, 95% CI) | 0.0 [0.0, 0.0] |
| 1.2 Emergency CS | 0 | 0 | Risk Ratio (M‐H, Fixed, 95% CI) | 0.0 [0.0, 0.0] |
| 1.3 Elective or emergency CS not specified | 0 | 0 | Risk Ratio (M‐H, Fixed, 95% CI) | 0.0 [0.0, 0.0] |
| 2 Morbidity due to aspiration pneumonitis | 0 | 0 | Risk Ratio (M‐H, Fixed, 95% CI) | 0.0 [0.0, 0.0] |
| 2.1 Elective CS | 0 | 0 | Risk Ratio (M‐H, Fixed, 95% CI) | 0.0 [0.0, 0.0] |
| 2.2 Emergency CS | 0 | 0 | Risk Ratio (M‐H, Fixed, 95% CI) | 0.0 [0.0, 0.0] |
| 2.3 Elective or emergency CS not specified | 0 | 0 | Risk Ratio (M‐H, Fixed, 95% CI) | 0.0 [0.0, 0.0] |
| 3 Intragastric pH < 2.5 at intubation | 0 | 0 | Risk Ratio (M‐H, Fixed, 95% CI) | 0.0 [0.0, 0.0] |
| 3.1 Elective CS | 0 | 0 | Risk Ratio (M‐H, Fixed, 95% CI) | 0.0 [0.0, 0.0] |
| 3.2 Emergency CS | 0 | 0 | Risk Ratio (M‐H, Fixed, 95% CI) | 0.0 [0.0, 0.0] |
| 3.3 Elective or emergency CS not specified | 0 | 0 | Risk Ratio (M‐H, Fixed, 95% CI) | 0.0 [0.0, 0.0] |
| 4 Intragastric volume > 0.4 mL/kg at intubation | 0 | 0 | Risk Ratio (M‐H, Fixed, 95% CI) | 0.0 [0.0, 0.0] |
| 4.1 Elective CS | 0 | 0 | Risk Ratio (M‐H, Fixed, 95% CI) | 0.0 [0.0, 0.0] |
| 4.2 Emergency CS | 0 | 0 | Risk Ratio (M‐H, Fixed, 95% CI) | 0.0 [0.0, 0.0] |
| 4.3 Elective or emergency CS not specified | 0 | 0 | Risk Ratio (M‐H, Fixed, 95% CI) | 0.0 [0.0, 0.0] |
| 5 Nausea | 0 | 0 | Risk Ratio (M‐H, Fixed, 95% CI) | 0.0 [0.0, 0.0] |
| 5.1 Elective CS | 0 | 0 | Risk Ratio (M‐H, Fixed, 95% CI) | 0.0 [0.0, 0.0] |
| 5.2 Emergency CS | 0 | 0 | Risk Ratio (M‐H, Fixed, 95% CI) | 0.0 [0.0, 0.0] |
| 5.3 Elective or emergency CS not specified | 0 | 0 | Risk Ratio (M‐H, Fixed, 95% CI) | 0.0 [0.0, 0.0] |
| 6 Vomiting | 0 | 0 | Risk Ratio (M‐H, Fixed, 95% CI) | 0.0 [0.0, 0.0] |
| 6.1 Elective CS | 0 | 0 | Risk Ratio (M‐H, Fixed, 95% CI) | 0.0 [0.0, 0.0] |
| 6.2 Emergency CS | 0 | 0 | Risk Ratio (M‐H, Fixed, 95% CI) | 0.0 [0.0, 0.0] |
| 6.3 Emergency and elective CS non specified | 0 | 0 | Risk Ratio (M‐H, Fixed, 95% CI) | 0.0 [0.0, 0.0] |
| 7 Sedation | 0 | 0 | Risk Ratio (M‐H, Fixed, 95% CI) | 0.0 [0.0, 0.0] |
| 7.1 Elective CS | 0 | 0 | Risk Ratio (M‐H, Fixed, 95% CI) | 0.0 [0.0, 0.0] |
| 7.2 Emergency CS | 0 | 0 | Risk Ratio (M‐H, Fixed, 95% CI) | 0.0 [0.0, 0.0] |
| 7.3 Elective or emergency CS not specified | 0 | 0 | Risk Ratio (M‐H, Fixed, 95% CI) | 0.0 [0.0, 0.0] |
| 8 Restlessness | 0 | 0 | Risk Ratio (M‐H, Fixed, 95% CI) | 0.0 [0.0, 0.0] |
| 8.1 Elective CS | 0 | 0 | Risk Ratio (M‐H, Fixed, 95% CI) | 0.0 [0.0, 0.0] |
| 8.2 Emergency CS | 0 | 0 | Risk Ratio (M‐H, Fixed, 95% CI) | 0.0 [0.0, 0.0] |
| 8.3 Elective or emergency CS not specified | 0 | 0 | Risk Ratio (M‐H, Fixed, 95% CI) | 0.0 [0.0, 0.0] |
| 9 Dystonic reactions | 0 | 0 | Risk Ratio (M‐H, Fixed, 95% CI) | 0.0 [0.0, 0.0] |
| 9.1 Elective CS | 0 | 0 | Risk Ratio (M‐H, Fixed, 95% CI) | 0.0 [0.0, 0.0] |
| 9.2 Emergency CS | 0 | 0 | Risk Ratio (M‐H, Fixed, 95% CI) | 0.0 [0.0, 0.0] |
| 9.3 Elective or emergency CS not specified | 0 | 0 | Risk Ratio (M‐H, Fixed, 95% CI) | 0.0 [0.0, 0.0] |
| 10 Extrapyramidal symptoms | 0 | 0 | Risk Ratio (M‐H, Fixed, 95% CI) | 0.0 [0.0, 0.0] |
| 10.1 Elective CS | 0 | 0 | Risk Ratio (M‐H, Fixed, 95% CI) | 0.0 [0.0, 0.0] |
| 10.2 Emergency CS | 0 | 0 | Risk Ratio (M‐H, Fixed, 95% CI) | 0.0 [0.0, 0.0] |
| 10.3 Elective or emergency CS not specified | 0 | 0 | Risk Ratio (M‐H, Fixed, 95% CI) | 0.0 [0.0, 0.0] |
| 11 Hypotension | 0 | 0 | Risk Ratio (M‐H, Fixed, 95% CI) | 0.0 [0.0, 0.0] |
| 11.1 Elective CS | 0 | 0 | Risk Ratio (M‐H, Fixed, 95% CI) | 0.0 [0.0, 0.0] |
| 11.2 Emergency CS | 0 | 0 | Risk Ratio (M‐H, Fixed, 95% CI) | 0.0 [0.0, 0.0] |
| 11.3 Elective or emergency CS not specified | 0 | 0 | Risk Ratio (M‐H, Fixed, 95% CI) | 0.0 [0.0, 0.0] |
| 12 Blood loss | 0 | 0 | Std. Mean Difference (IV, Fixed, 95% CI) | 0.0 [0.0, 0.0] |
| 12.1 Elective CS | 0 | 0 | Std. Mean Difference (IV, Fixed, 95% CI) | 0.0 [0.0, 0.0] |
| 12.2 Emergency CS | 0 | 0 | Std. Mean Difference (IV, Fixed, 95% CI) | 0.0 [0.0, 0.0] |
| 12.3 Elective or emergency CS not specified | 0 | 0 | Std. Mean Difference (IV, Fixed, 95% CI) | 0.0 [0.0, 0.0] |
| 13 Atonic uterus | 0 | 0 | Risk Ratio (M‐H, Fixed, 95% CI) | 0.0 [0.0, 0.0] |
| 13.1 Elective CS | 0 | 0 | Risk Ratio (M‐H, Fixed, 95% CI) | 0.0 [0.0, 0.0] |
| 13.2 Emergency CS | 0 | 0 | Risk Ratio (M‐H, Fixed, 95% CI) | 0.0 [0.0, 0.0] |
| 13.3 Elective or emergency CS not specified | 0 | 0 | Risk Ratio (M‐H, Fixed, 95% CI) | 0.0 [0.0, 0.0] |
| 14 Women's satisfaction | 0 | 0 | Std. Mean Difference (IV, Fixed, 95% CI) | 0.0 [0.0, 0.0] |
| 14.1 Elective CS | 0 | 0 | Std. Mean Difference (IV, Fixed, 95% CI) | 0.0 [0.0, 0.0] |
| 14.2 Emergency CS | 0 | 0 | Std. Mean Difference (IV, Fixed, 95% CI) | 0.0 [0.0, 0.0] |
| 14.3 Elective or emergency CS not specified | 0 | 0 | Std. Mean Difference (IV, Fixed, 95% CI) | 0.0 [0.0, 0.0] |
| 15 Cord blood pH | 0 | 0 | Mean Difference (IV, Fixed, 95% CI) | 0.0 [0.0, 0.0] |
| 15.1 Elective CS | 0 | 0 | Mean Difference (IV, Fixed, 95% CI) | 0.0 [0.0, 0.0] |
| 15.2 Emergency CS | 0 | 0 | Mean Difference (IV, Fixed, 95% CI) | 0.0 [0.0, 0.0] |
| 15.3 Elective or emergency CS not specified | 0 | 0 | Mean Difference (IV, Fixed, 95% CI) | 0.0 [0.0, 0.0] |
| 16 Apgar score < 7 at 5 mins | 0 | 0 | Risk Ratio (M‐H, Fixed, 95% CI) | 0.0 [0.0, 0.0] |
| 16.1 Emergency CS | 0 | 0 | Risk Ratio (M‐H, Fixed, 95% CI) | 0.0 [0.0, 0.0] |
| 16.2 Elective CS | 0 | 0 | Risk Ratio (M‐H, Fixed, 95% CI) | 0.0 [0.0, 0.0] |
| 16.3 Emergency and elective CS non specified | 0 | 0 | Risk Ratio (M‐H, Fixed, 95% CI) | 0.0 [0.0, 0.0] |
| 17 Neonatal assessment scores | 0 | 0 | Std. Mean Difference (IV, Fixed, 95% CI) | 0.0 [0.0, 0.0] |
| 17.1 Elective CS | 0 | 0 | Std. Mean Difference (IV, Fixed, 95% CI) | 0.0 [0.0, 0.0] |
| 17.2 Emergency CS | 0 | 0 | Std. Mean Difference (IV, Fixed, 95% CI) | 0.0 [0.0, 0.0] |
| 17.3 Elective or emergency CS not specified | 0 | 0 | Std. Mean Difference (IV, Fixed, 95% CI) | 0.0 [0.0, 0.0] |
| 18 Admission to NICU | 0 | 0 | Risk Ratio (M‐H, Fixed, 95% CI) | 0.0 [0.0, 0.0] |
| 18.1 Elective CS | 0 | 0 | Risk Ratio (M‐H, Fixed, 95% CI) | 0.0 [0.0, 0.0] |
| 18.2 Emergency CS | 0 | 0 | Risk Ratio (M‐H, Fixed, 95% CI) | 0.0 [0.0, 0.0] |
| 18.3 Elective or emergency CS not specified | 0 | 0 | Risk Ratio (M‐H, Fixed, 95% CI) | 0.0 [0.0, 0.0] |
| 19 Initiation of breastfeeding | 0 | 0 | Risk Ratio (M‐H, Fixed, 95% CI) | 0.0 [0.0, 0.0] |
| 19.1 Elective CS | 0 | 0 | Risk Ratio (M‐H, Fixed, 95% CI) | 0.0 [0.0, 0.0] |
| 19.2 Emergency CS | 0 | 0 | Risk Ratio (M‐H, Fixed, 95% CI) | 0.0 [0.0, 0.0] |
| 19.3 Elective or emergency CS not specified | 0 | 0 | Risk Ratio (M‐H, Fixed, 95% CI) | 0.0 [0.0, 0.0] |
| 20 Duration of breastfeeding | 0 | 0 | Std. Mean Difference (IV, Fixed, 95% CI) | 0.0 [0.0, 0.0] |
| 20.1 Elective CS | 0 | 0 | Std. Mean Difference (IV, Fixed, 95% CI) | 0.0 [0.0, 0.0] |
| 20.2 Emergency CS | 0 | 0 | Std. Mean Difference (IV, Fixed, 95% CI) | 0.0 [0.0, 0.0] |
| 20.3 Elective or emergency CS not specified | 0 | 0 | Std. Mean Difference (IV, Fixed, 95% CI) | 0.0 [0.0, 0.0] |
| 21 Intragastric pH < 2.5 at extubation | 0 | 0 | Risk Ratio (M‐H, Fixed, 95% CI) | 0.0 [0.0, 0.0] |
| 21.1 Elective CS | 0 | 0 | Risk Ratio (M‐H, Fixed, 95% CI) | 0.0 [0.0, 0.0] |
| 21.2 Emergency CS | 0 | 0 | Risk Ratio (M‐H, Fixed, 95% CI) | 0.0 [0.0, 0.0] |
| 21.3 Elective or emergency CS not specified | 0 | 0 | Risk Ratio (M‐H, Fixed, 95% CI) | 0.0 [0.0, 0.0] |
| 22 Intragastric volume > 0.4 mL/kg at extubation | 0 | 0 | Risk Ratio (M‐H, Fixed, 95% CI) | 0.0 [0.0, 0.0] |
| 22.1 Elective CS | 0 | 0 | Risk Ratio (M‐H, Fixed, 95% CI) | 0.0 [0.0, 0.0] |
| 22.2 Emergency CS | 0 | 0 | Risk Ratio (M‐H, Fixed, 95% CI) | 0.0 [0.0, 0.0] |
| 22.3 Elective or emergency CS not specified | 0 | 0 | Risk Ratio (M‐H, Fixed, 95% CI) | 0.0 [0.0, 0.0] |
| 23 Intragastric pH > 2.5 post intubation (not pre‐specified) | 1 | 50 | Risk Ratio (M‐H, Fixed, 95% CI) | 1.04 [0.93, 1.16] |
| 23.1 Elective CS | 1 | 50 | Risk Ratio (M‐H, Fixed, 95% CI) | 1.04 [0.93, 1.16] |
| 23.2 Emergency CS | 0 | 0 | Risk Ratio (M‐H, Fixed, 95% CI) | 0.0 [0.0, 0.0] |
| 23.3 Emergency and elective CS not specified | 0 | 0 | Risk Ratio (M‐H, Fixed, 95% CI) | 0.0 [0.0, 0.0] |
| 24 Intragastric volume <0.4 mL/kg post intubation (not pre‐specified) | 1 | 50 | Risk Ratio (M‐H, Fixed, 95% CI) | 0.86 [0.66, 1.12] |
| 24.1 Elective CS | 1 | 50 | Risk Ratio (M‐H, Fixed, 95% CI) | 0.86 [0.66, 1.12] |
| 24.2 Emergency CS | 0 | 0 | Risk Ratio (M‐H, Fixed, 95% CI) | 0.0 [0.0, 0.0] |
| 24.3 Emergency and elective CS not specified | 0 | 0 | Risk Ratio (M‐H, Fixed, 95% CI) | 0.0 [0.0, 0.0] |
| 25 Risk of aspiration (not pre‐specified) | 1 | 50 | Risk Ratio (M‐H, Fixed, 95% CI) | 0.0 [0.0, 0.0] |
| 25.1 Elective CS | 1 | 50 | Risk Ratio (M‐H, Fixed, 95% CI) | 0.0 [0.0, 0.0] |
| 25.2 Emergency CS | 0 | 0 | Risk Ratio (M‐H, Fixed, 95% CI) | 0.0 [0.0, 0.0] |
| 25.3 Emergency and elective CS not specified | 0 | 0 | Risk Ratio (M‐H, Fixed, 95% CI) | 0.0 [0.0, 0.0] |
| 26 Gastric volume post intubation (not pre‐specified) | 1 | 50 | Mean Difference (IV, Fixed, 95% CI) | 1.30 [‐3.17, 5.77] |
| 26.1 Elective CS | 1 | 50 | Mean Difference (IV, Fixed, 95% CI) | 1.30 [‐3.17, 5.77] |
| 26.2 Emergency CS | 0 | 0 | Mean Difference (IV, Fixed, 95% CI) | 0.0 [0.0, 0.0] |
| 26.3 Emergency and elective CS not specified | 0 | 0 | Mean Difference (IV, Fixed, 95% CI) | 0.0 [0.0, 0.0] |
| 27 Gastric pH post intubation (not pre‐specified) | 1 | 50 | Mean Difference (IV, Fixed, 95% CI) | 0.59 [‐0.14, 1.32] |
| 27.1 Elective CS | 1 | 50 | Mean Difference (IV, Fixed, 95% CI) | 0.59 [‐0.14, 1.32] |
| 27.2 Emergency CS | 0 | 0 | Mean Difference (IV, Fixed, 95% CI) | 0.0 [0.0, 0.0] |
| 27.3 Emergency and elective CS not specified | 0 | 0 | Mean Difference (IV, Fixed, 95% CI) | 0.0 [0.0, 0.0] |
17.24. Analysis.
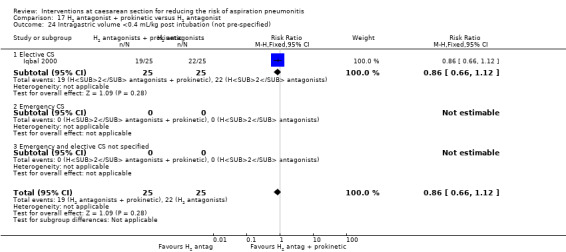
Comparison 17 H2 antagonist + prokinetic versus H2 antagonist, Outcome 24 Intragastric volume <0.4 mL/kg post intubation (not pre‐specified).
17.25. Analysis.
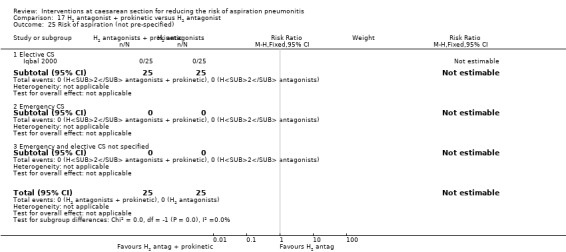
Comparison 17 H2 antagonist + prokinetic versus H2 antagonist, Outcome 25 Risk of aspiration (not pre‐specified).
17.26. Analysis.
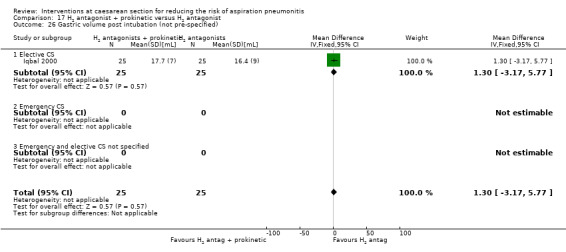
Comparison 17 H2 antagonist + prokinetic versus H2 antagonist, Outcome 26 Gastric volume post intubation (not pre‐specified).
17.27. Analysis.
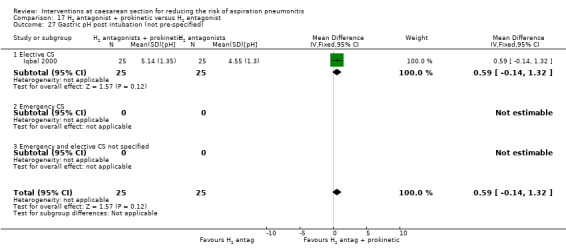
Comparison 17 H2 antagonist + prokinetic versus H2 antagonist, Outcome 27 Gastric pH post intubation (not pre‐specified).
Characteristics of studies
Characteristics of included studies [ordered by study ID]
Bifarini 1990.
| Methods | Randomisd women into 3 groups. | |
| Participants | Women undergoing CS, both elective and non‐elective. N = 48. |
|
| Interventions |
|
|
| Outcomes | Apgar scores and haematological tests. Also nasogastric tube examination. | |
| Notes | Data could not be used. Apgar scores were reported as means and the laboratory tests were not part of our review. | |
| Risk of bias | ||
| Bias | Authors' judgement | Support for judgement |
| Random sequence generation (selection bias) | Unclear risk | '...randomly assigned...'. |
| Allocation concealment (selection bias) | Unclear risk | Not reported. |
| Blinding (performance bias and detection bias) All outcomes | Unclear risk | Not reported. |
| Incomplete outcome data (attrition bias) All outcomes | Low risk | No dropouts reported. |
| Selective reporting (reporting bias) | Unclear risk | We did not assess the trial protocol. |
| Other bias | Unclear risk | Insufficient information to make a judgement. |
Bifarini 1992.
| Methods | Randomisd women into 3 groups. | |
| Participants | Women undergoing CS, either elective and non‐elective. N = 75. |
|
| Interventions |
|
|
| Outcomes | Gastric acidity and volume. | |
| Notes | Data could not be used. Results were expressed as mean values with no SDs. | |
| Risk of bias | ||
| Bias | Authors' judgement | Support for judgement |
| Random sequence generation (selection bias) | Unclear risk | Translated as '...randomly divided...' |
| Allocation concealment (selection bias) | Unclear risk | Not described. |
| Blinding (performance bias and detection bias) All outcomes | Unclear risk | Not described. |
| Incomplete outcome data (attrition bias) All outcomes | Unclear risk | No information. |
| Selective reporting (reporting bias) | Unclear risk | We did not assess the trial protocol. |
| Other bias | Unclear risk | Insufficient information provided to assess this. |
Bylsma‐Howell 1983.
| Methods | RCT. | |
| Participants | Women at term having CS under general anaesthesia. N = 23. |
|
| Interventions |
|
|
| Outcomes | Gastric volume, Apgar score, level metoclopramide in fetal venous and arterial blood. | |
| Notes | Data could not be used. Analyses were not by ITT.Three babies developed respiratory difficulties at birth and were transferred to intensive care nursery. Since these babies were lost to follow‐up they were excluded ‐ leaving 20 for analysis (13% loss). | |
| Risk of bias | ||
| Bias | Authors' judgement | Support for judgement |
| Random sequence generation (selection bias) | Unclear risk | '...randomised double blind manner....' |
| Allocation concealment (selection bias) | Unclear risk | No information provided. |
| Blinding (performance bias and detection bias) All outcomes | Low risk | Authors describe this as a double blinded study, although they provide no information about how blinding was achieved. |
| Incomplete outcome data (attrition bias) All outcomes | Unclear risk | 3 women were excluded because their babies went to intensive care and the data were not collected. These babies and their mothers should have been included but there is no information as to which randomised group they were allocated. |
| Selective reporting (reporting bias) | Unclear risk | We did not assess the trial protocol. |
| Other bias | Unclear risk | Insufficient information provided to assess this. |
Dewan 1985.
| Methods | Randomised women to 3 groups. | |
| Participants | Healthy women at term scheduled for elective CS under GA. N = 32. |
|
| Interventions | 1. 30 mL 0.3 M sodium citrate < 60 mins pre‐op (intervention group1). 2. 30 mL 0.3 M sodium citrate > 60 mins pre‐op (intervention group 2). 3. No antacid (comparison group). | |
| Outcomes | Gastric volume and pH postintubation. | |
| Notes | We excluded data from the group that was given antacid > 60 mins pre‐op as the optimum effectiveness for giving antacids is within 60 mins of the operation. | |
| Risk of bias | ||
| Bias | Authors' judgement | Support for judgement |
| Random sequence generation (selection bias) | Unclear risk | "...randomly assigned." |
| Allocation concealment (selection bias) | High risk | Not described. |
| Blinding (performance bias and detection bias) All outcomes | Unclear risk | No mention of blinding. |
| Incomplete outcome data (attrition bias) All outcomes | Low risk | No loss to follow‐up. |
| Selective reporting (reporting bias) | Unclear risk | We did not assess the trial protocol. |
| Other bias | Low risk | No evidence of other bias. |
Elhakim 2005.
| Methods | RCT. | |
| Participants | Pregnant women ASA 1 undergoing elective CS. N = 60. |
|
| Interventions |
|
|
| Outcomes | Gastric pH and volume. Apgar scores. Frequency and severity of nausea. Pain scores. Blood gases ‐ umbilical, venous and arterial blood gases. | |
| Notes | Some of the data have been presented as median and range and therefore not used. | |
| Risk of bias | ||
| Bias | Authors' judgement | Support for judgement |
| Random sequence generation (selection bias) | Low risk | Computer‐generated random number. |
| Allocation concealment (selection bias) | Unclear risk | Not described. |
| Blinding (performance bias and detection bias) All outcomes | Low risk | Paediatrician and anaesthetist. |
| Incomplete outcome data (attrition bias) All outcomes | Low risk | No loss of participants. |
| Selective reporting (reporting bias) | Unclear risk | We did not assess the trial protocol. |
| Other bias | Low risk | No evidence for other bias. |
Ewart 1990a.
| Methods | RCT. | |
| Participants | Scheduled CSs under general anaesthesia in healthy uncomplicated pregnancies of at least 36 weeks. N = 70. |
|
| Interventions | 1. 40 mg omeprazole orally at 22.00 hrs and 06.00 in the morning of surgery (intervention group). 2. 150 mg of ranitidine orally at 22.00 hrs and 06.00 in the morning of surgery (comparison group). | |
| Outcomes | Gastric volume and ph measured after in the induction of anaesthesia and on completion of surgery. Apgar scores. |
|
| Notes | ||
| Risk of bias | ||
| Bias | Authors' judgement | Support for judgement |
| Random sequence generation (selection bias) | Unclear risk | Not described. |
| Allocation concealment (selection bias) | Unclear risk | Not described. |
| Blinding (performance bias and detection bias) All outcomes | Unclear risk | Not described. |
| Incomplete outcome data (attrition bias) All outcomes | Unclear risk | 70 recruited, 5 withdrawn. |
| Selective reporting (reporting bias) | Unclear risk | We did not assess the trial protocol. |
| Other bias | Unclear risk | Unclear how many women were approached but did not want to take part in the trial ‐ this may contribute to selection bias. |
Fogarty 1992.
| Methods | RCT. | |
| Participants | Women having obstetric surgery. | |
| Interventions |
|
|
| Outcomes | ||
| Notes | Data could not be used. There was no information as to how many women were included in the study overall, nor how many were randomised to each group. Conference abstract only. | |
| Risk of bias | ||
| Bias | Authors' judgement | Support for judgement |
| Random sequence generation (selection bias) | Unclear risk | '..randomised...' |
| Allocation concealment (selection bias) | Unclear risk | No information. |
| Blinding (performance bias and detection bias) All outcomes | Low risk | Authors report this as 'double blinded' although no information as to how that was achieved. |
| Incomplete outcome data (attrition bias) All outcomes | Unclear risk | No information. |
| Selective reporting (reporting bias) | Unclear risk | We did not assess the trial protocol. |
| Other bias | Unclear risk | Insufficient information to enable us to make a judgement here. |
Frank 1984.
| Methods | RCT. | |
| Participants | Pregnant women (ASA 1 & 2) at term having either a emergency or elective CS under general anaesthesia. N = 42. |
|
| Interventions |
Elective CS interventions 1. 15 mL mg trisilicate mixture BPC before transfer to theatre and further 15 mL before induction of anaesthesia. 2. 15 mL sodium citrate mixture before transfer to theatre and further 15 mL before induction of anaesthesia. 3. Cimetidine 400 mg po night before the operation and 200 mg IM 90 mins before the induction of anaesthesia. Emergency CS interventions 1. 15 mL mg trisilicate mixture BPC every 2 hrs throughout labour and again before induction of anaesthesia. 2. 15 mL of sodium citrate every 2 hrs throughout labour and again before induction of anaesthesia. 3. Loading dose of 400 mg of cimetidine po followed by 200 mg po every 2 hrs for a maximum of 7 doses. |
|
| Outcomes | Gastric pH and gastric volume, neonatal Apgar scores. | |
| Notes | ||
| Risk of bias | ||
| Bias | Authors' judgement | Support for judgement |
| Random sequence generation (selection bias) | Unclear risk | Not described. |
| Allocation concealment (selection bias) | Unclear risk | Not described. |
| Blinding (performance bias and detection bias) All outcomes | High risk | No information ‐ unlikely due to the type of interventions involved. |
| Incomplete outcome data (attrition bias) All outcomes | Unclear risk | Participant loss and exclusion not described. |
| Selective reporting (reporting bias) | Unclear risk | We did not assess the trial protocol. |
| Other bias | Low risk | No evidence of other bias. |
Hodgkinson 1983.
| Methods | RCT. | |
| Participants | Women having elective CS under general anaesthesia. | |
| Interventions |
|
|
| Outcomes | Gastric volume, gastric pH, Apgar score, maternal and neonatal complications. | |
| Notes |
Data could not be used. Analyses were not by ITT. Not ITT analysis for primary outcome and poor randomisation exclusion rates. |
|
| Risk of bias | ||
| Bias | Authors' judgement | Support for judgement |
| Random sequence generation (selection bias) | Unclear risk | "...allocated in a random, double‐blind manner..." |
| Allocation concealment (selection bias) | Unclear risk | No information provided. |
| Blinding (performance bias and detection bias) All outcomes | Low risk | "... placebo mixture identical in appearance..." |
| Incomplete outcome data (attrition bias) All outcomes | High risk | "A physician unaware of the treatment administration excluded 37 of the 126 case records from the analysis of gastric secretion because of protocol violations but included the in the safety assessments. Thirteen of the 37 had been entered by one investigator in an unblinded study as required by his Institutional Review Board. The remainder were excluded because general anaesthesia was not induced between 1 and 3 hr of the morning administration of the appropriate medication." |
| Selective reporting (reporting bias) | Unclear risk | We did to assess the trial protocol. |
| Other bias | Unclear risk | Difficult to assess. |
Hong 2004.
| Methods | RCT. | |
| Participants | Pregnant women undergoing elective CS. N = 40. |
|
| Interventions | 1. 5% Dextrose 120 mL/hr (intervention group). 2. 120 mL/hr N saline (comparison group). | |
| Outcomes | Gastric volume and ph reported as "at risk of aspiration". | |
| Notes | ||
| Risk of bias | ||
| Bias | Authors' judgement | Support for judgement |
| Random sequence generation (selection bias) | Unclear risk | Not described. |
| Allocation concealment (selection bias) | Unclear risk | Not described. |
| Blinding (performance bias and detection bias) All outcomes | Unclear risk | No details given. |
| Incomplete outcome data (attrition bias) All outcomes | Unclear risk | Insufficient detail to assess. |
| Selective reporting (reporting bias) | Unclear risk | We did not assess the trial protocol. |
| Other bias | Unclear risk | Insufficient detail to assess. |
Husemeyer 1980.
| Methods | RCT. | |
| Participants | Elective CS of 37 weeks or more gestation for non acute obstetric indications. N = 62. |
|
| Interventions | 1. 400 mg cimetidine po + 20 mL water 2‐6 hrs before anaesthesia (intervention group). 2. Magnesium trisilicate mixture BPC 20 mL within 1 hr before anaesthesia (comparison group). | |
| Outcomes | Maternal gastric pH and volume (postinduction of anaesthesia). | |
| Notes | pH data not used as median and range given. Magnesium trisilicate is a particulate antacid and mostly not to be used nowadays. |
|
| Risk of bias | ||
| Bias | Authors' judgement | Support for judgement |
| Random sequence generation (selection bias) | Unclear risk | Not described. |
| Allocation concealment (selection bias) | Unclear risk | Not described. |
| Blinding (performance bias and detection bias) All outcomes | Unclear risk | No details of blinding. |
| Incomplete outcome data (attrition bias) All outcomes | Low risk | All participants accounted for. |
| Selective reporting (reporting bias) | Unclear risk | We did not assess the trial protocol. |
| Other bias | Low risk | No evidence of other bias. |
Iqbal 2000.
| Methods | RCT. | |
| Participants | ASA 1‐2 elective CS. N = 75. |
|
| Interventions | 1. Ranitidine (intervention group 1). 2. Ranitidine + metoclopramide (intervention group 2). 3. Saline 4 mL (comparison group). | |
| Outcomes | Gastric volume and pH. Risk of aspiration. | |
| Notes | Unclear what dose of ranitidine was given to women. | |
| Risk of bias | ||
| Bias | Authors' judgement | Support for judgement |
| Random sequence generation (selection bias) | Unclear risk | "...randomised". |
| Allocation concealment (selection bias) | Unclear risk | Not described. |
| Blinding (performance bias and detection bias) All outcomes | Low risk | Double‐blind manner. |
| Incomplete outcome data (attrition bias) All outcomes | Low risk | Assume ITT. |
| Selective reporting (reporting bias) | Unclear risk | We did not assess the trial protocol. |
| Other bias | Low risk | No evidence for other bias. |
Jasson 1989.
| Methods | RCT. | |
| Participants | Women undergoing an elective CS under GA. N = 52. |
|
| Interventions | 1. Oral sodium citrate 0.3 30 mL 5 mins prior to anaesthesia (intervention group). 2. No medication prior to anaesthesia (control group). | |
| Outcomes | Gastric pH and gastric volume. | |
| Notes | ||
| Risk of bias | ||
| Bias | Authors' judgement | Support for judgement |
| Random sequence generation (selection bias) | Unclear risk | Method of allocation not stated. |
| Allocation concealment (selection bias) | Unclear risk | Method of allocation not stated. |
| Blinding (performance bias and detection bias) All outcomes | High risk | Not blinded. |
| Incomplete outcome data (attrition bias) All outcomes | Low risk | No outcome data on 1 patient due to pyloric reflux. |
| Selective reporting (reporting bias) | Unclear risk | We did not assess the trial protocol. |
| Other bias | Unclear risk | Difficult to assess as limited information. |
Lin 1996.
| Methods | RCT. | |
| Participants | Pregnant women ASA 1‐2, aged 21‐43 years old scheduled for elective CS under regional anaesthesia. N = 160. |
|
| Interventions | 1. Famotidine 40 mg (intervention group 1). 2. Ranitidine 300 mg (intervention group 2). 3. Omeprazole 40 mg (intervention group 3). 4. Placebo (comparison group). | |
| Outcomes | Gastric volume and pH. Percentage of women at risk of aspiration pH < 2.5 and volume > 0.4 mL/kg. | |
| Notes | ||
| Risk of bias | ||
| Bias | Authors' judgement | Support for judgement |
| Random sequence generation (selection bias) | Unclear risk | Not described. |
| Allocation concealment (selection bias) | Unclear risk | Not described. |
| Blinding (performance bias and detection bias) All outcomes | Low risk | "...double blind." |
| Incomplete outcome data (attrition bias) All outcomes | Unclear risk | 5 women excluded as time from premed to CS < 3 hrs ‐ unclear which groups these women were excluded from. |
| Selective reporting (reporting bias) | Unclear risk | We did not assess the trial protocol. |
| Other bias | Low risk | No evidence of other bias. |
O'Sullivan 1985.
| Methods | Randomised women into 5 groups. | |
| Participants | Women for elective CS and women for elective gynaecological surgery. Data presented separately. N = 80 women overall, but 40 pregnant women involved. |
|
| Interventions |
16 women in each group, equally divided between pregnant and non‐pregnant women. So 8 pregnant women in each group. |
|
| Outcomes | Intragastric pH; volume and serum gastrin‐17. | |
| Notes |
Data could not be used. Data expressed as medians and ranges. Findings indicated that ranitidine was most reliable method for raising intragastric pH. the addition of metoclopramide gave added reduction in gastric volume, |
|
| Risk of bias | ||
| Bias | Authors' judgement | Support for judgement |
| Random sequence generation (selection bias) | Unclear risk | "... were randomly assigned..." |
| Allocation concealment (selection bias) | Unclear risk | No information provided. |
| Blinding (performance bias and detection bias) All outcomes | Unclear risk | No information provided. |
| Incomplete outcome data (attrition bias) All outcomes | Low risk | No losses reported. |
| Selective reporting (reporting bias) | Unclear risk | We did not assess the trial protocols. |
| Other bias | Unclear risk | Difficult to assess. |
Ormezzano 1990.
| Methods | RCT. | |
| Participants | Pregnant ASA 1 & 2 women undergoing emergency and elective CS under general anaesthesia. N = 147. |
|
| Interventions | 1. Nothing (no pre med) (comparison group).
2. 0.3 M sodium citrate 15 mL (intervention group 1). 3. 400 mg cimetidine and 0.9 g sodium citrate in 15 mL water (intervention group 2). |
|
| Outcomes | Gastric pH. | |
| Notes | ||
| Risk of bias | ||
| Bias | Authors' judgement | Support for judgement |
| Random sequence generation (selection bias) | Unclear risk | Not described. |
| Allocation concealment (selection bias) | Unclear risk | Not described. |
| Blinding (performance bias and detection bias) All outcomes | Unclear risk | No details of blinding. |
| Incomplete outcome data (attrition bias) All outcomes | Low risk | All women accounted for. |
| Selective reporting (reporting bias) | Unclear risk | We did not assess the trial protocol. |
| Other bias | Low risk | No evidence of other bias. |
Orr 1993.
| Methods | RCT. | |
| Participants | Healthy pregnant women with an uncomplicated pregnancy of at least 36 weeks to be delivered by elective CS under general anaesthesia. N = 94. |
|
| Interventions | 1. 40 mg omeprazole (po) night before surgery and morning of surgery.
2. 80 mg omeprazole (po) morning of surgery.
3. 40 mg omeprazole (po) night before surgery and morning of surgery, and 10 mg metoclopramide (IM) 20 min before induction of anaesthesia. 4. 80 mg omeprazole (po) morning of surgery and 10 mg metoclopramide (IM) 20 min before induction of anaesthesia. |
|
| Outcomes | Postintubation and pre‐extubation gastric pH and volume, Apgar scores, neuro behavioural and adaptive scoring system (NACS), plasma and amniotic fluid omeprazole levels and risk of aspiration (pH < 2.5 and gastric volume ≥ 25 mL). | |
| Notes | ||
| Risk of bias | ||
| Bias | Authors' judgement | Support for judgement |
| Random sequence generation (selection bias) | Low risk | Computer‐generated schedule. |
| Allocation concealment (selection bias) | Low risk | Pre‐packed packs with matching placebo capsules and injections. |
| Blinding (performance bias and detection bias) All outcomes | Low risk | Women, clinicians and outcome assessors were blinded. |
| Incomplete outcome data (attrition bias) All outcomes | Low risk | No post randomisation exclusions; analysis was by ITT. |
| Selective reporting (reporting bias) | Unclear risk | We did not assess the trial protocol. |
| Other bias | Low risk | No evidence of other bias. |
Osman 1995.
| Methods | RCT. | |
| Participants | Women at term scheduled for emergency CS. N = 20. |
|
| Interventions |
|
|
| Outcomes | Gastric pH, gastric volume, maternal uterine contractions and fetal welfare. | |
| Notes | Data could not be used. No information on the number of women in each group and the data provided as ranges with SDs. We wrote to the authors but have had no response. | |
| Risk of bias | ||
| Bias | Authors' judgement | Support for judgement |
| Random sequence generation (selection bias) | Unclear risk | "...randomly divided..." |
| Allocation concealment (selection bias) | Unclear risk | No information provided. |
| Blinding (performance bias and detection bias) All outcomes | Unclear risk | No information provided. |
| Incomplete outcome data (attrition bias) All outcomes | Unclear risk | No information provided. Implies no outcome data lost, but not specified. |
| Selective reporting (reporting bias) | Unclear risk | We did not assess the trial protocol. |
| Other bias | Unclear risk | Difficult to assess. |
Ostheimer 1982.
| Methods | RCT. | |
| Participants | Pregnant women undergoing elective CS under general anaesthesia. N = 24. |
|
| Interventions | 1. 300 mg cimetidine IM 1 hr prior to induction of general anaesthesia (intervention group). 2. 30 mL antacid (mylanta 2) (comparison group). |
|
| Outcomes | Gastric volume and pH. Intrapartum and postpartum complications. Apgar scores 1 and 5 min after birth. Neonatal gastric volumes and pH within 10 mins of birth. Brazelton neonatal assessment scale. | |
| Notes | ||
| Risk of bias | ||
| Bias | Authors' judgement | Support for judgement |
| Random sequence generation (selection bias) | Unclear risk | Not described. |
| Allocation concealment (selection bias) | Unclear risk | Not described. |
| Blinding (performance bias and detection bias) All outcomes | Unclear risk | No details of blinding. |
| Incomplete outcome data (attrition bias) All outcomes | Unclear risk | Not enough data to assess. |
| Selective reporting (reporting bias) | Unclear risk | We did not assess the trial protocol. |
| Other bias | Low risk | No evidence of other bias. |
Ozkan 2000.
| Methods | RCT. | |
| Participants | Women with singleton pregnancies undergoing elective CS under general anaesthesia. N = 150. |
|
| Interventions | 1. Oral sodium nitrate (30 mL 0.3 mol/L). 2. Water (200 cc). 3. Ranitidine (50 mg IV). 4. Omeprazole (40 mg IV). 5. Metoclopramide (10 mg IV). | |
| Outcomes | At risk of aspiration defined as gastric residual volume > 0.4 mL and gastric pH < 2.5, postintubation and pre‐extubation. | |
| Notes | Also included continuous outcomes of gastric pH and gastric residual volume but unclear if data presented are SDs or standard errors. We will write to the authors to clarify. In the mean time we have not entered continuous data. | |
| Risk of bias | ||
| Bias | Authors' judgement | Support for judgement |
| Random sequence generation (selection bias) | Unclear risk | Not described. |
| Allocation concealment (selection bias) | Unclear risk | Not described. |
| Blinding (performance bias and detection bias) All outcomes | Unclear risk | Not described. |
| Incomplete outcome data (attrition bias) All outcomes | Unclear risk | Not enough data to assess. |
| Selective reporting (reporting bias) | Unclear risk | We did not assess the trial protocol. |
| Other bias | Unclear risk | Difficult to assess as limited information given. |
Pickering 1980.
| Methods | RCT. | |
| Participants | Healthy pregnant women undergoing elective CS under general anaesthesia. N = 17. |
|
| Interventions | 1. Cimetidine IM 300 mg (intervention group). 2. Antacid 30 mL gelusil (comparison group). | |
| Outcomes | Gastric pH and volume (intraoperative dilution technique) and 'at risk' pH < 2.5 and volume > 25 mL. | |
| Notes | Also measured intraoperative gastric volume using dilution technique. | |
| Risk of bias | ||
| Bias | Authors' judgement | Support for judgement |
| Random sequence generation (selection bias) | Unclear risk | Not described. |
| Allocation concealment (selection bias) | Unclear risk | Not described. |
| Blinding (performance bias and detection bias) All outcomes | High risk | No blinding reported. |
| Incomplete outcome data (attrition bias) All outcomes | Low risk | All women accounted for. |
| Selective reporting (reporting bias) | Unclear risk | We did not assess the trial protocol. |
| Other bias | Low risk | No evidence for other bias. |
Rocke 1994.
| Methods | RCT. | |
| Participants | Term singleton pregnancies requiring emergency CS under general anaesthesia. N = 541. |
|
| Interventions |
NB: Both groups received 10 mg IV metoclopramide + 0.3 M sodium citrate 30 mL orally. |
|
| Outcomes | Volume and pH of stomach contents postintubation and pre extubation. Risk of aspiration. | |
| Notes | Apgar score and gastric aspirate data are presented as medians and range and therefore not input. | |
| Risk of bias | ||
| Bias | Authors' judgement | Support for judgement |
| Random sequence generation (selection bias) | Unclear risk | Sequence generation not described. |
| Allocation concealment (selection bias) | Low risk | Pre‐randomised identical numbered vials. |
| Blinding (performance bias and detection bias) All outcomes | Low risk | Women, clinician and outcome assessor. |
| Incomplete outcome data (attrition bias) All outcomes | Low risk | 722 recruited and randomised, 181 withdrawn as per exclusion criteria. |
| Selective reporting (reporting bias) | Unclear risk | Data analysed in groups that were assigned but did not measure outcome in 3 controls and 6 in the study group ‐ unable to get enough aspirate. Also we did not assess the trial protocol. |
| Other bias | Low risk | No evidence of other bias. |
Roper 1981.
| Methods | Randomisation into 3 groups. | |
| Participants | Women undergoing elective CS. N = 127. |
|
| Interventions |
|
|
| Outcomes | Gastric volume, fetal heart rate, Apgar scores. | |
| Notes |
Data could not be used. The gastric secretion pH was not assessed dichotomously but portrayed in a graph form. Study suggested that both anticholenergics reduced. |
|
| Risk of bias | ||
| Bias | Authors' judgement | Support for judgement |
| Random sequence generation (selection bias) | Unclear risk | "...allocated randomly into three treatment regimes..." |
| Allocation concealment (selection bias) | Unclear risk | No information provided. |
| Blinding (performance bias and detection bias) All outcomes | Low risk | "...administered under double blind conditions..." |
| Incomplete outcome data (attrition bias) All outcomes | Unclear risk | No information provided and difficult to count how many points there are on the graphs. |
| Selective reporting (reporting bias) | Unclear risk | We did not assess the trial protocol. |
| Other bias | Unclear risk | Difficult to assess as limited information given. |
Rout 1993.
| Methods | RCT. | |
| Participants | Women with term singleton pregnancy, emergency CS under general anaesthesia. N = 595. |
|
| Interventions | 1. 50 mg ranitidine IV over 1 min + 30 mL 0.3 M sodium citrate (intervention group). 2. 0.9% sodium chloride IV + 30 mL 0.3 M sodium citrate (comparison group). | |
| Outcomes | Gastric pH and gastric volume ‐ postintubation and pre‐extubation. Risk of aspiration. | |
| Notes | ||
| Risk of bias | ||
| Bias | Authors' judgement | Support for judgement |
| Random sequence generation (selection bias) | Unclear risk | Sequence generation not described. |
| Allocation concealment (selection bias) | Low risk | Pre‐randomised identical numbered ampoules. |
| Blinding (performance bias and detection bias) All outcomes | Low risk | Double blind, identical preparation pre‐prepared. |
| Incomplete outcome data (attrition bias) All outcomes | Low risk | 100 women excluded post randomisation ‐ fully accounted for but no outcome data. |
| Selective reporting (reporting bias) | Unclear risk | We did not assess the trial protocol. |
| Other bias | Low risk | No evidence for other bias. |
Stuart 1996.
| Methods | RCT. | |
| Participants | Women having emergency CS under general anaesthesia. Women were ASA grade 1 or 2. N = 385. |
|
| Interventions | Phase 1: N = 185
Phase 2: N = 200
All women in phase 2 received 30 mL sodium citrate 0.3 M just before induction of anaesthesia. |
|
| Outcomes | Gastric volume and pH. | |
| Notes | Data could not be used. Outcome data provided only as median and ranges. Data were analysed by 'per protocol' rather than ITT. it was not possible to re‐allocate the information. | |
| Risk of bias | ||
| Bias | Authors' judgement | Support for judgement |
| Random sequence generation (selection bias) | Unclear risk | "...random allocation..." |
| Allocation concealment (selection bias) | Unclear risk | No information given. |
| Blinding (performance bias and detection bias) All outcomes | Unclear risk | No information provided. |
| Incomplete outcome data (attrition bias) All outcomes | High risk | Phase 1: 20 women initially allocated to Group MC but who received only sodium citrate because of time constraints, were analysed in Group C. Phase 2: 1 woman was excluded. |
| Selective reporting (reporting bias) | Unclear risk | We did not assess the trial protocols. |
| Other bias | Unclear risk | Difficult to assess as limited information given. |
Tripathi 1995.
| Methods | RCT. | |
| Participants | Healthy women, uncomplicated singleton pregnancies at term requiring emergency CS under general anaesthesia. N = 80. |
|
| Interventions | 1. 40 mg omeprazole IV at the time of decision to perform CS. 2. 50 mg ranitidine IV at time of decision to perform CS. | |
| Outcomes | Gastric volume and pH. | |
| Notes | ||
| Risk of bias | ||
| Bias | Authors' judgement | Support for judgement |
| Random sequence generation (selection bias) | Unclear risk | Not described ‐ "randomly assigned". |
| Allocation concealment (selection bias) | Unclear risk | Not described. |
| Blinding (performance bias and detection bias) All outcomes | Low risk | Double‐blind manner. |
| Incomplete outcome data (attrition bias) All outcomes | Low risk | All women accounted for. |
| Selective reporting (reporting bias) | Unclear risk | We did not assess the trial protocol. |
| Other bias | Low risk | No evidence of other bias. |
Tryba 1983.
| Methods | RCT. | |
| Participants | Pregnant women presenting for elective CS with no history of gastric problems. N = 30. |
|
| Interventions | 1. 400 mg of oral cimetidine the night before surgery and 400 mg IM 120 min prior to anaesthesia (intervention group). 2. No specific pre‐operative medication was given (control group). | |
| Outcomes | Gastric volume and gastric pH. Adverse events. | |
| Notes | ||
| Risk of bias | ||
| Bias | Authors' judgement | Support for judgement |
| Random sequence generation (selection bias) | Unclear risk | Not stated. |
| Allocation concealment (selection bias) | Unclear risk | Not stated. |
| Blinding (performance bias and detection bias) All outcomes | Unclear risk | The translator reports blinding; however, it is unclear who was blind to the treatment. |
| Incomplete outcome data (attrition bias) All outcomes | Low risk | The translator reports '0 dropouts'. |
| Selective reporting (reporting bias) | Unclear risk | We did not assess the trial protocol. |
| Other bias | Unclear risk | No evidence of other bias but uncertain due to translation. |
von Braun 1994.
| Methods | RCT, | |
| Participants | Women undergoing non‐elective CS. Women suffering from illnesses of the upper intestinal tract were excluded, |
|
| Interventions | Part 1:
Part 2:
|
|
| Outcomes | Gastric volume and pH. Apgar scores at 1, 5 and 10 mins. | |
| Notes | Data could not be used. Results were compared with values for non‐medicated pregnant women reported by other studies. | |
| Risk of bias | ||
| Bias | Authors' judgement | Support for judgement |
| Random sequence generation (selection bias) | Unclear risk | "...randomised subgroup..." |
| Allocation concealment (selection bias) | Unclear risk | No information provided. |
| Blinding (performance bias and detection bias) All outcomes | Unclear risk | Not stated. |
| Incomplete outcome data (attrition bias) All outcomes | Unclear risk | Not enough information provided to assess this. |
| Selective reporting (reporting bias) | Unclear risk | We did not assess the trial protocol. |
| Other bias | Unclear risk | No evidence of other bias but uncertain due to translation. |
Wig 1987.
| Methods | RCT. | |
| Participants | Pregnant women undergoing emergency CS under general anaesthesia. N = 90. |
|
| Interventions | 1. Sodium citrate 30 mL 0.3 M 15 min prior to induction via nasogastric tube (intervention group 1). 2. Magnesium trisilicate 1.5 g dissolved in 15 mL of tap water, 15 min prior to induction via nasogastric tube (intervention group 2). 3. 30 mL tap water via nasogastric tube, 15 min prior to induction of anaesthesia (comparison group). | |
| Outcomes | Gastric pH measured pre‐administration of Rx, postintubation and postextubation. | |
| Notes | ||
| Risk of bias | ||
| Bias | Authors' judgement | Support for judgement |
| Random sequence generation (selection bias) | Unclear risk | Not described 'randomly allocated'. |
| Allocation concealment (selection bias) | Unclear risk | Not described. |
| Blinding (performance bias and detection bias) All outcomes | Unclear risk | Not described. |
| Incomplete outcome data (attrition bias) All outcomes | Unclear risk | States randomised 30 to each group but N in each group for results not given. |
| Selective reporting (reporting bias) | Unclear risk | We did not assess the trial protocol. |
| Other bias | Low risk | No evidence of other bias. |
Yau 1992.
| Methods | RCT. | |
| Participants | Chinese women undergoing emergency CS. N = 162. |
|
| Interventions | 1. Ranitidine 150 mg every 6 hrs + 30 mL 0.3 sodium citrate before induction. 2. Omeprazole 40 mg 12 hrly + sodium citrate 30 mL 0.3 before induction. 3. Omeprazole 40 mg 12 hrly only. | |
| Outcomes | Gastric volume and gastric pH. At risk of aspiration: ph < 2.5 and volume > 25 mL. | |
| Notes | Continuous data presented in graphs for gastric pH and volume; means and SD not given. | |
| Risk of bias | ||
| Bias | Authors' judgement | Support for judgement |
| Random sequence generation (selection bias) | Unclear risk | Randomised on admission to labour ward. |
| Allocation concealment (selection bias) | Unclear risk | Not described. |
| Blinding (performance bias and detection bias) All outcomes | Unclear risk | Not described. |
| Incomplete outcome data (attrition bias) All outcomes | Unclear risk | Not described. |
| Selective reporting (reporting bias) | Unclear risk | We did not assess the trial protocol. |
| Other bias | Low risk | No evidence of other bias. |
Zoroglu 1999.
| Methods | RCT. | |
| Participants | Women undergoing CS under general anaesthesia. N = 75. |
|
| Interventions | 1. 300 mg nizatidine (intervention group 1). 2. 40 mg famotidine (intervention group 2). 3. N saline (comparison group). | |
| Outcomes | Postintubation and pre‐extubation gastric pH and gastric volume. Arterial and umbilical blood gases. Apgar scores and 1 and 5 min. | |
| Notes | ||
| Risk of bias | ||
| Bias | Authors' judgement | Support for judgement |
| Random sequence generation (selection bias) | Unclear risk | Not described. |
| Allocation concealment (selection bias) | Unclear risk | Not described. |
| Blinding (performance bias and detection bias) All outcomes | Unclear risk | Not described. |
| Incomplete outcome data (attrition bias) All outcomes | Unclear risk | Not enough data to assess. |
| Selective reporting (reporting bias) | Unclear risk | We did not assess the trial protocol. |
| Other bias | Low risk | No evidence for other bias. |
Zue 1999.
| Methods | RCT. | |
| Participants | Pregnant women presenting for emergency CS for acute fetal distress, pre‐eclampsia and failed trial of labour. N = 60. |
|
| Interventions | 1. Oral effervescent ranitidine 150 mg. 2. No treatment. | |
| Outcomes | Gastric pH‐ measured with pH meter immediately postintubation and pre extubation. | |
| Notes | ||
| Risk of bias | ||
| Bias | Authors' judgement | Support for judgement |
| Random sequence generation (selection bias) | Unclear risk | Not described. |
| Allocation concealment (selection bias) | Unclear risk | Not described. |
| Blinding (performance bias and detection bias) All outcomes | High risk | No reports of blinding. |
| Incomplete outcome data (attrition bias) All outcomes | Low risk | No loss of participants reported. |
| Selective reporting (reporting bias) | Unclear risk | Due to translation of paper and we did not assess the trial protocol. |
| Other bias | Low risk | No evidence of other bias. |
CS: caesarean section hr: hour GA: gestational age IM: intramuscular IV: intravenous ITT: intention‐to‐treat M: molar min: minute(s) po: by mouth pre‐op: pre‐operative RCT: randomised controlled trial SD: standard deviation
Characteristics of excluded studies [ordered by study ID]
| Study | Reason for exclusion |
|---|---|
| Abboud 1984 | Study compares 2 different antacids with each other, sodium citrate versus Gelusil (aluminium hydroxide and magnesium hydroxide). |
| Abouleish 1999 | Study assessed interventions for reducing nausea and vomiting at CS, not for reducing aspiration pneumonitis. |
| Ackerman 1987 | Study assessed drugs given for analgesia, not for reducing aspiration pneumonitis. |
| Ackerman 1988 | Study assessed drugs given for analgesia, not for reducing aspiration pneumonitis. |
| Ackerman 1989 | Study assessed drugs given for analgesia, not for reducing aspiration pneumonitis. |
| Apiliogullari 2008 | Study assessed interventions for reducing nausea and vomiting at CS, not for reducing aspiration pneumonitis. |
| Atkinson 1980 | Not an RCT. |
| Avramovic 1979 | Investigated effect of post‐CS intervention on abdominal distension. |
| Ayorinde 2000 | Study assessed drugs given for blood pressure control, not for reducing aspiration pneumonitis. |
| Ayorinde 2001 | Study assessed drugs given for blood pressure control, not for reducing aspiration pneumonitis. |
| Belzarena 1993 | Study assessed drugs given for blood pressure control, not for reducing aspiration pneumonitis. |
| Birnbach 1993 | Study assessed interventions for reducing nausea and vomiting at CS, not for reducing aspiration pneumonitis. |
| Biswas 2003 | Study assessed interventions for reducing nausea and vomiting at CS, not for reducing aspiration pneumonitis. |
| Biwas 2002 | Study assessed interventions for reducing nausea and vomiting at CS, not for reducing aspiration pneumonitis. |
| Bonhomme 2002 | Study assessed interventions for reducing nausea and vomiting at CS, not for reducing aspiration pneumonitis. |
| Boone 2002 | Study assessed interventions for reducing nausea and vomiting at CS, not for reducing aspiration pneumonitis. |
| Boschi 1984 | Not an RCT; women were divided into groups. |
| Brock‐Utne 1989 | Not an RCT; women were allocated to groups. |
| Brody 2008 | Study assessed interventions for reducing nausea and vomiting at CS, not for reducing aspiration pneumonitis. |
| Caba 1997 | Study assessed interventions for reducing nausea and vomiting at CS, not for reducing aspiration pneumonitis. |
| Chan 1992 | Study was a quasi‐RCT. |
| Chan 1997 | Study assessed drugs given for blood pressure control, not for reducing aspiration pneumonitis. |
| Charuluxananan 2003 | Study assessed interventions for reducing nausea and vomiting at CS, not for reducing aspiration pneumonitis. |
| Chaudhuri 2004 | Study assessed interventions for reducing nausea and vomiting at CS, not for reducing aspiration pneumonitis. |
| Chen 2005 | Study assessed acupressure for reducing nausea and vomiting, anxiety and pain in women post‐CS, not for reducing aspiration pneumonitis. Also not an RCT. |
| Cherian 2001 | Study assessed interventions for reducing nausea and vomiting at CS, not for reducing aspiration pneumonitis. |
| Chestnut 1987 | Study assessed interventions for reducing nausea and vomiting at CS, not for reducing aspiration pneumonitis. |
| Chestnut 1989 | Study assessed interventions for reducing nausea and vomiting at CS, not for reducing aspiration pneumonitis. |
| Chung 1998 | Study assessed post‐CS analgesia. |
| Cohen 1983 | No information on how women were allocated to groups. |
| Colman 1988 | No information on how women were allocated to groups. |
| Connelly 1997 | Study assessed drugs for reducing side effects of intrathecal opioids at CS. |
| Cooper 2002 | Study assessed drugs given for blood pressure control, not for reducing aspiration pneumonitis. |
| Cowan 2002 | Study assessed drugs given for analgesia, not for reducing aspiration pneumonitis. |
| Dahlgren 1997 | Study assessed drugs given for analgesia, not for reducing aspiration pneumonitis. |
| Dailey 1985 | Study assessed lignocaine given for analgesia, not for reducing aspiration pneumonitis. |
| Dailey 1988 | Study assessed lignocaine concentrations in the blood and no clinical outcomes assessed. |
| Datta 1982 | No information on how women were allocated to groups. |
| Dewan 1982 | Not described as an RCT; women were assigned to groups. |
| Duggal 1998 | Intervention looks at reducing nausea and vomiting not aspiration pneumonitis. |
| Dundee 1979 | No information on how women were allocated to groups. |
| Fan 1994 | Studying the effect of different doses of bupivacaine on anaesthesia. |
| Flynn 1989a | Study of effect of 400 mg cimetidine or 150 mg ranitidine or placebo on plasma levels of bupivacaine at CS. |
| Flynn 1989b | Study of effect of 200 mg cimetidine plasma levels of lignocaine at CS. |
| Flynn 1989c | Study of effect of 400 mg cimetidine or 150 mg ranitidine or placebo on plasma levels of lidocaine at CS. |
| Freeman 1999 | Study assessed interventions for reducing nausea and vomiting at CS, not for reducing aspiration pneumonitis. |
| Fujii 1998a | Study assessed interventions for reducing nausea and vomiting at CS, not for reducing aspiration pneumonitis. |
| Fujii 1998b | Study assessed interventions for reducing nausea and vomiting at CS, not for reducing aspiration pneumonitis. |
| Fujii 1999 | Study assessed interventions for reducing nausea and vomiting at CS, not for reducing aspiration pneumonitis. |
| Fujii 2002 | Study assessed interventions for reducing nausea and vomiting at CS, not for reducing aspiration pneumonitis. |
| Fujii 2004 | Study assessed interventions for reducing nausea and vomiting at CS, not for reducing aspiration pneumonitis. |
| Gaiser 2002 | Study assessed interventions for reducing nausea and vomiting at CS, not for reducing aspiration pneumonitis. |
| Ghods 2005 | Study to test efficacy of postoperative supplemental oxygen in reducing the incidence of postoperative nausea and vomiting. |
| Gutsche 1976 | Assessing ephedrine for reducing hypotension of spinal anaesthesia. |
| Habib 2006 | Study assessed interventions for reducing nausea and vomiting at CS, not for reducing aspiration pneumonitis. |
| Harmon 2000 | Study assessed interventions for reducing nausea and vomiting at CS, not for reducing aspiration pneumonitis. |
| Hildyard 2000 | Study assessed interventions for reducing nausea and vomiting at CS, not for reducing aspiration pneumonitis. |
| Ho 1996 | Study assessing P‐6 acupressure on nausea and vomiting for post‐CS pain relief. |
| Ho 2006 | Study assessed interventions for reducing nausea and vomiting at CS, not for reducing aspiration pneumonitis. |
| Holdsworth 1974 | Not an RCT. |
| Holdsworth 1978 | Quasi‐RCT. |
| Holdsworth 1980 | Not an RCT. Assessing women's positions for GA. |
| Huang 1992 | Study assessed interventions for reducing nausea and vomiting at CS, not for reducing aspiration pneumonitis. |
| Hunt 1989 | Assessed fentanyl added to bupivacaine in spinal anaesthesia for effective anaesthesia but assessed Apgar scores. |
| Hussain 2011 | Not an RCT. |
| Imbeloni 1986 | Study assessed interventions for reducing nausea and vomiting at CS, not for reducing aspiration pneumonitis. |
| Ishiyama 2001 | Study assessing fentanyl and flurbiprofen for analgesia. |
| Jabalameli 2011 | Study investigated interventions for reducing nausea, vomiting and pain and not for reducing aspiration pneumonitis |
| Kang 1982 | Hypotension study assessing continuous infusion versus bolus injection of ephedrine. |
| Kangas‐Saarela 1990 | Study assessed drugs given for blood pressure control, not for reducing aspiration pneumonitis. |
| Kasodekar 2006 | Study assessed interventions for reducing nausea and vomiting at CS, not for reducing aspiration pneumonitis. |
| Khalayleh 2005 | Study investigated interventions for reducing vomiting, not for reducing aspiration pneumonitis. |
| King 1998 | Study assessed drugs given for blood pressure control not for reducing aspiration pneumonitis. |
| Kjaer 2006 | Study assessed interventions for reducing nausea and vomiting at CS, not for reducing aspiration pneumonitis. |
| Kocamanoglu 2005 | Study assessed interventions for reducing nausea and vomiting at CS, not for reducing aspiration pneumonitis. |
| Kotelko 1989 | Study assessed interventions for reducing nausea and vomiting at CS, not for reducing aspiration pneumonitis. |
| Lim 1991 | Not randomised. |
| Lim 2001a | Study assessed interventions for reducing nausea and vomiting at CS, not for reducing aspiration pneumonitis. |
| Lim 2001b | Study assessed interventions for reducing nausea and vomiting at CS, not for reducing aspiration pneumonitis. |
| Loughrey 2002 | Study assessed drugs given for blood pressure control not for reducing aspiration pneumonitis. |
| Lussos 1992 | Study assessed interventions for reducing nausea and vomiting at CS, not for reducing aspiration pneumonitis. |
| Mandell 1986 | Study assessed interventions for reducing nausea and vomiting at CS, not for reducing aspiration pneumonitis. |
| Mandell 1992 | Study assessed interventions for reducing nausea and vomiting at CS, not for reducing aspiration pneumonitis. |
| Manullang 2000 | Study assessed interventions for reducing nausea and vomiting at CS, not for reducing aspiration pneumonitis. |
| Maranhao 1988 | Study assessed interventions for reducing nausea and vomiting at CS, not for reducing aspiration pneumonitis. |
| McCaughey 1981 | Not a randomised study. |
| Mebazaa 2003 | Study assessed interventions for reducing nausea and vomiting at CS, not for reducing aspiration pneumonitis. |
| Mukherjee 2006 | Study assessed interventions for reducing nausea and vomiting at CS, not for reducing aspiration pneumonitis. |
| Murphy 1984 | Study assessed the effect of IV metoclopramide on gastric emptying on women having elective CSs and those having emergency CSs studying both women given narcotics and those not given narcotics. Outcomes in this review not assessed. |
| Ngan 2000 | Study assessed drugs given for blood pressure control, not for reducing aspiration pneumonitis. |
| Ngan 2001 | Study assessed drugs given for blood pressure control, not for reducing aspiration pneumonitis. |
| Ngan 2004a | Study assessed drugs given for blood pressure control, not for reducing aspiration pneumonitis. |
| Ngan 2004b | Study assessed drugs given for blood pressure control, not for reducing aspiration pneumonitis. |
| Nortcliffe 2003 | Study assessed interventions for reducing nausea and vomiting at CS, not for reducing aspiration pneumonitis. |
| Numazaki 2000 | Study assessed interventions for reducing nausea and vomiting at CS, not for reducing aspiration pneumonitis. |
| Numazaki 2003 | Study assessed interventions for reducing nausea and vomiting at CS, not for reducing aspiration pneumonitis. |
| O'Sullivan 1988 | Study assessed the effect of H2 receptor antagonists on bupivacaine clearance in women undergoing elective CS under epidural anaesthesia. |
| Olsen 1994 | Study assessed drugs given for blood pressure control, not for reducing aspiration pneumonitis. |
| Ouyang 2002 | Study on fentanyl for analgesia. |
| Owczarzak 1997 | Study assessed interventions for reducing nausea and vomiting at CS, not for reducing aspiration pneumonitis. |
| Palmer 1991 | Study assessed interventions for reducing nausea and vomiting at CS, not for reducing aspiration pneumonitis. |
| Palmer 1995 | Study assessing fentanyl for pain relief. |
| Pan 1996 | Study assessed interventions for reducing nausea and vomiting at CS, not for reducing aspiration pneumonitis. |
| Pan 2001 | Study assessed interventions for reducing nausea and vomiting at CS, not for reducing aspiration pneumonitis. |
| Pan 2003 | Study assessed interventions for reducing nausea and vomiting at CS, not for reducing aspiration pneumonitis. |
| Peixoto 2006 | Study assessed interventions for reducing nausea and vomiting at CS, not for reducing aspiration pneumonitis. |
| Pellegrini 2001 | Study assessing the analgesic effects of opioid antagonist ‐ not included in protocol. |
| Phillips 2007 | Study assessed interventions for reducing nausea and vomiting at CS, not for reducing aspiration pneumonitis. |
| Prakash 2006 | Study looking at analgesia. |
| Quiney 1995 | Study assessed interventions for reducing nausea and vomiting at CS, not for reducing aspiration pneumonitis. |
| Qvist 1983 | Not randomised. |
| Qvist 1985 | Studied effect of placental transfer of cimetidine given prior to induction of anaesthesia. |
| Ramanathan 1983 | Study looking at preloading for blood pressure. |
| Ramin 1994 | Study assessed drugs given for blood pressure control, not for reducing aspiration pneumonitis. |
| Rout 1992 | Study assessed drugs given for blood pressure control, not for reducing aspiration pneumonitis. |
| Rudra 2004a | Study assessed interventions for reducing nausea and vomiting at CS, not for reducing aspiration pneumonitis. |
| Rudra 2004b | Study assessed interventions for reducing nausea and vomiting at CS, not for reducing aspiration pneumonitis. |
| Sanansilp 1998 | Study assessed interventions for reducing nausea and vomiting at CS, not for reducing aspiration pneumonitis. |
| Santos 1984 | Study assessed interventions for reducing nausea and vomiting at CS, not for reducing aspiration pneumonitis. |
| Sen 2001 | Study of analgesics for postoperative pain relief after CS. |
| Seyedhejazi 2007 | Study assessed interventions for reducing nausea and vomiting at CS, not for reducing aspiration pneumonitis. |
| Shahriari 2009 | Study assessed interventions for reducing nausea and vomiting at CS, not for reducing aspiration pneumonitis. |
| Shende 1998 | Study on intrathecal fentanyl in subarachnoid block for CS. |
| Siddik‐Sayyid 2002 | Study on fentanyl in subarachnoid block for CS. |
| Stein 1997 | Study assessed interventions for reducing nausea and vomiting at CS, not for reducing aspiration pneumonitis. |
| Tarhan 2007 | Study assessed interventions for reducing nausea and vomiting at CS, not for reducing aspiration pneumonitis. |
| Taylor 1966 | Study not thought to be an RCT as it does not state how women were allocated to groups. |
| Tettambel 1983 | Quasi‐RCT. |
| Tzeng 2000 | Study assessed interventions for reducing nausea and vomiting at CS, not for reducing aspiration pneumonitis. |
| Ure 1999 | Study assessed interventions for reducing nausea and vomiting at CS, not for reducing aspiration pneumonitis. |
| Vercauteren 2000 | Study assessed drugs given for blood pressure control not for reducing aspiration pneumonitis. |
| Wang 2001 | Study assessed interventions for reducing nausea and vomiting at CS, not for reducing aspiration pneumonitis. |
| Weiss 1995 | Study assessed interventions for reducing nausea and vomiting at CS, not for reducing aspiration pneumonitis. |
| Yazigi 2002 | Study assessed interventions for reducing nausea and vomiting at CS, not for reducing aspiration pneumonitis. |
CS: caesarean section GA: gestational age IV: intravenous RCT: randomised controlled trial
Characteristics of studies awaiting assessment [ordered by study ID]
Karamanlioglu 1995.
| Methods | RCT. |
| Participants | Pregnant women. |
| Interventions | 1. Omeprazole. 2. Famotidine. 3. Ranitidine. |
| Outcomes | Maternal gastric pH and volume and neonatal gastric pH and volume. |
| Notes | This study has been translated but there was insufficient information to allow data extraction. We are contacting the authors for clarification. |
Sarat 2007.
| Methods | |
| Participants | |
| Interventions | |
| Outcomes | |
| Notes | Seeking full paper. |
RCT: randomised controlled trial
Differences between protocol and review
The title was changed from 'Drugs at caesarean section for preventing nausea, vomiting and aspiration pneumonitis' to 'Interventions at caesarean section for reducing aspiration pneumonitis' because we wished to include complimentary medicines and mechanical methods (however, we found no studies). In addition, it was felt that the interventions to reduce nausea and vomiting during caesarean section should be a separate review. This second review will look at the effect of 'Interventions given during caesarean section to reduce nausea and vomiting'.
We modified the 'Types of participants' from 'Healthy pregnant women with an uncomplicated singleton pregnancy at term undergoing elective or emergency caesarean section under general or regional anaesthesia' to 'Pregnant women undergoing elective or emergency caesarean section under general or regional anaesthesia' because we felt the interventions needed should be applicable to a wider range of women.
We removed reference to route of administration in the inclusion criteria. Relevent studies will be included regardless of the route of administration of the trial medication. A comparison of the efficacy of different routes of administration will be included in subgroup analysis if sufficient data exist.
We removed the pharmacological and non‐pharmacological subgroups because we felt the interventions should be considered more individually. We added elective caesarean section and emergency caesarean section subgroups because we felt the outcomes may be different in these two differing situations.
Several papers reported gastric volume and pH as continuous outcomes, and 'at risk of aspiration'. These were not pre‐specified in our protocol but we have included them in the review as they are informative. In the protocol we had prespecified dichotomous outcomes for gastric pH as greater than 2.5, however we changed this to pH less than 2.5 as this is what the majority of papers have reported, and is intuitively easier to interpret.
We have taken out general versus regional anaesthesia as a subgroup comparison as all the randomised controlled trials that investigate this outcome were in women who had general anaesthesia.
We have updated the methods to the current standard methods used by the Cochrane Pregnancy and Childbirth Group.
Contributions of authors
For the 2013 update, Shantinia Paranjothy (SP) and Gill Gyte (GG) assessed the six new studies and updated the review. All authors provided input into drafts of this update.
Sources of support
Internal sources
The University of Liverpool, UK.
External sources
-
The previous update of this review (Paranjothy 2010) was supported by a grant from the National Institute for Health Research, UK.
NIHR NHS Cochrane Collaboration Programme Grant Scheme award for NHS‐prioritised centrally‐managed, pregnancy and childbirth systematic reviews: CPGS02
Declarations of interest
None known.
New search for studies and content updated (no change to conclusions)
References
References to studies included in this review
Bifarini 1990 {published data only}
- Bifarini G, Trabalza N, Falconi S, Mala L, Favetta P. Effects on newborn of pharmacological prophylaxis for Mendelson's syndrome. Minerva Anestesiologica 1990;56:1447‐50. [PubMed] [Google Scholar]
Bifarini 1992 {published data only}
- Bifarini G, Favetta P, Ciammiti B, Cirulli P, Sindaco F, Pasqualucci A. Pharmacological prevention of Mendelson's syndrome: controlled clinical trial. Minerva Anestesiologica 1992;58(3):95‐9. [PubMed] [Google Scholar]
Bylsma‐Howell 1983 {published data only}
- Bylsma‐Howell M, McMorland GH, Rurak DW, McErlane B, Axelson JE. Placental transport of metoclopramide: assessment of maternal and neonatal effects. Canadian Anaesthetists Society Journal 1983;30:487‐92. [DOI] [PubMed] [Google Scholar]
Dewan 1985 {published data only}
- Dewan DM, Floyd HM, Thistlewood JM, Bogard TD. Sodium citrate premedication for elective cesarean section. Anesthesia and Analgesia 1984;63:205. [PubMed] [Google Scholar]
- Dewan DM, Floyd HM, Thistlewood JM, Bogard TD, Spielman FJ. Sodium citrate pretreatment in elective cesarean section patients. Anesthesia and Analgesia 1985;64:34‐7. [PubMed] [Google Scholar]
Elhakim 2005 {published data only}
- Elhakim M, El‐Megid WA, Metry A, El‐hennawy A, El‐Queseny K. Analgesic and antacid properties of i.m. tramadol given before caesarean section under general anaesthesia. British Journal of Anaesthesia 2005;95(6):811‐5. [DOI] [PubMed] [Google Scholar]
Ewart 1990a {published data only}
- Ewart MC, Yau G, Gin T, Kotur CF, Oh TE. A comparison of oral omeprazole and ranitidine as premedication for elective caesarean section. Proceedings of Spring Meeting of Obstetric Anaesthetists Association; 1990; London, UK. 1990:33.
- Ewart MC, Yau G, Gin T, Kotur CF, Oh TE. A comparison of the effects of omeprazole and ranitidine on gastric secretion in women undergoing elective caesarean section. Anaesthesia 1990;45:527‐30. [DOI] [PubMed] [Google Scholar]
Fogarty 1992 {published data only}
- Fogarty DJ, Moore J. Further investigations of omeprazole in obstetric patients. International Journal of Obstetric Anesthesia 1992;1:180. [Google Scholar]
Frank 1984 {published data only}
- Frank M, Evans M, Flynn P, Aun C. Comparison of the prophylactic use of magnesium trisilicate mixture BPC, sodium citrate mixture or cimetidine in obstetrics. British Journal of Anaesthesia 1984;56:355‐61. [DOI] [PubMed] [Google Scholar]
Hodgkinson 1983 {published data only}
- Hodgkinson R, Glassenberg R, Joyce TH, Coombs DW, Ostheimer GW, Gibbs CP. Comparison of cimetidine (Tagamet) with antacid for safety and effectiveness in reducing gastric acidity before elective cesarean section. Anesthesiology 1983;59:86‐90. [DOI] [PubMed] [Google Scholar]
Hong 2004 {published data only}
- Hong JY. Effect of dextrose on preoperative gastric content and serum gastrin [abstract]. Canadian Journal of Anesthesia 2004;51(Suppl 1):A57. [Google Scholar]
Husemeyer 1980 {published data only}
- Husemeyer RP, Davenport HT. Prophylaxis for Mendelson's syndrome before elective caesarean section. A comparison of cimetidine and magnesium trisilicate mixture regimens. British Journal of Obstetrics and Gynaecology 1980;87:565‐70. [DOI] [PubMed] [Google Scholar]
Iqbal 2000 {published data only}
- Iqbal MS, Ashfaque M, Akram M. Gastric fluid volume and pH: a comparison of effects of ranitidine alone with combination of ranitidine and metoclopramide in patients undergoing elective caesarean section. Annals of King Edward Medical College 2000;6(2):189‐91. [Google Scholar]
Jasson 1989 {published data only}
- Jasson J, Lefevre G, Talaffre ML, Legagneux F, Guerin JP, Vassilieff N, et al. Immediate pre‐anesthetic administration of sodium citrate in cesarean interventions [abstract] [Administration immediate pre‐anesthesique de citrate de sodium pour intervention cesarienne programmee]. Annales Francaises d'Anesthesie et de Reanimation 1987;6:R155. [Google Scholar]
- Jasson J, Lefevre G, Tallet F, Talafre ML, Legagneux F, Conseiller C. Oral sodium citrate before general anaesthesia for elective caesarean section Effects of pH and volume of gastric content [Ingestion de citrate de sodium avant l'anesthesie generale pour cesarienne programmee. Effet sur le pH et le volume du contenu gastrique]. Annales Francaises d Anesthesie et de Reanimation 1989;8:12‐8. [DOI] [PubMed] [Google Scholar]
Lin 1996 {published data only}
- Lin CJ, Huang CL, Hsu HW, Chen TL. Prophylaxis against acid aspiration in regional anesthesia for elective cesarean section: a comparison between oral single‐dose ranitidine, famotidine and omeprazole assessed with fiberoptic gastric aspiration. Acta Anaesthesiologica Sinica 1996;34(4):179‐84. [PubMed] [Google Scholar]
O'Sullivan 1985 {published data only}
- O'Sullivan G, Sear JW, Bullingham RE, Carrie LE. The effect of magnesium trisilicate mixture, metoclopramide and ranitidine on gastric ph, volume and serum gastrin. Anaesthesia 1985;40(3):246‐53. [DOI] [PubMed] [Google Scholar]
Ormezzano 1990 {published data only}
- Ormezzano X, Francois TP, Viaud JY, Bukowski JG, Bourgeonneau MC, Cottron D, et al. Aspiration pneumonitis prophylaxis in obstetric anaesthesia: comparison of effervescent cimetidine‐sodium citrate mixture and sodium citrate. British Journal of Anaesthesia 1990;64:503‐6. [DOI] [PubMed] [Google Scholar]
Orr 1993 {published data only}
- Orr DA, Bill KM, Gillon KRW, Wilson CM, Fogarty DJ, Moore J. Effects of omeprazole, with and without metoclopramide, in elective obstetric anaesthesia. Anaesthesia 1993;48:114‐9. [DOI] [PubMed] [Google Scholar]
Osman 1995 {published data only}
- Osman H. Ranitidine versus cimetidine prior to emergency obstetric anesthesia. Middle East Journal of Anesthesiology 1995;13(2):205‐11. [PubMed] [Google Scholar]
Ostheimer 1982 {published data only}
- Ostheimer GW, Morrison JA, Lavoie C, Sepkoski C, Hoffman J, Datta S. The effect of cimetidine on the mother, newborn and neonatal neurobehavior. Anesthesiology 1982;57:A405. [Google Scholar]
Ozkan 2000 {published data only}
- Ozkan T, Senturk M, Yavru A, Celebi S, Pembeci K. Does preoperative fluid fasting have a benefit on aspiration prophylaxis in obstetric anaesthesia [Obstetrik anestezide preoperatif oral sivi alimi aspirasyon pnomonisi profilaksisine katki saglar mi?]. Turk Anesteziyoloji Ve Reanimasyon 2000;28:425‐9. [Google Scholar]
Pickering 1980 {published data only}
- Pickering BG, Palahniuk RJ, Cumming M. Cimetidine premedication in elective caesarean section. Canadian Anaesthetists Society Journal 1980;27:33‐5. [DOI] [PubMed] [Google Scholar]
Rocke 1994 {published data only}
- Rocke DA, Rout CC, Gouws E. Intravenous administration of the proton pump inhibitor omeprazole reduces the risk of acid aspiration at emergency cesarean section. Anesthesia & Analgesia 1994;78:1093‐8. [DOI] [PubMed] [Google Scholar]
Roper 1981 {published data only}
- Roper RE, Salem MG. Effects of glycopyrrolate and atropine combined with antacid on gastric acidity. British Journal of Anaesthesia 1981;53:1277‐80. [DOI] [PubMed] [Google Scholar]
Rout 1993 {published data only}
- Rout CC, Rocke DA, Gouws E. Intravenous ranitidine reduces the risk of acid aspiration of gastric contents at emergency cesarean section. Anesthesia & Analgesia 1993;76:156‐61. [DOI] [PubMed] [Google Scholar]
Stuart 1996 {published data only}
- Gin T, Stuart JC, Kan AF, Rowbottom SJ, Yau G. IV ranitidine or omeprazole for emergency caesarean section. Anaesthesia and Intensive Care 1994;22:483. [Google Scholar]
- Stuart JC, Kan AF, Rowbottom SJ, Yau G, Gin T. Acid aspiration prophylaxis for emergency caesarean section. Anaesthesia 1996;51(5):415‐21. [DOI] [PubMed] [Google Scholar]
Tripathi 1995 {published data only}
- Tripathi A, Somwanshi M, Singh B, Bajaj P. A comparison of intravenous ranitidine and omeprazole on gastric volume and ph in women undergoing emergency caesarean section. Canadian Journal of Anaesthesia 1995;42(9):797‐800. [DOI] [PubMed] [Google Scholar]
Tryba 1983 {published data only}
- Tryba M, Burkert W, Husch M, Zenz M. Effectiveness of cimetidine in the prevention of aspiration pneumonia in obstetrics [Wirksamkeit von Cimetidin zur Prophylaxe der Aspirationspneumonie in der Geburtshilfe]. Fortschritte der Medizin 1983;101:1757‐61. [PubMed] [Google Scholar]
von Braun 1994 {published data only}
- Braun GG, Koppert W, Martus P, Schywalsky M, Schmitt H, Mogendorf F, et al. Drug induced prevention of the acid aspiration syndrome in non‐elective cesarean section. Anaesthesiologie und Reanimation 1994;19:37‐42. [PubMed] [Google Scholar]
Wig 1987 {published data only}
- Wig J, Biswas GC, Malhotra SK, Gupta AN. Comparison of sodium citrate with magnesium trisilicate as pre‐anaesthetic antacid in emergency caesarean sections. Indian Journal of Medical Research 1987;85:306‐10. [PubMed] [Google Scholar]
Yau 1992 {published data only}
- Yau G, Kan AF, Gin T, Oh TE. A comparison of omeprazole and ranitidine for prophylaxis against aspiration pneumonitis in emergency caesarean section. Anaesthesia 1992;47:101‐4. [DOI] [PubMed] [Google Scholar]
Zoroglu 1999 {published data only}
- Zoroglu F, Karamanlioglu B, Pamukcu Z. The value of nizatidine and famotidine in the prophylaxis of acid aspiration pneumonia in cesarean operation [Elektif sezaryen ameliyatlarinda nizatidin ve famotidinin asit aspirasyon pnomonisi profilaksisindeki degeri]. Turk Anesteziyoloji Ve Reanimasyon 2000;28(10):521‐6. [Google Scholar]
- Zoroglu F, Karamanlioglu B, Unal C, Pamukcu Z. The value of nizatidine and famotidine in prophylaxis of aspiration pneumonia in caesarean section. British Journal of Anaesthesia 1999;82 Suppl:159‐60. [Google Scholar]
Zue 1999 {published data only}
- Zue AS, Meye JF, Nguema PN, Nsafu DN, Milama EN. Effervescent ranitidine before urgent caesarean section: effect on gastric pH [Ranitidine effervescente avant cesarienne en urgence: effet sur le pH gastrique]. Cahiers d Anesthesiologie 1999;47:1‐3. [Google Scholar]
References to studies excluded from this review
Abboud 1984 {published data only}
- Abboud TK, Curtis J, Earl S, Henriksen EH, Hughes SC, Levinson G, et al. Efficacy of clear antacid prophylaxis in obstetrics. Acta Anaesthesiologica Scandinavica 1984;28:301‐4. [DOI] [PubMed] [Google Scholar]
Abouleish 1999 {published data only}
- Abouleish EI, Rashid S, Haque S, Giezentanner A, Joynton P, Chuang AZ. Ondansetron versus placebo for the control of nausea and vomiting during caesarean section under spinal anaesthesia. Anaesthesia 1999;54:479‐82. [DOI] [PubMed] [Google Scholar]
Ackerman 1987 {published data only}
- Ackerman WE, Colclough GW, Guiler JM, Guilder DS, Akin JM. Epidural lipophilic opioids administered prophylactically for control of nausea, vomiting and pain during cesarean section. Proceedings of 19th Annual Meeting of Society for Obstetric Anesthesia and Perinatology; 1987 May 20‐23; Halifax, Nova Scotia, Canada. 1987:143.
Ackerman 1988 {published data only}
- Ackerman WE, Juneja MM, Colclough GW, Kaczorowski DM. Epidural fentanyl significantly decreases nausea and vomiting during uterine manipulation in awake patients undergoing cesarean section. Anesthesiology 1988;69:A679. [Google Scholar]
Ackerman 1989 {published data only}
- Ackerman WE, Juneja MM, Colclough GW, Kaczorowski DM. Epidural lipophilic opioids significantly decrease nausea and emesis during uterine manipulation in awake patients undergoing cesarean section. Regional Anesthesia 1989;14(2):23. [Google Scholar]
Apiliogullari 2008 {published data only}
- Apiliogullari S, Gok F, Canpolat A, Soysal S, Toy H. Comparison of prophylactic dimenhydrinate and metoclopramide for prevention of nausea‐vomiting caused by intrathecal opioids in parturients undergoing caesarean delivery. Regional Anesthesia and Pain Medicine 2008;33(5 Suppl 1):131. [Google Scholar]
Atkinson 1980 {published data only}
- Atkinson RE, Thomas T, Nicholas ADG, Anderson I. An antacid comparison trial. Anaesthesia 1980;35:1126‐30. [Google Scholar]
Avramovic 1979 {published data only}
- Avramovic D, Sulovic V, Lazarevic B, Cvetkovic M, Milacic D. Prevention of postoperative abdominal discomfort and gastrointestinal distension after cesarean section by use of simeticon. Jugoslavenska Ginekologija I Opstetricija 1979;19(5‐6):307‐11. [PubMed] [Google Scholar]
Ayorinde 2000 {published data only}
- Ayorinde B, Brown J, Buczkowski P, Shah J, Buggy DJ. Prevention of spinal anaesthesia‐induced hypotension during caesarean section: comparative sudy of pre‐emptive vasopressors. British Journal of Anaesthesia 2000;84(2):277P‐288P. [DOI] [PubMed] [Google Scholar]
Ayorinde 2001 {published data only}
- Ayorinde BT, Buczkowski P, Brown J, Shah J, Buggy DJ. Evaluation of pre‐emptive intramuscular phenylephrine and ephedrine for reduction of spinal anaesthesia‐induced hypotension during caesarean section. British Journal of Anaesthesia 2001;86(3):372‐6. [DOI] [PubMed] [Google Scholar]
Belzarena 1993 {published data only}
- Belzarena SD. Addition of epinephrine to a combination of bupivacaine and fentanyl in spinal anesthesia for cesarean section. Regional Anesthesia 1993;18(1 Suppl 1):15. [Google Scholar]
Birnbach 1993 {published data only}
- Birnbach DJ, Stein DJ, Saunders TA, Grunebaum A, Kitain EM. Prophylactic use of acupressure for the prevention of nausea and vomiting during spinal anesthesia for cesarean section. Anesthesiology 1993;79:A1020. [Google Scholar]
Biswas 2003 {published data only}
- Biswas BN, Rudra A, Das SK, Nath S, Biswas SC. A comparative study of glycopyrrolate, dexamethasone and metoclopramide in control of post‐operative nausea and vomiting after spinal anaesthesia for caesarean delivery. Indian Journal of Anaesthesia 2003;47(3):198‐200. [Google Scholar]
Biwas 2002 {published data only}
- Biwas SC, Biswas BN, Rudra A, Pan A. A comparative study of metoclopramide, glycopyrrolate and combination of metoclopramide and glycopyrrolate in control of intraoperative and postoperative nausea and vomiting after spinal anaethesia for caesarean section. Journal of Obstetrics and Gynecology of India 2002;52(3):73‐5. [Google Scholar]
Bonhomme 2002 {published data only}
- Bonhomme V, Brichant JF, Wuilmart M, Dewandre PY, Hans P. Droperidol reduces nausea after caesarean section but alters the neurological status of the breastfed infants [abstract]. Anesthesiology 2002;96:A1044. [Google Scholar]
Boone 2002 {published data only}
- Boone JB, Gao GG, Clark CP, Chaudhuri S, Chaudhuri K. Dolasetron for prevention of perioperative nausea and vomiting during cesarean section under regional anesthesia [abstract]. Anesthesiology 2002;96 Suppl:A1069. [Google Scholar]
Boschi 1984 {published data only}
- Boschi S, Di MMG, Pigna A, Rossi R. The effect of ranitidine on gastric ph and volume in patients undergoing cesarean section: Possible relationship to Mendelson's syndrome. Current Therapeutic Research, Clinical and Experimental 1984;35(4):654‐62. [Google Scholar]
Brock‐Utne 1989 {published data only}
- Brock‐Utne JG, Rout C, Moodley J, Mayat N. Influence of preoperative gastric aspiration on the volume and pH of gastric contents in obstetric patients undergoing caesarean section. British Journal of Anaesthesia 1989;62:397‐401. [DOI] [PubMed] [Google Scholar]
Brody 2008 {published data only}
- Brody R. Study of the effect of intramuscular ephedrine on the incidence of nausea and vomiting during elective cesarean section. ClinicalTrials.gov (http://clinicaltrials.gov/) (accessed 20 February 2008) 2008.
Caba 1997 {published data only}
- Caba F, Echevarria M, Bernal‐Davalos L, Pallares‐Gonzalez JA, Rodriguez‐Rodriguez R. Prophylaxis for intraoperative nausea and vomiting with nonhypnotic doses of propofol during intradural anesthesia for cesarean delivery [Profilaxis de las nauseas y los vomitos intraoperatorios con dosis subhipnoticas de propofol durante la anestesia intradural en cesareas]. Revista Espanola De Anestesiologia y Reanimacion 1997;44:262‐6. [PubMed] [Google Scholar]
Chan 1992 {published data only}
- Chan YK. A comparison of sodium citrate and sodium citrate/ranitidine combination for acid aspiration prophylaxis. Medical Journal of Malaysia 1992;47(1):27‐30. [PubMed] [Google Scholar]
Chan 1997 {published data only}
- Chan WS, Irwin MG, Tong WN, Lam YH. Prevention of hypotension during spinal anaesthesia for caesarean section: ephedrine infusion versus fluid preload. Anaesthesia 1997;52(9):908‐13. [DOI] [PubMed] [Google Scholar]
Charuluxananan 2003 {published data only}
- Charuluxananan S, Kyokong O, Somboonviboon W, Narasethakamol A, Promlok P. Nalbuphine versus ondansetron for prevention of intrathecal morphine‐induced pruritus after cesarean delivery. Anesthesia and Analgesia 2003;96(6):1789‐93. [DOI] [PubMed] [Google Scholar]
Chaudhuri 2004 {published data only}
- Chaudhuri K, Chaudhuri S, Lampe C, Rivera J, Solis‐Estrada J. Does addition of dolasetron to metoclopramide alter nausea and vomiting in cesarean section patients under regional anesthesia [abstract]. Anesthesiology 2004;101 Suppl:A1234. [Google Scholar]
Chen 2005 {published data only}
- Chen HM, Chang FY, Hsu CT. Effect of acupressure on nausea, vomiting, anxiety and pain among post‐cesarean section women in Taiwan. Kaohsiung Journal of Medical Sciences 2005;21(8):341‐50. [DOI] [PubMed] [Google Scholar]
Cherian 2001 {published data only}
- Cherian VT, Smith I. Prophylactic ondansetron does not improve patient satisfaction in women using pca after caesarean section. British Journal of Anaesthesia 2001;87(3):502‐4. [DOI] [PubMed] [Google Scholar]
Chestnut 1987 {published data only}
- Chestnut DH, Bates JN, Choi WW, Vandewalker GE. Administration of metoclopramide for prevention of nausea and vomiting during regional anesthesia for cesarean section: a randomized, double blind, placebo controlled study. Anesthesiology 1986;65:390. [DOI] [PubMed] [Google Scholar]
- Chestnut DH, Vandewalker GE, Owen CL, Bates JN, Choi WW. Administration of metoclopramide for prevention of nausea and vomiting during epidural anesthesia for elective cesarean section. Anesthesiology 1987;66:563‐6. [DOI] [PubMed] [Google Scholar]
Chestnut 1989 {published data only}
- Chestnut DH, Owen CL, Geiger M, Bates JN, Choi WW, Ostman PL. Metoclopramide versus droperidol for prevention of nausea and vomiting during epidural anesthesia for cesarean section. Southern Medical Journal 1989;82(10):1224‐7. [DOI] [PubMed] [Google Scholar]
- Chestnut DH, Owen CL, Ostman LG, Bates JN, Choi WW. A comparison of metoclopramide and droperidol for prevention of nausea and vomiting during and after elective cesarean section with epidural anesthesia. Proceedings of 19th Annual Meeting of Society for Obstetric Anesthesia and Perinatology; 1987 May 20‐23; Halifax, Nova Scotia, Canada. 1987:118.
Chung 1998 {published data only}
- Chung CJ, Kim JS, Park HS, Chin YJ. The efficacy of intrathecal neostigmine, intrathecal morphine, and their combination for post‐cesarean section analgesia. Anesthesia and Analgesia 1998;87(2):341‐6. [DOI] [PubMed] [Google Scholar]
Cohen 1983 {published data only}
- Cohen SE, Barrier G. Does metoclopramide decrease gastric volume in cesarean section patients?. Anesthesiology 1983;59:A403. [DOI] [PubMed] [Google Scholar]
- Cohen SE, Jasson J, Talafre ML, Chauvelot‐Moachon L, Barrier G. Does metoclopramide decrease the volume of gastric contents in patients undergoing cesarean section?. Anesthesiology 1984;61:604‐7. [DOI] [PubMed] [Google Scholar]
Colman 1988 {published data only}
- Colman RD, Frank M, Loughnan BA, Cohen DG, Cattermole R. Use of i.m. ranitidine for the prophylaxis of aspiration pneumonitis in obstetrics. British Journal of Anaesthesia 1988;61:720‐9. [DOI] [PubMed] [Google Scholar]
Connelly 1997 {published data only}
- Connelly NR, Rahimi A, Parker RK. Nalmefene or naloxone for preventing intrathecal opioid mediated side effects in cesarean delivery patients. International Journal of Obstetric Anesthesia 1997;6:231‐4. [DOI] [PubMed] [Google Scholar]
Cooper 2002 {published data only}
- Cooper DW, Carpenter M, Mowbray P, Desira WR, Ryall DM, Kokri MS. Fetal and maternal effects of phenylephrine and ephedrine during spinal anesthesia for cesarean section. Anesthesiology 2002;97:1582‐90. [DOI] [PubMed] [Google Scholar]
Cowan 2002 {published data only}
- Cowan CM, Kendall JB, Barclay PM, Wilkes RG. Comparison of intrathecal fentanyl and diamorphine in addition to bupivacaine for caesarean section under spinal anaesthesia. British Journal of Anaesthesia 2002;89(3):452‐8. [PubMed] [Google Scholar]
Dahlgren 1997 {published data only}
- Dahlgren G, Hultstrand C, Jakobsson J, Norman M, Eriksson EW, Martin H. Intrathecal sufentanil, fentanyl, or placebo added to bupivacaine for cesarean section. Anesthesia & Analgesia 1997;85(6):1288‐93. [DOI] [PubMed] [Google Scholar]
Dailey 1985 {published data only}
- Dailey PA, Hughes SC, Rosen MA, Healy K, Cheek DBC, Pytka S, et al. Lidocaine levels during cesarean section after pretreatment with ranitidine or cimetidine. Anesthesiology 1985;63:444. [Google Scholar]
Dailey 1988 {published data only}
- Dailey PA, Hughes SC, Rosen MA, Healy K, Cheek DBC, Shnider SM. Effect of cimetidine and ranitidine on lidocaine concentrations during epidural anesthesia for cesarean section. Anesthesiology 1988;69:1013‐7. [DOI] [PubMed] [Google Scholar]
Datta 1982 {published data only}
- Datta S, Alper MH, Ostheimer GW, Weiss JB. Method of ephedrine administration and nausea and hypotension during spinal anesthesia for cesarean section. Anesthesiology 1982;56:68‐70. [DOI] [PubMed] [Google Scholar]
Dewan 1982 {published data only}
- Dewan DM, Wheeler AS, James FM III, Floyd HM, Rhyne L. Antacid anticholinergic regimens in patients undergoing elective caesarean section. Canadian Anaesthetists Society Journal 1982;29:27‐30. [DOI] [PubMed] [Google Scholar]
Duggal 1998 {published data only}
- Duggal KN, Douglas MJ, Peter EA, Merrick PM. Acupressure for intrathecal narcotic‐induced nausea and vomiting after caesarean section. International Journal of Obstetric Anesthesia 1998;7(4):231‐6. [DOI] [PubMed] [Google Scholar]
Dundee 1979 {published data only}
- Dundee JW, Howe JP, Moore J, McCaughey W. Effect of cimetidine on gastric pH in women undergoing elective caesarean section [proceedings]. British Journal of Clinical Pharmacology 1979;8:391P‐392P. [DOI] [PubMed] [Google Scholar]
Fan 1994 {published data only}
- Fan SZ, Susetio L, Wang YP, Cheng YJ, Liu CC. Low dose of intrathecal hyperbaric bupivacaine combined with epidural lidocaine for cesarean section ‐ a balance block technique. Anesthesia and Analgesia 1994;78:474‐7. [DOI] [PubMed] [Google Scholar]
Flynn 1989a {published data only}
- Flynn RJ, Moore J, Collier PS, McClean E. Does pretreatment with cimetidine and ranitidine affect the disposition of bupivacaine?. British Journal of Anaesthesia 1989;62:87‐91. [DOI] [PubMed] [Google Scholar]
Flynn 1989b {published data only}
- Flynn RJ, Moore J. Does cimetidine effect plasma lidocaine levels in the parturient?. Anesthesia & Analgesia 1989;68:S87. [DOI] [PubMed] [Google Scholar]
- Flynn RJ, Moore J, Collier PS, Howard PJ. Effect of intravenous cimetidine on lignocaine disposition during extradural caesarean section. Anaesthesia 1989;44:739‐41. [DOI] [PubMed] [Google Scholar]
Flynn 1989c {published data only}
- Flynn RJ, Moore J. Effect of H2‐receptor antagonists on plasma lignocaine concentrations in the obstetric patient. British Journal of Anaesthesia 1988;61:512P. [Google Scholar]
- Flynn RJ, Moore J. Lack of effect of cimetidine and ranitidine on lidocaine disposition in the parturient. Anesthesiology 1988;69:A656. [Google Scholar]
- Flynn RJ, Moore J, Collier PS, Howard PJ. Single dose oral H2‐antagonists do not affect plasma lidocaine levels in the parturient. Acta Anaesthesiologica Scandinavica 1989;33:593‐6. [DOI] [PubMed] [Google Scholar]
Freeman 1999 {published data only}
- Freeman J, Lafreniere L, Watkins E, Dresner M. Does sodium citrate increase sickness associated with spinal anaesthesia for caesarean section?. British Journal of Anaesthesia 1999;82 Suppl:160. [Google Scholar]
Fujii 1998a {published data only}
- Fujii Y, Tanaka H, Toyooka H. Granisetron prevents nausea and vomiting during spinal anaesthesia for caesarean section. Acta Anaesthesiologica Scandinavica 1998;42(3):312‐5. [DOI] [PubMed] [Google Scholar]
Fujii 1998b {published data only}
- Fujii Y, Tanaka H, Toyooka H. Prevention of nausea and vomiting with granisetron, droperidol and metoclopramide during and after spinal anaesthesia for caesarean section: a randomized, double‐blind, placebo‐controlled trial. Acta Anaesthesiologica Scandinavica 1998;42(8):921‐5. [DOI] [PubMed] [Google Scholar]
Fujii 1999 {published data only}
- Fujii Y, Saitoh Y, Tanaka H, Toyooka H. Granisetron/dexamethasone combination for reducing nausea and vomiting during and after spinal anesthesia for cesarean section. Anesthesia & Analgesia 1999;88(6):1346‐50. [DOI] [PubMed] [Google Scholar]
Fujii 2002 {published data only}
- Fujii Y, Numazaki M. Dose‐range effects of propofol for reducing emetic symptoms during cesarean delivery. Obstetrics & Gynecology 2002;99:75‐9. [DOI] [PubMed] [Google Scholar]
Fujii 2004 {published data only}
- Fujii Y, Numazaki M. Randomized, double‐blind comparison of subhypnotic‐dose propofol alone and combined with dexamethasone for emesis in parturients undergoing cesarean delivery. Clinical Therapeutics 2004;26(8):1286‐91. [DOI] [PubMed] [Google Scholar]
Gaiser 2002 {published data only}
- Gaiser RR, Dong Y, Cheek TG, Gutsche BB. Does increased intravenous hydration decrease the incidence of nausea/vomiting following cesarean section? [abstract]. Anesthesiology 2002;96(Suppl 1):P83. [Google Scholar]
Ghods 2005 {published data only}
- Ghods AA, Soleimani M, Narimani M. Effect of postoperative supplemental oxygen on nausea and vomiting after cesarean birth. Journal of Perianesthesia Nursing 2005;20(3):200‐5. [DOI] [PubMed] [Google Scholar]
Gutsche 1976 {published data only}
- Gutsche BB. Prophylactic ephedrine preceding spinal analgesia for cesarean section. Anesthesiology 1976;45:462‐5. [DOI] [PubMed] [Google Scholar]
Habib 2006 {published data only}
- Habib AS, Itchon‐Ramos N, Phillips‐Bute BG, Gan TJ, the Duke Women's Anesthesia (DWA) Research Group. Transcutaneous acupoint electrical stimulation with the ReliefBand for the prevention of nausea and vomiting during and after cesarean delivery under spinal anesthesia. Anesthesia & Analgesia 2006;102(2):581‐4. [DOI] [PubMed] [Google Scholar]
Harmon 2000 {published data only}
- Harmon D, Ryan M, Kelly A, Bowen M. Acupressure and prevention of nausea and vomiting during and after spinal anaesthesia for caesarean section. British Journal of Anaesthesia 2000;84(4):463‐7. [DOI] [PubMed] [Google Scholar]
- Harmon D, Ryan M, Kelly A, Bowen M. Acupressure and the prevention of nausea and vomiting during and after spinal anaesthesia for caesarean section. British Journal of Anaesthesia 1999;82 Suppl:161. [DOI] [PubMed] [Google Scholar]
Hildyard 2000 {published data only}
- Hildyard C, Freeman J, Dresner M. Reducing the incidence of postoperative nausea and vomiting following elective caesarean section under spinal anaesthesia [abstract]. International Journal of Obstetric Anesthesia 2000;9:199. [Google Scholar]
- Hildyard CL, Quinn A, Dresner M, Freeman J. Cyclizine reduces the incidence of nausea and vomiting after elective caesarean section with intrathecal diamorphine [abstract]. British Journal of Anaesthesia 2001;87(4):672P. [Google Scholar]
Ho 1996 {published data only}
- Ho CM, Hseu SS, Tsai SK, Lee TY. Effect of P‐6 acupressure on prevention of nausea and vomiting after epidural morphine for post‐Cesarean section pain relief. Acta Anaesthesiologica Scandinavica 1996;40:372‐5. [DOI] [PubMed] [Google Scholar]
Ho 2006 {published data only}
- Ho CM, Tsai HJ, Chan KH, Tsai SK. P6 acupressure does not prevent emesis during spinal anesthesia for cesarean delivery. Anesthesia & Analgesia 2006;102(3):900‐3. [DOI] [PubMed] [Google Scholar]
- Ho CM, Tsai SK. P‐6 acupressure do not prevent emesis during cesarean section [abstract]. Canadian Journal of Anesthesia 2002;49(6 Suppl):A51. [Google Scholar]
Holdsworth 1974 {published data only}
- Holdsworth JD, Furness RMB, Roulston RG. A comparison of apomorphine and stomach tubes for emptying the stomach before general anaesthesia in obstetrics. British Journal of Anaesthesia 1974;46:526‐9. [DOI] [PubMed] [Google Scholar]
Holdsworth 1978 {published data only}
- Holdsworth JD. The place of apomorphine prior to obstetric analgesia. Journal of International Medical Research 1978;6:26‐32. [PubMed] [Google Scholar]
Holdsworth 1980 {published data only}
- Holdsworth JD, Johnson K, Mascall G, Gwynne Roulston R, Tomlinson PA. Mixing of antacids with stomach contents. Anaesthesia 1980;35:641‐50. [DOI] [PubMed] [Google Scholar]
Huang 1992 {published data only}
- Huang WP. Clinical observation of reliefing traction responses during cesarean section. Chinese Journal of Anesthesiology 1992;12(1):33. [Google Scholar]
Hunt 1989 {published data only}
- Hunt CO, Naulty JS, Bader AM, Hauch MA, Vartikar JV, Datta S, et al. Perioperative analgesia with subarachnoid fentanyl‐bupivacaine for cesarean delivery. Anesthesiology 1989;71:535‐40. [DOI] [PubMed] [Google Scholar]
Hussain 2011 {published data only}
- Hussain S, Khan RA, Iqbal M, Shafiq M, Khan FA. A comparison of the effects of erythromycin and metoclopramide on gastric fluid volume and pH in patients undergoing elective caesarean section. Anaesthesia, Pain and Intensive Care 2011;15(3):148‐52. [Google Scholar]
Imbeloni 1986 {published data only}
- Imbeloni LE, Santos JMM, Santos MM. Prophylactic use of metoclopramide for control of nausea and vomiting during epidural anesthesia for cesarean section [Uso profilatico da metoclopramida no controle de nauseas e vomitos durante anestesia peridural para cesariana]. Revista Brasileira de Anestesiologia 1986;36(4):295‐8. [Google Scholar]
Ishiyama 2001 {published data only}
- Ishiyama T, Yamaguchi T, Kashimoto S, Kumazawa T. Effects of epidural fentanyl and intravenous flurbiprofen for visceral pain during cesarean section under spinal anesthesia. Journal of Anesthesia 2001;15:69‐73. [DOI] [PubMed] [Google Scholar]
Jabalameli 2011 {published data only}
- Jabalameli M, Rouholamin S, Gourtanian F. A comparison of the effects of fentanyl and remifentanil on nausea, vomiting, and pain after cesarean section. Iranian Journal of Medical Sciences 2011;36(3):183‐7. [PMC free article] [PubMed] [Google Scholar]
Kang 1982 {published data only}
- Kang YG, Abouleish E, Caritis S. Prophylactic intravenous ephedrine infusion during spinal anesthesia for cesarean section. Anesthesia & Analgesia 1982;61:839‐42. [PubMed] [Google Scholar]
Kangas‐Saarela 1990 {published data only}
- Kangas‐Saarela T, Hollmen AI, Tolonen U, Eskelinen P, Alahuhta S, Jouppila R, et al. Does ephedrine influence newborn neurobehavioural responses and spectral EEG when used to prevent maternal hypotension during caesarean section?. Acta Anaesthesiologica Scandinavica 1990;34:8‐16. [DOI] [PubMed] [Google Scholar]
Kasodekar 2006 {published data only}
- Kasodekar S, Dhumne S, Balki M, Carvalho J. Prophylactic granisetron does not prevent nausea and vomiting during elective cesarean section under spinal anesthesia [abstract]. Anesthesiology 2006;104(Suppl 1):9. [DOI] [PubMed] [Google Scholar]
Khalayleh 2005 {published data only}
- Khalayleh K, Omar AA. Comparitive antiemetic efficacy of intrathecal fentanyl and intravenous metoclopromide, during Caesarean Section under spinal anaesthesia. Journal of the Bahrain Medical Society 2005;17(4):243‐7. [Google Scholar]
King 1998 {published data only}
- King SW, Rosen MA. Prophylactic ephedrine and hypotension associated with spinal anesthesia for cesarean delivery. International Journal of Obstetric Anesthesia 1998;7:18‐22. [DOI] [PubMed] [Google Scholar]
Kjaer 2006 {published data only}
- Kjaer K, Comerford M, Kondilis L, DiMaria L, Abramovitz S, Kiselev M, et al. Oral sodium citrate increases nausea amongst elective cesarean delivery patients. Canadian Journal of Anaesthesia 2006;53(8):776‐80. [DOI] [PubMed] [Google Scholar]
Kocamanoglu 2005 {published data only}
- Kocamanoglu IS, Baris S, Karakaya D, Sener B, Tur A, Cetinkaya M. Effects of granisetron with droperidol or dexamethasone on prevention of postoperative nausea and vomiting after general anesthesia for cesarean section. Methods and Findings in Experimental and Clinical Pharmacology 2005;27(7):489‐93. [DOI] [PubMed] [Google Scholar]
Kotelko 1989 {published data only}
- Kotelko DM, Rottman RL, Wright WC, Stone JJ, Yamashiro AY, Rosenblatt RM. Transderm SCOP decreases post‐cesarean nausea and vomiting in patients receiving epidural morphine. Anesthesiology 1988;69:A666. [DOI] [PubMed] [Google Scholar]
- Kotelko DM, Rottman RL, Wright WC, Stone JJ, Yamashiro AY, Rosenblatt RM. Transdermal scopolamine decreases nausea and vomiting following cesarean section in patients receiving epidural morphine. Anesthesiology 1989;71:675‐8. [DOI] [PubMed] [Google Scholar]
Lim 1991 {published data only}
- Lim SK, Elegbe EO. The use of single dose of sodium citrate as a prophylaxis against acid aspiration syndrome in obstetric patients undergoing caesarean section. Medical Journal of Malaysia 1991;46(4):349‐55. [PubMed] [Google Scholar]
Lim 2001a {published data only}
- Lim TJ, Chiu JW, Tan HM. Transcutaneous acupoint electrical stimulation for prevention of perioperative nausea and vomiting during cesarean section with spinal anesthesia [abstract]. Anesthesiology 2001;95 Suppl:A1078. [Google Scholar]
Lim 2001b {published data only}
- Lim TJ, Lim E, Chiu JW, Tan HM. Perioperative antiemetic efficacy of dexamethasone 4mg in cesarean section under spinal anaesthesia [abstract]. Anesthesiology 2001;95 Suppl:A466. [Google Scholar]
Loughrey 2002 {published data only}
- Loughrey JP, Walsh F, Gardiner J. Prophylactic intravenous bolus ephedrine for elective caesarean section under spinal anaesthesia. European Journal of Anaesthesiology 2002;19(1):63‐8. [DOI] [PubMed] [Google Scholar]
Lussos 1992 {published data only}
- Lussos S, Bader A, Thornhill M, Datta S. The antiemetic efficacy of prophylactic metoclopramide for cesarean delivery. Anesthesiology 1991;75:A1081. [PubMed] [Google Scholar]
- Lussos SA, Bader AM, Thornhill ML, Datta S. The antiemetic efficacy and safety of prophylactic metoclopramide for elective cesarean delivery during spinal anesthesia. Regional Anesthesia 1992;17:126‐30. [PubMed] [Google Scholar]
Mandell 1986 {published data only}
- Mandell G, Dewan DM, Howard G, Floyd HM. The effectiveness of low dose droperidol in controlling nausea and vomiting during epidural anesthesia for cesarean section. Anesthesiology 1986;65:391. [DOI] [PubMed] [Google Scholar]
Mandell 1992 {published data only}
- Mandell GL, Dewan DM, Howard G, Floyd HM. The effectiveness of low dose droperidol in controlling nausea and vomiting during epidural anesthesia for cesarean section. International Journal of Obstetric Anesthesia 1992;1:65‐8. [DOI] [PubMed] [Google Scholar]
Manullang 2000 {published data only}
- Manullang TR, Viscomi CM, Pace NL. Intrathecal fentanyl is superior to intravenous ondansetron for the prevention of perioperative nausea during cesarean delivery with spinal anesthesia. Anesthesia and Analgesia 2000;90:1162‐6. [DOI] [PubMed] [Google Scholar]
Maranhao 1988 {published data only}
- Maranhao MVM, Coelho VV, Ivo CMA, Maranhao MHC, Amaral EB. A comparative study between metoclopramide and droperidol in the control of nausea and vomit in patients subjected to spinal blockade during cesarean section [Estudo comparativo entre a metoclopramida e o droperidol no controle de nauseas e vomitos na operacao cesariana em gestantes submetidas a bloqueio subaracnoideo]. Revista Brasileira de Anestesiologia 1988;38(4):245‐9. [Google Scholar]
McCaughey 1981 {published data only}
- McCaughey W, Howe JP, Moore J, Dundee JW. Cimetidine in elective caesarean section. Effect on gastric acidity. Anaesthesia 1981;36:167‐72. [DOI] [PubMed] [Google Scholar]
Mebazaa 2003 {published data only}
- Mebazaa MS, Meftah RB, Abassi M, Miraoui W, Bessa Z, Ammar MSB. Post‐operative nausea and vomiting after spinal anesthesia for cesarean section [abstract]. Anesthesiology 2003;99:A1201. [Google Scholar]
Mukherjee 2006 {published data only}
- Mukherjee S, Rudra A, Mandal M, Kumar P. Optimum dose of propofol for prevention of emetic episodes during caesarean delivery: an evaluation. Journal of Anaesthesiology Clinical Pharmacology 2006;22(2):139‐43. [Google Scholar]
Murphy 1984 {published data only}
- Murphy DF, Nally B, Gardiner J, Unwin A. Effect of metoclopramide on gastric emptying before elective and emergency caesarean section. British Journal of Anaesthesia 1984;56:1113‐6. [DOI] [PubMed] [Google Scholar]
Ngan 2000 {published data only}
- Ngan Kee WD, Khaw KS, Lee BB, Lau TK, Gin T. A dose‐response study of prophylactic intravenous ephedrine for the prevention of hypotension during spinal anesthesia for cesarean delivery. Anesthesia and Analgesia 2000;90:1390‐5. [DOI] [PubMed] [Google Scholar]
Ngan 2001 {published data only}
- Ngan Kee WD, Lau TK, Khaw KS, Lee BB. Comparison of metaraminol and ephedrine infusions for maintaining arterial pressure during spinal anesthesia for elective cesarean section. Anesthesiology 2001;95:307‐13. [DOI] [PubMed] [Google Scholar]
Ngan 2004a {published data only}
- Ngan Kee WD, Khaw KS, Ng FF. Comparison of phenylephrine infusion regimens for maintaining maternal blood pressure during spinal anaesthesia for caesarean section. British Journal of Anaesthesia 2004;92(4):469‐74. [DOI] [PubMed] [Google Scholar]
Ngan 2004b {published data only}
- Ngan Kee WD, Khaw KS, Ng FF, Lee BB. Prophylactic phenylephedrine infusion for preventing hypotension during spinal anesthesia for cesarean delivery. Anesthesia and Analgesia 2004;98:815‐21. [DOI] [PubMed] [Google Scholar]
Nortcliffe 2003 {published data only}
- Nortcliffe SA, Buggy DJ. Prophylaxis of nausea and vomiting after spinal morphine analgesia for caesarean section: comparison between cyclizine, dexamethasone, and placebo [abstract]. British Journal of Anaesthesia 2001;87(4):657P. [DOI] [PubMed] [Google Scholar]
- Nortcliffe SA, Shah J, Buggy DJ. Prevention of postoperative nausea and vomiting after spinal morphine for caesarean section: comparison of cyclizine, dexamethasone and placebo. British Journal of Anaesthesia 2003;90(5):665‐70. [DOI] [PubMed] [Google Scholar]
Numazaki 2000 {published data only}
- Numazaki M, Fujii Y. Subhypnotic dose of propofol for the prevention of nausea and vomiting during spinal anaesthesia for caesarean section. Anaesthesia and Intensive Care 2000;28(3):262‐5. [PubMed] [Google Scholar]
Numazaki 2003 {published data only}
- Numazaki M, Fujii Y. Reduction of emetic symptoms during cesarean delivery with antiemetics: propofol at subhypnotic dose versus traditional antiemetics. Journal of Clinical Anesthesia 2003;15:423‐7. [DOI] [PubMed] [Google Scholar]
O'Sullivan 1988 {published data only}
- O'Sullivan GM, Smith M, Morgan B, Brighouse D, Reynolds F. H2 antagonists and bupivacaine clearance. Anaesthesia 1988;43:93‐5. [DOI] [PubMed] [Google Scholar]
Olsen 1994 {published data only}
- Olsen KS, Feilberg VL, Hansen CL, Rudkjobing O, Pedersen T, Kyst A. Prevention of hypotension during spinal anaesthesia for caesarean section. International Journal of Obstetric Anesthesia 1994;3:20‐4. [DOI] [PubMed] [Google Scholar]
Ouyang 2002 {published data only}
- Ouyang MW, Gu MN, Lin CS. Inhibiting effect of intrathecal fentanyl on intraoperative vomiting during cesarean delivery under epidural anesthesia. Journal of the First Military Medical University (Di Yi Junyi Daxue Xuebao) 2002;22(11):1037‐8. [PubMed] [Google Scholar]
Owczarzak 1997 {published data only}
- Owczarzak D, Ghellar MR, Oliveira GR, Semeghini MM. Ondansetron and epidural morphine‐induced pruritus and emesis after caesarean section: comparison with metoclopramide [abstract]. British Journal of Anaesthesia 1997;78 Suppl 1:110. [Google Scholar]
Palmer 1991 {published data only}
- Palmer AW, Waugaman WR, Conklin KA, Kotelko DM. Does the administration of oral bicitra before elective cesarean section affect the incidence of nausea and vomiting in the parturient?. Nurse Anesthesia 1991;2(3):126‐33. [PubMed] [Google Scholar]
Palmer 1995 {published data only}
- Palmer CM, Voulgaropoulos D, Alves D. Subarachnoid fentanyl augments lidocaine spinal anesthesia for cesarean delivery. Regional Anesthesia 1995;20(5):389‐94. [PubMed] [Google Scholar]
Pan 1996 {published data only}
- Pan PH, Moore CH. Intraoperative antiemetic efficacy of prophylactic ondansetron versus droperidol for cesarean section patients under epidural anesthesia. Anesthesia & Analgesia 1996;83(5):982‐6. [DOI] [PubMed] [Google Scholar]
Pan 2001 {published data only}
- Pan P, Moore C, Fragneto R, Ross V, Justis G. Is antiemetic prophylaxis cost‐effective for cesarean section patients [abstract]. Anesthesiology 2000;93(3A):A1092. [Google Scholar]
- Pan PH, Moore C, Fragneto R, Ross V, Justis G. Efficacy and cost‐effectiveness of prophylactic ondansetron versus metoclopramide for cesarean section patients under epidural anesthesia [abstract]. Anesthesiology 2000;92 Suppl:A40. [Google Scholar]
- Pan PH, Moore CH. Comparing the efficacy of prophylactic metoclopramide, ondansetron, and placebo in cesarean section patients given epidural anesthesia. Journal of Clinical Anesthesia 2001;13(6):430‐5. [DOI] [PubMed] [Google Scholar]
- Pan PH, Moore CM. Efficacy and cost‐effectiveness of prophylactic ondansetron versus metoclopramide for cesarean section patients under epidural anesthesia [abstract]. Anesthesia and Analgesia 2000;90 Suppl:S295. [DOI] [PubMed] [Google Scholar]
Pan 2003 {published data only}
- Pan AK, Rudra A. Prophylactic single dose intravenous administration of ondansetron in the prevention of postoperative emetic symptoms during spinal anaesthesia for caesarean delivery. Indian Journal of Anaesthesia 2003;47(3):178‐80. [Google Scholar]
Peixoto 2006 {published data only}
- Peixoto AJ, Celich MF, Zardo L, Peixoto Filho AJ. Ondansetron or droperidol for prophylaxis of nausea and vomiting after intrathecal morphine. European Journal of Anaesthesiology 2006;23(8):670‐5. [DOI] [PubMed] [Google Scholar]
Pellegrini 2001 {published data only}
- Pellegrini JE, Bailey SL, Graves J, Paice JA, Shott S, Faut‐Callahan M. The impact of nalmefene on side effects due to intrathecal morphine at cesarean section. AANA Journal 2001;69(3):199‐205. [PubMed] [Google Scholar]
Phillips 2007 {published data only}
- Phillips TW Jr, Broussard DM, Sumrall WD 3rd, Hart SR. Intraoperative oxygen administration does not reduce the incidence or severity of nausea or vomiting associated with neuraxial anesthesia for cesarean delivery. Anesthesia and Analgesia 2007;105(4):1113‐7. [DOI] [PubMed] [Google Scholar]
- Phillips TW, Hart SR, Broussard D, Sumrall WD. Effects of supplemental oxygen administration on the incidence of nausea/vomiting during regional anesthesia for cesarean section [abstract]. Anesthesiology 2005;102(Suppl 1):28. [Google Scholar]
Prakash 2006 {published data only}
- Prakash S, Joshi N, Gogia AR, Prakash S, Singh R. Analgesic efficacy of two doses of intrathecal midazolam with bupivacaine in patients undergoing cesarean delivery. Regional Anesthesia and Pain Medicine 2006;31(3):221‐6. [DOI] [PubMed] [Google Scholar]
Quiney 1995 {published data only}
- Quiney NF, Murphy PG. The effect of pretreatment with glycopyrrolate on emetic and hypotensive problems during caesarean section conducted under spinal anaesthesia [abstract]. International Journal of Obstetric Anesthesia 1995;4:66‐7. [Google Scholar]
Qvist 1983 {published data only}
- Qvist N, Storm K. Cimethidine pre‐anesthetic ‐ a prophylactic method against Mendelson's syndrome in cesarean section. Acta Obstetricia et Gynecologica Scandinavica 1983;62:157‐9. [DOI] [PubMed] [Google Scholar]
Qvist 1985 {published data only}
- Qvist N, Storm K, Holmskov A. Cimetidine as pre‐anesthetic agent for cesarean section: perinatal effects on the infant, the placental transfer of cimetidine and its elimination in the infants. Journal of Perinatal Medicine 1985;13:179‐83. [DOI] [PubMed] [Google Scholar]
Ramanathan 1983 {published data only}
- Ramanathan S, Masih A, Rock I, Chalon J, Turndorf H. Maternal and fetal effects of prophylactic hydration with crystalloids or colloids before epidural anesthesia. Anesthesia and Analgesia 1983;62:673‐8. [PubMed] [Google Scholar]
Ramin 1994 {published data only}
- Ramin SM, Ramin KD, Cox K, Magness RR, Shearer VE, Grant NF. Comparison of prophylactic angiotensin II versus ephedrine infusion for prevention of maternal hypotension during spinal anesthesia. American Journal of Obstetrics and Gynecology 1994;171:734‐9. [DOI] [PubMed] [Google Scholar]
Rout 1992 {published data only}
- Rout CC, Rocke DA, Brijball R, Koovarjee RV. Prophylactic intramuscular ephedrine prior to caesarean section. Anaesthesia and Intensive Care 1992;20:448‐52. [DOI] [PubMed] [Google Scholar]
Rudra 2004a {published data only}
- Rudra A, Halder R, Sen A, Kundu S. Efficacy of low dose propofol for control of emetic episodes during caesarean delivery with spinal anaesthesia. Indian Journal of Anaesthesia 2004;48(1):31‐4. [Google Scholar]
Rudra 2004b {published data only}
- Rudra P, Rudra A. Comparison of intrathecal fentanyl and midazolam for prevention of nausea‐vomiting during caesaraean delivery under spinal anaesthesia. Indian Journal of Anaesthesia 2004;48(6):461‐4. [Google Scholar]
Sanansilp 1998 {published data only}
- Sanansilp V, Areewatana S, Tonsukchai N. Droperidol and the side effects of epidural morphine after cesarean section. Anesthesia and Analgesia 1998;86(3):532‐7. [DOI] [PubMed] [Google Scholar]
Santos 1984 {published data only}
- Santos A, Datta S. Prophylactic use of droperidol for control of nausea and vomiting during spinal anesthesia for cesarean section. Anesthesia and Analgesia 1984;63:85‐7. [PubMed] [Google Scholar]
Sen 2001 {published data only}
- Sen A, Rudra A, Sarkar SK, Biswas B. Intrathecal midazolam for postoperative pain relief in caesarean section delivery. Journal of the Indian Medical Association 2001;99(12):683‐4, 686. [PubMed] [Google Scholar]
Seyedhejazi 2007 {published data only}
- Seyedhejazi M, Madarek E. The effect of small dose bupivacaine‐fentanyl in spinal anesthesia on hemodynamic nausea and vomiting in cesarean section. Pakistan Journal of Medical Sciences 2007;23(5):747‐50. [Google Scholar]
Shahriari 2009 {published data only}
- Shahriari A, Khooshideh M, Heidari MH. Prevention of nausea and vomiting in caesarean section under spinal anaesthesia with midazolam or metoclopramide?. JPMA ‐ Journal of the Pakistan Medical Association 2009;59(11):756‐9. [PubMed] [Google Scholar]
Shende 1998 {published data only}
- Shende D, Cooper GM, Bowden MI. The influence of intrathecal fentanyl on the characteristics of subarachnoid block for caesarean section. Anaesthesia 1998;53:702‐10. [DOI] [PubMed] [Google Scholar]
Siddik‐Sayyid 2002 {published data only}
- Siddik‐Sayyid SM, Aouad MT, Jalbout MI, Zalaket MI, Berzina CE, Baraka AS. Intrathecal versus intravenous fentanyl for supplementation of subarachnoid block during cesarean section. Anesthesia and Analgesia 2002;95:209‐13. [DOI] [PubMed] [Google Scholar]
Stein 1997 {published data only}
- Stein DJ, Birnbach DJ, Danzer BI, Kuroda MM, Grunebaum A, Thys DM. Acupressure versus intravenous metoclopramide to prevent nausea and vomiting during spinal anesthesia for cesarean section. Anesthesia and Analgesia 1997;84(2):342‐5. [DOI] [PubMed] [Google Scholar]
Tarhan 2007 {published data only}
- Tarhan O, Canbay O, Celebi N, Uzun S, Sahin A, Coskun F, et al. Subhypnotic doses of midazolam prevent nausea and vomiting during spinal anesthesia for cesarean section. Minerva Anestesiologica 2007;73(12):629‐33. [PubMed] [Google Scholar]
Taylor 1966 {published data only}
- Taylor G, Pryse‐Davies J. The prophylactic use of antacids in the prevention of the acid‐pulmonary‐aspiration syndrome (Mendelson's syndrome). Lancet 1966;1:288‐91. [DOI] [PubMed] [Google Scholar]
Tettambel 1983 {published data only}
- Tettambel MA. Preoperative use of antacids to prevent Mendelson's syndrome in cesarean section: a pilot study. Journal of the American Osteopathic Association 1983;82:858‐60. [PubMed] [Google Scholar]
Tzeng 2000 {published data only}
- Tzeng JI, Wang JJ, Ho ST, Tang CS, Liu YC, Lee SC. Dexamethasone for prophylaxis of nausea and vomiting after epidural morphine for post‐caesarean section analgesia: comparison of droperidol and saline. British Journal of Anaesthesia 2000;85:865‐8. [DOI] [PubMed] [Google Scholar]
Ure 1999 {published data only}
- Ure D, James KS, McNeill M, Booth JV. Glycopyrrolate reduces nausea during spinal anaesthesia for caesarean section without affecting neonatal outcome. British Journal of Anaesthesia 1999;82(2):277‐9. [DOI] [PubMed] [Google Scholar]
Vercauteren 2000 {published data only}
- Vercauteren MP, Coppejans HC, Hoffmann VH, Mertens E, Adriaensen HA. Prevention of hypotension by a single 5‐mg dose of ephedrine during small‐dose spinal anesthesia in prehydrated cesarean delivery patients. Anesthesia and Analgesia 2000;90:324‐7. [DOI] [PubMed] [Google Scholar]
Wang 2001 {published data only}
- Wang JJ, Ho ST, Wong CS, Tzeng JI, Liu HS, Ger LP. Dexamethasone prophylaxis of nausea and vomiting after epidural morphine for post‐cesarean analgesia. Canadian Journal of Anaesthesia 2001;48(2):185‐90. [DOI] [PubMed] [Google Scholar]
Weiss 1995 {published data only}
- Weiss MD, Diaz F, Zuberi F, Milman B, Pasricha S. Subhypnotic doses of propofol for prevention of postoperative pruritus and nausea in cesarean section patients given spinal opioids. Anesthesiology 1995;83(3A):A960. [Google Scholar]
Yazigi 2002 {published data only}
- Yazigi A, Chalhoub V, Madi‐Jebara S, Haddad F, Hayek G. Prophylactic ondansetron is effective in the treatment of nausea and vomiting but not on pruritis after cesarean delivery with intrathecal sufentanil‐morphine. Journal of Clinical Anesthesia 2002;14:183‐6. [DOI] [PubMed] [Google Scholar]
References to studies awaiting assessment
Karamanlioglu 1995 {published data only}
- Karamanlioglu B, Canogullari M, Arslan G, Alagol A, Sengonul O. The value of omeprazole and h2 receptor blockers in the prophylaxis of aspiration in cesarean operation [Sezaryen ameliyatlarinda omeprazol ve h2 reseptor blokerlerinin aspirasyon pnomonisi profilaksisindeki degeri]. Turk Anesteziyoloji Ve Reanimasyon 1995;23(3):338‐42. [Google Scholar]
Sarat 2007 {published data only}
- Sarat Singh S, Upendra Singh K, Ratan Singh N, Rajkumar G, Maniram SK, Deban Singh L. Prevention of nausea and vomiting in caesarean delivery under spinal anaesthesia with glycopyrrolate, metoclopramide and ondansetron ‐ a comparative study. JMS ‐ Journal of Medical Society 2007;21(3):138‐42. [Google Scholar]
Additional references
Bond 1979
- Bond VK, Stoelting MD, Gupta CD. Pulmonary aspiration syndrome after inhalation of gastric fluid containing antacids. Anesthesiology 1979;51:452‐3. [DOI] [PubMed] [Google Scholar]
Browne 1993
- Browne D, Powell H. Update on some earlier controversies. In: Morgan B editor(s). Controversies in Obstetric Anaesthesia. Vol. 2, London: Edward Arnold, 1993. [Google Scholar]
CEMD 2001
- Confidential Enquiry into Maternal Deaths. Confidential Enquiries into Maternal Deaths. Why mothers die 1997‐1999: the fifth report of the Confidential Enquiries into Maternal Deaths in the United Kingdom. London: RCOG, 2001. [Google Scholar]
Cohen 1984
- Cohen SE, Jasson J, Talafre ML, Chauvelot‐Moachon L, Barrier G. Does metoclopramide decrease the volume of gastric contents in patients undergoing caesarean section?. Anesthesiology 1984;61(5):604‐7. [DOI] [PubMed] [Google Scholar]
Ewart 1990b
- Ewart MC, Yau G, Gin T, Kotur CF, Oh TE. A comparison of the effects of omeprazole and ranitidine on gastric secretion in women undergoing elective caesarean section. Anaesthesia 1990;45:527‐30. [DOI] [PubMed] [Google Scholar]
Gibbs 1979
- Gibbs CP, Schwartz DJ, Wynne JW, Hood CI, Kuck EJ. Antacid pulmonary aspiration in the dog. Anesthesiology 1979;51:380‐5. [DOI] [PubMed] [Google Scholar]
Gin 1990
- Gin T, Ewart MC, Yau G, Oh TE. Effect of oral omeprazole on intragastric pH and volume in women undergoing elective caesarean section. British Journal of Anaesthesia 1990;65:616‐9. [DOI] [PubMed] [Google Scholar]
Grieff 1994
- Grieff JMC, Tordoff SG, Griffiths R, May AE. Acid aspiration chemoprophylaxis in 202 obstetric anaesthetic units in the UK. International Journal of Obstetric Anesthesia 1994;3:137‐42. [DOI] [PubMed] [Google Scholar]
Griffiths 2012
- Griffiths JD, Gyte GML, Paranjothy S, Brown HC, Broughton HK, Thomas J. Interventions for preventing nausea and vomiting in women undergoing regional anaesthesia for caesarean section. Cochrane Database of Systematic Reviews 2012, Issue 9. [DOI: 10.1002/14651858.CD007579.pub2] [DOI] [PMC free article] [PubMed] [Google Scholar]
Gyte 2006
- Gyte GML, Richens Y. Routine prophylactic drugs in normal labour for reducing gastric aspiration and its effects. Cochrane Database of Systematic Reviews 2006, Issue 3. [DOI: 10.1002/14651858.CD005298.pub2] [DOI] [PMC free article] [PubMed] [Google Scholar]
Higgins 2011
- Higgins JPT, Green S, editors. Cochrane Handbook for Systematic Reviews of Interventions Version 5.1.0 [updated March 2011]. The Cochrane Collaboration, 2011. Available from www.cochrane‐handbook.org.
Mendelson 1946
- Mendelson CL. Aspiration of stomach contents into the lungs during obstetric anesthesia. American Journal of Obstetrics and Gynecology 1946;52:191‐203. [DOI] [PubMed] [Google Scholar]
Moore 1989
- Moore J, Flynn RJ, Sampaio M, Wilson CM, Gillon KR. Effect of single‐dose omeprazole on intragastric acidity and volume during obstetric anaesthesia. Anaesthesia 1989;44(7):459‐62. [DOI] [PubMed] [Google Scholar]
RevMan 2012 [Computer program]
- The Nordic Cochrane Centre, The Cochrane Collaboration. Review Manager (RevMan). Version 5.2. Copenhagen: The Nordic Cochrane Centre, The Cochrane Collaboration, 2012.
Roberts 1974
- Roberts RB, Shirley MA. Reducing the risk of acid aspiration during cesarean section. Anesthesia and Analgesia 1974;53:859‐68. [DOI] [PubMed] [Google Scholar]
Singata 2002
- Singata M, Tranmer JE. Restricting oral fluid and food intake during labour. Cochrane Database of Systematic Reviews 2002, Issue 4. [DOI: 10.1002/14651858.CD003930] [DOI] [PMC free article] [PubMed] [Google Scholar]
Sweeney 1986
- Sweeney B, Wright I. The use of antacids as a prophylaxis against Mendelson's syndrome in the United Kingdom. A survey. Anaesthesia 1986;41:419‐22. [DOI] [PubMed] [Google Scholar]
Thomas 2001
- Thomas J, Paranjothy S, Royal College of Obstetricians and Gynaecologists: Clinical Effectiveness Support Unit. The national sentinel caesarean section audit report. London: RCOG Press, 2001. [Google Scholar]
Thwaites 1999
- Thwaites AJ, Riche CP, Smith I. Rapid sequence induction: a questionnaire survey of its routine conduct and continued management during a failed intubation. Anaesthesia 1999;54:372‐92. [DOI] [PubMed] [Google Scholar]
Tordoff 1990
- Tordoff SG, Sweeney BP. Acid aspiration prophylaxis in 288 obstetric anaesthetic departments in the United Kingdom. Anaesthesia 1990;45:776‐80. [DOI] [PubMed] [Google Scholar]
References to other published versions of this review
Paranjothy 2010
- Paranjothy S, Griffiths JD, Broughton HK, Gyte GML, Brown HC, Thomas J. Interventions at caesarean section for reducing the risk of aspiration pneumonitis. Cochrane Database of Systematic Reviews 2010, Issue 1. [DOI: 10.1002/14651858.CD004943.pub3] [DOI] [PMC free article] [PubMed] [Google Scholar]