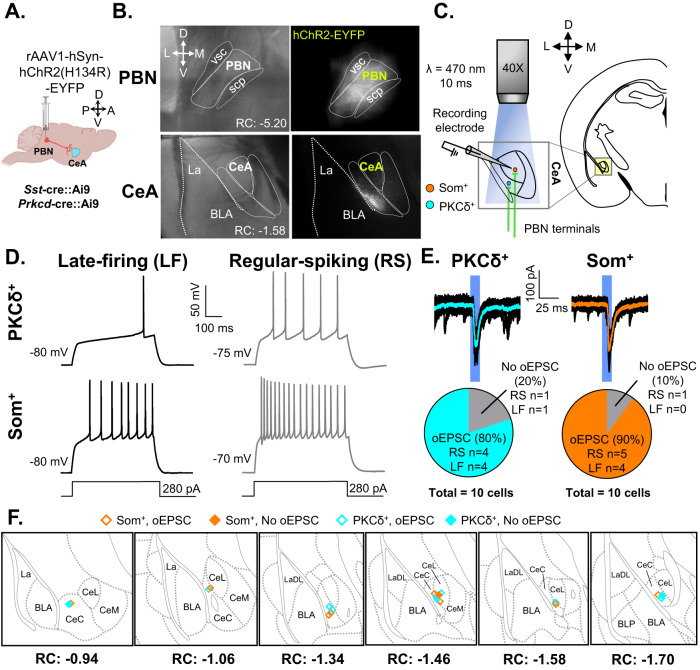
Fig. 1. Validation of functional projection from PBN to CeA.
A Male Som-Cre::Ai9 and PKCδ::Ai9 mice were stereotaxically injected with rAAV1-hSyn-hChR2(H134R)-EYFP into the PBN. Whole-cell patch-clamp recordings were performed on mice at least 4 weeks following the injection. B Representative images of the PBN (top) and CeA (bottom). Left panel depicts differential interference contrast images. Right panel depicts fluorescent images of transduced cells within the PBN and fluorescent PBN terminals within the CeA. C Schematic depicting optogenetic-assisted circuit mapping experiments. Whole-cell patch-clamp recordings of optically evoked excitatory postsynaptic current (oEPSC) in response to blue light (470 nm) stimulation of PBN terminals in CeA-Som+ or CeA-PKCδ+ neurons. D Representative voltage traces of late-firing (LF; left panel) and regular-spiking (RS; right panel) CeA-PKCδ+ (top) and CeA-Som+ (bottom) neurons in response to a 280-pA depolarizing current injection. E Representative current traces of oEPSCs in CeA-PKCδ+ and CeA-Som+ neurons in response to a 10 ms pulse of blue light stimulation. The proportion of CeA-PKCδ+ LF and RS neurons displaying oEPSCs was comparable to the proportion of CeA-Som+ LF and RS neurons displaying oEPSCs. n = 10 cells collected from 2 mice per genotype. No intra-animal correlations were seen. F Recording site illustrations of CeA-Som+ and CeA-PKCδ+ neurons classified by either the presence or absence of oEPSCs. Each symbol highlights the location of an individual neuron. vsc ventral spinocerebellar tract, scp superior cerebellar peduncle, PBN parabrachial nucleus, CeA central amygdala, CeM central amygdala medial, CeL central amygdala lateral, CeC central amygdala capsular, BLA basolateral amygdaloid, LA lateral amygdaloid.

