

Abstract
Purpose:
Respondent-driven sampling (RDS) uses long-chain referral whereby members of the target population recruit other members. We describe the use of RDS for a mixed-methods sexual and reproductive health (SRH) study in Kisumu, Kenya.
Methods:
Initial seeds for the cross-sectional surveys were selected from adolescents aged 15–19 residing in urban informal settlements. Participants were provided up to five referral coupons to distribute.
Results:
Across four communities, 18 seeds were selected, 13,489 coupons distributed, and 3,381 adolescents referred, yielding a 25% coupon return rate. We enrolled 3,061 participants for a 23% survey rate. Median referral lag time was three days (IQR 1, 7). Demographic characteristics reached equilibrium between recruitment waves 5 to 8 in three communities, and waves 7 to 15 in the fourth.
Conclusions:
Our study demonstrated that RDS is a feasible and efficient approach for recruiting a large sample of adolescents. Though our research focused on SRH, many adolescents residing in the impoverished urban environments where our study was implemented also experience food insecurity, housing instability and violence. RDS can therefore be a valuable recruitment approach for future studies to reach vulnerable adolescents and design interventions that address the variety of health-related challenges that affect this underserved population.
Keywords: respondent-driven sampling, adolescents, sexual and reproductive health, HIV, sexually transmitted infections, Kenya
INTRODUCTION
Recruitment of a meaningfully large and representative sample of a hard-to-reach target population can be challenging for research studies. Respondent-driven sampling (RDS) is a methodology from the field of sociological research that uses chain referrals with statistical adjustments to approximate a probability basis.[1–3] Similar to snowball sampling, RDS uses long-chain referral whereby members of the target population recruit other members. RDS uses a dual incentive system, where participants receive a primary incentive for completing the survey or interview process and are offered a secondary incentive for the referral of individuals who ultimately enroll in the study.[4] Secondary incentives are generally considered a small token of appreciation for successful referrals.
The recruitment process begins with the purposeful selection of an initial cadre of participants who are referred to as “seeds”. The seeds represent the diversity of the target population with respect to factors such as demographic characteristics (e.g., sex, age, race/ethnicity) and behavioral characteristics (e.g., injection drug use, transactional sex). Seeds also have large social networks from which to recruit other participants and these peer-recruited participants in turn refer additional participants. Successive recruitment “waves” continue until the targeted sample size and equilibrium are reached, thereby providing a basis for adjusting estimates to be representative of the entire target population. Equilibrium is reached when key demographic and behavioral characteristics remain constant over successive waves, indicating that the characteristics of recruited participants are no longer determined by the characteristics of the initial seeds. Recruitment linkages between recruiters and referred participants are utilized to estimate design effects and their impact on standard errors and relative network sizes are used to estimate differential recruitment probabilities.
Similar to other peer referral strategies, RDS is based on the rationale that members of the social network of interest will have better access to the target population than members of the study team. RDS has been used in public health research studies globally. A systematic review of RDS studies worldwide found that populations at high risk for HIV, such as persons who inject drugs, female sex workers and men who have sex with men, can be recruited successfully for behavioral and biological surveys.[5–10]
Relatively few studies have implemented RDS to specifically recruit adolescent participants. RDS was used to recruit adolescents for a study in Sierra Leone that assessed the health conditions of child workers in the diamond-mining sector, a study in Indonesia that evaluated mental health and metabolic syndrome and a study in Brazil that assessed risky sexual behavior among children and adolescents living on the streets.[11,12,13] A multi-country study investigating substance use, sexual and reproductive health, mental health and gender-based violence among adolescents in South Africa, Nigeria, India, China and the United States used RDS in order to reach populations of youth who might be missed by traditional household- and school-based sampling.[14] A study in Kisumu County, Kenya evaluated the effect of a peer chain referral approach on adolescents accessing HIV testing and counseling services.[15]
Maneno Yetu is a mixed-methods study designed to enhance our understanding of the sexual and reproductive health needs of adolescents in Kisumu, Kenya. We opted to use RDS for our study because this sampling approach offered the advantage of being able to reach both adolescents who were attending school and those who were out-of-school. In this paper, we describe our experience with using RDS to recruit adolescent participants for the Maneno Yetu cross-sectional survey.
METHODS
The Maneno Yetu study was implemented in the urban informal settlements of Obunga, Manyatta, Bandani and Nyalenda, which are located in Kisumu, Kenya. Adolescents aged 15 to 19 who resided in the four study communities were eligible for the study. The cross-sectional surveys were conducted between February 2020 and May 2021. In each community, initial seeds were selected from among adolescents who participated in the focus groups component of the Maneno Yetu study.[16,17] Seeds were selected based on the following demographic characteristics: female 15 to 17 years old, male 15 to 17 years old, female 18 to 19 years old and male 18 to 19 years old.
The survey included questions about the size of participants’ social network, specifically: 1) how many adolescents aged 15 to 19 in their community they knew by name; and 2) how many adolescents they thought they could refer to the study. After completing the survey, participants interested in the peer-referral process received a detailed explanation and were provided with up to five referral coupons to distribute to adolescent peers in their community. Participants received 200 Kenyan shillings for completing the survey and 50 Kenyan shillings for each eligible referral who returned the coupon and completed the survey.
To enable tracking of linkages between the recruiter and their referrals, each referral coupon was labelled with a coupon ID number and a referral ID number, which was the original coupon ID number of the participant receiving the referral coupons for distribution. Participants enrolled as seeds were assigned a three-digit ID number whereas all referral participants were assigned a five or six-digit coupon ID number. The first digit of the coupon ID number designated the study community where the participants resided. The first digit of “2” was assigned to Obunga, “4” for Manyatta, “6” for Bandani and “8” for Nyalenda.
In the first community of Obunga, the coupon ID numbers were composed of six digits that contained indicators of the participant’s wave based on the placement of the “0’s” imbedded within the ID. We discontinued this process after completing the surveys in Obunga because generating the coupon ID numbers in real-time for distribution was inefficient, especially at times of high participant flow in the field. For the subsequent three communities, the coupon IDs were assigned a separate wave ID number and a sequential five-digit number based on the order in which the coupons were distributed to participants.
The target sample size for the overall survey was 3,000 participants. The target sample size was 1,000 participants each for the larger communities of Manyatta and Nyalenda, and 500 participants for each of the smaller communities of Obunga and Bandani. Coupon distribution and return rates were monitored throughout the survey periods to estimate when sample size targets would be reached. When approximately 90% of the sample size target had been reached, the number of coupons provided to participants was decreased to three coupons, then reduced further to one coupon when approximately 95% of the sample had been reached. Coupon numbers were tapered when approaching the target sample size to minimize needing to disappoint adolescents who did not return the coupons in time to participate.
All coupons were tracked using an Excel database which recorded the coupon ID numbers given to each participant, the participant’s referrer, and how many of the participant’s referrals who returned the coupon were eligible and completed the survey. Data from the Excel coupon management tool was imported to and managed in Stata Statistical Software: Release 12 (StataCorp LP, College Station, TX). Recruitment homophily for sex, age group and school attendance status were assessed. A homophily estimate of 1 indicates the participant is not more likely to recruit someone like themselves than would be expected when recruiting by chance, while an estimate of 2 indicates the participant is twice as likely to recruit someone like themselves.[18] Data analyses were conducted using the RDS package in R Studio.[19,20] The study received approval from institutional review boards of the University of California San Francisco and the Kenya Medical Research Institute.
RESULTS
Four initial seeds were planted in each community. The study team regularly monitored the cumulative number of participants surveyed and the distribution of demographic characteristics, including sex, age and neighborhoods of residence, to ensure that the sample did not become skewed towards a particular demographic group. Two weeks into the survey period in Obunga, it was observed that two adjacent neighborhoods were underrepresented in the sample. A focus group participant who resided in one of the underrepresented neighborhoods was planted as an additional seed with the intention of increasing the participation of adolescents from those neighborhoods. In Nyalenda, a community that is spread out over a wide geographical area, the survey was conducted sequentially at two venues to minimize the distances participants needed to travel to the survey site. When the study moved to the second venue, an additional seed who resided in one of the surrounding neighborhoods was planted to ensure sufficient representation of adolescents in that area of Nyalenda. Eighteen seeds were planted in total.
The return rate and survey rate, overall and stratified by community, are presented in Figure 1. Overall, 13,489 coupons were distributed and 3,381 adolescents were referred for eligibility screening, yielding a coupon return rate of 25%. The median referral lag time, i.e., the time interval between when the recruiters were given their referrals and when a referred individual enrolled in the study, was three days (IQR 1, 7) for all coupons, with 40% of coupons returned within one day, 38% in two to seven days, 14% in eight to fourteen days, and 8% after fourteen days. By study community, the median referral lag time was one day (IQR 0, 5) in Obunga, five days (IQR 2, 11) in Manyatta, two days (IQR 1, 6) in Bandani and two days (IQR 1, 5) in Nyalenda.
Figure 1.
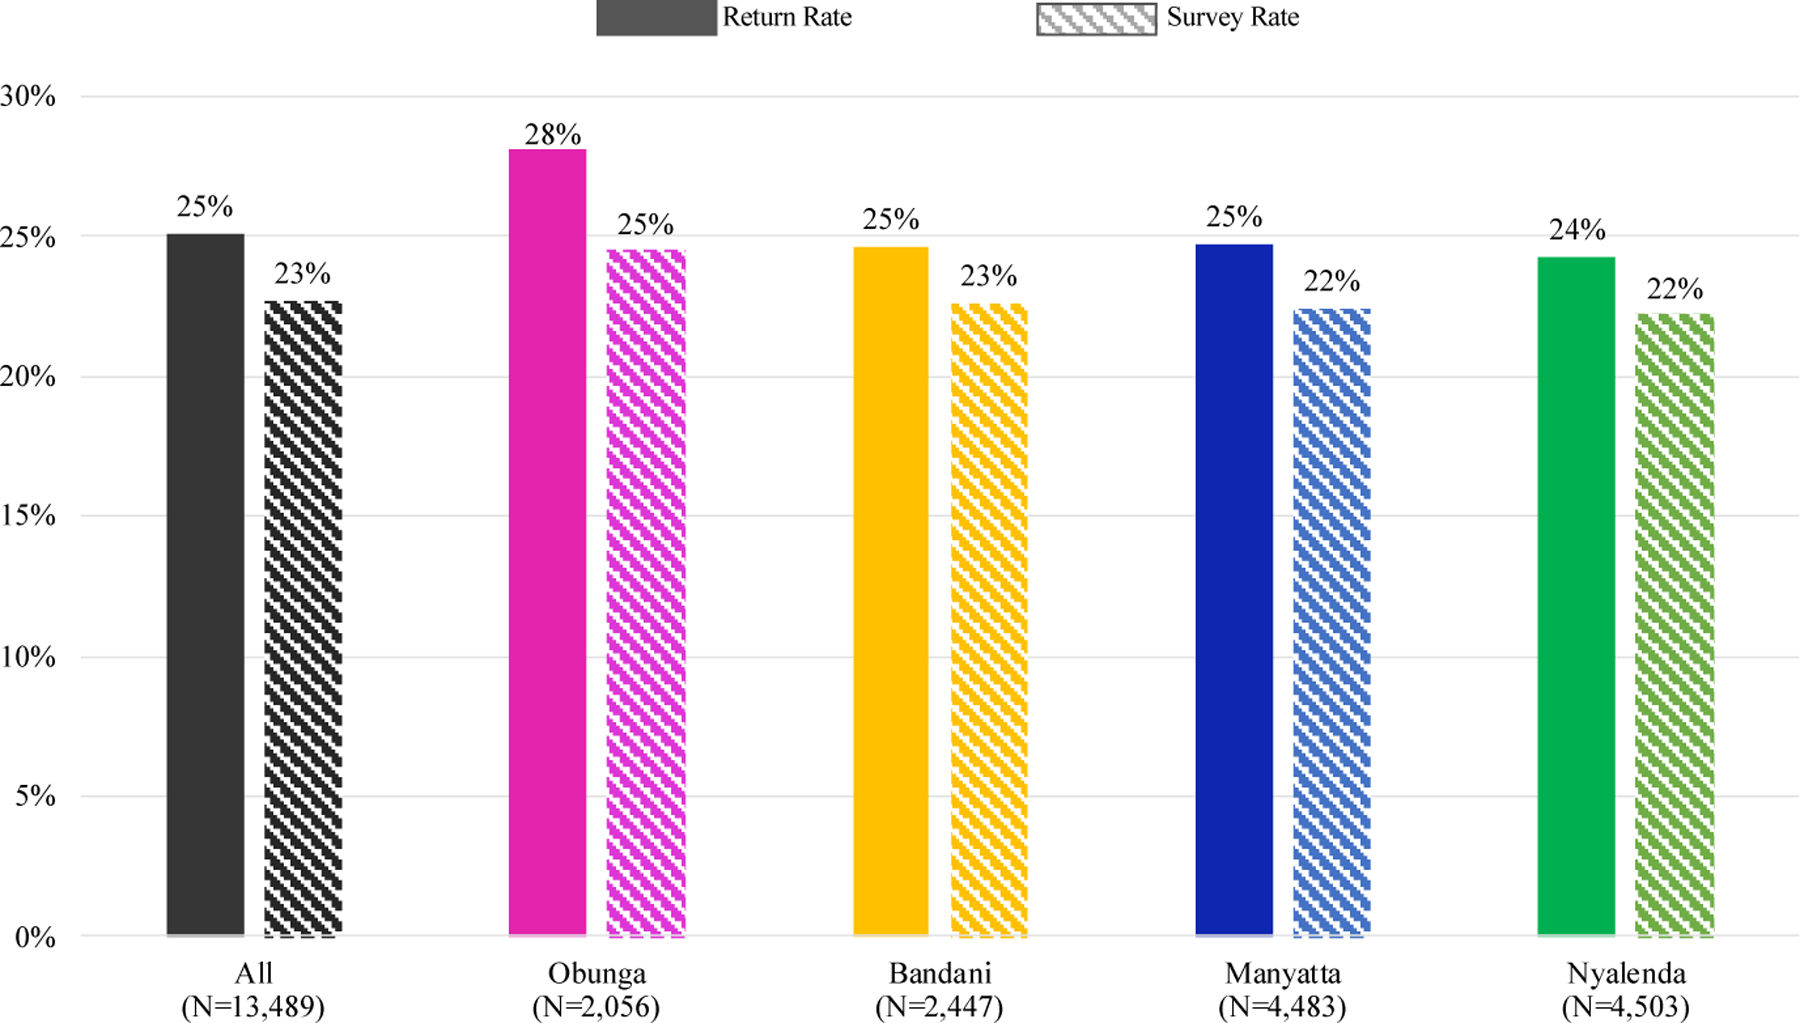
Recruitment coupon return rate and survey rate, Maneno Yetu, Kisumu, Kenya, 2020–2021
We enrolled a total of 3,061 participants, for an overall survey rate of 23%. Of the 320 adolescents ineligible for enrollment, 147 were under the age of 15, 116 were over the age of 19, 51 did not reside in the same community as their referrer, three were repeat participants and three were determined to be unable to provide informed consent. Obunga had the highest return rate at 28% and survey rate at 25%. Return rates and survey rates were relatively similar for Bandani, Manyatta and Nyalenda, with approximately 25% of coupons returned and 22% of referred adolescents completing the survey.
The demographic characteristics of enrolled participants are detailed in Table 1. Overall, slightly more than half of participants (57%) were female. Distribution by sex differed between communities, as Obunga had a higher proportion of male participants while the other three communities had a higher proportion of female participants. Distribution by age also varied between communities, as one-third of participants in Obunga were aged 15 to 17 whereas one-third of participants in Nyalenda were aged 18 to 19. Across all four communities, the majority of participants were currently in school or had completed secondary school.
Table 1.
Demographic characteristics of adolescent participants, Maneno Yetu, Kisumu, Kenya, 2020–2021
| Demographic Characteristics | Overall N=3,061 (%) | Obunga N=503 (%) | Bandani N=553 (%) | Manyatta N=1,003 (%) | Nyalenda N=1,002 (%) |
|---|---|---|---|---|---|
| Community | |||||
| Obunga | 503 (16.43) | - | - | - | - |
| Bandani | 553 (18.07) | - | - | - | - |
| Manyatta | 1,003 (32.8) | - | - | - | - |
| Nyalenda | 1,002 (32.7) | - | - | - | - |
| Sex | |||||
| Female | 1,757 (57.4) | 234 (46.5) | 298 (53.9) | 612 (61.0) | 613 (61.2) |
| Male | 1,304 (42.6) | 269 (53.5) | 255 (46.1) | 391 (39.0) | 389 (38.8) |
| Age | |||||
| 15–17 years | 1,544 (50.4) | 176 (35.0) | 264 (47.7) | 492 (49.1) | 612 (61.1) |
| 18–19 years | 1,517 (49.6) | 327 (65.0) | 289 (52.3) | 511 (50.9) | 390 (38.9) |
| School attendance status | |||||
| Currently in school | 2,614 (85.5) | 337 (67.0) | 452 (81.7) | 906 (90.3) | 919 (91.7) |
| Not in school - completed secondary school | 256 (8.4) | 86 (17.1) | 41 (7.4) | 81 (8.1) | 48 (4.8) |
| Not in school - did not complete secondary school | 191 (6.2) | 80 (15.9) | 60 (10.8) | 16 (1.6) | 35 (3.5) |
The target sample sizes were reached in each of the communities. There were 503 participants enrolled in Obunga in 5.4 weeks, 1,003 participants in Manyatta in 11.1 weeks, 553 participants in Bandani in 3.4 weeks and 1,002 participants in Nyalenda in 7.6 weeks. Variation in the number of weeks required to reach target sample sizes was due to a variety of factors, including larger target sample sizes in Manyatta and Nyalenda, and school break schedules as more participants could come on days when schools were not in session. The enactment of COVID-19 mitigation measures, including local lockdowns in Kisumu, forced the suspension of all study field activities from mid-March 2020 through mid-September 2020, thus accounting for a six-month gap between the completion of survey activities in Obunga and the resumption of survey activities in Manyatta.
The sample distributions across recruitment waves in each community are shown in Figure 2. The number of recruitment waves ranged from 12 in Bandani to 23 in Nyalenda. The sample distribution pattern across recruitment waves were similar in Obunga, Bandani and Manyatta. Approximately 50% of participants were recruited in waves 5 to 8 in Obunga and in waves 5 to 7 in Bandani and Manyatta. The sample distribution in Nyalenda was more widely spread across the waves, with approximately 50% of the sample recruited in waves 5 to 12. The peak number of participants was reached in wave 5 in Obunga (n=68), Manyatta (n=156) and Bandani (n=84) and in wave 14 in Nyalenda (n=94).
Figure 2.
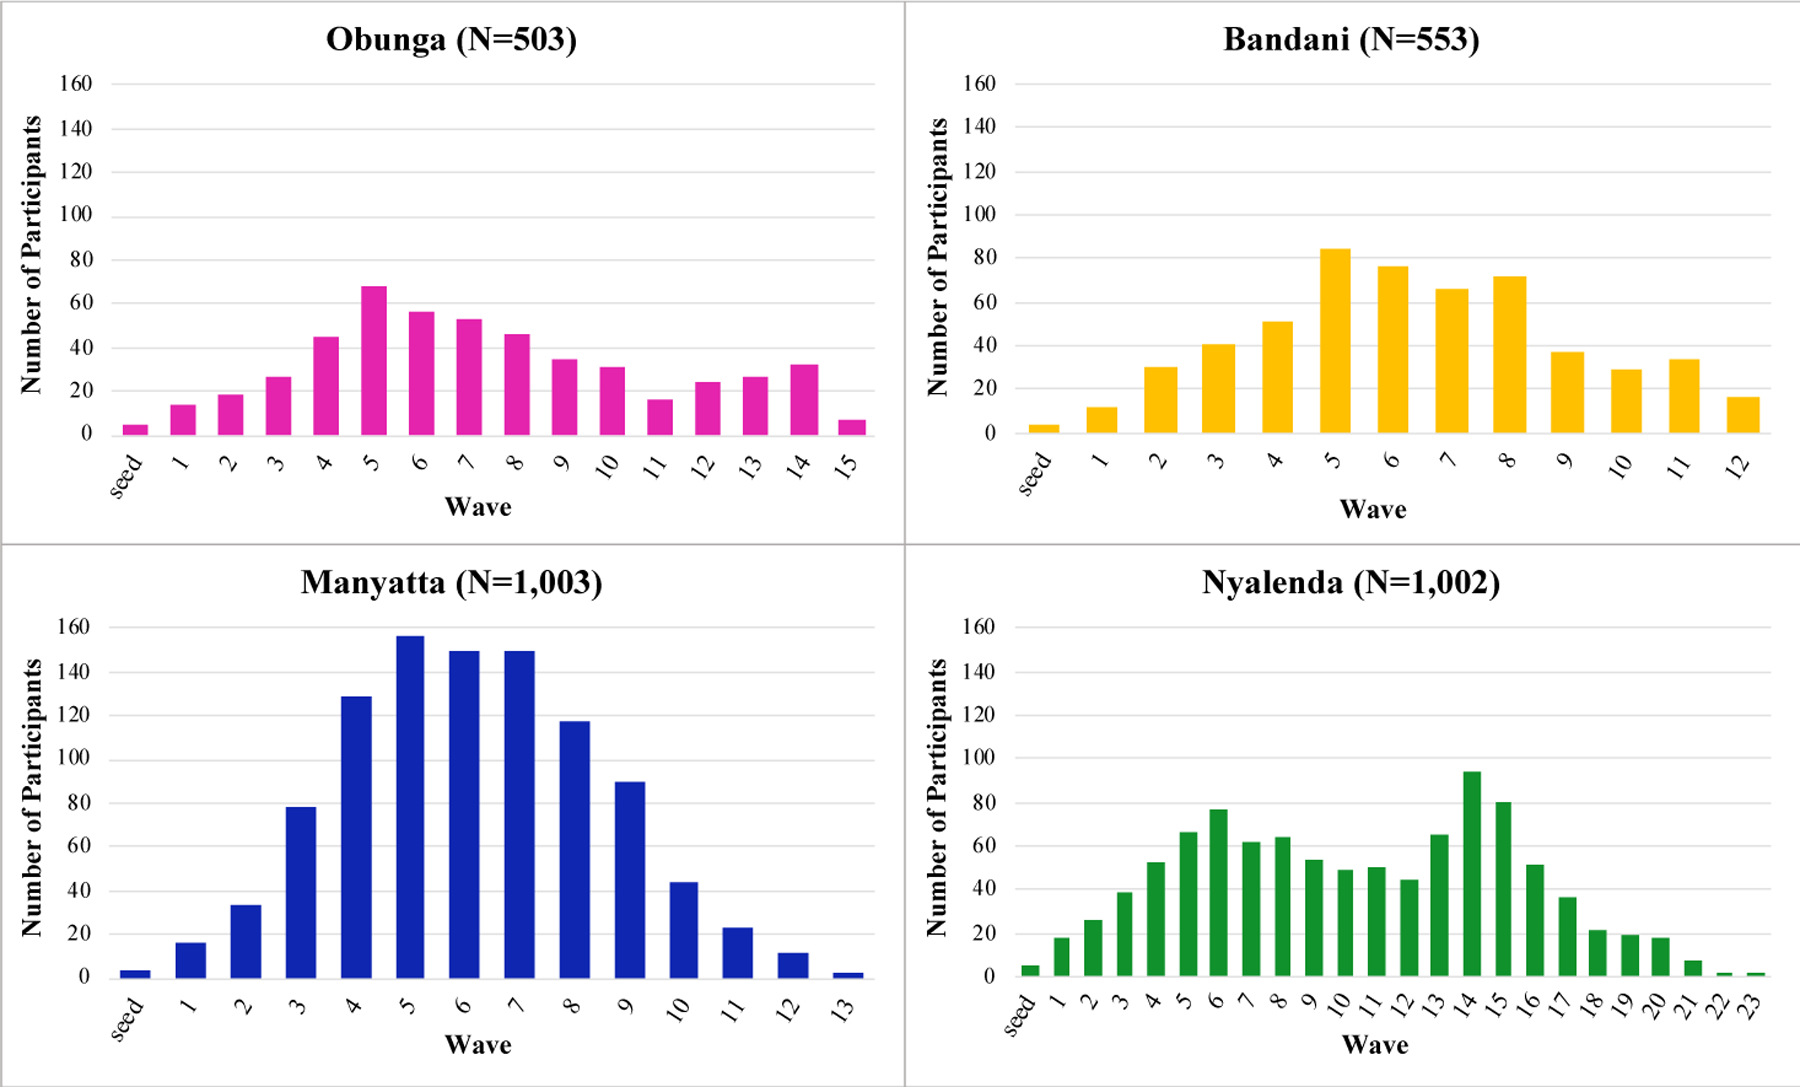
Sample distribution across recruitment waves by community, Maneno Yetu, Kisumu, Kenya, 2020–2021
Equilibrium in demographic characteristics was reached between recruitment waves 5 to 8 in Obunga, Bandani and Manyatta, and between waves 7 to 15 in Nyalenda. Equilibrium for sex was reached in wave 6 in Obunga and Manyatta, wave 8 in Bandani and wave 15 in Nyalenda. Equilibrium for age was reached in wave 8 in Obunga, Manyatta and Bandani, and wave 9 in Nyalenda. Equilibrium for school attendance status was reached in wave 5 in Bandani, wave 7 in Manyatta and Nyalenda, and wave 8 in Obunga. RDS convergence plots for each community showed that the demographic variables converged. Diagnostic bottleneck plots by seed for each community showed that while one seed contributed the bulk of the sample in most communities, the recruitment patterns of other seeds did not show patterns of divergence from one another.
The recruitment networks by community are displayed in Figure 3. Over three-quarters of enrolled participants stemmed from one seed in Obunga [n=409 (81%)] and Nyalenda [n=806 (80%)]. About half of enrolled participants stemmed from one seed in Bandani [n=292 (53%)] and Manyatta [n=521 (52%)]. All seeds recruited at least one wave of referrals except for one seed in Bandani. Of the 3,043 non-seed participants, 1,569 (52%) were referred by a friend, 814 (27%) by a neighbor, 447 (15%) by a relative, 203 (7%) by a schoolmate, 8 (0.3%) by a boyfriend/girlfriend/spouse and 2 (0.1%) by a co-worker.
Figure 3.
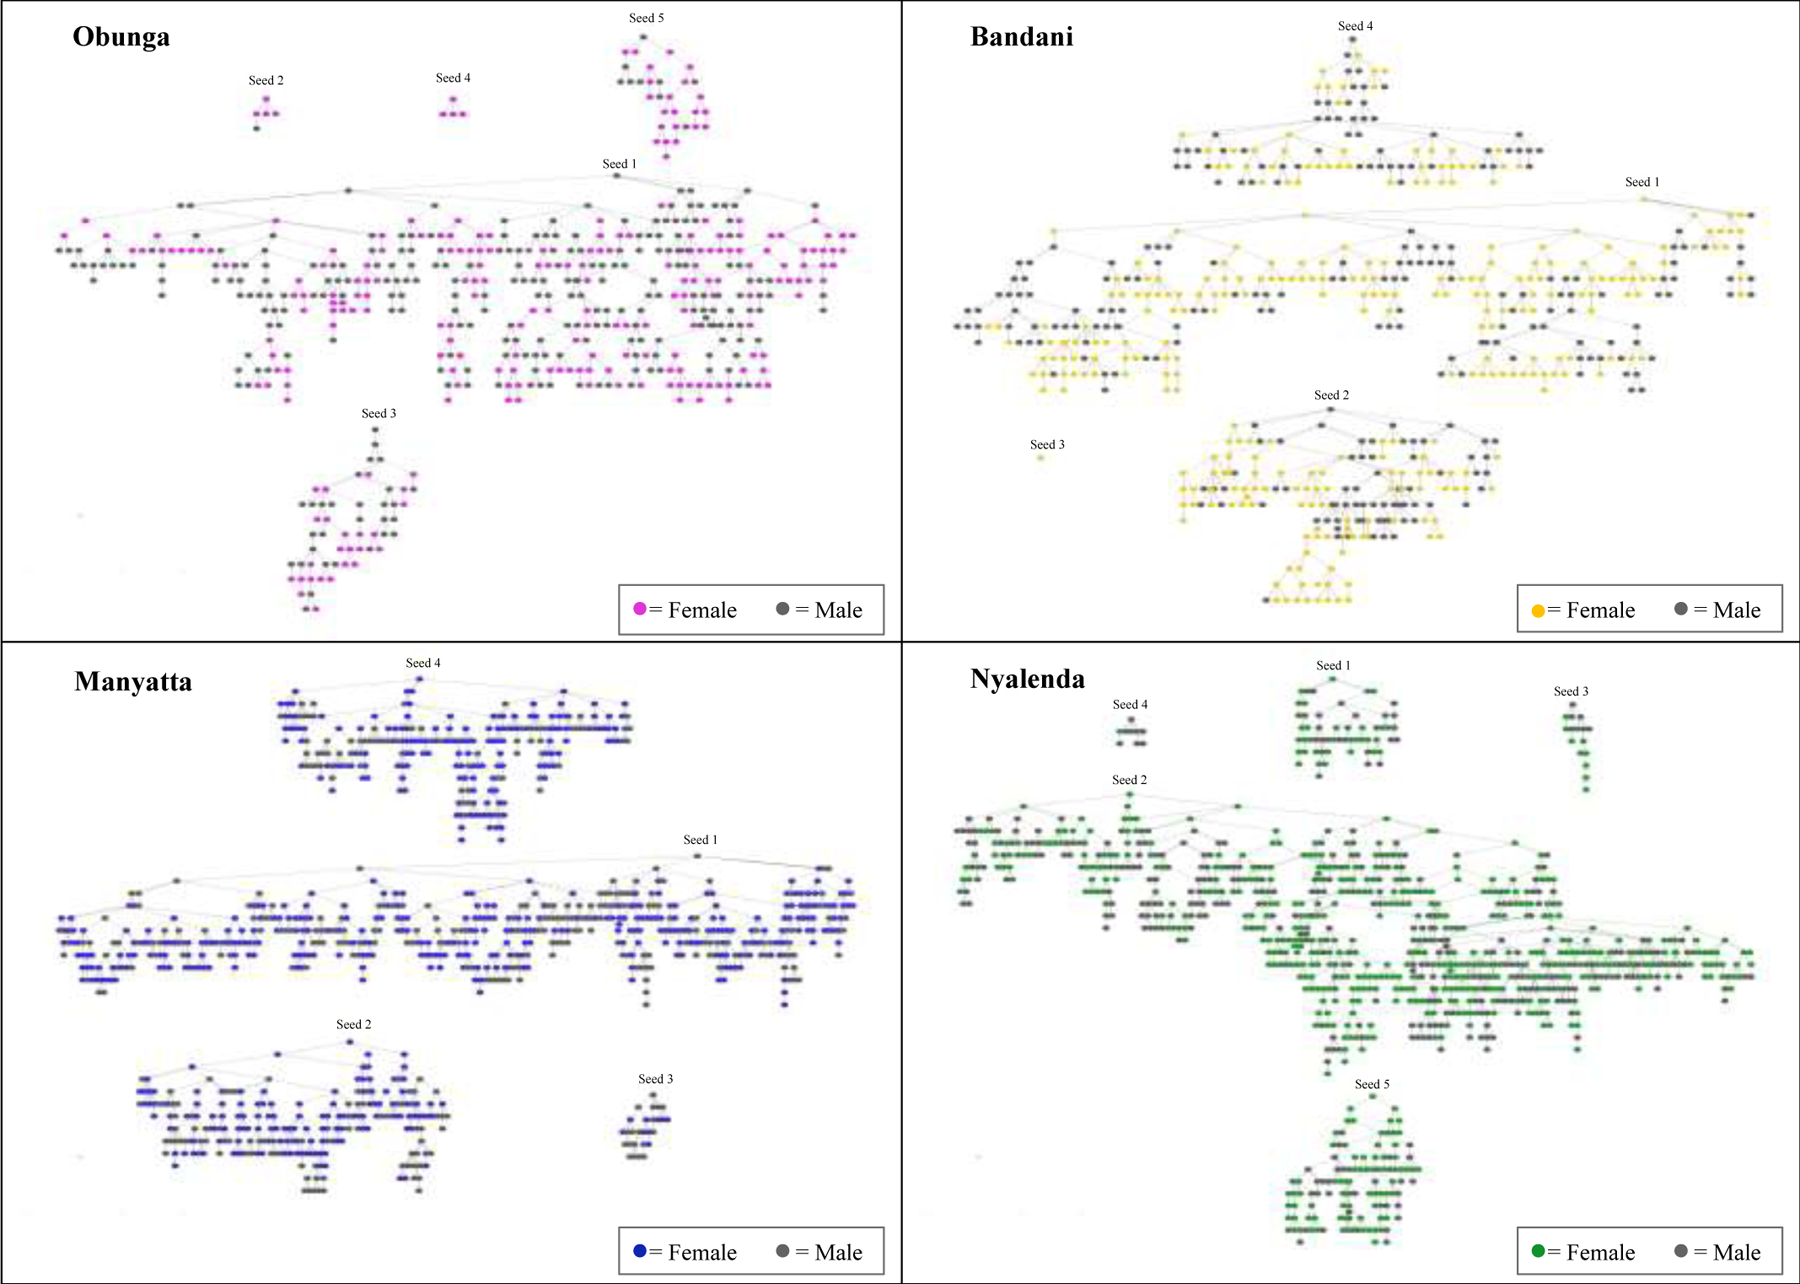
Recruitment networks by community, Maneno Yetu, Kisumu, Kenya, 2020–2021
Recruitment homophily for sex, age group and school attendance status were all under 1.50 across the four communities, indicating participants were slightly more likely to recruit peers who were similar to themselves. Recruitment homophily for school attendance status was lowest, ranging from 1.01 in Manyatta and Nyalenda, to 1.11 in Bandani and 1.21 in Obunga. Recruitment homophily for sex was highest, ranging from 1.22 in Nyalenda, 1.25 in Manyatta, 1.36 in Obunga and 1.40 in Bandani. Recruitment homophily for age group ranged from 1.15 in Obunga and Nyalenda, to 1.21 in Manyatta and 1.29 in Bandani.
DISCUSSION
The Maneno Yetu study successfully recruited a large sample of adolescents in urban informal settlements in Kisumu, Kenya using RDS. In each of the four study communities, we reached our target sample size and equilibrium for the demographic characteristics of sex, age and school attendance status. We enrolled a total of 3,061 adolescents, slightly exceeding our initial target study sample size of 3,000 participants. To the best of our knowledge, our study enrolled more adolescents than previously achieved by other studies that used RDS to specifically recruit this age group. Recent studies reported sample sizes ranging from 307 participants for a study in Brazil to 2,339 participants recruited for a multi-country study.[13,14]
In our study communities, about half of the recruitment chains reached over 10 waves, with a high of 23 waves. The number of waves in each chain reflects the effectiveness and productivity of the recruitment process. Thus, the recruitment chains in our study far exceeded the minimum of four to six waves needed to ensure the recruitment of participants who differed from the initial seeds.[2,3]
RDS relies on the assumption of a connected social network within the target population.[2,21] Given that we were working in relatively small communities and members of the target population are generally of school age, our formative work indicated that the adolescents in these communities are well-connected with considerable overlap in terms of the nature of their relationship, e.g., friends, schoolmates, neighbors. For the survey, all non-seed participants were referred by an adolescent peer who was a friend, neighbor, relative, schoolmate, partner or co-worker.
RDS also relies on the assumption that network connections are reciprocal, such that the recruitment of peers occurs within existing social relationships.[2] Thus, the fact that nearly all of our study participants were referred by individuals they knew well indicates that our sample fulfilled the reciprocity model.
Our study participants were very efficient at recruiting their peers, perhaps a sign of their enthusiasm about participating in the study. More than 75% of the distributed coupons were returned within one week, with a median referral lag time of three days. Coupons were returned most rapidly in Obunga. Being more geographically compact than the other study communities, we were able remain in one location in Obunga, which may have made it easier for potential participants to find us. Our survey venue was the Obunga community center which is centrally located and convenient for adolescents to access. The other study communities did not have a similar venue available, so our study was based at schools when they were closed during weekends and term breaks, and at churches when no services were scheduled. The very rapid coupon return rate in Obunga enabled us to complete the surveys only a few days before the mandated lockdown and 6-month suspension of field activities due to the COVID-19 pandemic. Therefore, the calculation of median referral lag time overall was not affected by the pause in survey implementation between Obunga and Manyatta.
Throughout the study, we closely monitored referral patterns and enrollment rates, thereby enabling us to make adjustments in the recruitment process when necessary. We planted additional seeds when we observed adolescents from particular neighborhoods were underrepresented in the sample and also moved the survey site to facilitate access for adolescents residing in more remote neighborhoods. Monitoring enrollment flow also informed the timing of when to reduce the number of coupons distributed to participants. As we approached our target sample size, we tapered off the number of coupons distributed to limit the number of coupons circulating in the community in an effort to minimize disappointing adolescents interested in participating but returned the coupons after enrollment had ended already.
For the referral coupons, we used the first digit of each coupon ID number to designate each study community. These communities are located geographically adjacent to one another, therefore adolescents likely had peers in their social network who lived in a neighboring community. Thus, the coupon numbering system enabled the study team to identify rapidly whether the coupon being returned belonged to the correct community. Participants were also asked to verify their community of residence during the eligibility screening phase of the survey. Both of these validation steps allowed us to prevent the potential cross-over between communities.
Our survey sample comprised of 57% girls and 43% boys, a distribution that was nearly identical to that of female (56%) and male (44%) adolescents participating in a community health initiative with a household census program component that was implemented in the same informal settlements two years prior to our study.[22,23] The relatively balanced distribution by sex of our survey sample may be due in part to the selection of both girls and boys as initial seeds, whereas a previous study with adolescents in Kisumu County selected all female adolescents as seeds who in turn only referred male participants initially until specifically instructed to refer female peers.[15] We had a high proportion of seeds with successful referrals (94.4%) with the 18 seeds recruited 3,043 referral participants compared to another adolescent study in Kisumu that reported a lower proportion of seeds with successful referrals (30.7%) with 252 seeds recruiting 792 referral participants.[15] A study in Indonesia planted 17 seeds who successfully recruited 824 referral participants, a study in Brazil planted 17 seeds who recruited 300 referral participants and a multi-country study planted 44 seeds who recruited 2,295 referral participants.[12,13,14] Even though over three-quarters of our participants were still attending school, we also enrolled adolescents who were out-of-school, which included those who had already completed secondary school and those who had dropped out of school. We would have missed the out-of-school population had the survey utilized a school-based recruitment approach, thus highlighting the usefulness of RDS.
Our study demonstrated that RDS is a feasible and efficient approach for recruiting a large sample of adolescents. Though the focus of our research was on sexual and reproductive health issues, many adolescents residing in the impoverished urban environments where our study was implemented also experience food insecurity, housing instability and violence. Thus, RDS can be a useful approach for recruiting vulnerable adolescents for future studies focuses on other health-related issues that affect this underserved population.
Funding
NIH R01 HD094683, NIH R01 HD094683-03S1; NIH R01 HD094683-04S1
Footnotes
Publisher's Disclaimer: This is a PDF file of an unedited manuscript that has been accepted for publication. As a service to our customers we are providing this early version of the manuscript. The manuscript will undergo copyediting, typesetting, and review of the resulting proof before it is published in its final form. Please note that during the production process errors may be discovered which could affect the content, and all legal disclaimers that apply to the journal pertain.
Declaration of interests
The authors declare that they have no known competing financial interests or personal relationships that could have appeared to influence the work reported in this paper.
REFERENCES
- 1.Heckathorn DD. Respondent-driven sampling: A new approach to the study of hidden populations. Social Problems 1997; 44(2):174–199. [Google Scholar]
- 2.Heckathorn DD. Respondent-driven sampling II: deriving valid population estimates from chain-referral samples of hidden populations. Social Problems 2002; 49(1):11–34. [Google Scholar]
- 3.Salganik M, Heckathorn DD. Sampling and estimation in hidden populations using respondent-driven sampling. Sociol Methodol 2004; 34:193–239. [Google Scholar]
- 4.McCreesh N, Frost SDW, Seeley J, et al. Evaluation of respondent-driven sampling. Epidemiology 2012; 23(1):138–147. [DOI] [PMC free article] [PubMed] [Google Scholar]
- 5.Oguya FO, Kenya PR, Ongecha F, et al. Rapid situational assessment of people who inject drugs (PWID) in Nairobi and coastal regions of Kenya: a respondent driven sampling survey. BMC Public Health 2021; 21(1):1549. [DOI] [PMC free article] [PubMed] [Google Scholar]
- 6.Semá Baltazar C, Horth R, Boothe M, et al. High prevalence of HIV, HBsAg and anti-HCV positivity among people who injected drugs: results of the first bio-behavioral survey using respondent driven sampling in two urban areas in Mozambique. BMC Infect Dis 2019; 19(1):1022. [DOI] [PMC free article] [PubMed] [Google Scholar]
- 7.Jonas A, Patel SV, Katuta F, et al. HIV prevalence, risk factors for infection, and uptake of prevention, testing and treatment among female sex workers in Namibia. J Epidemiol Glob Health 2020; 10(4):351–358. [DOI] [PMC free article] [PubMed] [Google Scholar]
- 8.Chabata ST, Hensen B, Chiyaka T, et al. Condom use among young women who sell sex in Zimbabwe: a prevention cascade analysis to identify gaps in HIV prevention programming. J Int AIDS Soc 2020; 23(Suppl 3):e25512. [DOI] [PMC free article] [PubMed] [Google Scholar]
- 9.Truong HM, Fatch R, Grasso M, et al. Gay and bisexual men engage in fewer risky sexual behaviors while traveling internationally: a cross-sectional study in San Francisco. Sex Transm Infect 2015; 91(3):220–225. [DOI] [PMC free article] [PubMed] [Google Scholar]
- 10.Truong HM, Grasso M, Chen YH, et al. Balancing theory and practice in respondent-driven sampling: a case study of innovations developed to overcome recruitment challenges. PLoS One 2013; 8(8):e70344. [DOI] [PMC free article] [PubMed] [Google Scholar]
- 11.Bjørkhaug I, Hatløy A. Utilization of respondent-driven sampling among a population of child workers in the diamond-mining sector of Sierra Leone. Glob Public Health 2009; 4(1):96–109. [DOI] [PubMed] [Google Scholar]
- 12.Azzopardi PS, Willenberg L, Wulan N, et al. Direct assessment of mental health and metabolic syndrome amongst Indonesian adolescents: a study design for a mixed-methods study sampled from school and community settings. Glob Health Action 2020; 13(1):1732665. [DOI] [PMC free article] [PubMed] [Google Scholar]
- 13.Hartmann CF, Silva LN, Corrêa ML, et al. Risky sexual behavior among street children, adolescents, and young people living on the street in southern Brazil. J Community Health 2021; Online ahead of print. [DOI] [PubMed]
- 14.Decker MR, Marshall BD, Emerson M, et al. Respondent-driven sampling for an adolescent health study in vulnerable urban settings: a multi-country study. J Adolesc Health 2014; 55(6 Suppl):S6–S12. [DOI] [PMC free article] [PubMed] [Google Scholar]
- 15.Ong’wen P, Samba BO, Moghadassi M, et al. Chain peer referral approach among adolescents in Kisumu County, Kenya. AIDS Behav 2020; 24(2):484–490. [DOI] [PMC free article] [PubMed] [Google Scholar]
- 16.Zamudio-Haas S, Auerswald C, Miller L, et al. Seeking a “sponyo” insights into motivations and risks around intergenerational transactional sex among adolescent boys and girls in Kenya. J Adolesc Health 2021; 68(5):903–936. [DOI] [PMC free article] [PubMed] [Google Scholar]
- 17.Miller LE, Zamudio-Haas S, Otieno B, et al. “We don’t fear HIV. We just fear walking around pregnant.”: A qualitative analysis of adolescent sexuality and pregnancy stigma in informal settlements in Kisumu, Kenya. Stud Fam Plan 2021; 52(4):557–570. [DOI] [PMC free article] [PubMed] [Google Scholar]
- 18.Gile KJ, Handcock MS. Respondent-driven Sampling: An Assessment of Current Methodology. Sociol Methodol 2010; 40:285–327. [DOI] [PMC free article] [PubMed] [Google Scholar]
- 19.RStudio Team. RStudio: Integrated Development for R. RStudio, PBC, Boston, MA. [Google Scholar]
- 20.Handcock MS, Gile KJ, Fellows Ian E, Whipple Neely W. RDS: Respondent Driven Sampling. R package (0.9–3)
- 21.Thompson L, Schellenberg J, Ormond M, Wylie J. Social structural analysis of street-involved youth in Winnipeg, Canada. J Soc Struct 2011; 12:1–17. [Google Scholar]
- 22.Truong HM, Guzé MA, Ouma D, et al. Community-based HIV testing for urban youth in Western Kenya. AIDS Behav 2022; 26(3):814–821. [DOI] [PMC free article] [PubMed] [Google Scholar]
- 23.Truong HM, Mocello AR, Ouma D, et al. Community-based HIV testing services in an urban setting in Western Kenya: a program implementation. Lancet HIV 2021; 8(1):e16–e23. [DOI] [PMC free article] [PubMed] [Google Scholar]