

Summary
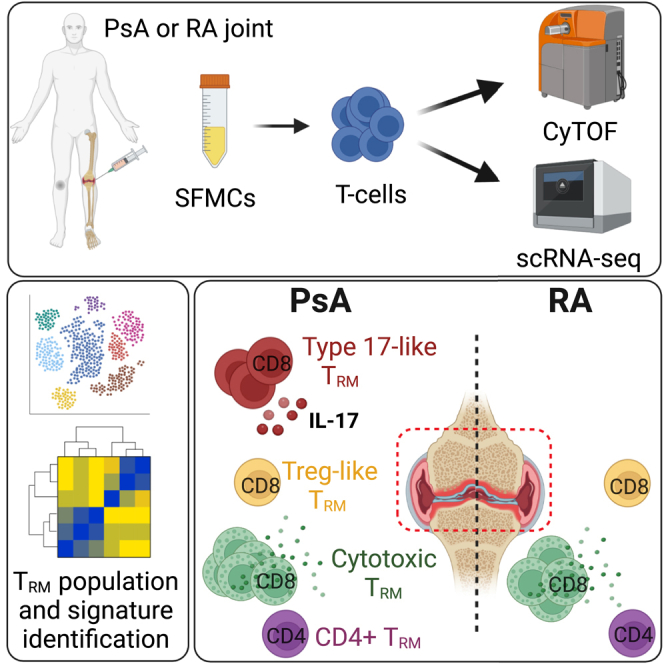
CD69+CD103+ tissue-resident memory T (TRM) cells are important drivers of inflammation. To decipher their role in inflammatory arthritis, we apply single-cell, high-dimensional profiling to T cells from the joints of patients with psoriatic arthritis (PsA) or rheumatoid arthritis (RA). We identify three groups of synovial CD8+CD69+CD103+ TRM cells: cytotoxic and regulatory T (Treg)-like TRM cells are present in both PsA and RA, while CD161+CCR6+ type 17-like TRM cells with a pro-inflammatory cytokine profile (IL-17A+TNFα+IFNγ+) are specifically enriched in PsA. In contrast, only one population of CD4+CD69+CD103+ TRM cells is detected and at similarly low frequencies in both diseases. Type 17-like CD8+ TRM cells have a distinct transcriptomic signature and a polyclonal, but distinct, TCR repertoire. Type 17-like cells are also enriched in CD8+CD103− T cells in PsA compared with RA. These findings illustrate differences in the immunopathology of PsA and RA, with a particular enrichment for type 17 CD8+ T cells in the PsA joint.
Keywords: CD103, CD8+ T cells, TRM, Tc17 cells, CyTOF, scRNA-seq, joint, synovial fluid, psoriatic arthritis, rheumatoid arthritis
Graphical abstract
Highlights
-
•
Human arthritic joints contain distinct subsets of resident memory T (TRM) cells
-
•
Psoriatic and rheumatoid arthritis joints differ in TRM subset composition
-
•
Psoriatic arthritis is enriched for pro-inflammatory type 17 TRM and other T cells
-
•
Rheumatoid arthritis is enriched for T cells with a cytotoxic profile
Combining CyTOF and scRNA-seq immunophenotyping, Povoleri et al. reveal quantitative differences in synovial CD8+ tissue-resident memory T (TRM) cell subset composition between psoriatic and rheumatoid arthritis. The proinflammatory type 17 profile enriched in TRM cells from psoriatic arthritis joints may potentially explain the differential responses to IL-17 blockade between the diseases.
Introduction
Psoriatic arthritis (PsA) and rheumatoid arthritis (RA) are the most common types of inflammatory arthritis, and they frequently cause significant disability and reduction in quality of life.1 Inflammation of the synovial joints is a key characteristic of both diseases; however, PsA and RA have marked differences in serology and genetic associations and show different responses to targeted therapies.1 Despite major improvements in effective therapies, both diseases run a chronic course with recurrent disease flares and low frequencies of drug-free prolonged remission states. It is not known why inflammation specifically affects the joints or persists despite current therapies suppressing inflammatory pathways. Critically, there are no current treatments that specifically target cells that reside only in the inflamed tissue. Improved knowledge of the cells or factors that drive chronic joint inflammation would create a novel basis for moving toward joint targeted treatments to stop development or progression of arthritis by inhibiting pathways that drive persistent disease.
The recent identification of a functional T cell subset, called tissue-resident memory T cells (TRM cells), may provide key insights into mechanisms driving chronic immune-mediated inflammatory diseases.2,3,4 TRM cells, typically identified by expression of CD69 and/or CD103, are a specialized subset of effector T cells that provide tissue-specific immune surveillance.2,5,6 Most TRM cells remain permanently in the tissue and do not recirculate in the blood. However, recent studies have shown that a small proportion of TRM cells can exit the tissues and persist in the blood, seed in distant tissues or lymph nodes, or trans-differentiate into other memory subsets.7,8,9,10 While most previous studies have focused on CD8+ TRM cells, these cells exist in both the CD4+ and CD8+ T cell compartment.11,12,13 They are mainly located in epithelial tissues such as skin, lung, and gut, where it is proposed they protect against infection and cancer but may also contribute to chronic inflammation.11,12,14,15,16,17 Accumulating evidence indicates that TRM cells are present in the inflamed joints of patients with PsA, RA, and juvenile idiopathic arthritis, where they may drive chronic inflammation and disease flares.18,19,20,21,22
In humans, TRM cells share a core transcriptional signature including upregulation of extracellular molecules that facilitate tissue retention (CD103, CXCR6, CD49a, and CRTAM), inhibitory receptors (PD-1 and CTLA4), and cytokines (IFNγ, IL-2, IL-17A, and IL-10), downregulation of extracellular molecules required for tissue egress (CD62L and S1PR1), and low basal proliferation.15 Despite this shared signature, TRM cells are heterogeneous and can differ both within and between tissues. In human skin, for instance, CD49a expression differentiates two functionally distinct TRM cells: cytotoxic or IL-17-producing.14 Furthermore, the conditions required for the differentiation and maintenance of TRM cells can differ between tissues, as shown by evidence that transforming growth factor β (TGFβ) signaling is required for murine skin but not liver TRM cells.23
Here, we investigated the hypothesis that TRM cells are present in the inflamed joints of patients with inflammatory arthritis but that these cells are numerically, phenotypically, and/or functionally different between PsA and RA. Using high-dimensional profiling (CyTOF and single-cell RNA sequencing [scRNA-seq]), we performed quantitative and qualitative analysis of synovial fluid CD8+ and CD4+ CD69+CD103+ TRM cells from patients with PsA or RA. We identified one population of synovial CD4+CD69+CD103+ TRM cells, which were present at similarly low frequencies in both PsA and RA. In contrast, multiple distinct populations of CD8+CD69+CD103+ TRM cells were found enriched in PsA. In particular, an enrichment of type 17-like cells was found among CD8+CD103+ TRM cells as well as among CD8+CD103− T cells in PsA compared with RA. We show that type 17 CD8+CD69+CD103+ TRM cells in PsA have a pro-inflammatory cytokine profile and a distinct transcriptomic signature. Furthermore, clonality analysis revealed a polyclonal but distinct T cell receptor (TCR) repertoire for synovial type 17-like CD8+CD69+CD103+ TRM cells compared with other TRM and CD8+CD103− T cells in patients with PsA. These findings add substantively to the accumulating evidence that the immunopathologies of PsA and RA are different, with a particular role for type 17-like CD8+CD103+ TRM and CD8+CD103− T cells in PsA.
Results
Multiple populations of CD8+CD69+CD103+ TRM cells are enriched in the synovial fluid of patients with PsA compared with RA
We first sought to determine whether there were differences in joint-derived CD8+ or CD4+ TRM cells between PsA (n = 8 samples from n = 7 different patients) versus RA (n = 5 samples from n = 5 patients) (see Table 1 for demographic and clinical information). For this, we performed mass cytometry (CyTOF) on CD3+ T cells isolated from cryopreserved synovial fluid mononuclear cells (SFMCs) and measured the expression of multiple chemokine receptors, transcription factors, T cell receptors, and effector and cytotoxic molecules on exported CD8+ and CD4+ T cells (CyTOF panel I; key resources table). We focused our analysis on live T cells using a customized version of the CATALYST pipeline24 (Figure S1A). We first applied multidimensional scaling (MDS) using median marker expression across all cells to evaluate differences between the patient samples. This analysis did not reveal disease-specific clustering of synovial CD8+ or CD4+ T cells, suggesting a degree of phenotypic similarity between the two patient cohorts (Figure 1A). Next, we generated uniform manifold approximation and projections (UMAPs) of the expression of CD69 and CD103, canonical markers of human TRM cells, on synovial T cells from patients with PsA or RA. CD103 expression in synovial CD8+ T cells, and to a lesser degree CD4+ T cells, clearly clustered TRM cells in both PsA and RA, with a higher abundance of CD103+ cells within the CD8+ T cell compartment (Figure 1B). The data also suggested higher expression of CD103 in patients with PsA compared with RA (Figure 1B). In contrast, we found that the majority of synovial CD8+ and CD4+ T cells expressed high levels of CD69, which most likely reflects the state of T cell activation in this inflammatory environment rather than identifying those cells as CD69+CD103− TRM cells. Hence, in this study we defined TRM cells as CD69+CD103+ double-positive cells.
Table 1.
Demographic and clinical parameters of patients with PsA and RA included for CyTOF and scRNA-seq
| Patients included for CyTOF |
Patients included for scRNA-seq |
||
|---|---|---|---|
| PsA (n = 7) | RA (n = 5) | PsA | |
| Male/female | 4/3 | 1/4 | 2/2 |
| Age (years, mean ± SD) | 42 ± 15 | 57 ± 14 | 36 ± 9.7 |
| Disease duration (years, mean ± SD) | 11 ± 8.3 | 7.7 ± 4.2 | 8.6 ± 7.1 |
| DAS28 | 6.4 ± 1.3 (n = 2) | 4.7 ± 1.3 (n = 5) | 5.4 ± 0 (n = 1) |
| Rheumatoid factor/ACPA+ (%) | 0 | 60 | 0 |
| Medication | nil (n = 1); NSAIDs (n = 1); Pred (n = 3); MTX (n = 2); MTX/naproxen (n = 1) | nil (n = 2); MTX/Pred (n = 1); SSZ (n = 2) | nil (n = 1); Pred (n = 1); MTX (n = 2) |
No significant bias or association due to patient clinical parameters, sex/gender, age, disease duration, or treatment strategy was observed in the data analysis. ACPA, anti-citrullinated protein antibody; DAS28, disease activity score in 28 joints; MTX, methotrexate; NSAIDs, non-steroidal anti-inflammatory drugs; Pred, prednisolone; SD, standard deviation; SSZ, sulfasalazine.
Figure 1.

Mass cytometry identifies distinct populations of synovial CD8+CD69+CD103+ and CD4+CD69+CD103+ TRM cells in patients with PsA and RA
Synovial fluid CD3+ T cells from patients with PsA (n = 8) or RA (n = 5) were stained with panel I (without stimulation); live CD8+ and CD4+ T cells were gated and analyzed independently; data from CD8+ T cells (left panels) and CD4+ T cells (right panels) are shown.
(A) MDS plot for PsA (red) and RA (blue) samples; clustering was based on all marker median expression.
(B) UMAPs based on the arcsinh-transformed expression of 32 markers evaluated in total CD8+ (left) and CD4+ (right) T cells. From each sample, 60,000 cells were randomly selected. UMAPs show cell expression levels of CD69 (left column) and CD103 (right column), stratified by disease: PsA (top row) and RA (bottom row). Cells were clustered based on surface and intracellular markers.
(C) Heatmap of the median marker intensities of the 32 markers across the 15 populations obtained with FlowSOM. Color and value in the heatmap represent the median arcsinh-transformed, 0- to 1-scaled marker expression calculated over cells from all samples; hierarchical similarity between the 15 clusters calculated by Euclidean distance with average linkage. Barplots alongside the rows and values show the relative cluster sizes and ID.
(D) UMAPs generated as in (B) stratified by disease and showing cells colored according to the 15 populations obtained with FlowSOM and characterized in (C); red circles highlight TRM cell clusters.
Cell population identification was then conducted by unsupervised clustering using the FlowSOM and ConsensusClusterPlus packages, which resolved both CD8+ and CD4+ T cells into 15 clusters across all patient samples, with each population characterized by a different expression profile (Figure 1C). These 15 clusters were mapped onto UMAPs of CD8+ and CD4+ T cells from patients with PsA or RA for direct comparison (Figure 1D). Based on the co-expression of CD69 and CD103, FlowSOM analysis identified clusters 8, 11, 12, 13, 14, and 15 as TRM cells within CD8+ T cells and cluster 15 as TRM cells within CD4+ T cells (Figure 1C). Of note, cluster 8 showed an overall lower expression of the TRM marker CD103, which was due to its expression being limited to a subset of cells in that cluster. However, FlowSOM was not able to separate out a distinct cluster due to the shared phenotypic characteristics of the CD103+ and CD103− cells within this cluster.
We investigated if there were quantitative differences in these CD8+ and CD4+ TRM cell clusters between PsA and RA. Frequency analysis revealed that the different CD8+ TRM cell populations all appeared enriched in PsA compared with RA, with a statistically significant increase in PsA for cluster 12, which was virtually absent in patients with RA (Figure 2A). In contrast, CD4+ TRM cell frequencies were similarly low in both PsA and RA (Figure 2B).
Figure 2.

Multiple populations of synovial CD8+CD69+CD103+ TRM cells are enriched in patients with PsA compared with RA
(A and B) Cumulative data showing the relative abundance of CD8+CD69+CD103+ (A) and CD4+CD69+CD103+ (B) TRM cell clusters from Figure 1C, identified by co-expression of CD69 and CD103, in patients with PsA (red) and RA (blue); boxplots show median ± interquartile range (IQR); PsA (n = 8) and RA (n = 5) data analyzed by generalized linear mixed models (GLMMs) and p <0.05 reported.
(C and D) Heatmap of the median marker intensities of the 32 markers across the 6 CD8+CD69+CD103+ TRM cell populations (C) and 1 CD4+CD69+CD103+ TRM cell population (D). Heatmap details as in Figure 1. MEM labels (boxed) were computationally generated for each of the CD8+CD69+CD103+ TRM cell populations (C) and the CD4+CD69+CD103+ TRM cell population (D), and markers were assigned positive (up arrow) or negative (down arrow) enrichment values within each cluster using all other clusters as reference. Cluster defining markers are highlighted in bold.
To identify a signature for these clusters, we performed marker enrichment modeling (MEM) analysis25 to quantify subset-specific, positive and negative marker enrichment. MEM scores confirmed high positive CD103 enrichment for all CD8+ and CD4+ TRM clusters, which served as positive control for the classification of these subsets as TRM cells (Figure 2C). This MEM analysis revealed several major CD8+ TRM phenotypes: clusters 8, 14, and 15 shared a positive enrichment for cytotoxic mediators perforin and granzymes A and B together with enrichment for CXCR6 and the transcription factor Eomes, indicating a cytotoxic effector profile; cluster 11 was characterized by enrichment for CD127, CD101, and CCR7; cluster 12 showed CXCR6 with CD161 and CCR6 enrichment, suggesting a type 17-like TRM profile; finally, cluster 13 was distinguished by CXCR6 with CD25, Foxp3, Helios, and CD101, but also CD161 and CCR6, enrichment, indicating a regulatory T (Treg)-like TRM profile with a type 17 signature (Figure 2C). MEM analysis of CD4+ TRM cells revealed a type 17-like TRM profile with CD161, CD127, and CXCR6 enrichment (Figure 2D). CD49a, a marker previously associated with CD8+ TRM cells poised for cytotoxic function in human skin,14,26 was expressed at varying degrees in several clusters (Figures 2C and 2D).
While the frequencies of the CD8+ TRM cell subsets were different between PsA and RA (Figure 2A), there were only minor phenotypic differences when comparing these populations between the two diseases (Figure S1B). A similar result was seen for CD4+ TRM cells (Figure S1C). This indicates that the TRM cell subsets differ quantitatively, at least in the CD8 compartment, rather than qualitatively between PsA and RA.
Cytokine expression profiles of synovial CD8+CD69+CD103+ TRM cell populations
To functionally characterize the different CD8+ TRM populations, we performed CyTOF on synovial CD3+ T cells that were stimulated for 3 h with PMA/ionomycin in the presence of GolgiStop followed by staining with a modified cytokine focused panel (CyTOF panel II; key resources table). As expected, PMA/ionomycin greatly increased the expression of CD69 in most of the cells; however, a clear clustering of CD103-expressing cells could still be found and, concordant with our previous results, higher CD103 expression and increased frequency of CD103+ cells were observed in synovial CD8+ T cells from patients with PsA compared with RA (Figure 3A). FlowSOM resolved the synovial CD8+ T cells into 15 clusters (Figure 3B and 3C), with clusters 4, 5, 9, 13, and 15 identified as TRM cells based on their co-expression of CD103 and CD69 (Figure 3B). Of these, clusters 9, 13, and 15 were all highly significantly enriched in synovial CD8+ T cells from patients with PsA compared with RA (Figure 3D). MEM analysis of the CD8+ TRM clusters revealed distinct cytokine signatures: clusters 9, 13, and 15 were all characterized by CD161 enrichment, associating them to a type 17-like TRM profile. These clusters showed polyfunctional but different cytokine production profiles with cluster 9 enriched for IFNγ and TNFα, cluster 13 for TNFα and IL-2, and cluster 15 showing IL-17A, IFNγ, and TNFα as well as CXCR6 enrichment (Figures 3E and S2). Cluster 4 showed IFNγ enrichment together with Eomes, which correlated it to the cytotoxic effector profile from panel I, while cluster 5 showed CD25, Foxp3, and Helios enrichment but no positive cytokine enrichment, correlating it to a Treg-like profile. These data suggest that the different CD8+ TRM cell populations are characterized by discrete cytokine profiles. The expression of other cytokines tested (IL-4, IL-6, IL-10, IL-17F, IL-21, IL-22, GM-CSF, and TGFβ) was relatively low in these five TRM clusters, although some PsA TRM clusters showed higher expression levels compared with their RA counterparts (Figure S2).
Figure 3.

Cytokine expression profiles of synovial CD8+CD69+CD103+ TRM cell populations
Synovial fluid CD3+ T cells were stimulated for 3 h with PMA/ionomycin in the presence of GolgiStop and stained with panel II; live CD8+ T cells were gated and analyzed.
(A) UMAPs based on the arcsinh-transformed expression of 33 markers evaluated in total CD8+ T cells from patients with PsA (n = 7) or RA (n = 4). From each sample, 38,000 cells were randomly selected. UMAPs show cell expression levels of CD69 (left column) and CD103 (right column), stratified by disease: PsA (top row) and RA (bottom row). Cells were clustered based on surface and intracellular markers.
(B) Heatmap of the median marker intensities of the 33 markers across the 15 cell populations obtained with FlowSOM as in Figure 1.
(C) UMAPs generated as in (A) stratified by disease and showing cells colored according to the 15 cell populations obtained with FlowSOM and characterized in (B); red circles highlight TRM cell clusters.
(D) Cumulative data showing the relative abundance of CD8+CD69+CD103+TRM cell clusters from (B), identified by co-expression of CD69 and CD103, in patients with PsA (red) and RA (blue). Boxplots show median ± IQR; data analyzed by GLMMs and p <0.05 reported.
(E) Heatmap of the median marker intensities of the 33 markers across the 5 TRM cell populations from (B). MEM labels (boxed) listed for each of the 5 CD8+CD69+CD103+ TRM cell populations as described in Figure 2.
scRNA-seq analysis defines two distinct signatures for synovial CD8+CD69+CD103+ TRM cells in patients with PsA
Our analysis thus far revealed that multiple populations of CD8+CD69+CD103+ TRM cells are enriched in the SF of patients with PsA, with distinct phenotypes and expression of effector and cytotoxic molecules. To analyze these cells in greater detail, we performed scRNA-seq of PsA synovial CD8+ T cells (n = 4; Table 1 for demographic and clinical information, and Table S1 for cell and VDJ recoveries). Cells were labeled with CITE-Seq antibodies to allow for integration of cellular protein and transcriptome measurements of TRM cell markers. This approach confirmed our CyTOF data that while the majority of the synovial CD8+ T cells expressed CD69 at both the gene and protein levels, only a limited fraction of the cells expressed CD103 (Figure 4A).
Figure 4.

scRNA-seq analysis defined a distinct signature for TRM populations in the synovial fluid of patients with PsA
SFMC samples from patients with PsA (n = 4) were sequenced independently using the 10× protocol.
(A) UMAPs showing cell protein (top row) and gene (bottom row) expression levels of CD69 (left) and CD103 (right) in CD8+ T cells from patients with PsA.
(B) UMAP showing cells colored according to the 18 populations obtained after Seurat clustering.
(C) Violin plots showing cell protein (top row) and gene (bottom row) expression levels of CD69 (left) and CD103 (right) in the 18 Seurat clusters.
(D) GSEA plots for lung CD8+ TRM signature, comparing clusters 4 (left), 6 (middle), and 13 (right) with all other clusters; n = 4 per group. Normalized enrichment score (NES) and multiple test-adjusted q value from GSEA are shown.
(E) Dotplot showing either protein or gene expression of signature markers that defined distinct TRM populations by CyTOF, across the identified 3 CD69+CD103+ clusters from (C). Dotplot heatmap showing the average expression (color) and percentage of cells (size) expressing the indicated genes or proteins.
(F) Volcano plots showing significant genes differentially expressed in cluster 4 (left) or 6 (right) compared with all other clusters. Differentially expressed genes were calculated using Wilcoxon rank-sum tests using the FindMarkers function in Seurat and shown in blue (q < 0.05) or red (q < 0.05 with a 1.2-fold change).
(G) Heatmap showing the normalized average expression of top 30 upregulated and downregulated genes (q < 0.05) in cluster 6 compared with cluster 4.
(H and I) GSEA plots comparing cluster 4 with cluster 6 for PsA synovial fluid (SF) CD8+HLA-DRhi signature (H) and cluster 6 with cluster 4 for psoriatic skin Tc17 and skin CD8+CD49− TRM signatures (I); n = 4 per group.
Cell population identification by Seurat clustering resolved the CD8+ T cells into 18 distinct clusters (Figure 4B), similarly represented in all the donors (Figures S3A–S3C) and defined by differentially expressed genes (Figure S4 and Table S2). Clusters 4, 6, and 13 were identified as CD8+ TRM populations based on matched gene and protein co-expression for CD69 and CD103 (Figure 4C). However, while clusters 4 and 6 showed a significant positive enrichment for a human TRM cell signature15 when compared with all other clusters, cluster 13 did not show the same significant enrichment (Figure 4D). Considering that cluster 13 also showed lower expression for CD103 (Figure 4C), we hypothesized that cluster 13 contained a proportion of TRM cells, without these, however, being a distinct population. In addition, clusters 2, 3, 9, 12, 15, and 17, while negative for CD103, expressed CD69 in combination with significant upregulation of at least one other marker associated with tissue residency (CXCR6, CD49a, CD101, and PD-1), low expression of markers required for tissue egress (CD62L, S1PR1, and KLF2), and +/− low expression of CX3CR1 (Figure S3D), thus raising the possibility that they could represent CD103− TRM cell populations. However, clusters 2, 15, and 17 were identified as mucosal-associated invariant T (MAIT) cells (based upon upregulated expression of TRAV1-2; Table S2), and clusters 3, 9, and 12 were not significantly enriched for the human TRM cell signature15 (Figure S3E).
To further characterize the CD8+CD69+CD103+ TRM clusters, we interrogated the scRNA-seq dataset for the signatures identified by our CyTOF MEM analysis (Figure 2B). This revealed that cluster 4 showed a signature comparable to the cytotoxic effector TRM cells, as indicated by expression of PRF1, GZMA, and GZMB, while cluster 6 possessed a type 17-like TRM profile with expression of CD161 and CCR6 (Figure 4E). Cluster 13 showed a similar cytotoxic profile to cluster 4 but with high expression for MKI67, suggesting that these cells were highly proliferating. This was confirmed by a functional enrichment analysis showing highly significant enrichment for mitotic and cell cycle gene sets (Figure S5A). Since TRM cells are typically shown to be non-cycling,15 these data supported our hypothesis that, while containing a small proportion of TRM cells, cluster 13 consisted mostly of cycling cells.
We performed differential gene expression analysis of each TRM cluster compared to all other clusters (TRM and CD8+CD103− T cells). This further defined a specific signature for cluster 4 characterized by high expression (q < 0.05) of multiple cytotoxicity-associated genes including GZMA, GZMB, GZMH, GZMK, NKG7, and PRF1 together with TRM canonical genes ITGAE (which encodes CD103), PDCD1, LAG3, and CTLA4 (upregulated) and SELL, KLF2, and KLF3 (downregulated). Cluster 6 instead showed a type 17-like signature with upregulation (q < 0.05) of canonical type 17 genes including KLRB1, RORA, AHR, BATF, and CCR6, together with the same TRM canonical genes found differentially expressed in cluster 4 but with the addition of S1PR1 and EOMES (downregulated) and CXCR6 and ZNF683 (upregulated) (Figure 4F; Table S3). Furthermore, although the expression of most cytokine genes was low due to lack of prior activation with either anti-CD3/CD28 monoclonal antibody (mAb) or PMA/ionomycin stimulation, we found that the few cells expressing typical type 17-related genes IL17A, IL21, and IL26 were enriched in cluster 6 (Figure S5B). Genes encoding for CXCL13, ALOX5AP, and LGALS1 were among the most differentially upregulated genes (fold change [FC] > 1.5 and q < 0.05) in both TRM clusters when compared with all other clusters (Figure 4F). Functional enrichment analysis validated our classification by revealing significant enrichment for multiple cytotoxicity gene sets in cluster 4 and type 17 cell signature gene sets in cluster 6, together with ones associated with immune responses and T cell activation, which were shared by both TRM clusters (Figure S5C).
To evaluate specific differences in the transcriptomic signatures between the two TRM populations, we performed pairwise differential gene expression analyses between clusters 4 and 6. We identified distinct signatures, which matched with the TRM profiles we obtained from our CyTOF data: cluster 4 showed a signature matching the cytotoxic effector profile characterized by significantly higher expression of perforin and granzymes as well the transcription factor Eomes, while cluster 6 matched the CD161+CCR6+ type 17-like TRM cell population (Figures 4G, S5D; Table S3). Furthermore, when comparing the TRM clusters, we found that cluster 4 was significantly enriched for a signature of SF CD8+HLA-DRhi cells (Figure 4H), a population previously described in patients with PsA, which, despite not expressing ITGAE in that study, was also shown to have high expression of multiple HLA genes.27 Conversely, cluster 6 showed a highly significant positive enrichment for a signature of ITGAE-expressing Tc17 cells found in psoriatic skin28 and for skin CD8+CD49a− TRM cells, which also have a type 17 phenotype and are enriched in psoriatic skin14 (Figure 4I). This suggested that the population of type 17-like TRM cells we identified in PsA SF showed similar characteristics to TRM cells found in the skin, both in health and disease. Recent studies in mice have reported that TRM cells from different tissues exhibit differential requirements for TGFβ signaling for differentiation and functionality.23 Cluster 6, but not cluster 4, was significantly enriched for signatures of ex vivo TGFβ-stimulated human CD8+ T cells29 (Figure S5E), and both TGFβ1 and TGFβR2 were modestly but significantly upregulated in cluster 6 compared with cluster 4 (Table S3), suggesting activation of the TGFβ signaling pathway in type 17-like but not cytotoxic synovial TRM cells in PsA.
Synovial CD8+CD69+CD103+ TRM cells from patients with PsA are polyclonal and show little clonal similarity to CD8+CD103− T cells
To assess the clonality of synovial CD8+CD69+CD103+ TRM cells in patients with PsA and determine whether the TCR repertoire was shared between these TRM and CD8+CD103− T cells, we used VDJ sequencing and mapped paired α/β-chain TCR sequences to gene expression for the same cells. We calculated the inverse Pielou clonality score for clusters that had at least 100 cells with paired gene expression and TCR sequences from each donor and found that all of these clusters were similarly polyclonal, as indicated by a low score (Figure 5A). We next calculated the Morisita similarity index to measure TCR composition overlap between the different clusters and found that in every donor, only a few clusters showed a degree of repertoire overlap, i.e., a Morisita similarity index score >0.4 (Figure S6A). While cluster 4 showed a modest degree of clonal overlap (median Morisita score > 0.4) with the CD8+CD103− T cell clusters 1, 7, and 12, cluster 6 displayed very limited repertoire sharing with either the other CD8+CD103− clusters or TRM cluster 4 (Figures 5B and 5C). Clonotype analysis further confirmed that while cluster 4 shared a proportion of its top 10 clones with the CD8+CD103− T cell clusters 1, 7, and 12 (consistent with the higher Morisita score), cluster 6 showed little sharing, indicating a more distinct repertoire (Figure 5D). Increased clonotype similarity between TRM cluster 4 and CD8+CD103− T cell clusters 1, 7, and 12 was associated with similar gene signatures characterized by high expression of cytotoxic markers including multiple HLAs and granzymes (Figure S6B). Taken together, these data demonstrate that SF-derived CD8+ T cells from patients with PsA generally display a polyclonal repertoire with a more distinct repertoire for type 17-like TRM cells.
Figure 5.

Limited clonal overlap in synovial CD8+ T cells from patients with PsA
(A) Cumulative data showing the inverse Pielou clonality score in every cluster from Figure 4B, which contains >100 TCR sequences for each donor (n = 4); Inverse Pielou score ranges from 0, which indicates a highly polyclonal population, to 1, which indicates a monoclonal population; boxplots show median ± IQR.
(B) Cumulative data showing the Morisita scores for cluster 4 (left) or 6 (right) compared with other clusters (n = 4); boxplots show median ± IQR; discretionary dotted line was drawn at score = 0.4 for comparison of scores.
(C) Cumulative data showing the Morisita scores for comparisons of TRM clusters repertoires and of each TRM cluster with CD8+CD103− T cell clusters (n = 4); boxplots show median ± IQR.
(D) Representative alluvial plots showing the proportion of the top 10 clones shared between clusters; alluvials connecting clusters are colored according to shared clones.
Synovial CD8+CD103− T cells of patients with PsA also show a prevalent type 17-like phenotype
Finally, we sought to explore whether we could find differences among the synovial CD8+CD103− T cell subsets in our patient cohorts using our CyTOF data. Among the clusters identified by FlowSOM and ConsensusClusterPlus from Figure 1C, we found that within CD8+CD103− T cells, clusters 9 and 10 were significantly enriched in patients with PsA, while cluster 2 was significantly enriched in patients with RA (Figure 6A). Within CD4+CD103− T cells, clusters 1 and 4 were significantly enriched in patients with PsA, while clusters 5, 6, and 9 were significantly enriched in patients with RA (Figure 6B).
Figure 6.

Enrichment of conventional type 17 CD8+ T cells in the SF of patients with PsA
(A and B) Cumulative data showing the relative abundance of CD8+ (A) and CD4+ (B) CD103− T cell clusters from Figure 1C in patients with PsA (n = 8, red) or RA (n = 5, blue). Boxplots show median ± IQR; data analyzed by GLMMs and p <0.05 reported.
(C and D) Heatmap and MEM modeling of the median marker intensities of the 32 markers across the significantly enriched (in either PsA or RA) CD8+CD103− (C) or CD4+CD103− (D) cell populations from (A and B). Heatmap and MEM details as described in Figures 1 and 2.
MEM analysis of CD8+CD103− T cells in PsA-enriched clusters 9 and 10 revealed a similar type 17-like signature characterized by CD161, CD127, and CCR6 enrichment (Figure 6C); however, in cluster 9, there was specific enrichment for TCRVα7.2, identifying this cluster as MAIT cells, while cluster 10 resembled the IL-17A-expressing cluster 14 in Figure 3B and was therefore identified as conventional Tc17 cells. Conversely, cluster 2, enriched in patients with RA, showed Eomes, perforin, granzyme B, and CD127 enrichment, indicating a signature for cytotoxic effector cells. These data indicate that also in the CD8+CD103− T cells, there is a type 17-enriched CD8+ T cell signature in patients with PsA compared with a cytotoxic CD8+ T cell profile in RA.
MEM analysis of CD4+CD103− T cells in PsA-enriched clusters 1 and 4 revealed two distinct signatures. Cluster 1 showed positive enrichment for CD25, FoxP3, and Helios and negative enrichment for CD127, suggesting a Treg signature. Cluster 4 showed a Th17-like signature characterized by positive enrichment for CD161, CD127, and CCR6 (Figure 6D). Conversely, the RA-enriched clusters 5 and 6 showed similar signatures characterized by the enrichment for activation and proliferation markers CD25 and Ki67, granzymes A and B, CD161, CXCR6, and T-bet, with cluster 6 also enriched for CD49a and CD101. Finally, RA-enriched cluster 9 represented actively proliferating cells as demonstrated by the enrichment for Ki67 (Figure 6D).
In line with our findings when analyzing the phenotype of the TRM cell populations, we found only minor phenotypic differences in the CD8+CD103− and CD4+CD103− populations between patients with PsA or RA (Figures S7A and S7B). Taken together, these data demonstrate significant differences in the cellular composition of synovial T cells in patients with PsA versus RA, with evidence of a significant enrichment of both CD8+CD103+ TRM and CD8+CD103− T cell subsets with a predominant type 17-like signature in patients with PsA.
Discussion
The high-dimensional immune profiling study presented here deeply phenotyped in parallel synovial CD8+ and CD4+ CD69+CD103+ TRM cells in two rheumatic diseases and identified them as a heterogeneous population characterized by multiple distinct phenotypes and functions.
It was previously reported that CD8+ TRM cells, despite sharing a core transcriptional signature, exhibit both inter- and intra-organ heterogeneity and can differ in terms of CD103 expression, cytokine production, cytotoxic potential, proliferative capacity, metabolism, and commitment to tissue residency.8,14,23,30,31,32 Our CyTOF analysis revealed a type 17-like CD8+CD69+CD103+ TRM cell population (cluster 12) that was found at a higher frequency in the joints of patients with PsA and was virtually absent in patients with RA. This cluster showed a classical type 17 phenotype, characterized by the expression of CD161 and CCR6, together with high expression of CXCR6, but no markers of cytotoxicity. When we phenotyped the cells after PMA/ionomycin stimulation to assess cytokine production, we were able to identify an equivalent type 17-like TRM cell population (cluster 15), characterized by expression of both IL-17A and IFNγ. Additionally, we found two more clusters (9 and 13) with similar type 17-like profiles, including high CD161 expression, which identifies IL-17-producing cells,33 but with different combinations of cytokines; this difference might be attributed to the stochastic nature of cytokine expression or represent a different functional stage of type 17-like TRM cells captured in response to PMA/ionomycin stimulation. Nonetheless, all three clusters were found significantly enriched in patients with PsA, suggesting that these clusters represent different fates or states of type 17-like TRM cells. These findings are consistent with previous work by us and others showing that Tc17/TRM cells in PsA are polyfunctional and able to produce multiple cytokines, which drive PsA inflammation.21,34 scRNA-seq validated the presence of a distinct population of type 17-like CD8+CD69+CD103+ TRM cells in PsA SF (cluster 6) and defined a unique gene signature for these cells that set them apart from other TRM cells with significant upregulation of canonical type 17 signature genes including KLRB1, RORA, AHR, BATF, and CCR6 as well as expression of IL17A, IL21, and IL26. The type 17-like signature, including the ability to produce IL-17A and other inflammatory cytokines, low cytotoxicity, and a distinct TCR repertoire compared with other TRM and CD8+CD103− T cells all point to this being a unique population of TRM cells with a discrete function.
Our scRNA-seq analysis also suggested striking similarities between type 17-like synovial TRM cells in PsA and TRM cells from the skin including (1) common expression of specific metabolic genes including BHLHE40 that is upregulated in IL-17-producing TRM cells in human psoriatic skin28; (2) an enrichment for signatures of ITGAE+ type 17 TRM cells from psoriatic lesions28 and of CD49a− TRM cells that are enriched in psoriatic lesions14; and (3) a specific enrichment in the type 17 (cluster 6), but not cytotoxic (cluster 4), TRM cells for a signature of TGFβ stimulation, which has been shown to be required for the differentiation and maintenance of TRM cells in mice skin. Thus, the specific enrichment of type 17-like TRM cells in the SF of patients with PsA and their similarity to TRM cells from the skin in psoriasis point to a specific role for type 17 TRM cells in PsA. In this context, it is interesting to note that in psoriasis, IL-17-producing resident T cells were shown to persist in “normal” skin at the sites of healed psoriasis at frequencies that inversely correlated with time to relapse in patients who stopped treatment.35,36 Thus, it was hypothesized that skin-resident IL-17-producing TRM cells may drive relapses in psoriasis. One could speculate that the synovial type 17 TRM cells we describe in the current study may have a similar role in driving joint flares in PsA.
Our study also identified cytotoxic CD8+ TRM cells in the inflamed joint present at similar levels in both PsA and RA. CyTOF analysis identified three populations of CD8+ cytotoxic TRM cells (clusters 8, 14, and 15) characterized by high expression of granzyme A, granzyme B, and perforin, together with Eomes and PD1, indicating a cytotoxic effector profile. However, despite this segmentation into multiple clusters due to differences in expression of markers including CD101 and CD49a, stimulation with PMA/ionomycin revealed that these cells uniformly responded by secreting high levels of IFNγ; this suggested a specialized function of these cells despite phenotypic heterogeneity. Indeed, our scRNA-seq analysis identified a single signature for cytotoxic TRM cells (cluster 4) that resembled a previously described PsA SF-derived CD8+HLA-DRhi T cell population.27 While in that study, ITGAE was not found to be differentially expressed in any of the CD8+ T cell clusters (the authors did not include CITE-Seq antibodies for CD103), our gene set enrichment analysis (GSEA) showed a significant positive enrichment for this HLA class II-associated gene signature in our cytotoxic CD103+ and ITGAE+ TRM cell population. Furthermore, a similar HLA class II signature has been identified in highly cytotoxic, IFNγ-producing CD8+ T cells from the peripheral blood of healthy volunteers,37 which also expressed high levels of CCL5, similarly to cluster 4 TRM cells. Together with their polyclonal nature as well as their TCR sharing with other cytotoxic non-TRM cell populations, these data suggest a specialized cytotoxic effector function for cluster 4 TRM cells.
The commonly used core signature of TRM cells (e.g., CD103, CD69, CXCR6, PD-1, CD49a, and CD101) may not accurately reflect the heterogeneity within TRM cells at different tissue sites or identify potential TRM subset-specific associations to pathological conditions. Our data show that cytotoxic and type 17-like TRM cells differ in terms of cytokine production, cytotoxic potential, and TGFβ “priming.” The gene signatures for cytotoxic and type 17-like TRM cells defined in this study may allow for improved TRM cell population segmentation within tissues and thus help identify changes in TRM cell composition at different sites and in different diseases for future studies.
Our CyTOF analysis also identified a Treg-like CD8+ TRM population (cluster 13) that was present at low frequencies in both PsA and RA. This TRM cell population expressed all the markers that are associated with CD4+ Treg cells including high levels of CD25, Foxp3, and Helios as well as low CD127; we, however, also detected expression of CD161 and CCR6, albeit at low levels, which suggests a type 17 profile. We and others have previously characterized a distinct population of human CD4+ Treg cells with similarly unique type 17-like characteristics and functions, which we found enriched in the SF of patients with RA as well as in the lamina propria of patients with Crohn’s disease.38,39,40,41 Furthermore, a recent scRNA-seq study has described a population of synovial CD8+CD161+ Treg cells with a distinct molecular signature in patients with PsA.42 Our data show that this CD8+ Treg-like population harbors various markers of TRM cells, suggesting that these cells may persist in the synovial joints of patients with PsA and RA. It remains to be established whether these cells possess the same functional characteristics as their CD4+ counterparts, an issue that is challenging to address given their low frequency in the SF and therefore their absence in our scRNA-seq data. However, based on their type 17-like signature and similarity to their CD4+ counterparts, one could hypothesize that these cells are specialized to specifically suppress local type 17 responses, as was previously shown for CD4+ Treg cells in mice.43
Contrary to our initial hypothesis, we did not detect major qualitative differences in the phenotypes of the CD8+ and CD4+ TRM cell populations between PsA and RA. This suggests that synovial T cells in these two diseases may differ more in terms of the composition and frequency of specific subsets rather than in their phenotypes. In addition, and concordant with previous work,21,22,44,45 we found that within CD103− T cells in PsA SF, CD8+ MAIT cells and conventional Tc17-like (CD8+CD161+CCR6+) cells were significantly enriched, as well as CD4+ Treg and Th17-like (CD4+CD161+CCR6+) cells, while cytotoxic CD8+ and cytotoxic/proliferative CD4+ T cells were significantly enhanced in RA. Taken together, these data reveal significant quantitative differences in certain CD8+ and CD4+ T cell populations between PsA and RA.
To conclude, we have characterized three distinct CD8+CD69+CD103+ TRM cell populations within the inflamed arthritic joint: cytotoxic and Treg-like TRM cells, which are present in the synovial joint of patients with both PsA and RA, while type 17-like TRM cells, as well as type 17-like CD8+CD103− T cells, are specifically enriched in the synovial joint of patients with PsA. These data extend our previous findings21 and shed light on a potential underlying cause for the difference in clinical efficacy of IL-17A blockade in PsA versus RA46: a significantly larger fraction of IL-17A-secreting tissue-resident and non-resident CD8+ T cells within the synovial PsA joint may contribute to a larger, and perhaps a more unique, extent to the immunopathology and persistence of this disease.
Limitations of the study
One limitation of our study is the patient heterogeneity. While no significant bias or association due to patient clinical parameters, sex/gender, age, disease duration, or treatment strategy was observed in the data analysis, we cannot draw definitive conclusions in this regard due to the relatively small sample sizes.
In this study, we focused on TRM cells that were defined by expression of CD69 and CD103 and enriched for a signature of TRM cells from homeostatic human tissue.15 It is known that in certain organs, for example the liver, the majority of TRM cells do not express CD103,47,48 and therefore these TRM cells are defined by CD69 expression. However, while CD69 is considered an effective marker of tissue residency in the homeostatic state and is constitutively expressed by TRM cells from all tissues, it is also an activation marker. As such, on its own, CD69 is not a reliable marker of tissue residency in inflamed tissue. This is supported by our finding that most synovial T cells from inflamed joints expressed CD69 at the protein and mRNA levels. We identified several clusters of CD69+CD103− TRM cells in our datasets that expressed other markers associated with a TRM cell phenotype but were not enriched for a TRM signature. In the absence of consensus markers for CD103− TRM cells in inflamed human tissue, we did not classify these cells as tissue-resident T cells and referred to these cells as CD103− T cells instead.
STAR★Methods
Key resources table
| REAGENT or RESOURCE | SOURCE | IDENTIFIER |
|---|---|---|
| Antibodies | ||
| Anti-human CD45 (HI30)-89Y (panel I & II) | Standard Biotools | Cat#3089003B; RRID: AB_2661851 |
| Purified anti-Human CD3 (Maxpar® Ready) Antibody (panel I & II; −116Cd) | BioLegend | Cat#300443; RRID: AB_2562808 |
| Anti-Human CD196/CCR6 (G034E3)-141Pr (panel I) | Standard Biotools | Cat#3141003A; RRID: AB_2687639 |
| Anti-Human CD45RA (HI100)-143ND (panel I & II) | Standard Biotools | Cat#3143006B; RRID: AB_2651156 |
| Anti-Human CD69 (FN50)-144ND (panel I & II) | Standard Biotools | Cat#3144018B; RRID: AB_2687849 |
| Anti-Human CD4 (RPA-T4)-145ND (panel I & II) | Standard Biotools | Cat#3145001B; RRID: AB_2661789 |
| Anti-Human CD8 (RPA-T8)-146ND (panel I & II) | Standard Biotools | Cat#3146001B; RRID: AB_2687641 |
| Purified anti-Human CD107a (LAMP-1) (Maxpar® Ready) Antibody (panel I; −147Sm) | BioLegend | Cat#328635; RRID AB_2563708 |
| Anti-Human S1P1 Monoclonal Antibody (2B9) (panel I; −148ND) | Invitrogen | Cat#MA5-28123; RRID: AB_2745106 |
| Anti-Human CD194/CCR4 (L291H4)-149Sm (panel I) | Standard Biotools | Cat#3149029A |
| Purified anti-Human CD355 (CRTAM) Antibody (panel I; −150ND) | BioLegend | Cat#339102; RRID: AB_1501238 |
| Anti-Human CD103 (Ber-ACT8)-151Eu (panel I & II) | Standard Biotools | Cat#3151011B; RRID: AB_2756418 |
| Anti-Human TCRgd (11F2)-152Sm (panel I & II) | Standard Biotools | Cat#3152008B; RRID: AB_2687643 |
| Anti-Human TCR Va7.2 (3C10)-153Eu (panel I & II) | Standard Biotools | Cat# 3153024B; RRID: AB_2891190 |
| Purified anti-Human CD294 (CRTH2) Antibody (panel I & II; −154Sm) | BioLegend | Cat#350102; RRID: AB_10639863 |
| Purified anti-mouse/Human Helios Antibody (panel I & II; −155Gd) | BioLegend | Cat#137202; RRID: AB_10900638 |
| Anti-Human CD183/CXCR3 (G025H7)-156Gd (panel I & II) | Standard Biotools | Cat#3156004B; RRID: AB_2687646 |
| Anti-Human CD101 (BB27)-158Gd (panel I) | Standard Biotools | Cat#3158020B |
| Anti-Human CD197/CCR7 (G043H7)-159Tb (panel I & II) | Standard Biotools | Cat#3159003A; RRID: AB_2714155 |
| Anti-Human CD186/CXCR6 (K041E5)-160Gd (panel I & II) | Standard Biotools | Cat#3160016B |
| Anti-Human/Mouse Tbet (4B10)-161Dy (panel I & II) | Standard Biotools | Cat#3161014B; RRID: AB_2858233 |
| Anti-Human Foxp3 (PCH101)-162Dy (panel I & II) | Standard Biotools | Cat#3162011A; RRID: AB_2687650 |
| Purified anti-mouse/rat/Human FOXP3 Antibody (150D) (panel I & II; −162Dy) | BioLegend | Cat#320002; RRID: AB_439746 |
| Anti-Human Foxp3 (259D)-162Dy (panel I & II) | Standard Biotools | Cat#3162024A |
| Anti-Human CD49a/Integrin α1 (TS2/7)-163Dy (panel I) | Standard Biotools | Cat#3163015B; RRID: AB_2893061 |
| Anti-Human CD161 (HP-3G10)-164Dy (panel I & II) | Standard Biotools | Cat#3164009B; RRID: AB_2687651 |
| Anti-Human CD45RO (UCHL1)-165Ho (panel I & II) | Standard Biotools | Cat#3165011B; RRID: AB_2756423 |
| Purified anti-Human Granzyme A Antibody (panel 1; −166Er) | BioLegend | Cat#507202; RRID: AB_315468 |
| Anti-Human/Mouse GATA3 (TWAJ)-167Er (panel I & II) | Standard Biotools | Cat#3167007A; RRID: AB_2927569 |
| Purified anti-Human TCR Vα24-Jα18 (iNKT cell) Antibody (panel I; −168Er & panel II; −171Yb) | Standard Biotools | Cat#342902; RRID: AB_2229301 |
| Anti-Human CD25 (2A3)-169Tm (panel I & II) | Standard Biotools | Cat#3169003B; RRID: AB_2661806 |
| Purified anti-Human CD25 Antibody (panel I & II; −169Tm) | BioLegend | Cat#356102; RRID: AB_2561752 |
| EOMES Monoclonal Antibody (WD1928) (panel I & II; −170Er) | ThermoFisher | Cat#14-4877-82; RRID: AB_2572882 |
| Anti-Human Granzyme B (GB11)-171Yb (panel I) | Standard Biotools | Cat#3171002B; RRID: AB_2687652 |
| Anti-Human Ki-67 (B56)-172Yb (panel I) | Standard Biotools | Cat#3172024B; RRID: AB_2858243 |
| Anti-Human CD184/CXCR4 (12G5)-173Yb (panel I) | Standard Biotools | Cat#3173001B |
| Anti-Human CD279/PD-1 (EH12.2H7)-174Yb (panel I & II) | Standard Biotools | Cat#3174020B; RRID: AB_2868402 |
| Anti-Human Perforin (B-D48)-175Lu (panel I) | Standard Biotools | Cat#3175004B; RRID: AB_2895147 |
| Anti-Human CD127/IL-7Ra (A019D5)-176Yb (panel I & II) | Standard Biotools | Cat#3176004B; RRID: AB_2687863 |
| Purified anti-TCF1 (TCF7) Antibody (panel II; −141Pr) | BioLegend | Cat#655202; RRID: AB_2562103 |
| Anti-Human IL-4 (MP4-25D2)-142ND (panel II) | Standard Biotools | Cat#3142002B |
| Anti-Human IL-6 (MQ2-13A5)-147Sm (panel II) | Standard Biotools | Cat#3147002B |
| Anti-Human IL-17A (BL168)-148ND (panel II) | Standard Biotools | Cat#3148008B |
| Ultra-LEAF™ Purified anti-Human GM-CSF Antibody (panel II; −149Sm) | BioLegend | Cat#502319; RRID: AB_2814393 |
| Anti-Human IL-22 (22URTI)-150ND (panel II) | Standard Biotools | Cat#3150007B; RRID: AB_2810972 |
| Anti-Human IL-2 (MQ1-17H12)-158Gd (panel II) | Standard Biotools | Cat#3158007B; RRID: AB_2864735 |
| Anti-Human TGFbeta (TW4-6H10)-163Dy (panel II) | Standard Biotools | Cat#3163010B |
| Anti-Human IL-10 (JES3-9D7)-166Er (panel II) | Standard Biotools | Cat#3166008B |
| Anti-Human IFNg (B27)-168Er (panel II) | Standard Biotools | Cat#3168005B; RRID: AB_2895146 |
| Anti-Human IL-21 (3A3-N2)-172Yb (panel II) | Standard Biotools | Cat#3172011B; RRID: AB_2810975 |
| Purified anti-Human IL-17F (LN2-9C4) Antibody (panel II; −173Yb) | Miltenyi Biotech | Custom |
| Anti-Human TNFa (Mab11)-175Lu (panel II) | Standard Biotools | Cat#3175023B |
| TotalSeq™-C0944 anti-Human CD101 (BB27) | BioLegend | Cat#331017; RRID: AB_2832651 |
| TotalSeq™-C0145 anti-Human CD103 (Integrin αE) (Ber-ACT8) | BioLegend | Cat#350233; RRID: AB_2800933 |
| TotalSeq™-C0149 anti-Human CD161 (HP-3G10) | BioLegend | Cat#339947; RRID: AB_2810532 |
| TotalSeq™-C0804 anti-Human CD186/CXCR6 (K041E5) | BioLegend | Cat#356023; RRID: AB_2876677 |
| TotalSeq™-C0143 anti-Human CD196/CCR6 (G034E3) | BioLegend | Cat#353440; RRID AB_2810563 |
| TotalSeq™-C0154 anti-Human CD27 (O323) | BioLegend | Cat#302853; RRID: AB_2800747 |
| TotalSeq™-C0088 anti-Human CD279/PD-1 (EH12.2H7) | BioLegend | Cat#329963; RRID: AB_2800747 |
| TotalSeq™-C0063 anti-Human CD45RA(HI100) | BioLegend | Cat#304163; RRID: AB_2800764 |
| TotalSeq™-C0575 anti-Human CD49a (TS2/7) | BioLegend | Cat#328319; RRID: AB_2832644 |
| TotalSeq™-C0147 anti-Human CD62L (DREG-56) | BioLegend | Cat#304851; RRID:AB_2800770 |
| TotalSeq™-C0146 anti-Human CD69 (FN50) | BioLegend | Cat#310951; RRID: AB_2800810 |
| TotalSeq™-C0179 anti-Human CX3CR1 (K0124E1) | BioLegend | Cat#355705; RRID: AB_2800960 |
| Anti-Human CD3 (UCHT1) PE-Cy7 | BioLegend | Cat#300419; RRID: AB_439781 |
| Anti-Human CD4 (SK3) PerCP-Cy5.5 | BioLegend | Cat#344607; RRID: AB_1953236 |
| Anti-Human CD8 (HIT8a) FITC | BioLegend | Cat#344703; RRID: AB_314110 |
| Anti-Human CD14 (REA599) APCVio770 | Miltenyi Biotech | Cat#130-110-522; RRID: AB_2655063 |
| Chemicals, Peptides, and Recombinant Proteins | ||
| DAPI DNA stain | Invitrogen | Cat#D1306 |
| EQ Element Calibration Beads | Fluidigm | Cat#201078 |
| Foxp3/Transcription Factor Staining Buffer Set | eBioscience | Cat#00-5523-00 |
| GolgiStop™ Protein Transport Inhibitor | BD Biosciences | CAT#554724 |
| Ionomycin | Sigma-Aldrich | CAT#I9657 |
| Iridium (Ir) nucleic acid intercalator | Fluidigm | Cat#201192B |
| Maxpar® Cell Acquisition Solution (CAS) | Fluidigm | Cat#201244 |
| Phorbol 12-myristate 13-acetate (PMA) | Sigma-Aldrich | CAT#P8139 |
| Rhodium (103Rh)-intercalator | Fluidigm | Cat#201103A |
| TruStain FcX™ (Fc Receptor Blocking Solution) | BioLegend | Cat#422301 |
| Critical Commercial Assays | ||
| Dead Cell Removal Kit | Miltenyi Biotec | Cat#130-090-101 |
| REAlease® CD3 MicroBead Kit, Human | Miltenyi Biotec | Cat#130-117-038 |
| Chromium Next GEM Single Cell 5′ Kit v2 | 10x Genomics | Cat#1000263 |
| Chromium Next GEM Chip K Single Cell Kit | 10x Genomics | Cat#1000287 |
| Chromium Single Cell Human TCR Amplification Kit | 10x Genomics | Cat#1000252 |
| Dual Index Kit TT Set A | 10x Genomics | Cat#1000215 |
| Dual Index Kit TN Set A | 10x Genomics | Cat#1000250 |
| Library Construction Kit | 10x Genomics | Cat#1000190 |
| 5′ Feature Barcode Kit | 10x Genomics | Cat#1000256 |
| Deposited Data | ||
| scRNAseq data files | GEO | GSE216914 |
| Software and Algorithms | ||
| NormalizerR normalization software | Finck et al.49 | N/A |
| CATALYST pipeline | Nowicka et al.24 | N/A |
| CellRanger v6.1.1 | 10x Genomics | N/A |
| Seurat 4.1.1 | Satija Lab | N/A |
| scRepertoire 1.7.2 | Borcherding et al.50 | N/A |
| GSEA version 4.2.3 | Subramanian et al.51 | N/A |
| gprofiler2 | Kolberg et al.52; Raudvere et al.53 | N/A |
Resource availability
Lead contact
Further information and requests for resources and reagents should be directed to and will be fulfilled by the lead contact, Professor Leonie Taams (she/her) (leonie.taams@kcl.ac.uk).
Materials availability
This study did not generate new unique reagents.
Experimental model and subject details
Participant recruitment and ethical approval
Synovial fluid (SF) samples were obtained from 8 patients with Psoriatic Arthritis (PsA; 4 males and 4 females, 25 to 71 years old) and 5 Rheumatoid Arthritis (RA; 1 male and 4 females, 41 to 74 years old) recruited from Guy’s Hospital Rheumatology Department, with written informed consent from all participants. The study was approved by the Bromley Research Ethics Committee (06/Q0705/20) and Harrow Research Ethics Committee (17/LO/1940). Patient demographics and clinical information for samples included for CyTOF and scRNAseq is available in Table 1.
Method details
Cell isolation
SF mononuclear cells (SFMC) were isolated from synovial fluid by conventional density gradient centrifugation using Lymphoprep™ (Axis-Shield, Oslo, Norway). Cells were cryopreserved in culture medium containing 90% FCS (Gibco, Invitrogen, UK) and 10% DMSO (Fisher Scientific, Loughborough, UK) in liquid nitrogen until use.
CyTOF staining and sample acquisition
Upon thawing, dead cells were removed using the Dead Cell Removal kit and CD3+ T cells were isolated using the REAlease CD3 Microbead kit (both kits Miltenyi Biotec, Bergisch Gladbach, Germany) according to manufacturer’s guidelines. Purified CD3+ T-cells (3 x10⁶) were left unstimulated or were stimulated for 3 h with PMA (50 ng/mL), ionomycin (750 ng/mL, (Sigma-Aldrich, St. Louis, Missouri, United States) in the presence of GolgiStop (BD Biosciences, Franklin Lakes, New Jersey) to assess intracellular cytokine expression. Wash steps were performed at 1,200rpm for 10 min at room temperature (RT) unless otherwise stated. Details for both CyTOF antibody panels are listed in key resources table (panel I for samples without PMA/ionomycin stimulation; panel II for samples stimulated with PMA/ionomycin). After 3 h, cells were washed with PBS then stained with 1X rhodium (Rh)-intercalator (Fluidigm) in PBS for 15 min at RT for viability assessment. Next, cells were washed twice with cell staining medium (CSM, 0.5% BSA +0.02% NaN3 in PBS) before stained with extracellular antibodies for 30 min at RT. Cells were washed twice with CSM then fixed and permeabilised using the FoxP3/Transcription Factor Staining Buffer set (eBioscience, UK) according to manufacturer’s instructions. After washing with permeabilization buffer, cells were stained with intracellular and intranuclear markers for 30 min at 4°C (panel I unstimulated cells; panel II stimulated cells). Cells were washed with permeabilization buffer then stored overnight at 4°C resuspended in 125nM iridium (Ir)-intercalator in 4% paraformaldehyde (PFA). Samples were washed and resuspended in Maxpar CAS buffer (Fluidigm) with EQ Element Calibration Beads (Fluidigm) and acquired on a Helios mass cytometer (Fluidigm).
Cell sorting for single cell RNA sequencing
Cryopreserved SFMCs from four patients with PsA were thawed and 2x10⁶ SFMCs were stained for 30 min at 4°C with a combination of fluorescently labeled antibodies and Cellular Indexing of Transcriptomes and Epitopes by sequencing (CITE-Seq) antibodies in the presence of Fc receptor blocker. DAPI was added to samples immediately prior to sorting and live synovial CD8+ T cells were then FACS sorted using a FACSAria/LSRII and retained on ice ahead of library preparation.
Single cell library preparation and sequencing
20,000 FACS sorted synovial CD8+ T cells per patient were loaded for gene expression and immune profiling using the 10X Genomics Chromium Single Cell platform. Single cell libraries were created using the Chromium Single-Cell 5′ Reagent Kits v2. Libraries were sequenced on the NextSeq 2000 platform.
Quantification and statistical analysis
CyTOF data analysis
EQ Element Calibration Beads were used for signal normalization across sample FCS files using the MATLAB version of the NormalizerR normalization software.49 Live CD8+ and CD4+ T cells were gated and exported independently for downstream analysis using FlowJo software (v10). Data were analyzed using a customised version of the CATALYST pipeline.24 Uniform manifold approximation and projection (UMAP)s were generated based on the arcsinh-transformed expression of markers evaluated on the cells; the lowest cell number among the different donors was used as common threshold for UMAP generation. Populations were identified with FlowSOM after the metaclustering step with ConsensusClusterPlus with no downsampling. For quantification of contextual feature enrichment of the clusters identified by FlowSOM and ConsensusClusterPlus, marker enrichment modeling (MEM) was performed.25 For differential analysis of population abundances, a generalized linear mixed model (GLMM) within the CATALYST analysis pipeline was used. Additional statistical testing for CyTOF data was performed with GraphPad Prism v9.0 (GraphPad, San Diego, CA, USA) using the multiple Mann-Whitney test as indicated in figure legends.
Pre-processing of scRNAseq data
Raw reads were aligned to the human transcriptome and “multi” option of CellRanger software package (v6.1.1) with default parameters. Outputs from CellRanger were loaded into Seurat (v4.0.4). Cells with <500 or >3,000 genes, <500 or >15,000 UMIs, >5,000 ADT UMIs, expression of non-T cell markers (CD14+/CD19+) or >10% mitochondrial genes were filtered out. In addition, for cells where TCR sequencing data were available, multiplets were excluded by removal of cells expressing more than one TCRβ chain or more than two TCRα chains.
scRNAseq analysis
scRNAseq data analysis was performed using Seurat. After filtering, the four datasets were individually normalised using the SCTransform function (v2) with regression of the percentage of mitochondrial genes (RNA assays) and the NormalizeData and ScaleData functions (ADT assays) and then integrated.54,55,56 Dimensionality reduction was performed separately for the integrated SCT and integrated ADT assays with exclusion of TCR genes from the variable gene list. Weighted Nearest Neighbor (WNN) analysis57 was used to integrate RNA and protein expression, using 30 dimensions and 11 dimensions respectively, to construct a WNN graph. Clustering was then performed on the WNN of the integrated SCT and ADT assays using the FindClusters command with resolution 0.7 and visualised using UMAPs.58 Wilcoxon rank sum tests were performed to find differentially expressed genes in each cluster using the FindMarkers and FindAllMarkers functions in Seurat for scRNA-seq. Adjusted p-values <0.05 were considered statistically significant.
GSEA was performed using GSEA v4.2.351. Functional enrichment analysis of differential gene lists to identify significantly enriched biological functions and pathways was performed using the gost function in gprofiler252,53 using standard settings. Lung and spleen CD8+ TRM signature for GSEA was sourced from.15 Gene sets associated with human Th17 and CD8+CD161+ and MAIT cell signatures for gost function in gprofiler2 were obtained from59,60 respectively. Gene signature of in vitro TGFβ stimulated human CD8+ T cells was sourced from.29
Single cell TCR sequencing analysis
Diversity, Morisita and clone-sharing analysis was performed for clusters with >100 TCR sequences, for each donor, using the scRepertoire package in R60.
Acknowledgments
This study was supported by a Sanofi iAward (to G.A.M.P., B.W.K., and L.S.T.), a Versus Arthritis programme grant (ref. 21139 to L.S.T.), a KCL PhD studentship (to E.H.G.), an MRC clinical research training fellowship (ref MR/P018904/1 to L.E.D.), and the Department of Health via the National Institute for Health Research (NIHR) comprehensive Biomedical Research Centre (BRC) award to Guy’s & St. Thomas’ NHS Foundation Trust in partnership with KCL and King’s College Hospital NHS Foundation Trust. The views expressed are those of the author(s) and not necessarily those of the NHS, the NIHR, or the Department of Health.
Author contributions
L.S.T., K.J.A.S., B.W.K., G.A.M.P., and L.E.D. contributed to study conceptualization and design; G.A.M.P. and E.H.G. developed the CyTOF antibody panels and performed CyTOF and scRNA-seq wet-lab experiments; S.L. aided CyTOF staining and data acquisition; G.A.M.P. performed CyTOF data analysis; L.E.D. performed scRNA-seq analysis with bioinformatic support from S.K., P.D., M.J.P., and G.A.M.P. G.A.M.P., L.E.D., E.H.G., T.L., and L.S.T. interpreted the data; B.W.K. was responsible for patient recruitment; samples were processed and cataloged by S.E.R., S.L., and E.H.G.; G.A.M.P., L.E.D., E.H.G., and L.S.T. wrote the manuscript; and L.S.T. supervised the overall project. All of the authors reviewed and approved the final version of the manuscript.
Declaration of interests
This study was supported in part by a Sanofi iAward to G.A.M.P., B.W.K., and L.S.T. T.L. is an employee of Sanofi. L.S.T. has previously received speaker fees and/or research support from GSK, Novo Nordisk A/S, UCB, and Novartis, outside this work. B.W.K. has received research support from Eli-Lilly, Novartis, Roche Pharmaceuticals, and UCB Pharma and has been an advisor or received speaker fees from Eli-Lilly, Janssen, and Novartis, outside this work.
Published: May 16, 2023
Footnotes
Supplemental information can be found online at https://doi.org/10.1016/j.celrep.2023.112514.
Supplemental information
Cell recovery and VDJ recoveries for each of the 4 PsA patient synovial fluid CD8+ T cell samples after pre-processing and QC for scRNA-seq
Differentially expressed genes list for all 18 synovial CD8+ T cell clusters identified in PsA patients by scRNA-seq
Differentially expressed genes lists for comparative analyses of either cluster 4 (Sheet 1) or cluster 6 (Sheet 2) TRM cells compared with all other clusters or comparison of cluster 6 with cluster 4 (Sheet 3)
Data and code availability
-
•
According to UK research councils’ Common Principles on Data Policy, all single-cell RNA-seq data have been deposited at GEO under accession number GSE216914 and are publicly available as of the date of publication.
-
•
This paper does not report original code. Publicly available code was adapted and/or combined to meet the specification of our dataset analysis, as indicated in STAR Methods for CyTOF and scRNAseq analyses.
-
•
Any additional information required to reanalyze the data reported in this paper is available from the lead contact upon request.
References
- 1.Veale D.J., Fearon U. What makes psoriatic and rheumatoid arthritis so different? RMD Open. 2015;1:e000025. doi: 10.1136/rmdopen-2014-000025. [DOI] [PMC free article] [PubMed] [Google Scholar]
- 2.Masopust D., Soerens A.G. Tissue-resident T cells and other resident leukocytes. Annu. Rev. Immunol. 2019;37:521–546. doi: 10.1146/annurev-immunol-042617-053214. [DOI] [PMC free article] [PubMed] [Google Scholar]
- 3.Szabo P.A., Miron M., Farber D.L. Location, location, location: tissue resident memory T cells in mice and humans. Sci Immunol. 2019;4 doi: 10.1126/sciimmunol.aas9673. [DOI] [PMC free article] [PubMed] [Google Scholar]
- 4.Mueller S.N., Mackay L.K. Tissue-resident memory T cells: local specialists in immune defence. Nat. Rev. Immunol. 2016;16:79–89. doi: 10.1038/nri.2015.3. [DOI] [PubMed] [Google Scholar]
- 5.Sathaliyawala T., Kubota M., Yudanin N., Turner D., Camp P., Thome J.J.C., Bickham K.L., Lerner H., Goldstein M., Sykes M., et al. Distribution and compartmentalization of human circulating and tissue-resident memory T cell subsets. Immunity. 2013;38:187–197. doi: 10.1016/j.immuni.2012.09.020. [DOI] [PMC free article] [PubMed] [Google Scholar]
- 6.Iijima N., Iwasaki A. Tissue instruction for migration and retention of TRM cells. Trends Immunol. 2015;36:556–564. doi: 10.1016/j.it.2015.07.002. [DOI] [PMC free article] [PubMed] [Google Scholar]
- 7.Klicznik M.M., Morawski P.A., Hollbacher B., Varkhande S.R., Motley S.J., Kuri-Cervantes L., Goodwin E., Rosenblum M.D., Long S.A., Brachtl G., et al. Human CD4(+)CD103(+) cutaneous resident memory T cells are found in the circulation of healthy individuals. Sci Immunol. 2019;4 doi: 10.1126/sciimmunol.aav8995. [DOI] [PMC free article] [PubMed] [Google Scholar]
- 8.Fonseca R., Beura L.K., Quarnstrom C.F., Ghoneim H.E., Fan Y., Zebley C.C., Scott M.C., Fares-Frederickson N.J., Wijeyesinghe S., Thompson E.A., et al. Developmental plasticity allows outside-in immune responses by resident memory T cells. Nat. Immunol. 2020;21:412–421. doi: 10.1038/s41590-020-0607-7. [DOI] [PMC free article] [PubMed] [Google Scholar]
- 9.Stolley J.M., Johnston T.S., Soerens A.G., Beura L.K., Rosato P.C., Joag V., Wijeyesinghe S.P., Langlois R.A., Osum K.C., Mitchell J.S., Masopust D. Retrograde migration supplies resident memory T cells to lung-draining LN after influenza infection. J. Exp. Med. 2020;217 doi: 10.1084/jem.20192197. [DOI] [PMC free article] [PubMed] [Google Scholar]
- 10.Strobl J., Gail L.M., Kleissl L., Pandey R.V., Smejkal V., Huber J., Puxkandl V., Unterluggauer L., Dingelmaier-Hovorka R., Atzmuller D., et al. Human resident memory T cells exit the skin and mediate systemic Th2-driven inflammation. J. Exp. Med. 2021;218 doi: 10.1084/jem.20210417. [DOI] [PMC free article] [PubMed] [Google Scholar]
- 11.Zundler S., Becker E., Spocinska M., Slawik M., Parga-Vidal L., Stark R., Wiendl M., Atreya R., Rath T., Leppkes M., et al. Hobit- and Blimp-1-driven CD4+ tissue-resident memory T cells control chronic intestinal inflammation. Nat. Immunol. 2019;20:288–300. doi: 10.1038/s41590-018-0298-5. [DOI] [PubMed] [Google Scholar]
- 12.Liu Y., Wang H., Taylor M., Cook C., Martinez-Berdeja A., North J.P., Harirchian P., Hailer A.A., Zhao Z., Ghadially R., et al. Classification of human chronic inflammatory skin disease based on single-cell immune profiling. Sci Immunol. 2022;7:eabl9165. doi: 10.1126/sciimmunol.abl9165. [DOI] [PMC free article] [PubMed] [Google Scholar]
- 13.Wiggins B.G., Pallett L.J., Li X., Davies S.P., Amin O.E., Gill U.S., Kucykowicz S., Patel A.M., Aliazis K., Liu Y.S., et al. The human liver microenvironment shapes the homing and function of CD4+ T-cell populations. Gut. 2022;71:1399–1411. doi: 10.1136/gutjnl-2020-323771. [DOI] [PMC free article] [PubMed] [Google Scholar]
- 14.Cheuk S., Schlums H., Gallais Sérézal I., Martini E., Chiang S.C., Marquardt N., Gibbs A., Detlofsson E., Introini A., Forkel M., et al. CD49a expression defines tissue-resident CD8+ T cells poised for cytotoxic function in human skin. Immunity. 2017;46:287–300. doi: 10.1016/j.immuni.2017.01.009. [DOI] [PMC free article] [PubMed] [Google Scholar]
- 15.Kumar B.V., Ma W., Miron M., Granot T., Guyer R.S., Carpenter D.J., Senda T., Sun X., Ho S.-H., Lerner H., et al. Human tissue-resident memory T cells are defined by core transcriptional and functional signatures in lymphoid and mucosal sites. Cell Rep. 2017;20:2921–2934. doi: 10.1016/j.celrep.2017.08.078. [DOI] [PMC free article] [PubMed] [Google Scholar]
- 16.Pallett L.J., Davies J., Colbeck E.J., Robertson F., Hansi N., Easom N.J.W., Burton A.R., Stegmann K.A., Schurich A., Swadling L., et al. IL-2high tissue-resident T cells in the human liver: sentinels for hepatotropic infection. J. Exp. Med. 2017;214:1567–1580. doi: 10.1084/jem.20162115. [DOI] [PMC free article] [PubMed] [Google Scholar]
- 17.Pizzolla A., Nguyen T.H., Sant S., Jaffar J., Loudovaris T., Mannering S.I., Thomas P.G., Westall G.P., Kedzierska K., Wakim L.M. Influenza-specific lung-resident memory T cells are proliferative and polyfunctional and maintain diverse TCR profiles. J. Clin. Invest. 2018;128:721–733. doi: 10.1172/JCI96957. [DOI] [PMC free article] [PubMed] [Google Scholar]
- 18.Chang M.H., Levescot A., Nelson-Maney N., Blaustein R.B., Winden K.D., Morris A., Wactor A., Balu S., Grieshaber-Bouyer R., Wei K., et al. Arthritis flares mediated by tissue-resident memory T cells in the joint. Cell Rep. 2021;37:109902. doi: 10.1016/j.celrep.2021.109902. [DOI] [PMC free article] [PubMed] [Google Scholar]
- 19.Jung J., Lee J.S., Kim Y.G., Lee C.K., Yoo B., Shin E.-C., Hong S. Synovial fluid CD69+CD8+ T cells with tissue-resident phenotype mediate perforin-dependent citrullination in rheumatoid arthritis. Clin Transl Immunology. 2020;9:e1140. doi: 10.1002/cti2.1140. [DOI] [PMC free article] [PubMed] [Google Scholar]
- 20.Petrelli A., Mijnheer G., Hoytema van Konijnenburg D.P., van der Wal M.M., Giovannone B., Mocholi E., Vazirpanah N., Broen J.C., Hijnen D., Oldenburg B., et al. PD-1+CD8+ T cells are clonally expanding effectors in human chronic inflammation. J. Clin. Invest. 2018;128:4669–4681. doi: 10.1172/JCI96107. [DOI] [PMC free article] [PubMed] [Google Scholar]
- 21.Steel K.J.A., Srenathan U., Ridley M., Durham L.E., Wu S.-Y., Ryan S.E., Hughes C.D., Chan E., Kirkham B.W., Taams L.S. Polyfunctional, proinflammatory, tissue-resident memory phenotype and function of synovial interleukin-17A+CD8+ T cells in psoriatic arthritis. Arthritis Rheumatol. 2020;72:435–447. doi: 10.1002/art.41156. [DOI] [PMC free article] [PubMed] [Google Scholar]
- 22.Argyriou A., Wadsworth M.H., 2nd, Lendvai A., Christensen S.M., Hensvold A.H., Gerstner C., van Vollenhoven A., Kravarik K., Winkler A., Malmstrom V., Chemin K. Single cell sequencing identifies clonally expanded synovial CD4(+) T(PH) cells expressing GPR56 in rheumatoid arthritis. Nat. Commun. 2022;13:4046. doi: 10.1038/s41467-022-31519-6. [DOI] [PMC free article] [PubMed] [Google Scholar]
- 23.Christo S.N., Evrard M., Park S.L., Gandolfo L.C., Burn T.N., Fonseca R., Newman D.M., Alexandre Y.O., Collins N., Zamudio N.M., et al. Discrete tissue microenvironments instruct diversity in resident memory T cell function and plasticity. Nat. Immunol. 2021;22:1140–1151. doi: 10.1038/s41590-021-01004-1. [DOI] [PubMed] [Google Scholar]
- 24.Nowicka M., Krieg C., Crowell H.L., Weber L.M., Hartmann F.J., Guglietta S., Becher B., Levesque M.P., Robinson M.D. CyTOF workflow: differential discovery in high-throughput high-dimensional cytometry datasets. F1000Res. 2017;6:748. doi: 10.12688/f1000research.11622.3. [DOI] [PMC free article] [PubMed] [Google Scholar]
- 25.Diggins K.E., Greenplate A.R., Leelatian N., Wogsland C.E., Irish J.M. Characterizing cell subsets using marker enrichment modeling. Nat. Methods. 2017;14:275–278. doi: 10.1038/nmeth.4149. [DOI] [PMC free article] [PubMed] [Google Scholar]
- 26.Bromley S.K., Akbaba H., Mani V., Mora-Buch R., Chasse A.Y., Sama A., Luster A.D. CD49a regulates cutaneous resident memory CD8+ T cell persistence and response. Cell Rep. 2020;32:108085. doi: 10.1016/j.celrep.2020.108085. [DOI] [PMC free article] [PubMed] [Google Scholar]
- 27.Penkava F., Velasco-Herrera M.D.C., Young M.D., Yager N., Nwosu L.N., Pratt A.G., Lara A.L., Guzzo C., Maroof A., Mamanova L., et al. Single-cell sequencing reveals clonal expansions of pro-inflammatory synovial CD8 T cells expressing tissue-homing receptors in psoriatic arthritis. Nat. Commun. 2020;11 doi: 10.1038/s41467-020-18513-6. 4767-4711. [DOI] [PMC free article] [PubMed] [Google Scholar]
- 28.Liu J., Chang H.-W., Huang Z.-M., Nakamura M., Sekhon S., Ahn R., Munoz-Sandoval P., Bhattarai S., Beck K.M., Sanchez I.M., et al. Single-cell RNA sequencing of psoriatic skin identifies pathogenic Tc17 cell subsets and reveals distinctions between CD8+ T cells in autoimmunity and cancer. J. Allergy Clin. Immunol. 2021;147:2370–2380. doi: 10.1016/j.jaci.2020.11.028. [DOI] [PMC free article] [PubMed] [Google Scholar]
- 29.Dahmani A., Janelle V., Carli C., Richaud M., Lamarche C., Khalili M., Goupil M., Bezverbnaya K., Bramson J.L., Delisle J.-S. TGFβ programs central memory differentiation in ex vivo-stimulated human T cells. Cancer Immunol Res. 2019;7:1426–1439. doi: 10.1158/2326-6066.CIR-18-0691. [DOI] [PubMed] [Google Scholar]
- 30.Kurd N.S., He Z., Louis T.L., Milner J.J., Omilusik K.D., Jin W., Tsai M.S., Widjaja C.E., Kanbar J.N., Olvera J.G., et al. Early precursors and molecular determinants of tissue-resident memory CD8+ T lymphocytes revealed by single-cell RNA sequencing. Sci Immunol. 2020;5 doi: 10.1126/sciimmunol.aaz6894. [DOI] [PMC free article] [PubMed] [Google Scholar]
- 31.Crowl J.T., Heeg M., Ferry A., Milner J.J., Omilusik K.D., Toma C., He Z., Chang J.T., Goldrath A.W. Tissue-resident memory CD8+ T cells possess unique transcriptional, epigenetic and functional adaptations to different tissue environments. Nat. Immunol. 2022;1-11 doi: 10.1038/s41590-022-01229-8. [DOI] [PMC free article] [PubMed] [Google Scholar]
- 32.Milner J.J., Toma C., He Z., Kurd N.S., Nguyen Q.P., McDonald B., Quezada L., Widjaja C.E., Witherden D.A., Crowl J.T., et al. Heterogenous populations of tissue-resident CD8+ T cells are generated in response to infection and malignancy. Immunity. 2020;52:808–824.e807. doi: 10.1016/j.immuni.2020.04.007. [DOI] [PMC free article] [PubMed] [Google Scholar]
- 33.Maggi L., Santarlasci V., Capone M., Peired A., Frosali F., Crome S.Q., Querci V., Fambrini M., Liotta F., Levings M.K., et al. CD161 is a marker of all human IL-17-producing T-cell subsets and is induced by RORC. Eur. J. Immunol. 2010;40:2174–2181. doi: 10.1002/eji.200940257. [DOI] [PubMed] [Google Scholar]
- 34.Wade S.M., Canavan M., McGarry T., Low C., Wade S.C., Mullan R.H., Veale D.J., Fearon U. Association of synovial tissue polyfunctional T-cells with DAPSA in psoriatic arthritis. Ann. Rheum. Dis. 2019;78:350–354. doi: 10.1136/annrheumdis-2018-214138. [DOI] [PMC free article] [PubMed] [Google Scholar]
- 35.Cheuk S., Wikén M., Blomqvist L., Nylén S., Talme T., Ståhle M., Eidsmo L. Epidermal Th22 and Tc17 cells form a localized disease memory in clinically healed psoriasis. J. Immunol. 2014;192:3111–3120. doi: 10.4049/jimmunol.1302313. [DOI] [PMC free article] [PubMed] [Google Scholar]
- 36.Gallais Sérézal I., Classon C., Cheuk S., Barrientos-Somarribas M., Wadman E., Martini E., Chang D., Xu Landén N., Ehrström M., Nylén S., Eidsmo L. Resident T cells in resolved psoriasis steer tissue responses that stratify clinical outcome. J. Invest. Dermatol. 2018;138:1754–1763. doi: 10.1016/j.jid.2018.02.030. [DOI] [PubMed] [Google Scholar]
- 37.Nicolet B.P., Guislain A., van Alphen F.P.J., Gomez-Eerland R., Schumacher T.N.M., van den Biggelaar M., Wolkers M.C. CD29 identifies IFN-γ-producing human CD8+ T cells with an increased cytotoxic potential. Proc. Natl. Acad. Sci. USA. 2020;117:6686–6696. doi: 10.1073/pnas.1913940117. [DOI] [PMC free article] [PubMed] [Google Scholar]
- 38.Povoleri G.A.M., Nova-Lamperti E., Scotta C., Fanelli G., Chen Y.C., Becker P.D., Boardman D., Costantini B., Romano M., Pavlidis P., et al. Human retinoic acid-regulated CD161(+) regulatory T cells support wound repair in intestinal mucosa. Nat. Immunol. 2018;19:1403–1414. doi: 10.1038/s41590-018-0230-z. [DOI] [PMC free article] [PubMed] [Google Scholar]
- 39.Afzali B., Mitchell P.J., Edozie F.C., Povoleri G.A.M., Dowson S.E., Demandt L., Walter G., Canavan J.B., Scotta C., Menon B., et al. CD161 expression characterizes a subpopulation of human regulatory T cells that produces IL-17 in a STAT3-dependent manner. Eur. J. Immunol. 2013;43:2043–2054. doi: 10.1002/eji.201243296. [DOI] [PMC free article] [PubMed] [Google Scholar]
- 40.Pesenacker A.M., Bending D., Ursu S., Wu Q., Nistala K., Wedderburn L.R. CD161 defines the subset of FoxP3+ T cells capable of producing proinflammatory cytokines. Blood. 2013;121:2647–2658. doi: 10.1182/blood-2012-08-443473. [DOI] [PMC free article] [PubMed] [Google Scholar]
- 41.Duurland C.L., Brown C.C., O'Shaughnessy R.F.L., Wedderburn L.R. CD161+ tconv and CD161+ Treg share a transcriptional and functional phenotype despite limited overlap in TCRβ repertoire. Front. Immunol. 2017;8:103. doi: 10.3389/fimmu.2017.00103. [DOI] [PMC free article] [PubMed] [Google Scholar]
- 42.Simone D., Penkava F., Ridley A., Sansom S., Al-Mossawi M.H., Bowness P. Single cell analysis of spondyloarthritis regulatory T cells identifies distinct synovial gene expression patterns and clonal fates. Commun Biol. 2021;4 doi: 10.1038/s42003-021-02931-3. 1395-1315. [DOI] [PMC free article] [PubMed] [Google Scholar]
- 43.Chaudhry A., Rudra D., Treuting P., Samstein R.M., Liang Y., Kas A., Rudensky A.Y. CD4+ regulatory T cells control TH17 responses in a Stat3-dependent manner. Science. 2009;326:986–991. doi: 10.1126/science.1172702. [DOI] [PMC free article] [PubMed] [Google Scholar]
- 44.Menon B., Gullick N.J., Walter G.J., Rajasekhar M., Garrood T., Evans H.G., Taams L.S., Kirkham B.W. Interleukin-17+CD8+ T cells are enriched in the joints of patients with psoriatic arthritis and correlate with disease activity and joint damage progression. Arthritis Rheumatol. 2014;66:1272–1281. doi: 10.1002/art.38376. [DOI] [PMC free article] [PubMed] [Google Scholar]
- 45.Raychaudhuri S.K., Abria C., Mitra A., Raychaudhuri S.P. Functional significance of MAIT cells in psoriatic arthritis. Cytokine. 2020;125:154855. doi: 10.1016/j.cyto.2019.154855. [DOI] [PubMed] [Google Scholar]
- 46.Taams L.S. Interleukin-17 in rheumatoid arthritis: trials and tribulations. J. Exp. Med. 2020;217 doi: 10.1084/jem.20192048. [DOI] [PMC free article] [PubMed] [Google Scholar]
- 47.Kim J.H., Han J.W., Choi Y.J., Rha M.S., Koh J.Y., Kim K.H., Kim C.G., Lee Y.J., Kim A.R., Park J., et al. Functions of human liver CD69(+)CD103(-)CD8(+) T cells depend on HIF-2alpha activity in healthy and pathologic livers. J. Hepatol. 2020;72:1170–1181. doi: 10.1016/j.jhep.2020.01.010. [DOI] [PubMed] [Google Scholar]
- 48.Stelma F., de Niet A., Sinnige M.J., van Dort K.A., van Gisbergen K., Verheij J., van Leeuwen E.M.M., Kootstra N.A., Reesink H.W. Human intrahepatic CD69 + CD8+ T cells have a tissue resident memory T cell phenotype with reduced cytolytic capacity. Sci. Rep. 2017;7:6172. doi: 10.1038/s41598-017-06352-3. [DOI] [PMC free article] [PubMed] [Google Scholar]
- 49.Finck R., Simonds E.F., Jager A., Krishnaswamy S., Sachs K., Fantl W., Pe'er D., Nolan G.P., Bendall S.C. Normalization of mass cytometry data with bead standards. Cytometry. 2013;83:483–494. doi: 10.1002/cyto.a.22271. [DOI] [PMC free article] [PubMed] [Google Scholar]
- 50.Borcherding N., Bormann N.L., Kraus G. scRepertoire: an R-based toolkit for single-cell immune receptor analysis. F1000Res. 2020;9:47. doi: 10.12688/f1000research.22139.2. [DOI] [PMC free article] [PubMed] [Google Scholar]
- 51.Subramanian A., Tamayo P., Mootha V.K., Mukherjee S., Ebert B.L., Gillette M.A., Paulovich A., Pomeroy S.L., Golub T.R., Lander E.S., Mesirov J.P. Gene set enrichment analysis: a knowledge-based approach for interpreting genome-wide expression profiles. Proc. Natl. Acad. Sci. USA. 2005;102:15545–15550. doi: 10.1073/pnas.0506580102. papers3: [DOI] [PMC free article] [PubMed] [Google Scholar]
- 52.Kolberg L., Raudvere U., Kuzmin I., Vilo J., Peterson H. 2020. gprofiler2 -- an R Package for Gene List Functional Enrichment Analysis and Namespace Conversion Toolset g:Profiler. F1000Res 9. [DOI] [PMC free article] [PubMed] [Google Scholar]
- 53.Raudvere U., Kolberg L., Kuzmin I., Arak T., Adler P., Peterson H., Vilo J. g:Profiler: a web server for functional enrichment analysis and conversions of gene lists (2019 update) Nucleic Acids Res. 2019;47:W191–W198. doi: 10.1093/nar/gkz369. [DOI] [PMC free article] [PubMed] [Google Scholar]
- 54.Stuart T., Butler A., Hoffman P., Hafemeister C., Papalexi E., Mauck W.M., Hao Y., Stoeckius M., Smibert P., Satija R. Comprehensive integration of single-cell data. Cell. 2019;177:1888–1902.e1821. doi: 10.1016/j.cell.2019.05.031. [DOI] [PMC free article] [PubMed] [Google Scholar]
- 55.Hafemeister C., Satija R. Normalization and variance stabilization of single-cell RNA-seq data using regularized negative binomial regression. Genome Biol. 2019;20:296. doi: 10.1186/s13059-019-1874-1. [DOI] [PMC free article] [PubMed] [Google Scholar]
- 56.Choudhary S., Satija R. Comparison and evaluation of statistical error models for scRNA-seq. Genome Biol. 2022;23 doi: 10.1186/s13059-021-02584-9. 27-20. [DOI] [PMC free article] [PubMed] [Google Scholar]
- 57.Hao Y., Hao S., Andersen-Nissen E., Mauck W.M., Zheng S., Butler A., Lee M.J., Wilk A.J., Darby C., Zager M., et al. Integrated analysis of multimodal single-cell data. Cell. 2021;184:3573–3587.e3529. doi: 10.1016/j.cell.2021.04.048. [DOI] [PMC free article] [PubMed] [Google Scholar]
- 58.Becht E., McInnes L., Healy J., Dutertre C.A., Kwok I.W.H., Ng L.G., Ginhoux F., Newell E.W. Dimensionality reduction for visualizing single-cell data using UMAP. Nat. Biotechnol. 2018 doi: 10.1038/nbt.4314. [DOI] [PubMed] [Google Scholar]
- 59.Ramesh R., Kozhaya L., McKevitt K., Djuretic I.M., Carlson T.J., Quintero M.A., McCauley J.L., Abreu M.T., Unutmaz D., Sundrud M.S. Pro-inflammatory human Th17 cells selectively express P-glycoprotein and are refractory to glucocorticoids. J. Exp. Med. 2014;211:89–104. doi: 10.1084/jem.20130301. [DOI] [PMC free article] [PubMed] [Google Scholar]
- 60.Fergusson J.R., Smith K.E., Fleming V.M., Rajoriya N., Newell E.W., Simmons R., Marchi E., Björkander S., Kang Y.-H., Swadling L., et al. CD161 defines a transcriptional and functional phenotype across distinct human T cell lineages. Cell Rep. 2014;9:1075–1088. doi: 10.1016/j.celrep.2014.09.045. [DOI] [PMC free article] [PubMed] [Google Scholar]
Associated Data
This section collects any data citations, data availability statements, or supplementary materials included in this article.
Supplementary Materials
Cell recovery and VDJ recoveries for each of the 4 PsA patient synovial fluid CD8+ T cell samples after pre-processing and QC for scRNA-seq
Differentially expressed genes list for all 18 synovial CD8+ T cell clusters identified in PsA patients by scRNA-seq
Differentially expressed genes lists for comparative analyses of either cluster 4 (Sheet 1) or cluster 6 (Sheet 2) TRM cells compared with all other clusters or comparison of cluster 6 with cluster 4 (Sheet 3)
Data Availability Statement
-
•
According to UK research councils’ Common Principles on Data Policy, all single-cell RNA-seq data have been deposited at GEO under accession number GSE216914 and are publicly available as of the date of publication.
-
•
This paper does not report original code. Publicly available code was adapted and/or combined to meet the specification of our dataset analysis, as indicated in STAR Methods for CyTOF and scRNAseq analyses.
-
•
Any additional information required to reanalyze the data reported in this paper is available from the lead contact upon request.