Abstract
Atmospheric nitrogen (N) and sulfur (S) pollution increased over much of the U.S. during the 20th century from fossil fuel combustion and industrial agriculture. Despite recent declines, N and S deposition continue to affect many plant communities in the U.S., although which individual species are at risk remains uncertain. We used species composition data from >14,000 survey sites across the contiguous U.S. to evaluate the association between N and S deposition and the probability of occurrence for 348 herbaceous species. We found that the probability of occurrence for 70% of species was negatively associated with N or S deposition somewhere in the contiguous U.S. (56% for N, 51% for S). Fifteen percent and 51% of species potentially decreased at all N and S deposition rates, respectively, suggesting thresholds below the minimum deposition they receive. Although more species potentially increase than decrease with N deposition, increasers tend to be introduced, and decreasers tend to be higher-value native species. More vulnerable species tend to be shorter with lower tissue N and Mg. These relationships constituted predictive equations to estimate critical loads. These results demonstrate that many herbaceous species may be at risk from atmospheric deposition and can inform improvements to air quality policies in the U.S. and globally.
Keywords: plants, critical loads, diversity, soil pH, functional traits, climate, acid deposition, nutrient nitrogen
Atmospheric deposition of nitrogen (N) and sulfur (S) are two key drivers of plant biodiversity decline worldwide after habitat loss and climate change.1 N deposition reduces biodiversity through several mechanisms,2 including soil acidification and subsequent foliar nutrient imbalances,3,4 increased pest pressures on nutrient-enriched foliage,5 and stimulating growth of opportunistic species allowing them to outcompete local neighbors through light limitation or other processes.6–8 Sulfur deposition primarily reduces diversity by acidifying soils, again leading to base cation imbalances, as well as frost sensitivity and inhibition of germination.3,9,10
In the U.S., levels of N and S deposition have declined after decades of successful air quality policies enacted under the Clean Air Act.11–13 These amendments have reduced total N and S deposition in the eastern U.S. by an average of 23.7% and 56.9%, respectively, between 2000–2002 and 2013–2015.12 Nevertheless, N and S deposition both remain 5–10 times above pre-industrial levels (i.e., 0.4 kg N ha−1 yr−1, 0.1 kg S ha−1 yr−1, 13) across most of the country, and N deposition trends are flat or increasing in many areas outside of the eastern U.S. 12,14 Furthermore, the composition of N deposition is shifting from regulated forms (i.e., oxidized NOx) to largely unregulated forms (i.e., reduced NHx, except as a portion of particulate matter which is regulated).12,15
Current levels of both N and S deposition remain elevated above many known thresholds (termed “critical loads”) for detrimental ecological effects,13,16–18 and likely will remain so in the near future.13,18 To date, most critical loads have been developed for ecosystems or ecoregions rather than species,2,19,20 although species-level estimates are beginning to emerge in Europe.21,22 Simkin et al. (2016) compiled a database of herbaceous plant species composition across 15,136 plots in the contiguous U.S.23 Comparing this with the spatial gradient of N deposition they found that total richness had a unimodal association with N deposition – one that was steeper in more acidic soils and in grasslands compared with forests – and that decreases in total richness were potentially occurring in 24% of plots.23 However, it was not reported which among the roughly 4000 species in that dataset are potentially vulnerable, where they occur, their conservation value, and whether any traits may be associated with sensitivity versus insensitivity. Many of these species are too rare to confidently assess, but for those that remain we fill these critical knowledge gaps with a comprehensive analysis of the Simkin et al. (2016) database.
Results and Discussion
Species responses to N and S deposition
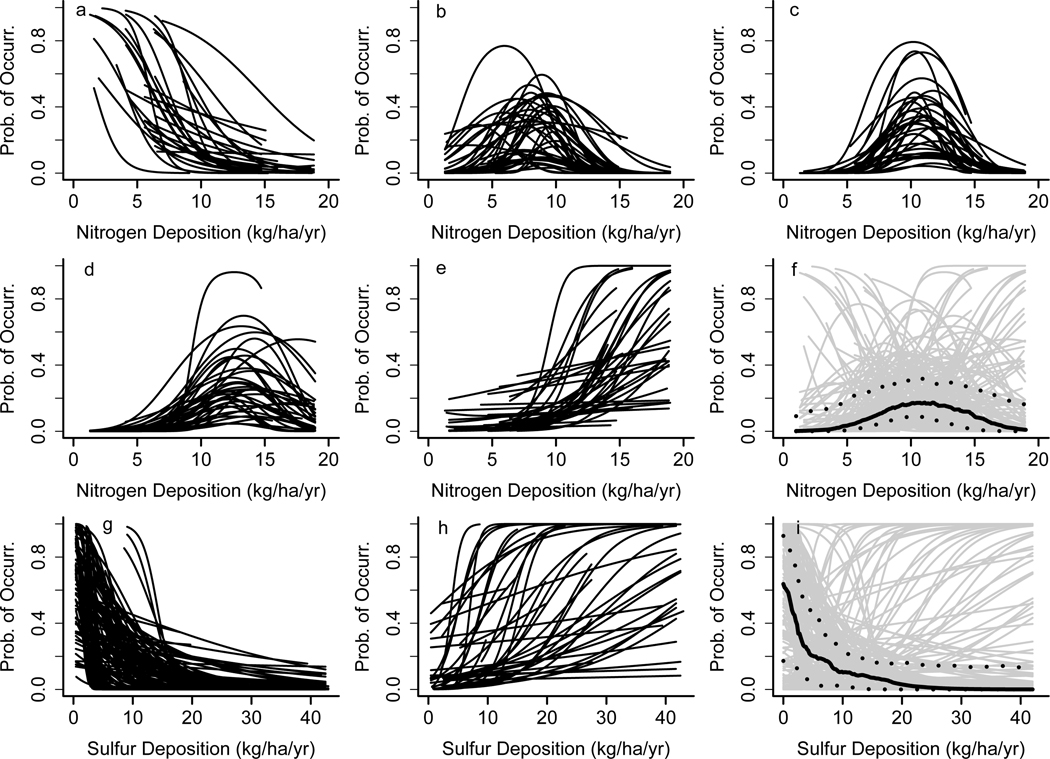
We found that 348 species had sufficient data to analyze according to our criteria. Of these, 70% (243 species) decreased with increasing N or S along some portion of the deposition gradient. For some of these species, however, even the best models don’t explain much variation in the probability of occurrence (i.e., AUC < 0.7 or R2 < 0.1) because species distributions are a complex function of many factors including but not exclusive to those evaluated here (e.g., historical land use, disturbance, ozone, grazing pressures, etc.). Thus, we focused on a subset of 198 species that we considered had “robust relationships” with the predictor variables included (i.e., AUC ≥ 0.7, R2 ≥ 0.1, and monotonically increasing, decreasing, or unimodal relationships with N; Table 1, S1, Figure S1). Results for all 348 species are in Table S2. Of these 198 species, 54% had a unimodal relationship with N (107 species), 20% had a monotonically increasing relationship (40 species), 15% had a monotonically decreasing relationship (30 species), and 11% had no association with N deposition (21 species) (Figure 1a-f). The steepness of these relationships, and the N deposition associated with the highest species occurrence, also varied widely among species (Figure 1). For S deposition, 62% had negative associations (123 species), whereas 22% had positive associations (43 species), and 16% had no association with S deposition (32 species). The steepness of these relationships also varied widely (Figure 1g-i).
Table 1: Summary of responses and vulnerability to N and S deposition.
Shown are the number of species out of the 198 with robust results for N or S that monotonically decreased, showed no response, monotonically increased, or had a unimodal relationship (N only) with N or S deposition. Shadings represent qualitative levels of vulnerability: high (red - decrease with both), moderate (orange - decrease with one and unaffected by the other), conditional (yellow - either contrasting relationships or conditional on the rate of deposition), or neutral (grey - no relationship with either). Species that partially benefit (light green - increase with one and unaffected by the other), or strongly benefit (dark green, increase with both) are also indicated. Species with “U-shaped” N relationships (45 species) are omitted as not ecologically realistic, and species names in each category are in Supplemental Table S1 and S2.
| S relationship | |||||
|---|---|---|---|---|---|
| Decrease | None | Increase | Total | ||
| N relationship | Decrease | 11 (6%) | 5 (3%) | 14 (7%) | 30 (15%) |
| None | 5 (3%) | 15 (8%) | 1 (1%) | 21 (11%) | |
| Increase | 26 (13%) | 6 (3%) | 8 (4%) | 40 (20%) | |
| Unimodal | 81 (41%) | 6 (3%) | 20 (10%) | 107 (54%) | |
| Total | 123 (62%) | 32 (16%) | 43 (22%) | 198 (100%) | |
Figure 1: Species response curves for nitrogen (177 species, a-f) and sulfur (166 species, g-i).
For N, response types are decreasing (a, 30 species), unimodal (b-d, 107 species), or increasing (e, 40 species). Species with unimodal relationships are split into three panels based on the N deposition where probability of occurrence was highest to improve readability (b: peak at 3.1–10 kg N/ha/yr, 39 species; c: peak at 10.1–12 kg N/ha/yr, 32 species; d: peak at 12.1–19 kg N/ha/yr, 36 species). For S, response types are decreasing (g, 123 species) or increasing with S deposition (h, 43 species). The average response across all species is shown for N (f) and S (i) as a solid black line, and the 25th and 75th percentiles are shown in dotted black lines, (individual species curves from panels a-e and g-h are shown in gray). Other factors are evaluated at the species-level average. Species with no relationship (21 and 37 species for N and S, respectively) or a “U” shaped relationship with N (45 species) are not shown.
Most species had a negative association at some level of N or S deposition received (Table 1). This suggests that many species may be threatened by N and/or S deposition in the U.S. The most common joint response by far was a unimodal relationship with N and a decreasing relationship with S (41% or 81 species, Table 1). This agrees with ecological theory 24,25 as well as empirical 19,23 and modeling 26 studies, which show that low levels of N input acts to relieve nutrient limitation and enhance growth for many species.23,24 Higher levels of N deposition reduce these benefits and can acidify and enrich soils with nutrients, progressively excluding species unable to tolerate or capitalize on the new conditions. The few species that decreased monotonically with N could be poor competitors in the community that persisted only in low N conditions. Greenhouse and field experiments demonstrate that such species may be outcompeted due to light limitation brought on by growth of opportunistic neighbors.6 The average N-response was for a negative association around 10 kg N ha−1 yr−1 (Figure 1f), a common critical load from community-level research.19,27 S deposition acidifies soils, explaining the large number of species that had negative associations with S.28 The few species with positive associations with S deposition we hypothesize are acid tolerant species that benefitted from the loss of competitors, rather than evidence of a fertilization effect from S. S-limitation can occur, but such cases are rare in natural communities.24,29 There is more evidence that a shift towards P-limitation may occur with high N deposition.30,31 In agricultural settings, S-limitation can occur but only when N and P are abundant,32 which is likely not the case for our plots.
Species-level critical loads
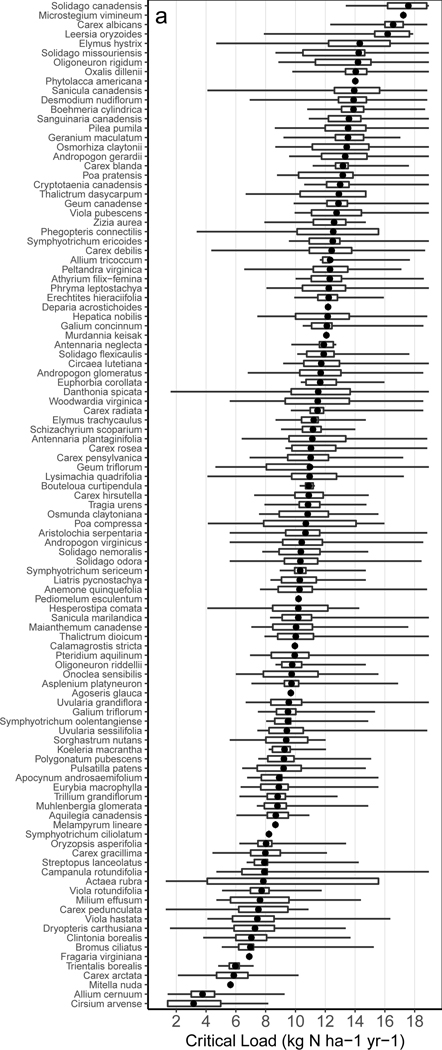
We then calculated N and S critical loads using partial derivatives of the best statistical model for each species (cf. Simkin et al. 2016 – Supplemental Table S2, SI). Mean critical loads for N ranged from 3.2 kg N ha−1 yr−1 (Cirsium arvense) to 17.6 kg N ha−1 yr−1 (Solidago canadensis) (Figure 2a). The intervals in Figure 2a represent spatial variation in the CL – not error associated with the mean. Such variation reflects how species can have lower or higher CLs in a particular location based on covarying factors (e.g., lower CLs in more acidic conditions). This has been reported elsewhere for habitats in Ireland 22, where the CL for a species may vary widely across habitats.
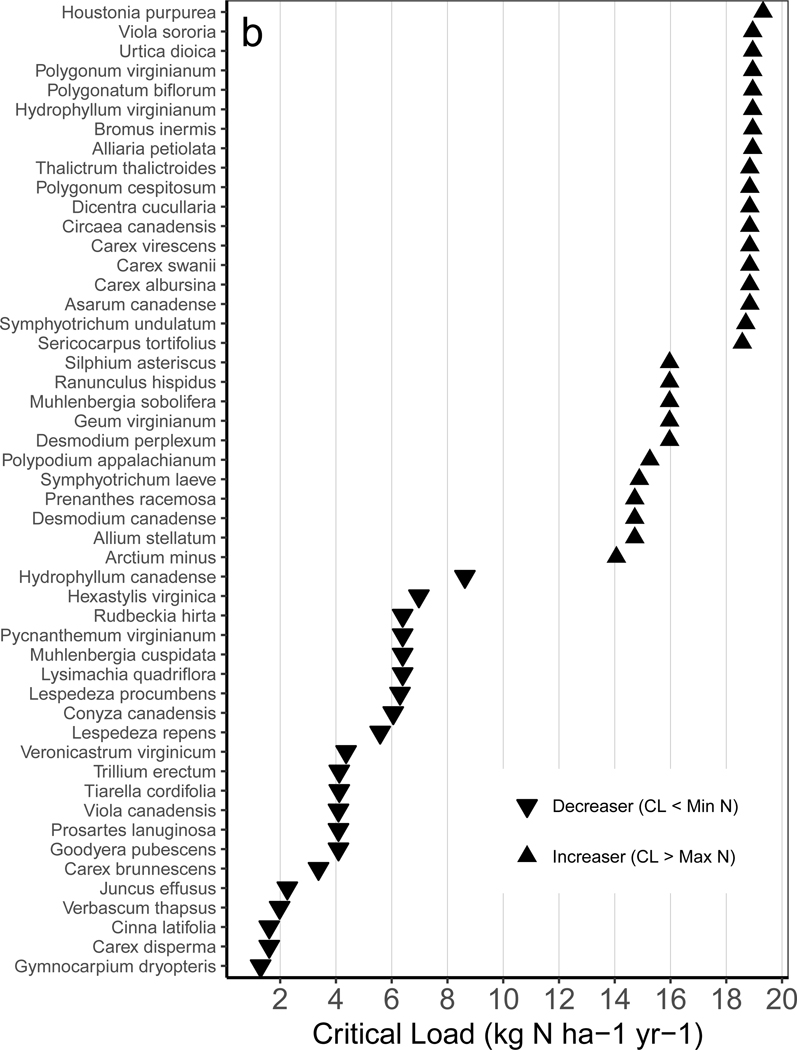
Figure 2. Spatial variation in species-level nitrogen critical loads.
Nitrogen critical loads for (a) 107 species with a unimodal shaped relationship and (b) 50 species with a monotonic relationship that either decreased (▼), or increased (▲) with N deposition. In (a), the mean (circle), min and max (bars), and 25th to 75th percentile range (box) represent spatial variation (not error) in the critical load based on covarying factors that affect sensitivity (more sensitive species have lower critical loads). In (b) only point estimates are shown because the CL for decreasers is below the minimum N deposition, and the CL for increasers is above the maximum (how far outside of this range is not known). The 20 species with a “see-saw” relationship are not shown because the average CL is not meaningful.
The wide variability for species-level N-critical loads across a species’ range demonstrates that vulnerability for any given species depends strongly on its environmental context 33,34. This is more realistic ecologically – for example, adding 2 kg of N to a strongly N limited site elicits a different response than would occur at a more fertile site. This wide variation, however, also cautions against using any single critical load for most species. Instead, this supports using the partial derivative from multivariate models like we did, which retains relationships with relevant covariates, allowing one to refine estimates of the critical load using local edaphic or climatic factors (Table S2; SI, eqn 1-4).
Average critical loads could not be defined for species that monotonically increased or decreased, because thresholds (if present), are outside the range of the observed data (Figure 2b). For these species there is no observed threshold in the probability of occurrence, and thus a critical load cannot be quantified. This limitation is partly explained by the range of observational data for each species, and partly by our approach. Only monotonic relationships with S were allowed for ecological and statistical reasons (see SI), and more complex mathematical relationships (e.g., sigmoid) were not explored, which may have revealed critical loads for some species. Supplemental analysis revealed that species receiving a minimum N deposition greater than 4 kg N ha−1 yr−1 were less likely to have unimodal and more likely to have decreasing relationships (Chi2 = 28.04, P < 0.001; Table S3). Short deposition gradients may be especially problematic analytically for species that only occur in the western U.S.
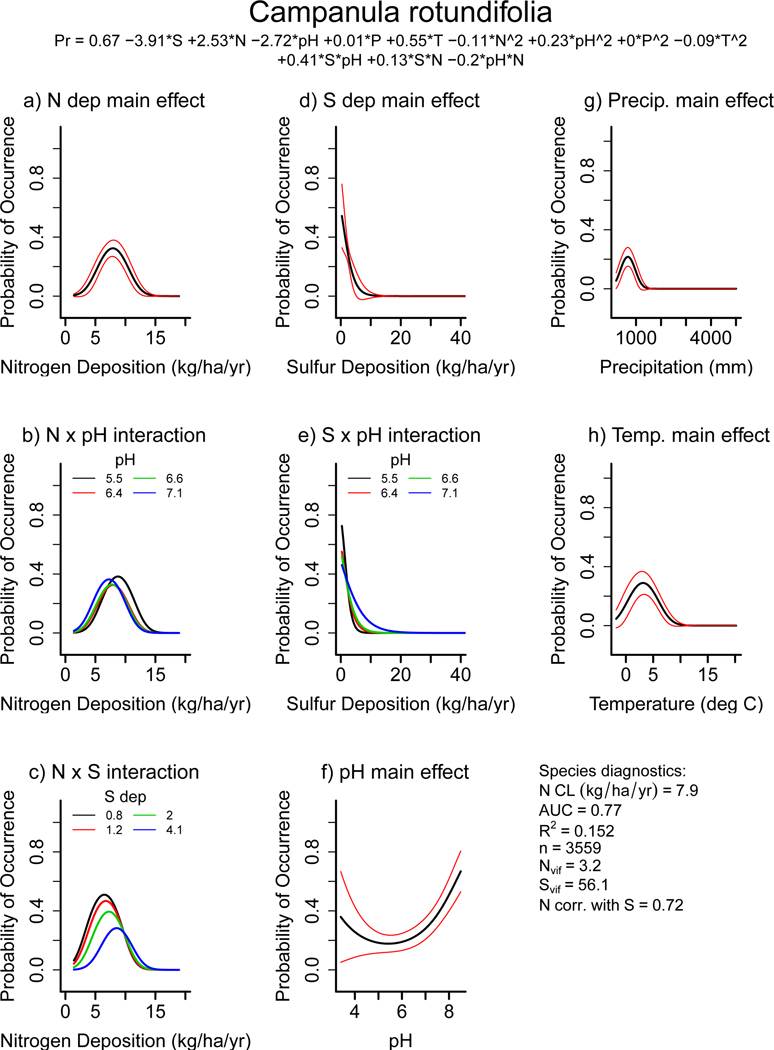
Many species-level critical loads reported here and elsewhere are below community-level critical loads (e.g., ~8–20 kg N ha−1 yr−1, 2,21–23). This is expected given that community-level critical loads are essentially averages over sensitive and insensitive species. Many species critical loads reported here are lower than those from acid grasslands across Europe (roughly 8 – 22 kg N ha−1 yr−1, 21), but comparable to those from Ireland (roughly 2.8 – 19 kg N ha−1 yr−1, 22). This may be explained because most of the plots from the acid grassland study were from Great Britain and mainland Europe 35 where deposition rates are higher (8–35 kg N ha−1 yr−1), as opposed to the U.S. and Ireland where N deposition was lower (2–20 kg N ha−1 yr−1). The Irish study also found critical loads of a species could vary widely among different habitats, and bootstrapped intervals within a habitat were also often 2–6 kg N ha−1 yr−1 wide.22 We compared our results with critical loads for 304 European species (24 from acid grasslands in 21 and 280 across many habitats in Ireland in 22). There were only eight species in common between our study and those (Table S4, Figure S2) and only one that was present across all three (Campanula rotundifolia, Figure 3). The critical load for C. rotundifolia reported here (7.9 kg N ha−1 yr−1 average, 5.7–14.8 kg N ha−1 yr−1 for 5th-95th interval) compared well with estimates from Ireland (two habitats: 6.2 and 8.2 kg N ha−1 yr−1), and all three estimates were lower than from European acid grasslands (13 kg N ha−1 yr−1). The correspondence between our estimates and those from Ireland is encouraging since the methods were completely independent (i.e., TITAN analysis versus partial derivatives), suggesting both approaches are capturing similar ecological relationships. One advantage of our approach is the predictive equation that retains the associations among moderating factors. One advantage of the TITAN approach is that it is not restricted to any particular mathematical form.
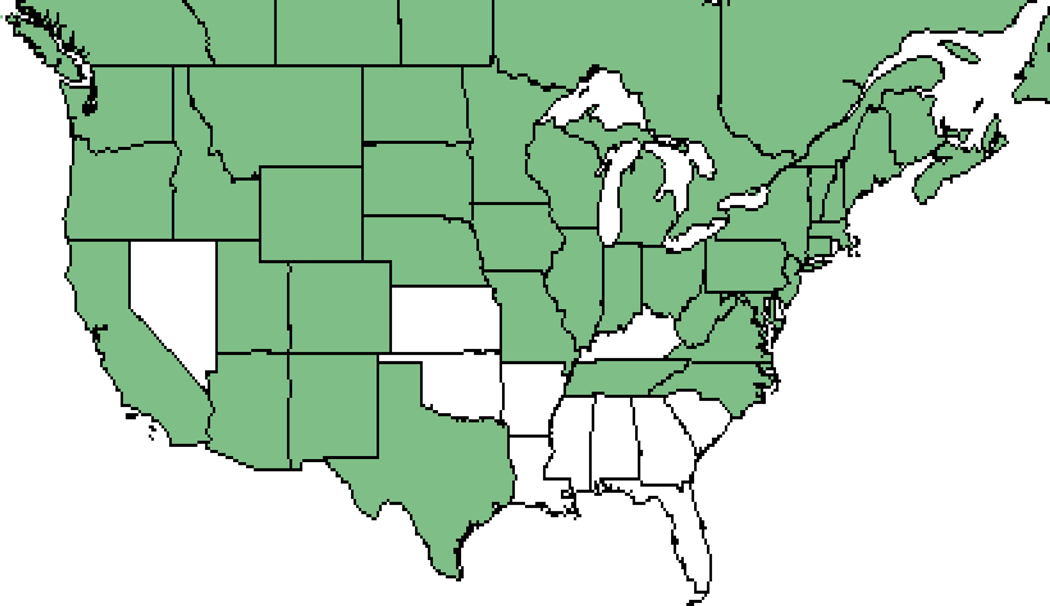
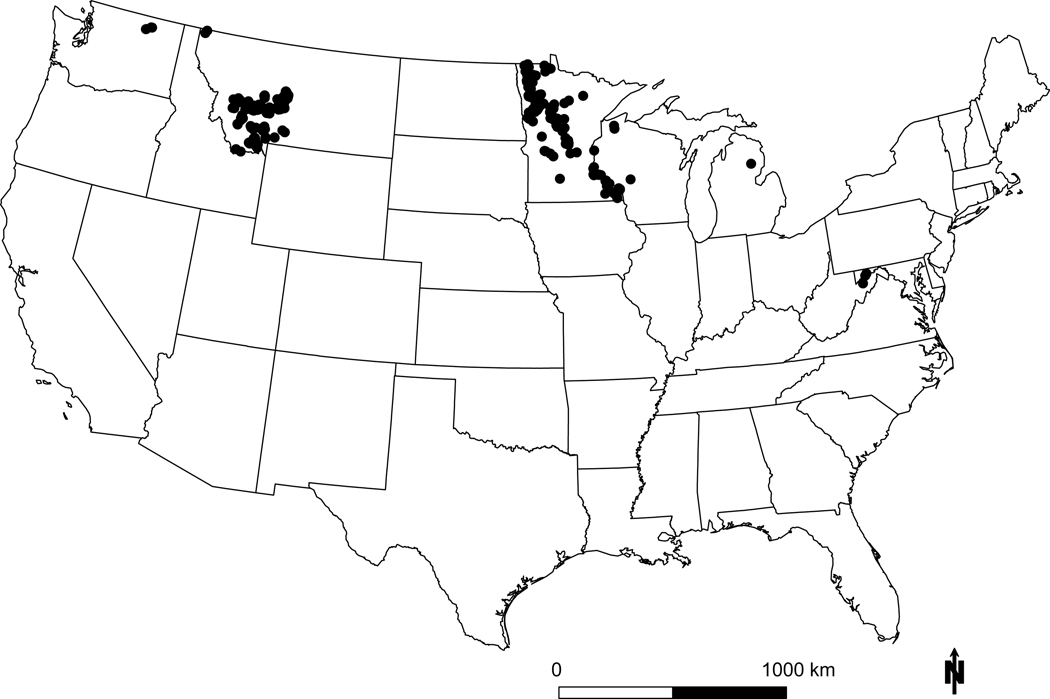
Figure 3: Detailed example of species response.
GLM results for Campanula rotundifolia (common name: harebell). Shown above are the marginal probabilities of occurrence individually by term from the best model for N deposition (a), N x pH (b), N x S (c), S deposition (d), S x pH (e), soil pH (f), precipitation (g), and temperature (h). All terms P<0.01 (Table S4). Black lines in main effect plots are average response and red lines are 95th CI. For interaction terms (b, c, e) the effect of the modifying term is shown as separate quartile lines (Q1-Q4). The best model is shown below the species name. Also shown is a photo of the species (i), a range map from the USDA (j, 59), and a plot map from this study (k). C. rotundafolia is a northern latitude wildflower that grows in drier, low nutrient soils.60 This species had a hump shaped relationship with N (average CL = 7.9 kg N ha−1 yr−1; 10th-90th CL = 5.9–10.6 kg N ha−1 yr−1), and a negative relationship with S. Interactions were statistically significant with little effect on marginal relationships, except for the N x S interaction, where the eutrophication effect was stronger (i.e., higher peak and lower N CL) if S deposition was low. The 10th-90th interval reported here is similar to that reported for C. rotundafolia in Ireland 22 and lower than that found in acid grasslands across Europe 21. See Figure S1 for results for all 198 species.
Floristic quality of vulnerable species
We next assessed the floristic quality of species positively and negatively associated with N and S deposition. We were primarily concerned with the following question - are species potentially at risk highly valued natives or are they common or non-native species? We used results compiled from many plant surveys across the U.S. based on “coefficients of conservatism” (C values: 0–10) assigned to individual plant species (Ci) based on their tolerance to human disturbance and the degree to which the species represent natural undisturbed habitats.36 Higher C-scores are associated with higher quality flora and habitats, with non-natives receiving score of zero. Natives range from 1–10 based on their tolerance to disturbance (higher C-score for lower tolerance). Of the 137 species that were associated negatively with N along some portion of the gradient, roughly 84% were highly or moderately valued (i.e., Ci ≥ 7, 4 ≤ Ci ≤ 6, respectively). There was a negative correlation between C-scores and the species average N critical loads (r = −0.260, P = 0.001), indicating that species of higher conservation value had lower critical loads. Of the 123 species that were associated negatively with S deposition, ~82% were of moderate-to-high conservation value. These include Muhlenbergia cuspidata, Lysimachia quadriflora, and Prosartes lanuginosa, all highly valued native species (average C≥7.8) of North America.
Regional and species vulnerability across the contiguous U.S.
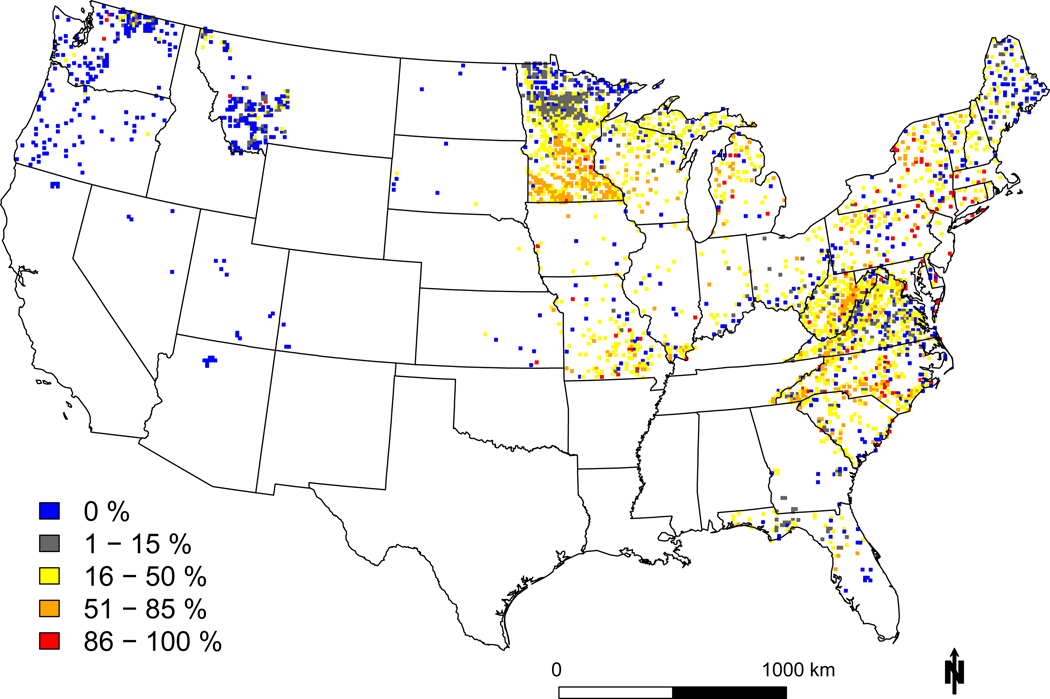
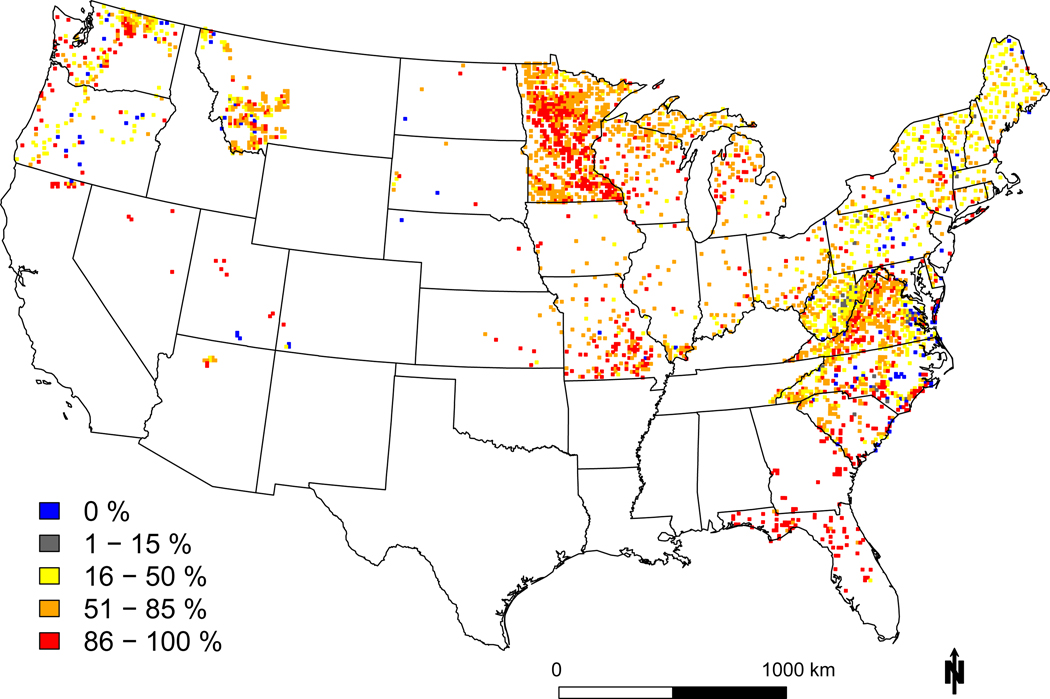
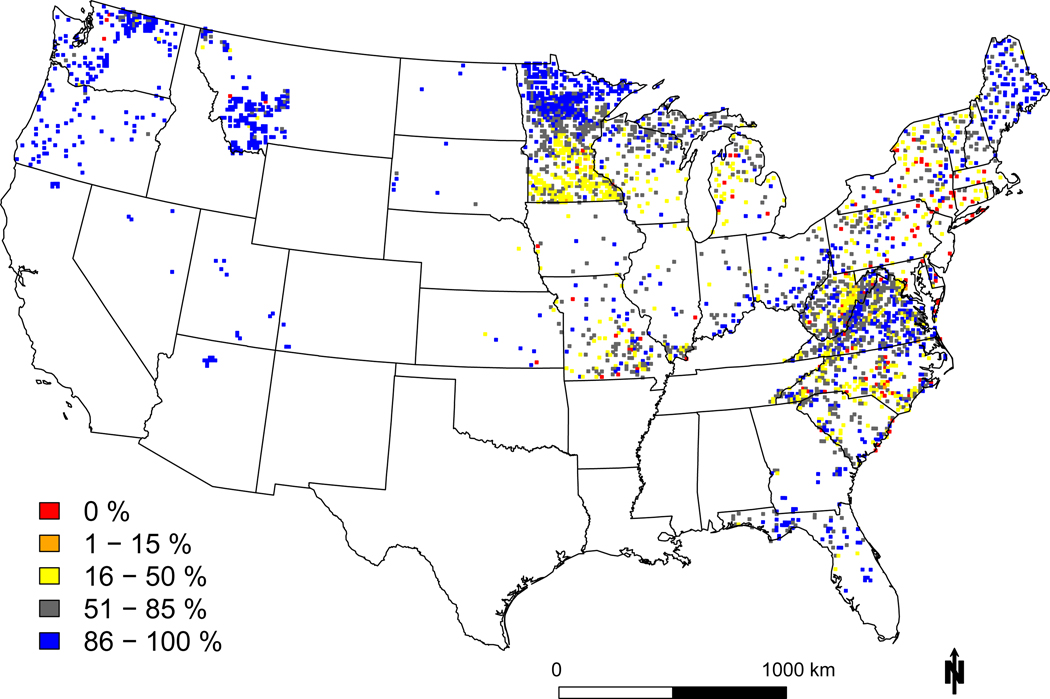
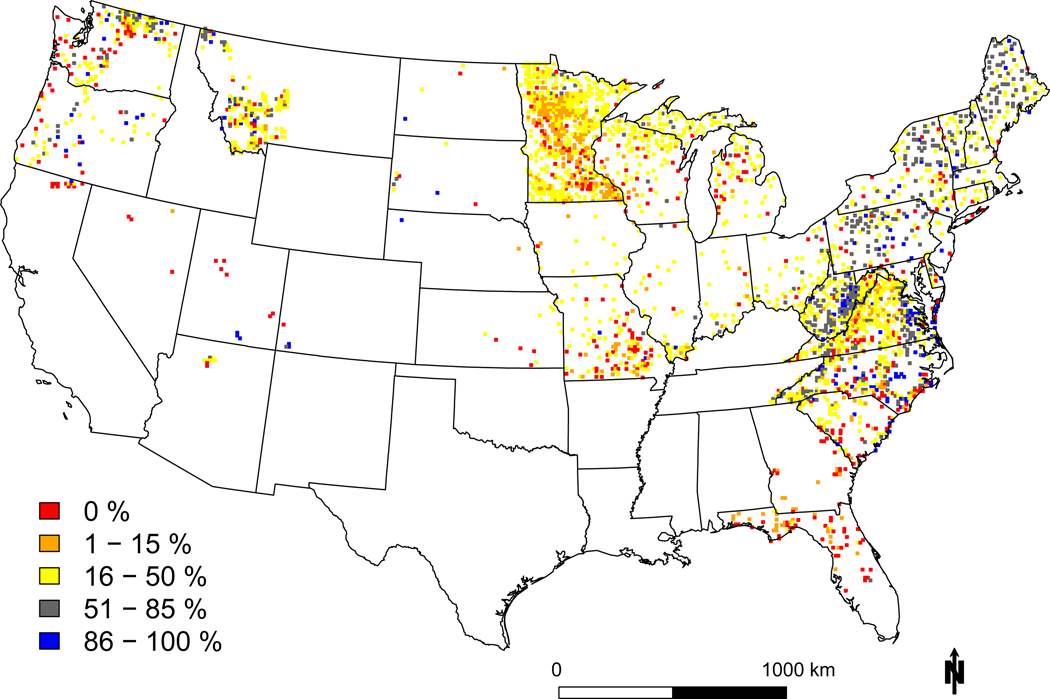
To determine spatial patterns of vulnerability to N and S deposition, we calculated the percentage of species that were positively or negatively associated with local deposition in each 12 km x 12 km grid cell. Overall, more species were positively than negatively associated with N deposition. But, most eastern areas had significant fractions of decreasers (>15%, Figure 4a and 4c). Out of the 3,122 grid cells containing one or more of the focal 198 species, 75.8% had an exceedance for one or more species, and 24.3% had an exceedance of 50% or more unique species in the grid cell. Hotspots of negative associations with N deposition included southern Minnesota, eastern West Virginia, and scattered grid cells in the Northeast, Mid-Atlantic, and Midwest. There was wide variation in the fraction of species potentially at risk even in high deposition areas, suggesting that fine scale processes affect local risk (e.g., differences in species composition, historical land use, the degree of nutrient limitation, and other stressors such as ozone that were not included 23,33). Lower fractions of species at risk were estimated in the west, likely partly due to shorter N deposition gradients that did not make our threshold for assessment (see SI).
Figure 4: Geographic variation in sensitivity to N and S deposition.

Shown are the percent of species that decrease (a) or increase (c) in probability of occurrence with increasing N deposition, and decrease (b) or increase (d) with increasing S deposition. Plots were aggregated within a 12 × 12 km grid cell and unique species were only counted once if they were potentially vulnerable anywhere in the cell. Note the color ramps are flipped between decreasers and increasers, with hotter colors denoting negative effects (i.e., more decreasers and fewer increasers, most species assessed were native).
Hotspots of decreasers with S deposition occurred throughout the U.S., even in relatively low deposition areas in the west (Figure 4b). Our leading explanation for this is the dominant mechanism for N is through eutrophication while the dominant effect for S is through acidification – thus, species and communities may benefit from low levels of N deposition which transitions to harm at higher levels, while species and communities are generally harmed by S deposition. Another plausible explanation is S deposition was not allowed to have complex nonlinear patterns (e.g., sigmoid, unimodal) that would facilitate a flat or positive response transitioning to a negative response. Notably, we found higher fractions of increasers (>50%) with S in historically highly polluted sites like West Virginia, which could be indicative of a local community that has already shifted towards acid tolerant species.
Of the 198 species with robust responses, critical loads were exceeded at more than half the observed sites for 17% (34 species) and 55% (108 species) for N and S, respectively. Because these plots are not a random sample across the conterminous U.S. (see Figure 3), it is not possible to say how this translates to vulnerability across the entire range of each species.
Do functional traits predict vulnerability?
Finally, we determined if simple predictive relationships existed between species traits and their potential sensitivity to N deposition. Such a relationship would yield a predictive tool for decision makers to apply to species lacking plot occurrence data across a deposition gradient. We found that simple plant functional groups were generally poor predictors (all R2<0.02) of either the shape of the response or the CL (Table S5), although natives tended to have more negative relationships (P=0.036) and lower CLs (P=0.028) than introduced species, perennial species tended to have lower CLs than non-perennials (P=0.046), and legumes tended to have more decreasers (P=0.104). These broad trends are in line with ecological theory, where native and perennial species tend to have traits focused on N-retention and slower growth, and legumes rely partly or wholly on fixing atmospheric N, both strategies that may be more susceptible to competitive exclusion from opportunistic non-native or annual species.37,38 Although not inconsistent with ecological theory, these relationships were notably weak (e.g. not all natives decreased with N deposition and invasives increased), reinforcing the notion that these broad groups may be less helpful than we’d like in describing ecological responses. We found physiological traits were much more predictive of the critical load, and led to several predictive equations:
| (1) |
| (2) |
| (3) |
The best overall model (equation 1) predicted the N critical load was a two-factor model with leaf magnesium content (LMgC, P<0.001) and vegetative height (VH, P=0.06). Leaf Mg is strongly associated with photosynthetic rates,39 while vegetative height influences access to light. Thus, species that were more potentially vulnerable had lower photosynthetic rates and were shorter-statured as reported in many other site-specific studies.7,16,25,37 Leaf magnesium, however, is not commonly available for most species, and photosynthetic rates are also correlated with leaf N40 (LNC and LMgC were highly correlated in our study: r=0.57, P=0.001). To develop an operational equation for wider use we examined relationships based on more widely available traits (i.e., LNC, SLA, and the six categorical traits). We found that LNC was also highly predictive (equation 2), and adding a factor for cotyledon status (monocot, dicot, fern; CSi) improved the model further (equation 3, CL(N) = +1.7, +0.7, and −2.8 for dicot, monocot, and ferns respectively) with no significant interaction in slope (P=0.36). Nitrogen CLs from the three equations were also correlated (all r > 0.65) and generally within +/−1 and +/−2 kg N ha−1 yr−1 of one another (for 56% and 80% of species, respectively). This is the first instance we know of reporting a predictive equation for critical loads of individual plant species.
It is important to note our assessment of 348 species represents only about 10% of the species in the initial dataset, and it is unknown whether species that were not assessed are more or less vulnerable to N or S deposition. Most species were excluded on the basis of rarity (3,643 had fewer than 50 presences), but many also had deposition gradients that we considered too short relative to interannual variation to assess (3,433 had N deposition gradients <7 kg N ha−1 yr−1). However, evidence from N fertilization experiments suggests that rarer species are more likely to be lost with N addition.7,37
Causality and Multicollinearity
It is difficult to confidently assign causality to deposition in a gradient study such as ours.23,35 We addressed this by assessing correlations among predictor variables individually for each species and summarizing these as variance inflation factors (VIFs) for nitrogen (VIF-N) and sulfur (VIF-S) (see SI). Lower VIFs mean less of a change for spurious correlations to affect results. There were larger correlation concerns with S than N, with fewer species under the conventional or conservative cutoffs for S as opposed to N (Table S6). Comparing the results for the 22 species with low multicollinearity (i.e., both VIFs < 3) with the full set of 198 species yielded several insights. The proportion of species with decreasing and unimodal relationships with N was nearly identical between the two sets of species (14% vs. 15% for decreasers, 50% versus 54% for unimodal, Table S6). The same was true for species with decreasing relationships with S (Table S6). ‘However, in the set of species with low VIFs we found no species that increased with S, and no species that showed no change with N (Table S6). Thus, results are likely robust for species that decrease with N or S and for species with unimodal N-relationships, but results for species that increase with S or show no change with N may be interpreted cautiously. Given the large numbers of species tested, we also tested our results for possible Type I errors using a Holm Bonferroni multiple comparisons adjustment,41 and found that 66% of species relationships with N remained significant after such an adjustment (see SI). Given decades of research documenting that climate, soil pH, and atmospheric deposition affect plant communities, we assume relationships that lost significance after adjustment are likely still ecologically valid.
Conclusions and policy implications
Even though a correlative study such as ours cannot definitively assign causality, the confluence of findings from controlled experimental manipulations,7,42–44 gradient studies such as ours,22,35,45 communities tracked through time as deposition changes,46,47 and dynamic modeling,26,48 all suggest that N and S deposition alter plant community composition. We found that 70% of the 348 species assessed, and 85% of the 198 species that had a robust relationship, were negatively associated with N and/or S somewhere in the contiguous United States. Our results are unprecedented at this scale and in numbers of species assessed in the U.S., strongly indicating widespread vulnerability to N and/or S deposition, and that species respond differently based on local environmental context. The wide range of thresholds even within a species strongly suggests that potential vulnerability is linked to local edaphic factors and atmospheric co-pollutants. This work can help inform the review of the U.S. Environmental Protection Agency’s secondary standards for oxides of nitrogen, oxides of sulfur, and particulate matter49 to identify species and regions of particular concern from these stressors to natural ecosystems.
Methods
Data assembly and species filtering
Simkin et al. (2016) compiled data from a variety of sources to develop a consolidated dataset that included plot level information for species composition (percent abundance), temperature, precipitation, soil pH, and N deposition for 15,136 plots nationwide. All variables were selected to represent long term conditions at a site. Temperature and precipitation were 30-year normals from PRISM,50 soil pH was from a combination of locally assessed empirical measurements and SSURGO,23 and N deposition was calculated as the sum of the 1985–2011 mean annual wet deposition interpolated from NADP plus 2002–2011 CMAQ modeled mean annual dry deposition.23 Updated deposition estimates from the Total Deposition project (TDEP51) were not available at the time of Simkin et al. (2016), but Simkin et al. (2016) reported good correspondence between our estimate and TDEP (i.e., r2 = 0.89, TDEP(2000–2012) = SimkinNdep(1985–2011)*0.91 + 0.3, 23,51). Total S deposition was calculated in the same manner as N deposition.
To filter plots and species to a subset to analyze, we restricted plots to those that were 100–700m2 as was done in Simkin et al. (2016) to reduce effects of species-area relationships, and removed all taxonomic groups that were only identified to genus or functional group. We excluded rare species by removing species with fewer than 5 records overall, and sparse species that did not have at least 5 records or comprise 5% of records in at least one Alliance using the National Vegetation Classification system.52 The second condition is needed because in a presence/absence dataset such as ours, we needed to identify the “core community” from which to draw the absences. This filtering reduced the number of plots to 15223 and species to 1027. We then required that each species span an N deposition gradient of at least 7 kg ha−1 yr−1, reducing the number of plots to 14041 and species to 348. The choice of a 7 kg ha−1 yr−1 gradient was arbitrary, but was guided by the assumption that the spatial gradient of deposition should exceed inter annual variation in N deposition (often 2–3 kg ha−1 yr−1, 53) by roughly double to detect a spatial trend. See SI for more details.
Species analysis
We performed binomial generalized linear models (GLMs) separately for each species on presences and absences from the set of Alliances that were considered its core community. We ran all possible models using 12 candidate terms: N deposition (Ndep), S deposition (Sdep), precipitation (P), temperature (T), soil pH (pH), Ndep2, P2, T2, pH2, Ndep*pH, and Sdep*pH, and Ndep*Sdep. Rationale for individual terms is described in the SI. To prevent model overfitting, we required there to be at least 5 detections per model term (e.g., for the full model with all 12 predictors plus the intercept, the species was required to have 65 observations). We compared all remaining models using AICc (Akaike Information Criterion) and AUC (Area Under ROC Curve) and selected the best model as the one that optimized both AICc and AUC. We did this by first examining all models with an AICc within 2.0 of the best overall model (which are considered statistically indistinguishable, 54), and then selecting the model with highest AUC. We assessed bivariate correlations among predictors using Pearson’s correlations between N or S and all other factors, and multivariate correlations among predictors using Variance Inflation Factors (VIFs) between N or S and all other main effects in the best model. We interpret our results using a conventional cutoff for VIF of 10.0 55 and a conservative cutoff of 3.0. A VIF of 10.0 and 3.0 mean that 1/10th and 1/3rd of the information, respectively, in the predictor is uncorrelated with other predictors. Given the large number of species assessed, we checked for multiple comparisons using a Holm-Bonferroni adjustment.41
Critical loads estimation
Critical loads are formally defined as “quantitative estimates of exposure to one or more pollutants below which significant harmful effects on specified sensitive elements of the environment do not occur according to present knowledge.”56 Here we interpret the N deposition value above which the probability of occurrence potentially declines as an estimate of the critical load. We estimated the critical load using the same approach in Simkin et al. (2016), by taking the partial derivative of the best statistical model with respect to N and to S deposition and solving for N or S deposition. Using this approach, the critical load can be an expression, where the deposition value depends on other covarying terms (e.g., lower under more acidic conditions or when S deposition is already high). See SI for further details.
Assessment of floristic quality
We used “coefficients of conservatism” (C-scores: 1–10) from various Floristic Quality Assessments (FQAs) conducted across the U.S. FQAs are plant surveys conducted by professional botanists to determine the quality of the flora in a particular area,36 usually as part of the process of applying for a state or federal permit. C-scores are assigned to individual plant species by professional botanists based on their tolerance to human disturbance and the degree to which the species represent natural undisturbed habitats.36 Non-native species are assigned a score of zero, and natives are assigned a score from 1–10, with 10 being the highest conservation value. Freyman et al. (2016) compiled C-scores from 30 inventories across the country representing >100,000 species into an online tool called the Universal Floristic Quality Assessment (FQA) Calculator (https://universalfqa.org/about). We used this database to assess the C-scores for all 348 species analyzed in our study, averaging across inventories if the C-score for a species differed across inventories. We consider species with C-scores from 7–10 and 4–6 to be of “high” and “moderate” conservation value, respectively (see SI for more information and 57).
Relating plant traits to critical loads
We ran three analyses to relate plant traits to critical loads. First, using the focal 198 species, we used Contingency Analyses to relate the shape of the relationship (i.e., increase, decrease, flat, unimodal for N; increase, decrease, or flat for S) to six plant functional groups from the USDA PLANTS database (https://plants.usda.gov/): (1) functional group (2 levels: forb, graminoid), (2) taxonomic group (monocot, dicot, fern), (3) invasive (yes, no), (4) life history (perennial, non-perennial), (5) native status (native, non-native), and (6) whether the species was in the Fabaceae family or not (i.e., to capture the potential for N-fixation). Second, we used ANOVA to assess whether the average CL for the focal 198 species differed among the same six plant functional groups above. Results are in Table S5. The highly imbalanced composition of the different subgroups limited our ability to examine combinations of characteristics (e.g., introduced grasses). Third, detailed trait information was available for a subset of 98 species for nine traits: leaf nitrogen content (LNC), leaf carbon content (LCC), specific leaf area (SLA), vegetative height, (VH), leaf lignin content (LLC), leaf phosphorus content (LPC), leaf calcium content (LCaC), leaf potassium content (LKC), and leaf magnesium content (LMgC). We used trait information from one region (Wisconsin, Don Waller pers comm) rather than from different geographic locations (e.g., the TRY database, 58) to limit the degree to which geographic variation in trait values could confound variation among species. We ran all possible linear models relating 16 traits (i.e., six plant functional groups above, nine physiological traits, and the species C-score) as candidate predictors, to the average CL from each species. We compared models with AICc and explored many different competing model structures. Not all combinations of traits were available for all models, explaining the differences in sample sizes.
Supplementary Material
Acknowledgements
We thank J. Travis Smith, Steve Leduc, and Jana Compton for commenting on earlier versions of this manuscript, as well as the NADP Critical Loads of Atmospheric Deposition (CLAD) Working Group that has provided helpful discussions. We also thank Brian Cade at the USGS for his statistical advice throughout the project. Finally, we thank the four journal reviewers who gave detailed and constructive feedback. The original work underpinning this project (Simkin et al. 2016) was supported under the USGS Powell Center Working Group “Evidence for shifts in plant species diversity along N deposition gradients: a first synthesis for the United States”, Environmental Protection Agency (EPA) Contract EP-12-H-000491, National Park Service Grant P13AC00407, and USGS Grant G14AC00028. Continuation of this research represented here was supported under the EPA’s Office of Research and Development Safe and Healthy Communities (SHC 4.61.4). All data from this study are available online through the U.S. EPA Environmental Dataset Gateway (EDG, https://edg.epa.gov). JB was supported by the USGS Ecosystems and Land Change Science programs. The USGS supports the conclusions of research conducted by their employees, and peer reviews and approves all of their products consistent with USGS Fundamental Science Practices. The views expressed in this manuscript are those of the authors and do not necessarily reflect the views or policies of the US Environmental Protection Agency or the USDA Forest Service. Mention of trade names or commercial products is for descriptive purposes only does not constitute endorsement or recommendation for use by the U.S. Government.
Footnotes
Competing interests statement: The authors declare no competing interests.
Data availability:
The datasets generated during and/or analyzed during the current study are available in the EPA’s Environmental Dataset Gateway repository (https://edg.epa.gov/metadata/catalog/main/home.page) under the project name “Differential vulnerability of 348 herbaceous species to atmospheric deposition of nitrogen and sulfur across the contiguous U.S.” and dataset name “Herb species occurrence data across the US” (DOI: 10.23719/1500914).
References
- 1.Sala OE et al. Global biodiversity scenarios for the year 2100. Science 287, 1770–1774 (2000). [DOI] [PubMed] [Google Scholar]
- 2.Bobbink R. et al. Global assessment of nitrogen deposition effects on terrestrial plant diversity: a synthesis. Ecological Applications 20, 30–59 (2010). [DOI] [PubMed] [Google Scholar]
- 3.Sullivan TJ et al. Effects of Acidic Deposition and Soil Acidification on Sugar Maple Trees in the Adirondack Mountains, New York. Environ. Sci. Technol. 47, 12687–12694, doi: 10.1021/es401864w (2013). [DOI] [PubMed] [Google Scholar]
- 4.Bowman WD, Cleveland CC, Halada L, Hresko J. & Baron JS Negative impact of nitrogen deposition on soil buffering capacity. Nature Geoscience 1, 767–770, doi: 10.1038/ngeo339 (2008). [DOI] [Google Scholar]
- 5.Throop HL & Lerdau MT Effects of nitrogen deposition on insect herbivory: Implications for community and ecosystem processes. Ecosystems 7, 109–133 (2004). [Google Scholar]
- 6.Hautier Y, Niklaus PA & Hector A. Competition for Light Causes Plant Biodiversity Loss After Eutrophication. Science 324, 636–638, doi: 10.1126/science.1169640 (2009). [DOI] [PubMed] [Google Scholar]
- 7.Clark CM & Tilman D. Loss of plant species after chronic low-level nitrogen deposition to prairie grasslands. Nature 451, 712–715, doi: 10.1038/nature06503 (2008). [DOI] [PubMed] [Google Scholar]
- 8.Gilliam FS et al. Twenty-five-year response of the herbaceous layer of a temperate hardwood forest to elevated nitrogen deposition. Ecosphere 7, e01250 (2016). [Google Scholar]
- 9.Driscoll CT et al. Nitrogen pollution in the northeastern United States: Sources, effects, and management options. Bioscience 53, 357–374 (2003). [Google Scholar]
- 10.Schaberg PG et al. Effects of chronic N fertilization on foliar membranes, cold tolerance, and carbon storage in montane red spruce. Can. J. For. Res.-Rev. Can. Rech. For. 32, 1351–1359, doi: 10.1139/x02-059 (2002). [DOI] [Google Scholar]
- 11.Burns DA, Lynch JA, Cosby BJ, Fenn ME & Baron JS National Acid Precipitation Assessment Program Report to Congress 2011: An Integrated Assessment. (US EPA Clean Air Markets Div, Washington, DC, 2011). [Google Scholar]
- 12.NADP. National Atmospheric Deposition Program. Total Deposition 2015 Annual Map Summary. NADP Data Report 2016–02. Illinois State Water Survey, University of Illinois at Urbana-Champaign, IL. (2016). [Google Scholar]
- 13.Clark CM et al. Atmospheric deposition and exceedances of critical loads from 1800− 2025 for the conterminous United States. Ecological Applications 28, 978–1002 (2018). [DOI] [PMC free article] [PubMed] [Google Scholar]
- 14.Houlton BZ et al. Intentional versus unintentional nitrogen use in the United States: trends, efficiency and implications. Biogeochemistry 114, 11–23, doi: 10.1007/s10533-012-9801-5 (2013). [DOI] [Google Scholar]
- 15.Li Y. et al. Increasing importance of deposition of reduced nitrogen in the United States. Proc. Natl. Acad. Sci. U. S. A. 113, 5874–5879, doi: 10.1073/pnas.1525736113 (2016). [DOI] [PMC free article] [PubMed] [Google Scholar]
- 16.Pardo LH et al. Effects of nitrogen deposition and empirical nitrogen critical loads for ecoregions of the United States. Ecological Applications 21, 3049–3082 (2011). [Google Scholar]
- 17.Baron JS, Driscoll CT, Stoddard JL & Richer EE Empirical Critical Loads of Atmospheric Nitrogen Deposition for Nutrient Enrichment and Acidification of Sensitive US Lakes. BioScience 61, 602–613, doi: 10.1525/bio.2011.61.8.6 (2011). [DOI] [Google Scholar]
- 18.Ellis RA et al. Present and future nitrogen deposition to national parks in the United States: critical load exceedances. Atmospheric Chemistry and Physics 13, 9083–9095, doi: 10.5194/acp-13-9083-2013 (2013). [DOI] [Google Scholar]
- 19.Pardo LH et al. Effects of nitrogen deposition and empirical nitrogen critical loads for ecoregions of the United States. Ecological Applications 21, 3049–3082 (2011). [Google Scholar]
- 20.Bobbink R. & Hettelingh J-P Review and revision of empirical critical loads and dose-response relationships: Proceedings of an expert workshop, Noordwijkerhout, 23–25 June 2010. (Rijksinstituut voor Volksgezondheid en Milieu RIVM, 2011). [Google Scholar]
- 21.Payne RJ, Dise NB, Stevens CJ, Gowing DJ & Partners B. Impact of nitrogen deposition at the species level. Proc. Natl. Acad. Sci. U. S. A. 110, 984–987, doi: 10.1073/pnas.1214299109 (2013). [DOI] [PMC free article] [PubMed] [Google Scholar]
- 22.Wilkins K, Aherne J. & Bleasdale A. Vegetation community change points suggest that critical loads of nutrient nitrogen may be too high. Atmos. Environ. 146, 324–331 (2016). [Google Scholar]
- 23.Simkin SM et al. Conditional vulnerability of plant diversity to atmospheric nitrogen deposition across the United States. Proceedings of the National Academy of Sciences 113, 4086–4091, doi: 10.1073/pnas.1515241113 (2016). [DOI] [PMC free article] [PubMed] [Google Scholar]
- 24.Vitousek PM & Howarth RW Nitrogen limitation on land and in the sea - How can it occur? Biogeochemistry 13, 87–115 (1991). [Google Scholar]
- 25.Tilman D. Constraints and tradeoffs: toward a predictive theory of competition and succession. Oikos 58, 3–15 (1990). [Google Scholar]
- 26.Belyazid S, Kurz D, Braun S, Sverdrup H, Rihm B, Hettelingh JP A dynamic modelling approach for estimating critical loads of nitrogen based on plant community changes under a changing climate. Environmental Pollution 159, 789–801 (2011). [DOI] [PubMed] [Google Scholar]
- 27.Bobbink R, Ashmore M, Braun S, Flückiger W, and Van den Wyngaert IJJ. Empirical nitrogen critical loads for natural and semi-natural ecosystems: 2002 update. 40–170 (SAEFL, Berne, Berne, 2003). [Google Scholar]
- 28.Driscoll CT et al. Acidic deposition in the northeastern United States: Sources and inputs, ecosystem effects, and management strategies. BioScience 51, 180–198 (2001). [Google Scholar]
- 29.Garrison MT, Moore JA, Shaw TM & Mika PG Foliar nutrient and tree growth response of mixed-conifer stands to three fertilization treatments in northeast Oregon and north central Washington. For. Ecol. Manage. 132, 183–198 (2000). [Google Scholar]
- 30.Crowley K. et al. Do nutrient limitation patterns shift from nitrogen toward phosphorus with increasing nitrogen deposition across the northeastern United States? Ecosystems 15, 940–957 (2012). [Google Scholar]
- 31.Goswami S. et al. Phosphorus limitation of aboveground production in northern hardwood forests. Ecology 99, 438–449 (2018). [DOI] [PubMed] [Google Scholar]
- 32.Kovar J. & Karlen D. in 19th World Congress of Soil Science. [Google Scholar]
- 33.Clark CM et al. Environmental and plant community determinants of species loss following nitrogen enrichment. Ecology Letters 10, 596–607 (2007). [DOI] [PubMed] [Google Scholar]
- 34.Perring MP et al. Understanding context dependency in the response of forest understorey plant communities to nitrogen deposition. Environmental pollution (2018). [DOI] [PubMed] [Google Scholar]
- 35.Stevens CJ et al. Nitrogen deposition threatens species richness of grasslands across Europe. Environmental Pollution 158, 2940–2945, doi: 10.1016/j.envpol.2010.06.006 (2010). [DOI] [PubMed] [Google Scholar]
- 36.Swink F. & Wilhelm G. Plants of the Chicago Region, 4th edn. Indiana Academy of Science, Indianapolis,USA. (1994). [Google Scholar]
- 37.Suding KN et al. Functional- and abundance-based mechanisms explain diversity loss due to N fertilization. Proc. Natl. Acad. Sci. U. S. A. 102, 4387–4392 (2005). [DOI] [PMC free article] [PubMed] [Google Scholar]
- 38.Aerts R. & Chapin FS in Advances in Ecological Research, Vol 30 Vol. 30 Advances in Ecological Research 1–67 (2000). [Google Scholar]
- 39.Kirkby EA Marschner’s Mineral Nutrition of Higher Plants Third Edition Foreword. (2012). [Google Scholar]
- 40.Wright IJ et al. The worldwide leaf economics spectrum. Nature 428, 821–827, doi: 10.1038/nature02403 (2004). [DOI] [PubMed] [Google Scholar]
- 41.Holm S. A simple sequentially rejective multiple test procedure. Scandinavian journal of statistics, 65–70 (1979). [Google Scholar]
- 42.Mountford JO, Lakhani KH & Kirkham FW Experimental assessment of the effects of nitrogen addition under hay-cutting and aftermath grazing on the vegetation of meadows on a Somerset peat moor. Journal Of Applied Ecology 30, 321–332 (1993). [Google Scholar]
- 43.Bai Y. et al. Tradeoffs and thresholds in the effects of nitrogen addition on biodiversity and ecosystem functioning: evidence from inner Mongolia Grasslands. Global Change Biology 16, 358–372, doi: 10.1111/j.1365-2486.2009.01950.x (2010). [DOI] [Google Scholar]
- 44.Silvertown J. et al. The Park Grass Experiment 1856–2006: Its contribution to ecology. Journal Of Ecology 94, 801–814 (2006). [Google Scholar]
- 45.Maskell LC, Smart SM, Bullock JM, Thompson K. & Stevens CJ Nitrogen deposition causes widespread loss of species richness in British habitats. Global Change Biology 16, 671–679, doi: 10.1111/j.1365-2486.2009.02022.x (2010). [DOI] [Google Scholar]
- 46.Smart SM et al. Large-scale changes in the abundance of common higher plant species across Britain between 1978, 1990 and 1998 as a consequence of human activity: Tests of hypothesised changes in trait representation. Biol. Conserv. 124, 355–371 (2005). [Google Scholar]
- 47.Dupre C. et al. Changes in species richness and composition in European acidic grasslands over the past 70 years: the contribution of cumulative atmospheric nitrogen deposition. Global Change Biology 16, 344–357, doi: 10.1111/j.1365-2486.2009.01982.x (2010). [DOI] [Google Scholar]
- 48.De Vries W. et al. Use of dynamic soil-vegetation models to assess impacts of nitrogen deposition on plant species composition: an overview. Ecological Applications 20, 60–79, doi: 10.1890/08-1019.1 (2010). [DOI] [PubMed] [Google Scholar]
- 49.EPA. Integrated science assessment for oxides of nitrogen, oxides of sulfur and particulate matter- ecological criteria (1st Early Release Draft, 2017) [EPA Report]. (EPA/600/R-16/372). Research Triangle Park, NC: U.S. Environmental Protection Agency, Office of Research and Development, National Center for Environmental Assessment- RTP Division. (2017). [Google Scholar]
- 50.Daly C. et al. Physiographically sensitive mapping of climatological temperature and precipitation across the conterminous United States. International journal of climatology 28, 2031–2064 (2008). [Google Scholar]
- 51.Schwede D. & Lear G. A novel hybrid approach for estimating total deposition in the United States. Atmospheric Enivironment 92, 207–220 (2014). [Google Scholar]
- 52.Grossman DHF-LD, , Weakley AS, Anderson M, Bourgeron P, Crawford R, Goodin K, Landaal S, Metzler K, Patterson KD, Pyne M, Reid M, and Sneddon L. International Classification of Ecological Communities: Terrestrial Vegetation of the United States. The National Vegetation Classification System: Development, Status, and Applications (The Nature Conservancy, Arlington, VA: ), Vol I. (1998). [Google Scholar]
- 53.NADP. National atmospheric deposition program (NADP). http://nadp.sws.uiuc.edu/. (accessed on October 2018).
- 54.Burnham K. a. D. A. Model Selection and Multimodel inference. (Springer, 2002). [Google Scholar]
- 55.O’brien RM A caution regarding rules of thumb for variance inflation factors. Quality & Quantity 41, 673–690 (2007). [Google Scholar]
- 56.Nilsson J. a. G. P. E. Critical loads for sulfur and nitrogen (Report 1988:15). (Nordic Council of Ministers, Copenhagen, Copenhagen, 1988). [Google Scholar]
- 57.Freyman WA, Masters LA & Packard S. The Universal Floristic Quality Assessment (FQA) Calculator: an online tool for ecological assessment and monitoring. Methods in Ecology and Evolution 7, 380–383 (2016). [Google Scholar]
- 58.Kattge J. et al. TRY–a global database of plant traits. Global change biology 17, 2905–2935 (2011). [Google Scholar]
- 59.USDA NRCS. The PLANTS Database (http://plants.usda.gov, 12 April 2019). National Plant Data Team, Greensboro, NC: 27401–4901 USA. (2019). [Google Scholar]
- 60.Stevens CJ, Wilson J. & McAllister HA Biological flora of the British Isles: Campanula rotundifolia. Journal of Ecology 100, 821–839 (2012). [Google Scholar]
Associated Data
This section collects any data citations, data availability statements, or supplementary materials included in this article.
Supplementary Materials
Data Availability Statement
The datasets generated during and/or analyzed during the current study are available in the EPA’s Environmental Dataset Gateway repository (https://edg.epa.gov/metadata/catalog/main/home.page) under the project name “Differential vulnerability of 348 herbaceous species to atmospheric deposition of nitrogen and sulfur across the contiguous U.S.” and dataset name “Herb species occurrence data across the US” (DOI: 10.23719/1500914).


