Fig 4.
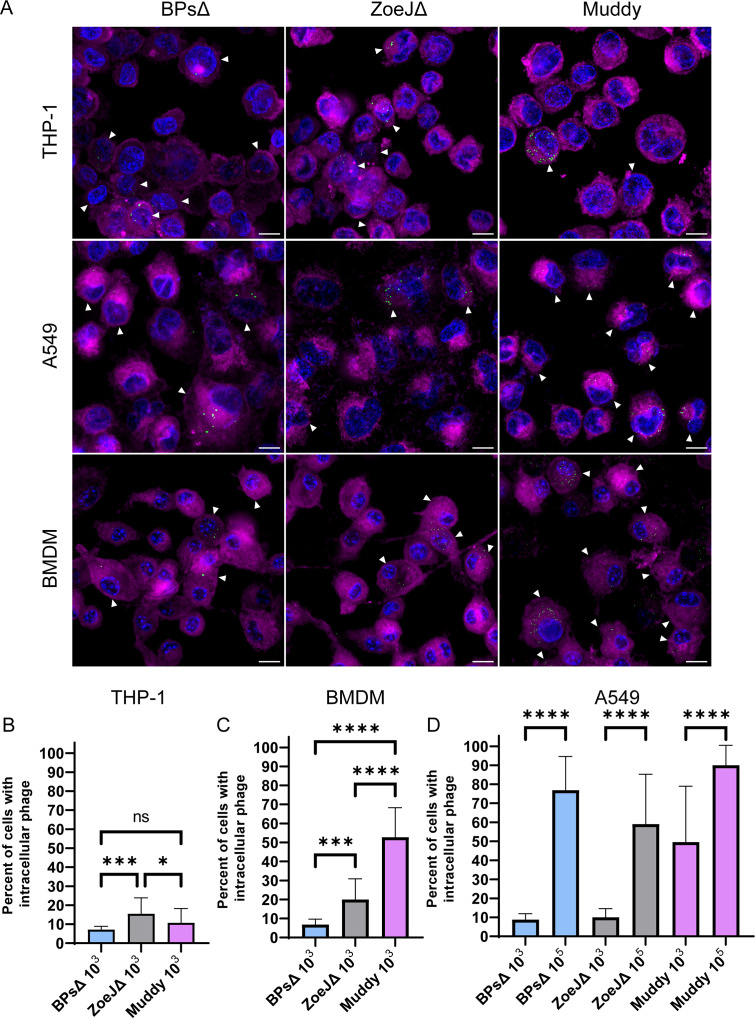
Mammalian cells internalize phage. Phages were stained with SYBR Gold and incubated with mammalian cells for 24 h. (A) Representative images of intracellular phage (green) at an MOI of 103. Mammalian cells were stained with CellMask plasma membrane (magenta) and DAPI (blue). White arrows indicate mammalian cells with intracellular phage puncta. Scale bar is 10 µm. Percentage of THP-1 cells (B), BMDMs (C), and A549 cells (D) with intracellular phage. For B and C, phage were added to mammalian cells at an MOI of 103. For D, phage were added at an MOI of 103 or 105. Error bars represent standard deviation from two independent experiments, each with a minimum of 14 fields of view counted. A minimum of 300 mammalian cells were counted per experiment. ns, not significant; *P < 0.05, ***P < 0.001, ****P < 0.0001 by Kruskal–Wallis one-way ANOVA with Dunn’s post hoc test.

