

Abstract
Objective
Magnetic resonance (MR) measures of muscle quality are highly sensitive to disease progression and predictive of meaningful functional milestones in Duchenne muscular dystrophy (DMD). This investigation aimed to establish the reproducibility, responsiveness to disease progression, and minimum clinically important difference (MCID) for multiple MR biomarkers at different disease stages in DMD using a large natural history dataset.
Methods
Longitudinal MR imaging and spectroscopy outcomes and ambulatory function were measured in 180 individuals with DMD at three sites, including repeated measurements on two separate days (within 1 week) in 111 participants. These data were used to calculate day‐to‐day reproducibility, responsiveness (standardized response mean, SRM), minimum detectable change, and MCID. A survey of experts was also performed.
Results
MR spectroscopy fat fraction (FF), as well as MR imaging transverse relaxation time (MRI‐T2), measures performed in multiple leg muscles, and had high reproducibility (Pearson's R > 0.95). Responsiveness to disease progression varied by disease stage across muscles. The average FF from upper and lower leg muscles was highly responsive (SRM > 0.9) in both ambulatory and nonambulatory individuals. MCID estimated from the distribution of scores, by anchoring to function, and via expert opinion was between 0.01 and 0.05 for FF and between 0.8 and 3.7 ms for MRI‐T2.
Interpretation
MR measures of FF and MRI T2 are reliable and highly responsive to disease progression. The MCID for MR measures is less than or equal to the typical annualized change. These results confirm the suitability of these measures for use in DMD and potentially other muscular dystrophies.
Introduction
Therapeutic development for Duchenne muscular dystrophy (DMD) has progressed rapidly in recent years, with conditional approvals of dystrophin‐restoration therapies in both the USA and Europe and myriad potential therapies in preclinical and clinical development. 1 However, robust demonstration of therapeutic efficacy has been a challenge in DMD. Many factors contribute to the difficulty of running successful trials in DMD, but it is widely agreed that sensitive biomarkers of disease progression are needed to improve trial design. 2
Magnetic resonance (MR) measures of muscle quality, particularly those that capture the replacement of muscle with fat, are highly promising biomarkers for DMD. MR measures are noninvasive and well‐tolerated by boys with DMD as young as 4 years, even without sedation, and can be measured before and after loss of ambulation. 3 , 4 , 5 , 6 Fat fraction (FF), quantified either using MR spectroscopy or chemical shift‐based (Dixon) imaging is commonly monitored in DMD studies 7 , 8 , 9 , 10 , 11 , 12 , 13 and show to be highly sensitive to disease progression. 9 , 14 Bulk muscle transverse relaxation time (MRI‐T2) is also frequently measured as a surrogate for FF or disease status; multiple investigations have shown that the bulk MRI‐T2 signal is strongly driven by fat content as DMD progresses. 15 , 16 Corticosteroids have been shown to alter muscle FF dynamics over the course of the disease, demonstrating the ability of MR biomarkers to detect therapeutic responses. 15 , 17 Finally, MR biomarkers correlate strongly with clinical outcomes in DMD, both cross‐sectionally and over time, with recent publications showing that measures of FF and bulk MRI‐T2 strongly predict time to loss of ambulation and hand‐to‐mouth function. 3 , 18 , 19 , 20 , 21 Collectively, the body of literature on MR biomarkers in DMD provides a compelling rationale for their inclusion in clinical trials in DMD.
As MR biomarkers are increasingly adopted in clinical trials, stakeholders including patients, clinicians, sponsors, and regulatory authorities require more information about the properties of these biomarkers, particularly across disease stages. Additional information about the reproducibility of these biomarkers, and the responsiveness of individual muscles to disease progression, is needed for clinical trial planning and interpretation. It is also critical to understand what degree of change in a biomarker is likely to be clinically important. 22 A frequently used metric in outcomes research is the minimum clinically important difference (MCID), which has been defined as “the smallest change that is important to patients.” 23 MCID can be determined based on the distribution of values for a biomarker, by anchoring changes in the biomarker to changes in clinical outcomes, or by developing consensus among experts in the area. 23 , 24 Thus, the purpose of this investigation was to evaluate the reproducibility, responsiveness to disease progression, and MCID for multiple MR biomarkers (MRS measures of FF and bulk muscle MRI‐T2) in individuals with DMD.
Subjects/Materials and Methods
The data used in this investigation were generated as part of the multisite ImagingDMD study (NCT01484678) which was approved by the Institutional Review Boards at three sites (University of Florida, Oregon Health & Science University, Children's Hospital of Philadelphia). The MR and functional protocols for ImagingDMD have been previously described. 8 , 25 , 26 Briefly, 180 individuals with DMD aged 4–18 years were recruited between 2010 and 2018, and each individual participated in annual follow‐up visits. The duration of follow‐up was 0–8 years, with a median of 4 years. This article includes data from all available subject visits, thus each individual may be represented more than once (925 total visits). In 111 ambulatory participants, baseline MR data collection was repeated on a subsequent day separated from the first visit by no more than a week. A preliminary analysis of a subset of these reproducibility data has been published previously. 27
MR data
At each annual study visit, participants completed a standardized set of MR measurements while positioned supine in the bore of a 3T MR scanner (University of Florida: Philips Achieva; Oregon Health & Science University: Siemens TIM Trio, later Siemens Prisma; Children's Hospital of Philadelphia: Siemens Verio TIM) as previously described. 27 Acquisitions included T1‐weighted three‐dimensional gradient‐echo images (repetition time [TR] = 17–25 ms, echo time [TE] = 1.9–2.4 ms, slice thickness = 2.8 mm, number of slices = 52), multi‐echo 2D spin‐echo images (TR = 3000 ms, TE = 20–320 ms (n = 16), slice thickness = 7 mm, slice gap = 3.5 mm, number of slices = 4–8, and single‐voxel 1H‐MRS (STEAM, TR = 3000 ms, TE = 108 ms, voxel size ≈10 × 20 × 40 mm). The same voxel was used to acquire multi‐echo 1H‐MR spectra and measure water T2 to calculate FF (TR = 9000 ms, TE = 11–288 ms [n = 4–16]). Example gradient‐echo images and MRS voxels are shown (Fig. 1).
Figure 1.

Magnetic resonance images (gradient echo) from the mid‐thigh and fullest part of the calf of three boys with Duchenne muscular dystrophy, a 7‐year‐old who can rise from the floor (Group I), a 10‐year‐old who can walk but cannot rise from the floor (Group II), and a 14‐year‐old who is nonambulatory (Group III). White boxes illustrate the voxel used for MRS acquisition, and the measured fat fraction value from the vastus lateralis in the thigh and soleus in the calf are given for each subject.
Following acquisition, spin‐echo images were automatically processed to estimate the transverse relaxation time (T2) for each pixel by fitting a single exponential model to the magnitude signal intensity for TE values from 40 to 100 ms. Individual muscle borders for the tibialis anterior (TA), tibialis posterior (TP) peroneus longus and brevis (PER), soleus (SOL), medial gastrocnemius (MG), long head of the biceps femoris (BFLH), and vastus lateralis (VL) muscles were manually traced on three contiguous slices by trained analyzers. All analyses took place at a standardized internal anatomical landmark (lower leg: the most distal slice where the popliteus is visible; upper leg: the most proximal slice where the biceps femoris short head is visible). To ensure that measured MRI‐T2 values are derived from muscle tissue, region of interest (ROI) boundaries were drawn slightly inside the muscle border, and prominent intramuscular fasciae were excluded.
Processing of MR spectra was fully automated and included integration of peak areas, which were used to calculate a muscle FF (fat peak area/[fat peak area + water peak area]). To generate TR/TE‐independent estimates of FF, 1H spectra were relaxation‐corrected using previously established group mean values for the T1 of water and fat and the T2 of fat; water T2 was measured for each individual by fitting the water peaks of the 1H MR spectra acquired with different TEs with a single exponential model. 8 MR spectra, T2 maps, and ROIs were visually inspected by at least one experienced reviewer for quality control, who flagged data that were invalid due to motion or other MR artifacts or due to inaccurate ROI delineation.
Functional data
All ambulatory participants completed a standardized battery of functional tests that included the 6‐min walk test, 10 m walk/run test, four stair climb test, and supine to stand test during each annual visit. 25
Survey of experts
An IRB‐approved, anonymous survey was performed of experts in quantitative MR biomarkers for DMD. The invited experts consisted of the first and last authors of articles published between 2000 and 2020 which used quantitative FF or MRI T2 in skeletal muscle in people with DMD. Experts were also asked to recommend other survey participants; these individuals were also included. In the survey, experts were asked to estimate the MCID for 12 different clinical scenarios which varied in terms of the subject's age (5, 10, and 13 years old) and disease stage (early ambulatory, late ambulatory, and nonambulatory), the target muscle (quadriceps, VL, TA, and gluteus maximus), and the baseline FF (0.05, 0.30, and 0.60).
Statistical analysis
Data collected on two subsequent days were used to calculate reproducibility. Pearson correlations between day 1 and day 2 values were estimated for the full group and each site separately. Composite FF and MRI‐T2 values were calculated as an average of the values for each muscle, where the contribution of each muscle was equal regardless of muscle size. For FF, these were the VL and SOL and for MRI‐T2, these were the VL, BFLH, SOL, PER, and MG. TA and TP were included for reproducibility and responsiveness analyses. Because these muscles progress very slowly and have lower reproducibility, they were excluded from the composite used for MCID analyses. Longitudinal changes in MR measures are calculated as annualized change: The change in variables between two consecutive visits for each individual was divided by the interval between visits in years. Visits less than 6 months apart or more than 2 years apart were excluded. Responsiveness is reported as the standardized response mean (SRM): the group mean annualized change divided by the standard deviation of the annualized change. Most participants (75%) in the ImagingDMD study have at least three annual study visits, including some early in the disease and some later in the disease. To avoid underestimation of uncertainty given the use of multiple intervals from the same individual, we used a bootstrap approach to calculating uncertainty, in which we resample individuals 1000 times with replacement, and report the 95% confidence intervals of this bootstrap sample.
Data were grouped into three categories as follows, based on the importance of loss of ambulation as a disease milestone, and the strong relationship between loss of ability to rise and subsequent loss of ability to walk 28 : Group I: subjects who could stand up from the floor in less than 45 s; Group II: subjects who had lost the ability to stand from the floor: Group III: subjects who could not complete the 10 m walk–run unassisted within 45 s. Day‐to‐day correlation coefficients assessed in the reproducibility sample were used to calculate standard error of measurement (SEM) for each functional subgroup as group standard deviation × √(1‐R). SEM was then used to calculate the minimum detectable change (MDC) at the 95% confidence level as 1.96 × SEM/√2. 23 MDC is the change that falls outside the measurement error. MCID was estimated for functional subgroups using the 1/3 SD distribution‐based method, as previously done in DMD. 29 For each of these estimates, uncertainty was estimated using bootstrap resampling. MCID was also calculated by anchoring to functional outcomes. Two outcomes were used: (1) the Vignos scale (also known as the Modified Brooke Lower Extremity Scale), which captures meaningful declines in motor ability and has previously been used to anchor MCID estimates in DMD, 30 , 31 and (2) 6MWD, which has an accepted MCID of 30 m in individuals with DMD 29 and which has previously been used to anchor MCID estimates in DMD. 32 Annual intervals in which the Vignos score was stable, or in which the annualized decrease in 6MWD was ≤30 m were included in the “stable” group, and annual intervals in which Vignos score increased or the annualized decrease in 6MWD was >30 m were included in the “progression” group. Because the Vignos score and 6MWT only measure lower extremity function, annual intervals after the individual reported full time wheelchair use (Vignos score = 9) were not included in the analysis. Further details of the baseline scores for the stable and progression are provided in Table S1. A recent review describes statistical methods for calculating the MCID by anchoring. 33 In this investigation, we used the two most common methods: change difference and receiver operating curve (ROC) analysis. 33 To calculate the change difference, we subtracted the mean MR change in the stable group from the mean MR change in the progression group. To conduct ROC analysis, we ordered the observed MR values, and averaged each pair of adjacent values to give a series of thresholds. For each threshold, we associated each data point with a label (A: annualized change exceeds threshold and Vignos score progressed, B: annualized change exceeds threshold and Vignos score stable, C: annualized change does not exceed threshold and Vignos score progressed, D: annualized change does not exceed threshold and Vignos score stable. For each threshold, we counted the data points that fell into each group, and used those counts to calculate the sensitivity (as A/(A + C)) and specificity (as D/(D + B)) to discriminate “stable” and “progression” groups. Youden's Index was calculated for each threshold as (sensitivity + specificity – 1). The threshold corresponding to the maximal value of Youden's Index is reported as the MCID. 23 , 34 Knime Analytics Platform (version 4.4.1) was used for all analyses.
Results
Description of the cohort at different disease stages
Subjects in Group I were 9.3 ± 2.4 years old, subjects in Group II were 12.2 ± 2.3 years, and subjects in Group III were 13.7 ± 2.6 years old. Aggregated MR baseline values and annual changes for these groups are presented in Table 1.
Table 1.
Average values and annualized changes in magnetic resonance measures at different disease stages, to characterize the group and provide context for minimum clinically important difference estimates.
| Disease stage | Fat fraction | MRI‐T2 (ms) | |||||||
|---|---|---|---|---|---|---|---|---|---|
| VL | SOL | Composite | VL | BFLH | MG | PER | SOL | Composite | |
| Group mean value—all annual visits | |||||||||
| Group I (147 subjects, 494 observations) | 0.18 (0.15, 0.20) | 0.10 (0.09, 0.11) | 0.14 (0.12, 0.15) | 48.0 (46.7, 49.4) | 51.1 (49.4, 52.8) | 42.2 (41.3, 43.1) | 42.5 (41.6, 43.5) | 42.5 (41.7, 43.3) | 45.2 (44.2, 46.2) |
| Group II (85 subjects, 155 observations) | 0.48 (0.45, 0.50) | 0.23 (0.20, 0.26) | 0.35 (0.33, 0.38) | 64.6 (63.0, 66.2) | 68.5 (66.3, 70.5) | 50.1 (48.1, 52.1) | 52.9 (50.1, 53.9) | 50.2 (48.4, 52.0) | 56.8 (55.2, 58.4) |
| Group III (56 subjects, 140 observations) | 0.64 (0.61, 0.67) | 0.42 (0.38, 0.46) | 0.52 (0.49, 0.55) | 71.6 (70.3, 72.8) | 75.7 (74.2, 77.2) | 57.8 (55.8, 59.8) | 58.5 (56.5, 60.3) | 57.9 (56.1, 59.6) | 63.9 (62.6, 65.2) |
| Annualized change—all annual intervals | |||||||||
| Group I (129 subjects, 365 observations) | 0.06 (0.06, 0.07) | 0.02 (0.02, 0.03) | 0.04 (0.04, 0.05) | 3.7 (3.2, 4.2) | 4.4 (3.8, 5.0) | 1.3 (1.0, 1.7) | 1.7 (1.4, 2.1) | 1.4 (1.2, 1.8) | 2.5 (2.2, 2.9) |
| Group II (63 subjects, 109 observations) | 0.08 (0.07, 0.09) | 0.06 (0.05, 0.08) | 0.07 (0.06, 0.08) | 4.2 (3.3, 5.0) | 4.1 (3.3, 5.0) | 2.7 (1.8, 3.8) | 3.3 (2.5, 4.2) | 3.1 (2.3, 4.1) | 3.7 (3.1, 4.4) |
| Group III (40 subjects, 82 observations) | 0.07 (0.05, 0.09) | 0.07 (0.06, 0.09) | 0.07 (0.06, 0.09) | 2.2 (1.2, 3.2) | 0.8 (−0.3, 1.8) | 2.0 (1.1, 2.9) | 1.6 (0.6, 2.5) | 2.3 (1.6, 3.1) | 1.8 (0.8, 2.7) |
Each visit is included; thus, individuals are represented more than once and may be included in multiple function groups. Numbers in parentheses represent the 95% confidence intervals of the bootstrap.
Reproducibility
The day‐to day reproducibility cohort consisted of 111 subjects aged 8.4 ± 2.2 years. Because these visits occurred at the first study visit, 100% of reproducibility assessments were made in ambulatory participants, 91% of whom could rise from the floor. Fatty infiltration and MRI‐T2 were low in a large majority of participants during this first study visit (FF: VL: 0.19 ± 0.19, SOL: 0.10 ± 0.07, composite: 0.14 ± 0.12; MRI‐T2: VL: 48.0 ± 10.6 ms, BFLH: 49.9 ± 12.9 ms, MG: 42.6 ± 7.4 ms, PER: 43.0 ± 7.8, SOL 42.8 ± 7.1 ms, TA: 36.9 ± 5.8 ms, TP: 36.5 ± 4.9 ms, composite 42.2 ± 8.7 ms). MRI‐T2 and MRS measures of FF were highly reproducible from day to day (Fig. 2). Absolute day‐to‐day differences were slightly higher in the upper leg than the lower leg but did not exceed 0.02 for FF and 2 ms for MRI‐T2 (FF: VL: 0.02 ± 0.02, SOL: 0.01 ± 0.01, composite: 0.01 ± 0.01; MRI‐T2: VL: 1.9 ± 1.8 ms, BFLH: 1.7 ± 1.7 ms, MG: 1.3 ± 1.2 ms, PER: 1.2 ± 1.0, SOL 1.1 ± 1.3 ms, TA: 1.2 ± 1.5 ms, TP: 1.2 ± 1.3 ms, composite 0.8 ± 0.6 ms). Each site had similarly high correlations between Day 1 and Day 2 MR measure values.
Figure 2.

Day‐to‐day reproducibility of MRI and MRS biomarkers in ambulatory individuals with Duchenne muscular dystrophy, with Pearson correlation coefficient for the group as a whole as well as for each site separately.
Responsiveness
Composite (VL and SOL for FF; VL, BFLH, SOL, PER, MG, TA, and TP for MRI‐T2) MR measures were highly responsive in all three disease progression groups (Fig. 3). For individual muscles, proximal muscles (VL and BFLH) were more responsive in group I while distal muscles (SOL and MG) were more responsive in Group III (Fig. 3). Responsiveness and annualized change in FF varied based on initial FF (Fig. 4). In the VL muscle, annualized changes were high (0.08 or greater) when initial FF values fell between 0.1 and 0.5. In the SOL, annualized changes were in general lower than the VL, particularly at low initial FFs (<0.2). Illustrating the potentially broad sensitivity of composite biomarkers, composite FF changes were high at FFs between 0.1 and 0.6.
Figure 3.
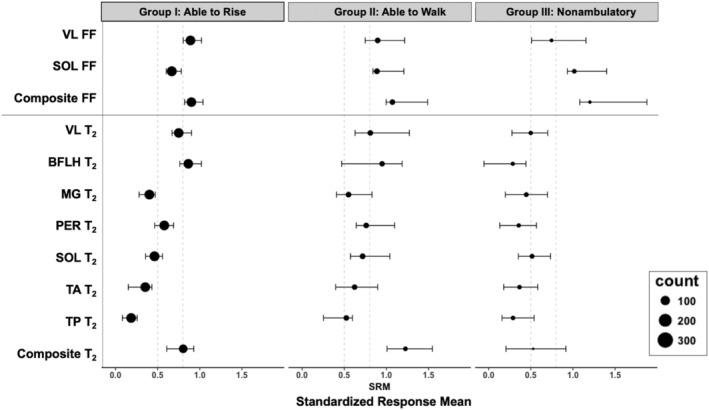
Responsiveness of magnetic resonance biomarkers at different disease stages. The size of each bubble corresponds to the number of data points available to calculate the standardized response mean (SRM) value; SRM is increasingly robust with larger sample sizes. Error bars show the 95% confidence intervals of the bootstrap. Vertical lines at 0.5 and 0.8 indicate traditional thresholds for medium and large effect sizes.
Figure 4.

Annualized change in fat fraction (FF) is dependent on baseline FF value, with small changes at low FFs and higher values at mid‐range FF values. Composite FF has relatively large changes across a wider range of values than either vastus lateralis or soleus FF.
Minimum clinically important difference
Based on the lower reproducibility and relatively low responsiveness of the TA and TP muscles across disease stages, these muscles were excluded from calculation of the MCID, both as individual variables and in calculation of composite biomarkers. Table 2 shows several estimates of MCID for all three functional subgroups. For FF, all MCID estimates were between 0.01 and 0.05 (Table 2). For MRI‐T2, all MCID estimates were between 1 and 4 ms. For FF, MDC was 0.03–0.05 except for the SOL in Group III; for MRI‐T2, MDC was 2–4 ms except for the VL in Group I. These estimates likely represent a threshold for change that is both clinically important and detectable. Annualized changes in MR values generally exceed these thresholds for FF, and are similar to these values for MRI‐T2 (Table 1). To confirm the MCID for FF by expert opinion, we invited 42 individuals with expertise in MR measurement of FF to participate in a survey, of whom 13 responded (30% response rate, with one respondent declining to participate due to insufficient expertise). The median MCID for FF across experts and scenarios was 0.05%, and 94% of MCID estimates were 0.10 or less.
Table 2.
Estimates of minimum clinically important difference in individuals with Duchenne muscular dystrophy.
| Fat fraction | MRI‐T2 | ||||||||
|---|---|---|---|---|---|---|---|---|---|
| VL | SOL | Composite | VL | BFLH | MG | PER | SOL | Composite | |
| Distribution‐based (SEM method) | |||||||||
| Group I | 0.02 (0.01, 0.02) | 0.01 (0.01, 0.01) | 0.01 (0.01, 0.01) | 1.6 (1.5, 1.9) | 1.4 (1.3, 1.6) | 1.1 (1.0, 1.3) | 1.0 (0.8, 1.2) | 1.0 (0.9, 1.2) | 0.7 (0.6, 0.8) |
| Group II | 0.02 (0.01, 0.02) | 0.02 (0.02, 0.02) | 0.01 (0.01, 0.01) | 1.5 (1.3, 1.8) | 1.2 (1, 1.4) | 1.5 (1.2, 1.7) | 1.3 (1.1, 1.5) | 1.5 (1.2, 1.8) | 0.7 (0.6, 0.8) |
| Group III | 0.01 (0.01, 0.02) | 0.02 (0.02, 0.03) | 0.01 (0.01, 0.01) | 1 (0.8, 1.2) | 0.8 (0.6, 1) | 1.5 (1.2, 1.8) | 1.3 (1, 1.4) | 1.5 (1.2, 1.8) | 0.6 (0.5, 0.7) |
| Distribution‐based (1/3 SD method) | |||||||||
| Group I | 0.05 (0.04, 0.05) | 0.02 (0.02, 0.03) | 0.03 (0.03, 0.04) | 2.9 (2.6, 3.2) | 3.6 (3.3, 4.0) | 1.9 (1.7, 2.2) | 1.9 (1.6, 2.3) | 1.6 (1.4, 1.9) | 2.1 (1.8, 2.3) |
| Group II | 0.05 (0.04, 0.05) | 0.04 (0.04, 0.05) | 0.04 (0.04, 0.05) | 2.7 (2.3, 3.0) | 3.0 (2.5, 3.6) | 2.5 (2.2, 2.8) | 2.6 (2.2, 2.9) | 2.4 (1.9, 2.7) | 2.2 (1.8, 2.4) |
| Group III | 0.04 (0.04, 0.05) | 0.05 (0.05, 0.06) | 0.04 (0.04, 0.05) | 1.8 (1.5, 2.1) | 2.0 (1.6, 2.4) | 2.6 (2.1, 3) | 2.5 (2, 2.9) | 2.3 (1.8, 2.8) | 1.8 (1.5, 2) |
| Anchor‐based (Change difference) | |||||||||
| Vignos score | 0.03 (0.02, 0.05) | 0.03 (0.02, 0.04) | 0.03 (0.02, 0.04) | 0.8 (−0.2, 1.8) | 1.4 (−0.1, 2.9) | 1.7 (0.8, 2.6) | 1.6 (0.9, 2.4) | 1.6 (0.8, 2.4) | 1.5 (0.7, 2.2) |
| 6MWD | 0.04 (0.03, 0.06) | 0.02 (0.01, 0.02) | 0.03 (0.02, 0.04) | 3.7 (2.5, 4.8) | 2.2 (0.7, 3.5) | 1.8 (1, 2.7) | 1.6 (0.8, 2.4) | 1.5 (0.7, 2.4) | 2.2 (1.4, 3.1) |
| Anchor‐based (ROC) | |||||||||
| Vignos score | 0.05 (0.05, 0.10) | 0.04 (0.03, 0.05) | 0.05 (0.05, 0.08) | 4.0 (2.3, 5.7) | 1.5 (−0.5, 8.6) | 3.7 (2.8, 4.7) | 2.4 (1.9, 5.1) | 3.1 (1.9, 3.6) | 2.4 (1.0, 4.6) |
| 6MWD | 0.02 (0.02, 0.07) | 0.02 (0.01, 0.03) | 0.01 (0.01, 0.06) | 2.2 (0.7, 4.1) | 1.9 (0.7, 2.8) | 1.1 (−0.7, 1.8) | 1.9 (−0.4, 2.8) | 1.4 (0.4, 1.9) | 1.3 (0.7, 2.1) |
| Minimum detectable change | |||||||||
| Group I | 0.04 (0.04, 0.05) | 0.03 (0.02, 0.03) | 0.03 (0.02, 0.03) | 4.5 (4.2, 5.2) | 3.9 (3.6, 4.3) | 3.1 (2.7, 3.7) | 2.7 (2.3, 3.3) | 2.9 (2.6, 3.3) | 1.9 (1.7, 2.2) |
| Group II | 0.04 (0.04, 0.05) | 0.05 (0.04, 0.06) | 0.03 (0.03, 0.04) | 4.1 (3.7, 5) | 3.3 (2.8, 3.9) | 4.2 (3.4, 4.6) | 3.7 (3, 4.1) | 4.2 (3.4, 5) | 2.0 (1.7, 2.2) |
| Group III | 0.04 (0.03, 0.04) | 0.07 (0.06, 0.07) | 0.03 (0.03, 0.04) | 2.8 (2.3, 3.3) | 2.2 (1.7, 2.7) | 4.2 (3.4, 5.0) | 3.5 (2.9, 4.0) | 4.1 (3.3, 5.0) | 1.6 (1.4, 1.9) |
Numbers in parentheses represent the 95% confidence intervals of the bootstrap.
Discussion
In this investigation, we have documented day‐to‐day reproducibility, responsiveness to disease progression, and MCID of a set of candidate MR biomarkers for clinical trials for DMD. We investigated these properties at multiple stages of DMD progression—boys and men who could rise from the floor (Group I), boys and men unable to rise but able to walk (Group II), and nonambulatory boys and men (Group III), since these groups are frequently targeted for different clinical trials, and the optimal imaging biomarker may differ across disease stages. Additionally, we have included both individual muscle biomarker values and composite biomarker values calculated as the mean of the individual muscle values. Overall, we found that each MR measure had high reproducibility, and that composite biomarkers, particularly composite MRS FF of SOL and VL, were highly responsive to disease progression not just within a group but across all three groups and across a wide range of initial FFs. Finally, we found that the estimated MCID varied with the muscle, disease stage, and method of estimation, with estimates between 0.01 and 0.05 for FF and between 2 and 4 ms for MRI‐T2. These MCID values were established for disease progression; further research should establish the MCID of MR biomarkers in the context of effective therapeutic intervention for DMD.
In the early phase of this study, we published day‐to‐day reproducibility of MR biomarkers in 30 young boys with DMD. 27 Here, we extend the dataset to over 100 individuals and confirm the high reproducibility of the measurements, including calculated composites. Pearson's estimated correlation [R] was greater than or equal to 0.95 for all measurements except MRI‐T2 in the TA and TP, which had R > 0.8 Notably, the absolute day‐to‐day difference in MRI‐T2 was similar in all five lower leg muscles, so the lower correlation may be a result of the smaller range of values seen in the TA and TP. These two muscles are known to progress very slowly in DMD, 15 which was also reflected in their low responsiveness to disease progression across all functional stages. We take these results to indicate that FF and MRI‐T2 of these muscles are not likely to be ideal candidate biomarkers to detect efficacy of new therapies in individuals with DMD, and thus we did not include the TA or TP in our analysis of MCID for this population. MRS FF values were slightly more variable day‐to‐day in the VL compared with the SOL (Fig. 2). We believe that this is likely to be attributable to methodological rather than biological considerations. The upper leg is positioned further from the center of the MRI scanner during acquisition, and while the calf was scanned using an 8‐channel knee coil that was fixed to the table at 2/3 sites, 35 the thigh was scanned using coil that was fixed to the leg rather than the scanner bed, and that had fewer channels. Thus, the opportunity for movement was greater, and the signal‐to‐noise ratio was less, for the thigh compared with the calf. Finally, per protocol, the thigh was scanned after the calf, which may have led to challenges with attention span in some young participants. Future studies should consider scan order and coil selection to ensure optimal quality for the primary MR outcomes. Day‐to‐day reproducibility was similarly high across all three study sites, reflecting the study team's commitment to ensuring that data are collected/processed in a standardized manner.
The high responsiveness of MR biomarkers to disease progression in DMD is well established 5 , 9 , 12 , 36 , 37 , 38 and provides a compelling rationale for the inclusion of these biomarkers in clinical trials. MR biomarkers are likely to improve statistical power to detect a treatment‐related slowing of disease progression. In leveraging these highly responsive biomarkers, however, choosing the optimal primary MR outcome and muscle group(s) for specific studies can further strengthen the power of the measures. In this study, we examined responsiveness across multiple muscles, disease stages, and initial FF values. In ambulatory individuals, the proximal muscles (VL and BFLH) are most responsive, while in nonambulatory individuals, these muscles show relatively low responsiveness. The responsiveness of MRI‐T2 variables, particularly in the SOL muscle, was reduced in nonambulatory individuals compared with the responsiveness of FF. Alterations in water T2 at high FFs have been reported, 39 and other changes associated with loss of loading may contribute to this pattern. The most important outcome from this analysis is that composite biomarkers incorporating both upper and lower leg muscles are highly responsive throughout the range of disease stages investigated here: composite FF has SRM > 0.90 in all three functional groups, and composite FF maintains high responsiveness at initial FFs ranging from 0.10 to 0.60. The availability of broadly responsive MR measures could potentially expand the age window for inclusion in clinical trials. Ongoing work in our group aims to identify a statistically optimal approach to generating a composite MR measurement.
A key focus of this article was the calculation of MCID through three approaches: distribution‐based, anchored to function, and via expert opinion. Multiple distribution‐based approaches have been used in DMD, including defining MCID as the SEM and as 1/3 SD. 29 , 31 In this study, we additionally calculated the MDC, defined as the minimal change that falls outside the measurement error, and the MCID based on anchoring to the Vignos scale. 33 All MCID estimates were ≤0.05 for FF or ≤4 ms for MRI‐T2. The MDC for FF was typically less than or equal to the MCID, however, the MDC for MRI‐T2 was typically slightly greater than the MCID. Where the MDC exceeds the MCID, the change should exceed both values to be considered meaningful. The MDC for composite (mean) measures was lower than for individual muscle estimates, underscoring the strong potential of these measures for monitoring disease progression in DMD. Expert opinion confirmed the distribution‐based and anchoring‐based estimates of MCID for FF, with a median value of 0.05 (calculated based on 11 different scenarios). However, experts were sometimes more conservative, with ~one third of responses between 0.10 and 0.12. Use of the MCID values presented in this article to draw clinical conclusions requires careful consideration, since the estimates vary by method, muscle, and disease stage. In some groups or muscles, even a 0.03 change in FF or a 2 ms change in MRI‐T2 may represent a detectable clinically meaningful change (e.g., a study with very low measurement variability in a rapidly progressing study cohort). This is less than half of the observed change at mid‐range baseline FFs (0.1–0.6 for VL and composite FFs, 0.2–0.4 for SOL, Fig. 4). For most studies, a relatively conservative threshold of 0.05 for FF or 4 ms for MRI‐T2 may be appropriate. For some studies, even higher thresholds may be necessary. Notably, the observed annualized changes in FF generally exceed the MCID and MDC; most boys with DMD experience detectable and meaningful progression in MR‐measured muscle quality in a 1 year period.
This study has several limitations. Day‐to‐day reproducibility was assessed at the beginning of the study, which recruited a young, highly functional cohort, so reproducibility at different disease stages could not be investigated. Similarly, the nonambulatory cohort primarily includes individuals in the early nonambulatory stage of DMD due to the characteristics of the study population at baseline. This investigation does not include chemical shift‐based (Dixon) imaging, which is a common method of measuring FF in DMD. Previous investigations have found that MRS FF is closely related to Dixon FF, 8 , 40 suggesting that the responsiveness and MCID for the two variables may be similar, especially in older patients when the fat signal is more prominent. When calculating the MCID by anchoring, each anchor has limitations. For the Vignos score, intervals between scores do not necessarily represent the same amount of disease progression, and the number of individuals with Vignos scores between 3 and 6 is very low (Table S1). For both the Vignos score and the 6MWT, individuals who experienced disease progression may have experienced the minimum clinically important change (e.g., 30–35 m decline in distance) or may have experienced much greater than minimal change (e.g., 100 m decline in distance). Finally, survey response rates were only 30%, and experts from some countries did not participate due to local ethics regulations, so the results of this study represent only a subset of expert opinions in the field.
We have quantitatively investigated several key considerations in the use of MR biomarkers for clinical trials in DMD in this article, including the reproducibility, responsiveness, and MCID. However, the selection of the most appropriate primary MR outcome for each trial must include a holistic consideration of numerous factors. The likelihood of the measurement to respond to therapeutic intervention is critical. Muscles with little remaining muscle tissue present limited therapeutic target, which may blunt the response, while muscles that are not responsive to disease progression in the target population may not detect a drug effect even if one is present. Additionally, the mechanism of action of the drug should be considered; for dystrophin restoration therapies, where stabilization of the cell membrane is expected to result in a slowing of muscle deterioration reflected in slowed fat accumulation, FF is an appealing primary outcome. However, therapies that are expected to have an anti‐inflammatory mechanism may want to consider using a T2 measurement to capture that change. The meaningfulness of the biomarker for the trial participants is also important—many investigators have demonstrated strong links between functional outcomes and MR biomarkers, indicating that slowed MR biomarker progression can reasonably be expected to slow functional decline. 10 , 18 , 19 , 21 Finally, feasibility will determine the quality of the data acquired. For a single‐site early stage study, the inclusion of novel MR biomarkers of fiber integrity or energetics might provide very valuable information about the action of the drug. However, for multi‐site and/or international trials, it is important to use biomarkers that can be reliably implemented and harmonized across sites, MR scanner vendors, and MR operators. We have successfully implemented both MRS FF and MRI‐T2 measurements across numerous international sites in clinical trials, confirming the suitability of these measurements in DMD (NCT02851797, NCT02858362, and NCT02439216). Finally, robust data quality control procedures and centralized data processing are critical to data quality; all data acquired in this study underwent quality control inspection and were managed and processed at the University of Florida.
In conclusion, this investigation has shown that MR biomarkers of muscle fat infiltration have high reproducibility and responsiveness to disease progression, with composite MR biomarkers showing high sensitivity and low minimum detectable change across multiple disease stages. A comprehensive analysis of the MCID for MR biomarkers, including multiple data analysis strategies as well as a survey of experts in the field, has shown that the MCID probably falls between 0.01 and 0.05 for FF and between 1 and 4 ms for MRI‐T2. These data are critical for clinical trial planning in DMD. Additionally, the estimates of MCID presented in this article will allow patients, families, clinicians, and researchers to interpret the results of clinical trials using MR biomarkers.
Author Contributions
Study conception and design: Rebecca J. Willcocks, Michael J. Daniels, Sean C. Forbes, Erika L. Finanger, William D. Rooney, Dah‐Jyuu Wang, Donovan J. Lott, Claudia R. Senesac, Glenn A. Walter, H. Lee Sweeney, and Krista Vandenborne. Data acquisition: Rebecca J. Willcocks, Alison M. Barnard, Sean C. Forbes, John F. Brandsema, Erika L. Finanger, William D. Rooney, Dah‐Jyuu Wang, Donovan J. Lott, Claudia R. Senesac, Glenn A. Walter, and Krista Vandenborne. Data analysis and interpretation: Rebecca J. Willcocks, Alison M. Barnard, Michael J. Daniels, Sean C. Forbes, William T. Triplett, John F. Brandsema, Erika L. Finanger, William D. Rooney, Sarah Kim, Dah‐Jyuu Wang, Donovan J. Lott, Claudia R. Senesac, Glenn A. Walter, H. Lee Sweeney, and Krista Vandenborne. Article drafting or revision: Rebecca J. Willcocks, Alison M. Barnard, Michael J. Daniels, Sean C. Forbes, John F. Brandsema, Erika L. Finanger, William D. Rooney, Sarah Kim, Donovan J. Lott, Claudia R. Senesac, Glenn A. Walter, H. Lee Sweeney, and Krista Vandenborne. All authors have reviewed the results and approved the final version of the article.
Conflict of Interest Statement
The authors do not report any conflicts of interest that are directly relevant to this study.
Supporting information
Supplementary Figure 1. Bland–Altman difference versus average plots of the day‐to‐day MRI biomarker values.
Supplementary Table 1. Number of individuals who were in the stable versus progression group for each Vignos score and baseline 6MWD.
Acknowledgements
This study was supported by grant funding from the National Institute of Arthritis and Musculoskeletal and Skin Diseases and the National Institute of Neurological Disorders and Stroke of the National Institutes of Health (R01‐AR056973 and U54‐AR052646). MRI data was collected in the McKnight Brain Institute at the National High Magnetic Field Laboratory's Advanced Magnetic Resonance Imaging and Spectroscopy (AMRIS) Facility, which is supported by National Science Foundation Cooperative Agreement No. DMR‐1644779 and DMR‐1157490 and the State of Florida, and in OHSU's Advanced Imaging Research Center, supported by NIH S10OD021701 for the 3T Siemens Prisma MRI instrument. AMB was supported by a Rehabilitation Research Career Development Award (NIH K12 HD055929). The content of this study is solely the responsibility of the authors and does not necessarily represent the official views of the National Institutes of Health or other funders. We are very grateful to the study participants and their families.
Funding Statement
This work was funded by National Institute of Arthritis and Musculoskeletal and Skin Diseases grants R01‐AR056973 and U54‐AR052646; National Institutes of Health grant NIH S10OD021701; National Science Foundation grants DMR‐1157490 and DMR‐1644779; State of Florida .
References
- 1. Verhaart IEC, Aartsma‐Rus A. Therapeutic developments for Duchenne muscular dystrophy. Nat Rev Neurol. 2019;15(7):373‐386. [DOI] [PubMed] [Google Scholar]
- 2. US Department of Health and Human Services F, Center for Drug Evaluation and Research (CDER), Center for Biologics Evaluation and Research . Duchenne Muscular Dystrophy and Related Dystrophinopathies: Developing Drugs for Treatment Guidance for Industry. 2018.
- 3. Naarding KJ, van der Holst M, van Zwet EW, et al. Association of Elbow Flexor MRI fat fraction with loss of hand‐to‐mouth movement in patients with Duchenne muscular dystrophy. Neurology. 2021;97:e1737‐e1742. [DOI] [PMC free article] [PubMed] [Google Scholar]
- 4. Finkel RS, Finanger E, Vandenborne K, et al. Disease‐modifying effects of edasalonexent, an NF‐kappaB inhibitor, in young boys with Duchenne muscular dystrophy: results of the MoveDMD phase 2 and open label extension trial. Neuromuscul Disord. 2021;31(5):385‐396. [DOI] [PubMed] [Google Scholar]
- 5. Ricotti V, Evans MR, Sinclair CD, et al. Upper limb evaluation in Duchenne muscular dystrophy: fat‐water quantification by MRI, muscle force and function define endpoints for clinical trials. PloS One. 2016;11(9):e0162542. [DOI] [PMC free article] [PubMed] [Google Scholar]
- 6. Wary C, Azzabou N, Giraudeau C, et al. Quantitative NMRI and NMRS identify augmented disease progression after loss of ambulation in forearms of boys with Duchenne muscular dystrophy. NMR Biomed. 2015;28(9):1150‐1162. [DOI] [PubMed] [Google Scholar]
- 7. Lott DJ, Forbes SC, Mathur S, et al. Assessment of intramuscular lipid and metabolites of the lower leg using magnetic resonance spectroscopy in boys with Duchenne muscular dystrophy. Neuromuscul Disord. 2014;24(7):574‐582. [DOI] [PMC free article] [PubMed] [Google Scholar]
- 8. Triplett WT, Baligand C, Forbes SC, et al. Chemical shift‐based MRI to measure fat fractions in dystrophic skeletal muscle. Magn Reson Med. 2014;72(1):8‐19. [DOI] [PMC free article] [PubMed] [Google Scholar]
- 9. Willcocks RJ, Rooney WD, Triplett WT, et al. Multicenter prospective longitudinal study of magnetic resonance biomarkers in a large duchenne muscular dystrophy cohort. Ann Neurol. 2016;79(4):535‐547. [DOI] [PMC free article] [PubMed] [Google Scholar]
- 10. Naarding KJ, Reyngoudt H, van Zwet EW, et al. MRI vastus lateralis fat fraction predicts loss of ambulation in Duchenne muscular dystrophy. Neurology. 2020;94(13):e1386‐e1394. [DOI] [PMC free article] [PubMed] [Google Scholar]
- 11. Sherlock SP, Zhang Y, Binks M, Marraffino S. Quantitative muscle MRI biomarkers in Duchenne muscular dystrophy: cross‐sectional correlations with age and functional tests. Biomark Med. 2021;15(10):761‐773. [DOI] [PMC free article] [PubMed] [Google Scholar]
- 12. Nagy S, Schadelin S, Hafner P, et al. Longitudinal reliability of outcome measures in patients with Duchenne muscular dystrophy. Muscle Nerve. 2020;61(1):63‐68. [DOI] [PubMed] [Google Scholar]
- 13. Bonati U, Hafner P, Schadelin S, et al. Quantitative muscle MRI: a powerful surrogate outcome measure in Duchenne muscular dystrophy. Neuromuscul Disord. 2015;25(9):679‐685. [DOI] [PubMed] [Google Scholar]
- 14. Fischmann A, Hafner P, Fasler S, et al. Quantitative MRI can detect subclinical disease progression in muscular dystrophy. J Neurol. 2012;259(8):1648‐1654. [DOI] [PubMed] [Google Scholar]
- 15. Rooney WD, Berlow YA, Triplett WT, et al. Modeling disease trajectory in Duchenne muscular dystrophy. Neurology. 2020;94(15):e1622‐e1633. [DOI] [PMC free article] [PubMed] [Google Scholar]
- 16. Yin L, Xie ZY, Xu HY, et al. T2 mapping and fat quantification of thigh muscles in children with Duchenne muscular dystrophy. Curr Med Sci. 2019;39(1):138‐145. [DOI] [PubMed] [Google Scholar]
- 17. Arpan I, Willcocks RJ, Forbes SC, et al. Examination of effects of corticosteroids on skeletal muscles of boys with DMD using MRI and MRS. Neurology. 2014;83(11):974‐980. [DOI] [PMC free article] [PubMed] [Google Scholar]
- 18. Barnard AM, Willcocks RJ, Triplett WT, et al. MR biomarkers predict clinical function in Duchenne muscular dystrophy. Neurology. 2020;94(9):e897‐e909. [DOI] [PMC free article] [PubMed] [Google Scholar]
- 19. Barnard AM, Willcocks RJ, Finanger EL, et al. Skeletal muscle magnetic resonance biomarkers correlate with function and sentinel events in Duchenne muscular dystrophy. PloS One. 2018;13(3):e0194283. [DOI] [PMC free article] [PubMed] [Google Scholar]
- 20. Naarding KJ, Keene KR, Sardjoe Mishre ASD, et al. Preserved thenar muscles in non‐ambulant Duchenne muscular dystrophy patients. J Cachexia Sarcopenia Muscle. 2021;12(3):694‐703. [DOI] [PMC free article] [PubMed] [Google Scholar]
- 21. Ropars J, Gravot F, Ben Salem D, Rousseau F, Brochard S, Pons C. Muscle MRI: a biomarker of disease severity in Duchenne muscular dystrophy? A systematic review. Neurology. 2020;94(3):117‐133. [DOI] [PubMed] [Google Scholar]
- 22. Aartsma‐Rus A, Krieg AM. FDA approves Eteplirsen for Duchenne muscular dystrophy: the next chapter in the Eteplirsen saga. Nucleic Acid Ther. 2017;27(1):1‐3. [DOI] [PMC free article] [PubMed] [Google Scholar]
- 23. Copay AG, Subach BR, Glassman SD, Polly DW Jr, Schuler TC. Understanding the minimum clinically important difference: a review of concepts and methods. Spine J. 2007;7(5):541‐546. [DOI] [PubMed] [Google Scholar]
- 24. Lassere MN, van der Heijde D, Johnson KR. Foundations of the minimal clinically important difference for imaging. J Rheumatol. 2001;28(4):890‐891. [PubMed] [Google Scholar]
- 25. Arora H, Willcocks RJ, Lott DJ, et al. Longitudinal timed function tests in Duchenne muscular dystrophy: ImagingDMD cohort natural history. Muscle Nerve. 2018;58(5):631‐638. [DOI] [PMC free article] [PubMed] [Google Scholar]
- 26. Forbes SC, Walter GA, Rooney WD, et al. Design of a multi‐center study to examine skeletal muscles of children with Duchenne muscular dystrophy using MRI/MRS. Neuromuscul Disord. 2011;21(9):653‐654. [Google Scholar]
- 27. Forbes SC, Walter GA, Rooney WD, et al. Skeletal muscles of ambulant children with Duchenne muscular dystrophy: validation of multicenter study of evaluation with MR imaging and MR spectroscopy. Radiology. 2013;269(1):198‐207. [DOI] [PMC free article] [PubMed] [Google Scholar]
- 28. Mercuri E, Coratti G, Messina S, et al. Revised north star ambulatory assessment for young boys with Duchenne muscular dystrophy. PloS One. 2016;11(8):e0160195. [DOI] [PMC free article] [PubMed] [Google Scholar]
- 29. McDonald CM, Henricson EK, Abresch RT, et al. The 6‐minute walk test and other clinical endpoints in duchenne muscular dystrophy: reliability, concurrent validity, and minimal clinically important differences from a multicenter study. Muscle Nerve. 2013;48(3):357‐368. [DOI] [PMC free article] [PubMed] [Google Scholar]
- 30. Brooke MH, Griggs RC, Mendell JR, Fenichel GM, Shumate JB, Pellegrino RJ. Clinical trial in Duchenne dystrophy. I. The design of the protocol. Muscle Nerve. 1981;4(3):186‐197. [DOI] [PubMed] [Google Scholar]
- 31. Duong T, Canbek J, Birkmeier M, et al. The minimal clinical important difference (MCID) in annual rate of change of timed function tests in boys with DMD. J Neuromuscul Dis. 2021;8(6):939‐948. [DOI] [PMC free article] [PubMed] [Google Scholar]
- 32. Ayyar Gupta V, Pitchforth JM, Domingos J, et al. Determining minimal clinically important differences in the north star ambulatory assessment (NSAA) for patients with Duchenne muscular dystrophy. PloS One. 2023;18(4):e0283669. [DOI] [PMC free article] [PubMed] [Google Scholar]
- 33. Mouelhi Y, Jouve E, Castelli C, Gentile S. How is the minimal clinically important difference established in health‐related quality of life instruments? Review of anchors and methods. Health Qual Life Outcomes. 2020;18(1):136. [DOI] [PMC free article] [PubMed] [Google Scholar]
- 34. Malec JF, Ketchum JM. A standard method for determining the minimal clinically important difference for rehabilitation measures. Arch Phys Med Rehabil. 2020;101(6):1090‐1094. [DOI] [PubMed] [Google Scholar]
- 35. Finanger E, Pollaro J, Russman B, et al. MRI measures of bone in Duchenne muscular dystrophy. Neuromuscul Disord. 2013;23(9–10):811. [Google Scholar]
- 36. Lilien C, Reyngoudt H, Seferian AM, et al. Upper limb disease evolution in exon 53 skipping eligible patients with Duchenne muscular dystrophy. Ann Clin Transl Neurol. 2021;8(10):1938‐1950. [DOI] [PMC free article] [PubMed] [Google Scholar]
- 37. Nagy S, Schmidt S, Hafner P, et al. Measurements of motor function and other clinical outcome parameters in ambulant children with Duchenne muscular dystrophy. J Vis Exp. 2019;(143):e58784. [DOI] [PubMed] [Google Scholar]
- 38. Godi C, Ambrosi A, Nicastro F, et al. Longitudinal MRI quantification of muscle degeneration in Duchenne muscular dystrophy. Ann Clin Transl Neurol. 2016;3(8):607‐622. [DOI] [PMC free article] [PubMed] [Google Scholar]
- 39. Forbes SC, Arora H, Willcocks RJ, et al. Upper and lower extremities in Duchenne muscular dystrophy evaluated with quantitative MRI and proton MR spectroscopy in a multicenter cohort. Radiology. 2020;295(3):616‐625. [DOI] [PMC free article] [PubMed] [Google Scholar]
- 40. Kühn J‐P, Hernando D, Mensel B, et al. Quantitative chemical shift‐encoded MRI is an accurate method to quantify hepatic steatosis. J Magn Reson Imaging. 2014;39(6):1494‐1501. [DOI] [PMC free article] [PubMed] [Google Scholar]
Associated Data
This section collects any data citations, data availability statements, or supplementary materials included in this article.
Supplementary Materials
Supplementary Figure 1. Bland–Altman difference versus average plots of the day‐to‐day MRI biomarker values.
Supplementary Table 1. Number of individuals who were in the stable versus progression group for each Vignos score and baseline 6MWD.