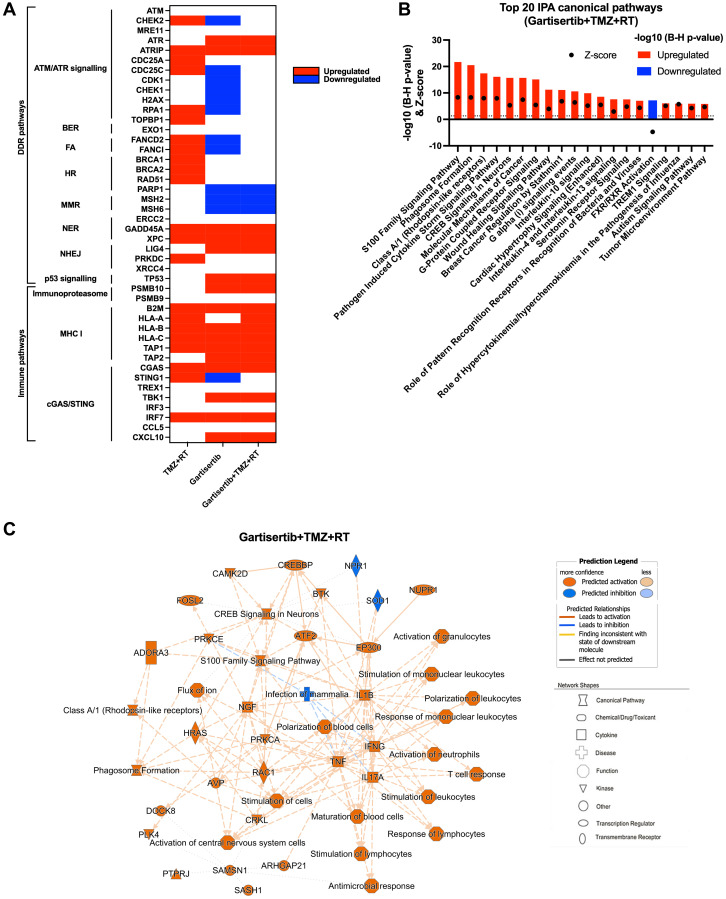
Figure 5. Upregulated genes and pathways enriched in glioblastoma cell lines treated with gartisertib combined with TMZ+RT.
(A) Genes involved in DDR and immune function were examined for difference in log2 TPM expression across all 12 glioblastoma cell lines through a paired t-test across comparisons for the effect of TMZ+RT, gartisertib and gartisertib+TMZ+RT treatments. Significant differences (p < 0.05) are shown in red (up-regulated) or blue (down-regulated). TMZ+RT treatment induced an upregulation of multiple DDR genes, while most DDR pathways were downregulated following ATR inhibition using gartisertib. (B) Core analysis using IPA was performed on significantly upregulated or downregulated genes (padj < 0.05, fold change ≥1.5) identified in prior DESeq2 analysis of all 12 glioblastoma cell lines treated with gartisertib+TMZ+RT against DMSO control cells. The top 20 canonical pathways are shown (z-score ≥2 or ≤−2). Significantly enriched IPA pathways were determined with a −log10 B-H p-value > 1.3 (above dotted line) (red = upregulated, blue = downregulated). (C) Through this comparison, a mechanistic network is shown representing the connection of canonical pathways, diseases, and molecules. Upregulated (orange) and downregulated (blue) components are shown. Legends for network shapes and arrows are depicted from https://qiagen.secure.force.com/KnowledgeBase/articles/Knowledge/Legend. Overall, ATR inhibition using gartisertib significantly induced the upregulation of pro-inflammatory pathways.

