

Abstract
Triiodothyronine (T3) is critical to osteogenesis, which is the key factor in bone growth. Our transcriptomic and metabolomic analysis results indicated that T3 leads to enhanced expression of G protein-coupled estrogen receptor 1 (GPER1) as well as increases in glycolysis metabolite levels. Accordingly, our study aimed to explore the role of GPER1-mediated glycolysis in T3-regulated osteogenesis. The MC3T3-E1 cell line was used as an osteoblast precursor model. After treatment with T3, a GPER1-specific antagonist (G15) and inhibitor of glycolysis (3PO) were used to explore the roles of GPER1 and glycolysis in T3-regulated osteogenesis, as measured by ALP activity, Alizarin red staining intensity and osteogenic molecule expression. Our results showed that T3 promoted osteogenesis-related activity, which was reversed by treatment with G15. In addition, T3 enhanced the glycolytic potential and production of lactic acid (LD) in MC3T3-E1 cells, and treatment with G15 restored the aforementioned effects of T3. Ultimately, the pharmacological inhibition of glycolysis with 3PO blocked the ability of T3 to enhance osteogenic activities. In conclusion, GPER1 mediates glycolysis in osteoblast precursors, which is critical for T3-promoted osteogenesis.
Keywords: T3, osteogenesis, MC3T3-E1, glycolysis, GPER1
Impact Statement
Due to a lack of physiological thyroid hormone, hypothyroidism in children can result in delayed bone maturation, eventually causing bone dysplasia, which is the main cause for short stature and growth arrest in pediatric patients. Therefore, hypothyroidism needs to be effectively treated, especially because of its significance to the physical and mental health of pediatric patients. Further exploration into the biological mechanism of the thyroid hormone in bone development is key to improving therapeutic effects. Based on transcriptomic and metabolomic analysis, we performed a series of in vitro assays to demonstrate, for the first time, the role of GPER1-mediated glycolysis in T3-regulated osteogenesis. Our research not only elucidates a novel molecular mechanism underlying T3-regulated osteogenesis but also provides evidence for potentially developing novel treatments of hypothyroidism-related bone development disorders; in fact, any treatment that enhances GPER1/glycolysis signal transduction may be applicable to the amelioration of the abovementioned bone development disorders.
Introduction
The normal development of the thyroid gland plays a vital role in bone growth. Owing to a lack of physiological thyroid hormone, hypothyroidism in children can result in delayed bone maturation, eventually causing bone dysplasia, which is the main cause for short stature and growth arrest in pediatric patients.1,2 Therefore, hypothyroidism needs to be effectively treated, especially because of its significance to the physical and mental health of pediatric patients. Further exploration into the biological mechanism of the thyroid hormone in bone development is key to improving therapeutic effects. Triiodothyronine (T3) is an active form of thyroid hormone. Osteoblasts, the cytological bases of osteogenesis, are the core factors in continuous bone renewal. T3 plays an important role in regulating osteoblast formation. T3 administration significantly upregulates the expression of osteogenesis-related molecules, including alkaline phosphatase (ALP), osteocalcin (OCN), and osteoprotegerin (OPG).3–5 T3 also promotes osteoblast differentiation, which confers advantages. 6 In addition, the activation of autophagy is involved in T3-promoted osteoblast formation. 7 However, the underlying mechanism by which T3 regulates osteoblast formation needs to be further elucidated.
To achieve this goal, in this study, our team performed transcriptomic and metabolomic analysis with MC3T3-E1 osteoblast precursors after T3 intervention. We found that the gene expression of G protein-coupled estrogen receptor 1 (GPER1) was upregulated more than five-fold in the T3 treatment group. Reports in the literature have indicated that GPER1 is expressed on the chondrocytes and osteoblasts of mouse and human growth plates. 8 Furthermore, estrogen affects bone growth and development through GPER1-related signal transduction. 9 Therefore, GPER1 shows great value in research on osteogenesis-related topics. To date, there are no relevant reports on the relationship between T3 and GPER1 in bone metabolism research.
In addition, metabolomic analyses have shown that the levels of dihydroxyacetone phosphate (DHAP) and lactic acid (LD) are the most obviously changed among metabolites following T3 treatment. DHAP is an intermediate metabolite in glycolysis/glucose metabolism, and it is critical to the connection of glycerol and glucose, and LD is the final product of glycolysis. DHAP and LD jointly participate in glycolysis. Under the sufficient oxygen conditions, glucose metabolism can produce LD in a process called aerobic glycolysis, which is the key mechanism that regulates osteoblast maturation.10,11 In contrast to adipocyte-regulated adenosine triphosphate (ATP) production that relies on oxidative phosphorylation, ATP production during osteogenesis depends mainly on glycolysis. 12 Considering the glycolysis-related metabolites identified via our metabolomic analysis, we speculated that T3-affected osteoblast formation is related to the regulation of glycolysis. Antagonizing GPER1 with G15 upregulates the expression of 6-phosphofructo-2-kinase/fructose-2,6-biphosphatase 3 (PFKFB3) in human umbilical vein endothelial cells. 13 Overexpression of GPER1 in MCF-7 breast cancer cells leads to altered glycolysis. 14 Furthermore, the PI3K/AKT signaling pathway activated by breast cancer cells induces cytoplasmic GPER translocation in cancer-associated fibroblasts, leading to the activation of the estrogen/GPER/cAMP/PKA/CREB signaling axis and ultimately triggering aerobic glycolysis in cancer-associated fibroblasts. 15 Accordingly, GPER1 is considered an important molecule affecting glycolysis. Our transcriptomic and metabolomic analysis results revealed that T3 simultaneously upregulates the expression of GPER1 and increases the levels of important glycolytic metabolites in osteoblast precursors, suggesting an internal relationship among T3-regulated osteogenesis, GPER1, and glycolysis. Therefore, we propose the following hypothesis: T3 can promote glycolysis by enhancing GPER1 expression in osteoblast precursors, which is critical to osteogenesis and subsequent bone development.
Through a series of molecular and cellular biological assays, our study provides for the first time, a new perspective and treatment idea based on the underlying mechanism of bone development disorders related to thyroid dysfunction.
Materials and methods
Cell culture and treatments
Clonal murine calvarial MC3T3-E1 Subclone 14 cells were purchased from ATCC (Rockville, MD) and cultured in α-MEM containing 10% heat-inactivated fetal bovine serum (FBS) (Gibco-BRL), 100 U/mL penicillin and 100 μg/mL streptomycin (Hyclone, Logan, UT) at 37°C in a 5% CO2 atmosphere. When the cells grew to 70–80% confluence, they were treated with 0, 10, and 100 nM 3,3,5-Triiodo-L-thyronine (T3) (Sigma-Aldrich, St. Louis, MO).
Cells underwent osteogenic differentiation for 7 or 21 d (d) in the induction of osteogenic medium (60 μg/mL ascorbic acid, 2 mM β-glycerophosphate, and 10 nM dexamethasone (Sigma-Aldrich)). Then, the expression of osteogenic markers, ALP staining and ALP activity were detected to evaluate osteogenic differentiation, and Alizarin red staining was performed to evaluate the mineralization level. After treatment with T3 for 48 h (h), the glycolytic potential and the production of LD were measured. After treatment with T3 for 6, 12, 24, and 48 h, the rate-limiting enzymes in glycolysis were measured. In addition, the selective antagonist of GPER1, G15 (10 μM), and the PFKFB3 inhibitor, 3PO (10 μM), were jointly intervened with T3.
Transcriptome analysis
MC3T3-E1 cells were cultured overnight and treated with T3 at 100 nM for 48 h. Total RNA was extracted from MC3T3-E1 cells using Trizol reagent (Invitrogen, CA, USA). Sequencing of total RNA was performed on an Illumina Hiseq 4000 instrument (LC Bio, Hangzhou, China). Six samples, including three pairs of controls and T3-treated groups, were sequenced.
The sequencing steps are summarized as follows: after total RNA passed quality inspection, eukaryotic mRNA is enriched with magnetic beads connected with oligo (DT). The extracted mRNA was randomly broken into short fragments by a fragmentation buffer. The fragmented mRNA was used as a template to synthesize cDNA strands with six base random primers, and then reaction buffer, dNTPs, RNaseH, and DNA polymerase I were added for two-strand cDNA synthesis. The double-stranded product was purified by AMP Pure XP beads. The sticky end of the DNA was repaired to a flat end by using T4 DNA polymerase and Klenow DNA polymerase activities. Base A was added to the 3′ end, and a connector was added. AMP Pure XP beads were used for fragment selection. Finally, polymerase chain reaction (PCR) amplification was performed to obtain the final sequencing library. Illumina Novaseq was employed after the library passed the quality inspection. After sequencing, the selected read lengths were 2*150 bp (pe150).
Metabolite extraction and liquid chromatography tandem-mass spectrometry (LC-MS/MS)
Under the same culture conditions as for transcriptome sequencing, the MC3T3-E1 cells were divided into control and T3 treatment groups. The samples in each group were repeated seven times and cultured for 48 h. When the cultured cells reach the experimental end time, 500 μL precooled extractant (80% methanol aqueous solution, including internal standard) was added, and samples were vortexed for 2 min. The samples were quick-frozen in liquid nitrogen for 5 min, thawed for 5 min, vortexed for 2 min, and mixed well; this cycle was repeated three times. Afterwards, the samples were centrifuged for 10 min at 4°C and 12,000g. Then, 400 µL supernatant was concentrated in 1.5 ml microcentrifuge tubes at 4°C until the solvent volatilized completely. Next, 160 μL 50% acetonitrile water (containing 0.03% formic acid) was added, vortexed for 3 min, and centrifuged for 5 min at 12,000g and 4°C. The supernatant was then put into the injection bottle for liquid chromatography tandem-mass spectrometry (LC-MS/MS).
The data acquisition system included Ultra Performance Liquid Chromatography (UPLC) (Shim-pack UFLC SHIMADZU CBM30A,htps:ǁMw.shimadzu, com/) and Tandem mass spectrometry (MS/MS)(QTRAP®, https://sciex.com/). Based on the self-built targeted standard database MWDB (metware database), the information and secondary spectrum data were qualitatively analyzed according to the retention time (RT) of the detected substance and the parent and daughter ions. The Software Analyst 1.6.3 was used to process mass spectrometry data. Using the local energy metabolism database, the metabolites of the samples were analyzed qualitatively and quantitatively by mass spectrometry. Multivariate statistical analysis was performed, including principal component analysis (PCA), cluster analysis (CA) and orthogonal partial least squares discriminant analysis (opls-da). Based on the results of opls-da, the metabolites with fold change ⩾ 2 and fold change ⩽ 0.5 were selected. If the difference between the test group and the control group was more than two fold, or less than 0.5 fold, the difference was considered to be significant. The China Hangzhou Lianchuan Biotechnology Co., Ltd. Illumina Hiseq 4000 (LC bio, China) laboratory was used for sequencing and metabolomic analysis.
Real-time PCR
Total RNA was extracted from a single cell suspension using Easyspin Plus according to the manufacturer (Aidlab, Beijing, China). cDNA was synthesized from the total RNA samples by using a PCR Reverse Transcription Kit (Takara, Dalian, China). Real-time quantitative PCR experiments were performed using SYBR Premix Ex Taq II according to the manufacturer’s protocol (Takara). The primer sequences used are list in Table 1. The primers were synthesized by Chongqing Qingke Biological Co., Ltd. (Chongqing, China). All analyses were performed in triplicate.
Table 1.
Sequences of primers.
| Gene | Sequence | |
|---|---|---|
| COL1 | -F | 5′-AGAACAGCGTGGCCT-3′ |
| -R | 5′-TCCGGTGTGACTCGT-3′ | |
| Runx2 | -F | 5′-CCCAGCCACCTTTACCTACA-3′ |
| -R | 5′-TATGGAGTGCTGCTGGTCTG-3′ | |
| Osx | -F | 5′-ATGGCGTCCTCTCTGCTTG-3′ |
| -R | 5′-TGAAAGGTCAGCGTATGGCTT-3′ | |
| Hk2 | -F | 5′-AGAGAACAAGGGCGAGGAG-3′ |
| -R | 5′-GGAAGCGGACATCACAATC-3′ | |
| Pkm | -F | 5′-CTGTGGAGATGCTGAAGGAG-3′ |
| -R | 5′-CAACAGGACGGTAGAGAATG-3′ | |
| Pkfkb3 | -F | 5′-CTACCTCAACTGGATAGGTGTTC-3′ |
| -R | 5′-AGGGCGGAAGAAGTTGTAAG-3′ | |
| Ldh | -F | 5′-TGGAAGACAAACTCAAGGGCGAGA-3′ |
| -R | 5′-TGACCAGCTTGGAGTTCGCAGTTA-3′ | |
| Gper1 | -F | 5′-CCCTGGACTTAAGAAGATATACTTGCA-3′ |
| -R | 5′-CCCGAAGTCCCGGCATA-3′ | |
| Gadph | -F | 5′-AGGTCGGTGTGAACGGATTTG-3′ |
| -R | 5′-TGTAGACCATGTAGTTGAGGTCA-3′ | |
Western blot analysis
Aliquots of cell lysates containing 30 μg of proteins were separated by 12% SDS-polyacrylamide gel and transferred to nitrocellulose membranes. The membranes were blocked with TBST buffer containing 8% skimmed milk and incubated with primary antibodies against RUNX2 (1:1000), COL1 (1:1000), HK2 (1:1000), PFKFB3(1:1000), PKM (1:1000) LDH (1:1000), β-actin (1:5000)(all from Abcam, Cambridge, UK), and OSX (1:1000, Santa Cruz Biotechnology, Dallas, TX). Blots were incubated overnight at 4°C, followed by the addition of horseradish peroxidase-linked secondary antibodies (ZSGB-GIO Beijing, China) and visualization of the Electrochemiluminescence bands. Quantification of the bands was carried out using densitometry analysis software, Quantity One (Bio-Rad). β-actin expression was used as an internal control to normalize the expressions of other proteins; and all analyses were performed in triplicate.
Immunofluorescent staining
The treated cells were fixed using 4% paraformaldehyde (PFA), permeated with 0.5% Triton X-100, and blocked using 1% bovine serum albumin (BSA) for 15 min at room temperature. Then, cells were incubated with primary antibodies (anti-HK2, PFKFB3, PKM, and LDH, Abcam, Cambridge, MA, 1:1000) and then with fluorescent-dye-conjugated secondary antibodies to detect the localization of target proteins in MC3T3-E1 cells. Finally, fluorescence was observed using a Leica confocal microscope (Heidelberg, Germany).
Glycolysis assay
Around 5,000 cells/well were plated in a 96-well plate and incubated overnight in 100 μl of cultured media. Cells were treated as described above. The glycolysis assay was performed using Cayman’s Glycolysis Cell-Based Assay Kit (Cayman Chemical, Ann Arbor, MI) according to the manufacturer’s instructions. The absorbance of each well was measured using a plate reader with a test wavelength of 490 nm. All analyses were performed in triplicate.
Lactate assay
Around 5,000 cells/well were plated in a 96-well plate and treated with T3, as described above. The LD content of the cell culture supernatant was determined using a Lactate Assay Kit (Jiangsu KeyGEN BioTECH, Nanjing, China) according to the manufacturer’s instruction. The absorbance of each well was measured using a microculture plate reader with a test wavelength of 530 nm. All analyses were performed in triplicate. The concentration of lactate was expressed according to the following equation: Concentration = (OD cell well – OD blank well) × standard concentration (3 mM)/(OD standard well – OD blank well) × 100%.
ALP staining
Around 5 × 10⁵ MC3T3-E1 cells were seeded in a six-well plate and allowed to grow to 70–80% confluence. The cells were treated, as above, for 7 days in osteogenic medium. The medium was replaced every 2–3 days. The cells were washed with phosphate buffered saline (PBS) three times. According to the instructions of the ALP staining kit (Beyotime, Shanghai, China), the samples were covered by BCIP/NBT working solution and incubated for 5–30 min at room temperature, until the color developed to the desired shade. The colorimetric reaction was terminated by washing with distilled water 1–2 times.
ALP activity assay
Cells were treated the same as for the ALP staining assay (above) followed by adding 100 μL 0.1%Triton-X100 for cell lysis with shaking for 30 min. ALP activity was determined using an ALP activity kit (Beyotime) according to the manufacturer’s instruction. The absorbance of each well was measured using a plate reader with a test wavelength of 405 nm. The blank wells were used as control. All analyses were performed in triplicate.
Alizarin red S (ARS) staining
Around 5 × 10⁵ MC3T3-E1 cells were seeded in six-well plates and cultured for 21 days in α-MEM with osteogenic medium. For alizarin red staining, the medium was discarded and the cells were washed twice with PBS, followed by fixing with 95% ethanol for 30 min. Cells were then rinsed three times with ddH2O to remove the ethanol completely. Next, 300 µl of 1% alizarin red stain (AR-S) solution was added to each well and the calcium deposits were labeled at 37°C water bath for 30–60 min and observed and photographed under an inverted phase contrast microscope (Olympus, Tokyo, Japan). Staining intensity was determined using ImageJ software (version 1.47, National Institutes of Health, Bethesda, MD).
Statistical analyses
The SPSS 22.0 statistical package (IBM Corp., Armonk, NY) was used for all analysis. All values are expressed as mean ± SD. Levene’s test was used to assess the equality of variances (test standard 0.10). One-Way analysis of variance (ANOVA) and least significant difference test were used to analyze the mean of each group with normal distribution and homogeneity of variance. Bonferroni test was used for Post Hoc multiple comparisons. Kruskal–Wallis H test was used when homogeneity of variance was not met. A p value of P < 0.05 was used to indicate a statistically significant difference.
Results
T3 promoted osteoblastic differentiation and mineralization
We first observed the effect of T3 on the osteogenic capacities of MC3T3-E1 osteoblast precursors. As shown in Figure 1(A) to (D), treatment with 10 nM or 100 nM T3 promoted the protein expression of RUNX2, OSX, and COL1 in MC3T3-E1 cells after 7 days of osteogenic induction (Figure 1(A) to (D)). However, there was no significant difference between the efficiency of T3 at either of the two treatment concentrations (Figure 1(A) to (D)). In addition, treatment with 10 nM or 100 nM T3 enhanced both ALP staining intensity and ALP activity after 7 days of osteogenic induction (Figure 1(E) and (F)), supporting the idea that T3 promotes osteoblastic differentiation. Alizarin red staining also revealed that treatment with 10 nM or 100 nM T3 increased the number of mineralized nodules and mineralized areas after 21 days of osteogenic induction (Figure 1(G) and (H)), supporting the idea that T3 promotes matrix mineralization. These results confirm the effectiveness of our experimental model in evaluating the roles of T3.
Figure 1.

T3 promoted osteoblastic differentiation and mineralization. (A to D) MC3T3-E1 cells were treated with 0, 10, and 100 nM T3 for 7 days under osteogenic induction, and the protein expression of COL1, RUNX2, and OSX proteins were analyzed. Bar chart showing the protein levels of COL1, RUNX2, and OSX normalized to β-actin level. (E and F) ALP staining and activity in MC3T3-E1 cells treated with the indicated treatments for 7 days under osteogenic induction (Unit of ALP activity: King U/GPROT). (G and H) Alizarin red staining in MC3T3-E1 cells treated with the indicated treatments for 21 days under osteogenic induction.
Bar chart showing the percentage of positive areas stained. Data are presented as mean ± SEM from three independent experiments. NS: not significant; Con: control group.
*P < 0.05, **P < 0.01.
Transcriptomic and metabolomic analysis of T3-treated MC3T3-E1 cells
Our transcriptomic analysis revealed that treatment with T3 resulted in the upregulation of 522 genes and downregulation of 526 genes in MC3T3-E1 cells (Figure 2A). Through a transcriptomic analysis, we learned that T3 administration significantly increased the mRNA expression of GPER1 and PFKFB3 (Figure 2(B) and (C)). As expected, we confirmed that treatment with 10 nM or 100 nM T3 significantly upregulated the protein expression of GPER1 in MC3T3-E1 cells via Western blot assays (Figure 2(D) and (E)), which verified the transcriptomic analysis results.
Figure 2.

Transcriptomic and metabolomic analysis of T3-treated MC3T3-E1 cells. (A) Volcano plot representing differential expression analysis of genes regarding transcriptome sequencing between control and T3-treated groups (n = 3, each group). The X-axis showed log2-fold change in expression, and the negative log10 of the P value was plotted on the Y-axis. Each gene was represented by one point on the graph. (B) Heat map represented the differential expression analysis of GPER1 and PFKFB3 between two groups (n = 3, each group). (C) The mRNA levels of GPER1 and PFKFB3 in the two groups displayed by transcriptome sequencing. (D and E) MC3T3-E1 cells were treated with 0, 10, and 100 nM T3 for 48 h, and the protein expression of GPER1 were analyzed. Bar chart showing the protein level of GPER1 normalized to β-actin level. (F) Volcano plot representing differential expression metabolites in metabolomic analysis between control and T3-treated groups (n = 7, each group). The X-axis showed log2-fold change in expression, and the variable importance in projection (VIP) was plotted on the Y-axis. Each metabolite was represented by one point on the graph. (G) Heat map represented the differential expression analysis of DHAP and LD between two groups (n = 7, each group). (H and I) The metabolite levels DHAP and LD in the two groups displayed by metabolomic analysis.
NS: not significant; Con: control group.
**P < 0.01, ****P < 0.0001.
Our metabolomic analysis showed that treatment with T3 resulted in increases in the levels of seven metabolites and the reduction in the level of one metabolite in MC3T3-E1 cells (Figure 2(F)). Through the metabolomic analysis, we learned that after T3 administration, the levels of DHAP and LD significantly increased (Figure 2(G) to (I)), which suggested that glycolysis may be involved with T3 in osteoblast formation.
The promotion of osteogenic activities by T3 was reversed by G15 treatment
T3 upregulates GPER1 expression in osteoblast precursors. Accordingly, we evaluated the roles of GPER1 in T3-regulated osteogenic activities. The specific GPER1 inhibitor G15 blocked the T3-increased mRNA levels of osteoblastic markers, including RUNX2, OSX, and COL1, but did not directly affect the mRNA expression of osteoblastic markers (Figure 3(A) to (C)). In addition, G15 treatment blocked the promoting effects of T3 on ALP staining intensity, ALP activity, mineralized nodule, and mineralized area formation while not directly affecting the aforementioned osteogenic activities (Figure 3(D) to (G)). These results suggested that GPER1 participates in T3-regulated osteoblastic differentiation and mineralization.
Figure 3.

The promotion of osteogenic activities by T3 was reversed by G15 treatment. (A to C) MC3T3-E1 cells were treated with 100 nM T3 along with or without 10 μM G15 for 7 days under osteogenic induction, and the mRNA levels of COL1, RUNX2, and OSX were analyzed. (D and E) ALP staining and activity in MC3T3-E1 cells treated with the indicated treatments for 7 days under osteogenic induction (Unit of ALP activity: King U/GPROT). (F) Alizarin red staining in MC3T3-E1 cells treated with the indicated treatments for 21 days under osteogenic induction. (G) Bar chart showing the percentage of positive areas stained.
Data are presented as mean ± SEM from three independent experiments. NS: not significant; Con: control group.
**P < 0.01, ***P < 0.001, ****P < 0.0001.
T3 upregulated glycolytic activities in MC3T3-E1 cells
The metabolomic analysis suggested that T3 affects the glycolysis of osteoblast precursors. As expected, treatment with 10 nM or 100 nM T3 significantly upregulated the glycolytic potential in MC3T3-E1 cells (Figure 4A). Treatment with 10 nM or 100 nM T3 promoted the production of LD in MC3T3-E1 cells (Figure 4B). However, no significant difference between the efficiency of T3 at the aforementioned concentrations two levels was observed (Figure 4(A) and (B)). We further observed the effects of T3 on several rate-limiting enzymes in osteoblast precursors. Following treatment with 100 nM T3 for the indicated times, HK2 mRNA levels were increased from 12 to 48 h, and the mRNA levels of PFKFB3, PKM, and LDH were increased at all time points (Figure 4(C) to (F)). Following treatment with 100 nM T3 for the indicated times, the protein levels of HK2 and PFKFB3 were increased at all time points (Figure 4(G) to (I)). With the same interventions, PKM protein levels were increased from 12 to 24 h, and LDH protein levels were increased at 24 and 48 h (Figure 4(G), (J) and (L)). Furthermore, immunofluorescence staining showed that the fluorescence intensity of the aforementioned enzymes in the cytoplasm increased after T3 administration (Figure 5(A) to (D)). These results confirmed that glycolysis is involved in T3-regulated osteogenesis.
Figure 4.

T3 upregulated glycolytic activities in MC3T3-E1 cells. (A and B) MC3T3-E1 cells were treated with 0, 10, and 100 nM T3 for 48 h, and the glycolytic potential and LD production in the supernatant were analyzed. (C to F) The mRNA expression of HK2, PFKFB3, PKM, and LDH in MCT3-E1 cells treated with indicated treatments. (G) The protein expression of HK2, PFKFB3, PKM, and LDH in MCT3-E1 cells treated with indicated treatments. (H to K) The bar chart shows the relative expression of HK2, PFKFB3, PKM, and LDH normalized to β-actin level.
Data are presented as mean ± SEM from three independent experiments. NS: not significant; Con: control group; hrs: hours.
*P < 0.05, **P < 0.01, ***P < 0.001, ****P < 0.0001.
Figure 5.
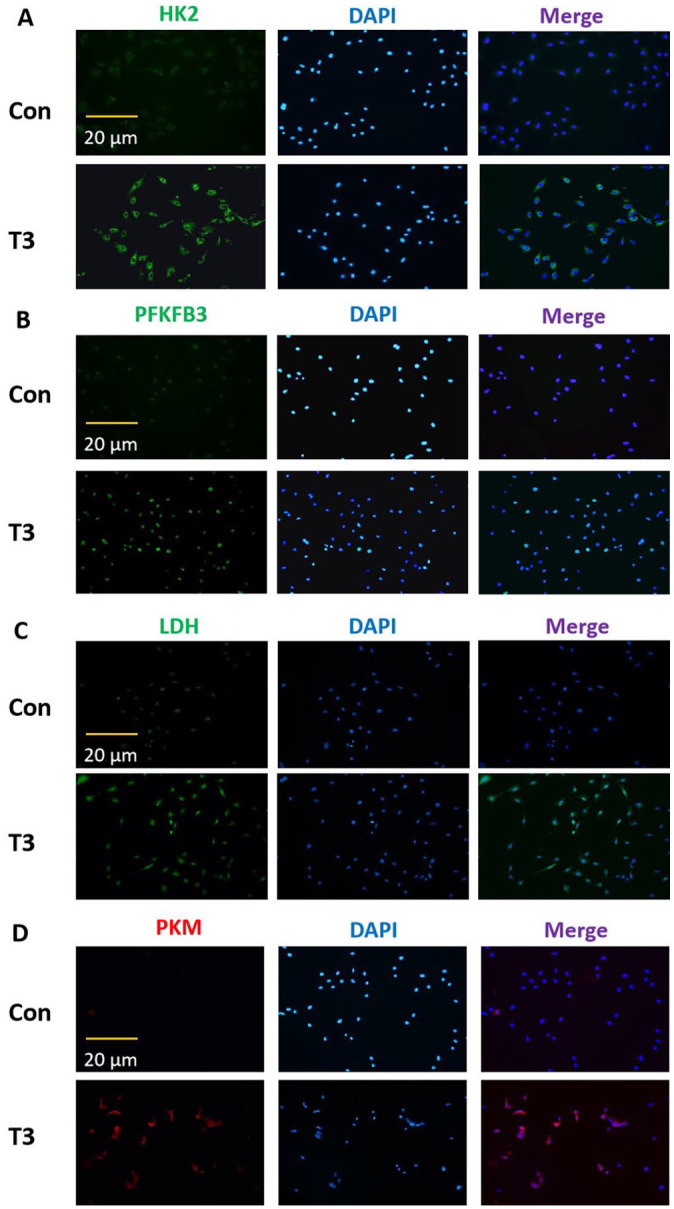
The immunofluorescent results of altered glycolytic activities in MC3T3-E1 cells. After treatment with 0 or 100 nM T3 for 48 h, and the fluorescent intensity of HK2, PFKFB3, LDH, and PKM in the cytoplasm were evaluated by immunofluorescence staining (scale = 20 μm).
Data are representative images among six independent samples with unanimous results. Con: control group.
T3 upregulation of glycolytic activities in of MC3T3-E1 cells were reversed by G15 treatment
As a specific antagonist of GPER1, G15 was used as a pharmacological tool for our study. 13 Although the direct application of G15 did not reduce the glycolytic potential or LD production, the addition of G15 blocked the increase in glycolytic potential and LD production induced by T3 administration in MC3T3-E1 cells (Figure 6(A) and (B)). Moreover, we observed that although the direct application of G15 did not result in a decrease in the mRNA and protein expression of HK2, PFKFB3, PKM, and LDH, the addition of G15 blocked the enhancement of the mRNA and protein expression of the aforementioned rate-limiting enzymes induced by T3 administration in MC3T3-E1 cells (Figure 6(C) to (K)). These findings indicated that GPER1 participates in T3-regulated glycolysis of osteoblast precursors.
Figure 6.

T3 upregulation of glycolytic activities in of MC3T3-E1 cells were reversed by G15 treatment. (A and B) MC3T3-E1 cells were treated with 100 nM T3 along with or without 10 μM G15 for 48 h, and the glycolytic potential and LD production in the supernatant were analyzed. (C to F) The mRNA expression of HK2, PFKFB3, PKM, and LDH in MCT3-E1 cells treated with indicated treatments as described in (A and B). (G) The protein expression of HK2, PFKFB3, PKM, and LDH in MCT3-E1 cells treated with indicated treatments as described in (A and B). (H–K) The bar chart shows the relative expression of HK2, PFKFB3, PKM, and LDH normalized to β-actin level.
Data are presented as mean ± SEM from three independent experiments. NS: not significant; Con: control group.
*P < 0.05, **P < 0.01, ***P < 0.001, ****P < 0.0001.
T3 promoted osteogenic activities were blocked by 3PO addition
Finally, we evaluated the significance of glycolysis in T3-regulated osteogenic cell differentiation and mineralization. As a specific inhibitor of the PFKFB3 isozyme, 3PO was applied as a pharmacological tool to inhibit glycolysis. As shown in Figure 7(A), 3PO addition not only directly inhibited the glycolytic potential in MC3T3-E1 cells but also blocked the glycolytic potential that had been promoted by T3 administration. In addition, although the direct application of 3PO did not affect LD production in MC3T3-E1 cells, 3PO addition reversed the LD production promoted by T3 administration (Figure 7(B)). These results indicated the reliability of our experimental system. It was observed that 3PO treatment led to the recovered of the mRNA expression of RUNX2, OSX and COL1 in MC3T3-E1 cells that had been promoted by T3 administration while not directly affecting the expression levels of the aforementioned osteogenic genes (Figure 7(C) to (E)). Moreover, 3PO addition attenuated the ALP staining intensity and ALP activity that had been enhanced by T3 administration but did not directly affect the aforementioned osteogenic activities (Figure 7(F) and (G)). Moreover, Alizarin red staining showed results similar to those of ALP staining-related for osteogenic activities (Figure 7(H) and (I)). These results supported the idea that that glycolysis is involved in T3-regulated osteogenesis.
Figure 7.

T3-promoted osteogenic activities were blocked by 3PO addition. (A and B) MC3T3-E1 cells were treated with 100 nM T3 along with or without 10 μM 3PO for 48 h, and the glycolytic potential and LD production in the supernatant were analyzed. (C to E) The mRNA levels of COL1, RUNX2, and OSX in MCT3-E1 cells treated with 100 nM T3 along with or without 10 μM 3PO for 7 days under osteogenic induction. (F and G) ALP staining and activity in MC3T3-E1 cells treated with the indicated treatments for 7 days under osteogenic induction (Unit of ALP activity: King U/GPROT). (H) Alizarin red staining in MC3T3-E1 cells treated with the indicated treatments for 21 days under osteogenic induction. (I) Bar chart showing the percentage of positive areas stained.
Data are presented as mean ± SEM from three independent experiments. NS: not significant; Con: control group.
**P < 0.01, ***P < 0.001, ****P < 0.0001.
Discussion
Normal thyroid function plays a vital role in bone growth. To study the underlying mechanism of osteogenesis regulated by the active thyroid hormone T3, we performed transcriptomic and metabolomic analyses on osteoblast precursor cell lines after T3 intervention. The results showed that T3 not only promoted the expression of the GPER1 gene in osteoblast precursors but also enhanced the production of glycolysis-related metabolites DHAP and LD. The promoting effect of T3 on GPER1 levels in osteoblast precursors was verified in vitro. In vitro experiments also showed that T3 promoted the glycolytic potential and production of LD in osteoblast precursors, which confirmed that T3 plays a positive role in glycolysis in osteoblast precursors. Previous studies have shown that GPER1 is an important glycolysis-regulating molecule,13 –15 which is also evident in our research. Therefore, a meaningful scientific question is: Does T3 enhance glycolysis in osteoblast precursors by promoting GPER1 expression, thereby promoting osteogenesis? Through a series of in vitro experiments, this study revealed the internal mechanism of T3-regulated osteogenesis from the perspective of glycolysis for the first time.
In our study, the application of T3 enhanced the expression of osteoblastic molecules, osteogenic differentiation, and matrix mineralization, which was consistent with the literature,3 –7 and confirms the osteogenesis-promoting effect of T3. However, the enhancement of osteogenesis by T3 was blocked by the specific inhibition of GPER1 with G15. Combined with the upregulation of T3 on GPER1 expression in osteoblast precursors, T3 was shown to promote osteogenic capacity by increasing the GPER1 level. The positive regulation of GPER1 expression on osteoblast formation has been reported in multiple previous studies. First, the activation of GPER1 promotes the osteoblastic differentiation of MC3T3-E1 cells. 16 In addition, prunetin signaling induces RUNX2 expression in osteoblasts through GPER1-related signal transduction, promoting bone regeneration. 17 Furthermore, ipriflavone promotes the proliferation and osteoblastic differentiation of periodontal ligament cells by activating GPER1/PI3K/AKT signaling. 18 Similar reports have also been presented in several other studies.9,19,20 We elaborated the significance of GPER1 in the pro-osteogenic function of T3. However, the potential mechanisms of the aforementioned functions mediated by GPER1 need to be clarified. Our data showed that T3 promotes the glycolytic potential and LD production in osteoblast precursors while increasing GPER1 expression. Both the transcriptomic analysis and in vitro experiment results illustrated effect of the upregulated T3 expression on multiple glycolytic rate-limiting enzymes in osteoblast precursors. Glucose is the main nutrient source for osteoblasts, and ATP generation depends mainly on glycolysis during osteoblastic differentiation. 12 Previous studies have indicated that T3 improves silica-induced pulmonary fibrosis through glycolysis. 21 In addition, T3 shows the capacity to increase the glycolytic rate in skeletal muscle. 22 Accordingly, glycolysis is of great significance for gaining a deeper understanding of the underlying mechanism of T3-regulated osteogenesis. GPER1 functions as a glycolysis mediator.13 –15 We confirmed a relationship between GPER1 and glycolysis in osteoblast precursors. GPER1 inhibition with G15 reversed the T3-enhanced glycolytic potential, LD production, and expression of relevant rate-limiting enzymes in osteoblast precursors. Therefore, the relationship among T3, GPER1, and glycolysis during osteoblast formation was further clarified. Notably, G15 administration did not directly affect the osteogenic capacity and glycolytic potential of osteoblast precursors, which further indicates that GPER1 is particularly important to T3 efficiency during osteoblast formation. Furthermore, glycolysis inhibition with 3PO blocked T3-promoted osteogenic differentiation and mineralization of osteoblast precursors, which demonstrated the effect of glycolysis on T3-regulated osteogenesis for the first time. Notably, although 3PO administration inhibited the glycolytic potential in osteoblast precursors, it did not directly affect LD production or osteogenic capacity. Accordingly, we speculate that LD-related glycolysis may be involved in T3-regulated osteogenesis, which needs to be verified in future investigations. Overall, our data confirmed the mechanism by which T3 enhances glycolysis in osteoblast precursors: it upregulates GPER1 expression, thereby promoting osteogenesis. Based on the above data, it was inferred that the deficiency of thyroid hormone may lead to GPER1 downregulation, glycolysis disorder, and the subsequent weakening of osteogenesis in hypothyroidism-related bone development disorders. Therefore, the supplementation of GPER1 may effectively improve hypothyroidism-related bone development disorders. However, in the future, there is still a requirement for large-scale clinical studies on hypothyroidism in children to confirm the relationship between GPER1 and bone development disorders. Relying on these foundations, the biological therapy based on GPER1 overexpression is expected to be applied to the treatment of hypothyroidism in children. The working model is described in Figure 8.
Figure 8.
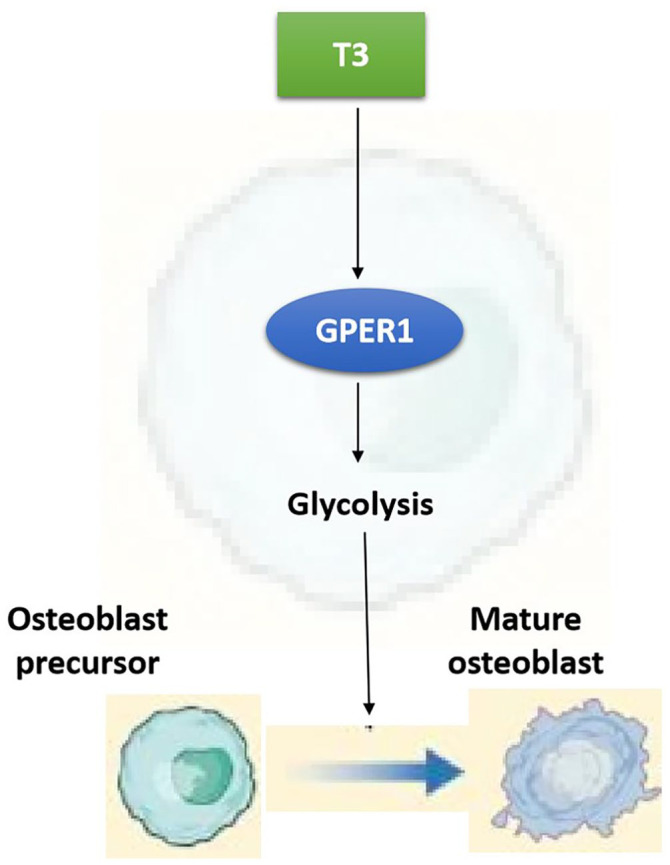
The working model diagram of T3-promoted osteogenesis through GPER1-mediated glycolysis. Briefly, T3 can enhance GPER1 expression, thereby promoting glycolysis in osteoblast precursors, which leads to the differentiation of osteoblast precursors into mature osteoblasts.
In summary, on the basis of transcriptomic and metabolomic analysis, we performed a series of in vitro assays to demonstrate, for the first time, the role of GPER1-mediated glycolysis in T3-regulated osteogenesis. Our research not only elucidates a novel molecular mechanism underlying T3-regulated osteogenesis but also provides evidence for potentially developing novel treatments of hypothyroidism-related bone development disorders; in fact, any treatment that enhances GPER1/glycolysis signal transduction may be applicable to the amelioration of the abovementioned bone development disorders.
Acknowledgments
The authors thank The trauma laboratory of Daping Hospital, Army Medical University for providing experimental site.
Footnotes
Authors’ Contributions: YLY and JMH conceived and designed experiments; YX and GML performed experiments, analyzed data, prepared figures, and helped with writing of the manuscript; DSK helped with experimental operation and data analysis; YLY, JMH and YX wrote the manuscript. DSK reviewed and edited this manuscript. All authors have read and agreed to the published version of the manuscript.
The author(s) declared no potential conflicts of interest with respect to the research, authorship, and/or publication of this article.
Funding: The author(s) disclosed receipt of the following financial support for the research, authorship, and/or publication of this article: This work was supported by the National Natural Science Foundation of China (grant no. 82270934) and the Fujian Provincial Natural Science Foundation Projects (grant no. 2020J011079).
ORCID iDs: Dian-shan Ke  https://orcid.org/0000-0003-0260-7191
Yun-long Yu
https://orcid.org/0000-0003-0750-6015
References
- 1. Boersma B, Otten BJ, Stoelinga GB, Wit JM. Catch-up growth after prolonged hypothyroidism. Eur J Pediatr 1996;155:362–7 [DOI] [PubMed] [Google Scholar]
- 2. Crawford JD. Long-term growth in juvenile acquired hypothyroidism: the failure to achieve normal adult stature. N Engl J Med 1988;318:599–602 [DOI] [PubMed] [Google Scholar]
- 3. Banovac K, Koren E. Triiodothyronine stimulates the release of membrane-bound alkaline phosphatase in osteoblastic cells. Calcif Tissue Int 2000;67:460–5 [DOI] [PubMed] [Google Scholar]
- 4. Gouveia CH, Schultz JJ, Bianco AC, Brent GA. Thyroid hormone stimulation of osteocalcin gene expression in ROS 17/2.8 cells is mediated by transcriptional and post-transcriptional mechanisms. J Endocrinol 2001;170:667–75 [DOI] [PubMed] [Google Scholar]
- 5. Varga F, Spitzer S, Klaushofer K. Triiodothyronine (T3) and 1,25-dihydroxyvitamin D3 (1,25D3) inversely regulate OPG gene expression in dependence of the osteoblastic phenotype. Calcif Tissue Int 2004;74:382–7 [DOI] [PubMed] [Google Scholar]
- 6. Cheng S, Xing W, Pourteymoor S, Mohan S. Effects of Thyroxine (T4), 3,5,3’-triiodo-L-thyronine (T3) and their metabolites on osteoblast differentiation. Calcif Tissue Int 2016;99:435–42 [DOI] [PubMed] [Google Scholar]
- 7. Yi L, Zhong T, Huang Y, Huang S. Triiodothyronine promotes the osteoblast formation by activating autophagy. Biophys Chem 2020;267:106483. [DOI] [PubMed] [Google Scholar]
- 8. Chagin AS, Sävendahl L. GPR30 estrogen receptor expression in the growth plate declines as puberty progresses. J Clin Endocrinol Metab 2007;92:4873–7 [DOI] [PubMed] [Google Scholar]
- 9. Fan DX, Yang XH, Li YN, Guo L. 17β-Estradiol on the expression of G-protein coupled estrogen receptor (GPER/GPR30) mitophagy, and the PI3K/Akt signaling pathway in ATDC5 chondrocytes in vitro. Med Sci Monit 2018;24:1936–47 [DOI] [PMC free article] [PubMed] [Google Scholar]
- 10. Warburg O. On the origin of cancer cells. Science 1956;123:309–14 [DOI] [PubMed] [Google Scholar]
- 11. Misra BB, Jayapalan S, Richards AK, Helderman RCM, Rendina-Ruedy E. Untargeted metabolomics in primary murine bone marrow stromal cells reveals distinct profile throughout osteoblast differentiation. Metabolomics 2021;17:86. [DOI] [PMC free article] [PubMed] [Google Scholar]
- 12. Guntur AR, Gerencser AA, Le PT, DeMambro VE, Bornstein SA, Mookerjee SA, Maridas DE, Clemmons DE, Brand MD, Rosen CJ. Osteoblast-like MC3T3-E1 cells prefer glycolysis for ATP production but adipocyte-like 3T3-L1 cells prefer oxidative phosphorylation. J Bone Miner Res 2018;33:1052–65 [DOI] [PMC free article] [PubMed] [Google Scholar]
- 13. Trenti A, Tedesco S, Boscaro C, Ferri N, Cignarella A, Trevisi L, Bolego C. The glycolytic enzyme PFKFB3 is involved in estrogen-mediated angiogenesis via GPER1. J Pharmacol Exp Ther 2017;361:398–407 [DOI] [PubMed] [Google Scholar]
- 14. Wegner MS, Gruber L, Schömel N, Trautmann S, Brachtendorf S, Fuhrmann D, Schreiber Y, Olesch C, Brüne B, Geisslinger G, Grösch S. GPER1 influences cellular homeostasis and cytostatic drug resistance via influencing long chain ceramide synthesis in breast cancer cells. Int J Biochem Cell Biol 2019;112:95–106 [DOI] [PubMed] [Google Scholar]
- 15. Yu T, Yang G, Hou Y, Tang X, Wu C, Wu XA, Guo L, Zhu Q, Luo H, Du YE, Wen S, Xu L, Yin J, Tu G, Liu M. Cytoplasmic GPER translocation in cancer-associated fibroblasts mediates cAMP/PKA/CREB/glycolytic axis to confer tumor cells with multidrug resistance. Oncogene 2017;36:2131–45 [DOI] [PubMed] [Google Scholar]
- 16. Lin X, Li L, Wu S, Tian J, Zheng W. Activation of GPR30 promotes osteogenic differentiation of MC3T3-E1 cells: an implication in osteoporosis. IUBMB Life 2019;71:1751–9 [DOI] [PubMed] [Google Scholar]
- 17. Khan K, Pal S, Yadav M, Maurya R, Trivedi AK, Sanyal S, Chattopadhyay N. Prunetin signals via G-protein-coupled receptor, GPR30(GPER1): stimulation of adenylyl cyclase and cAMP-mediated activation of MAPK signaling induces Runx2 expression in osteoblasts to promote bone regeneration. J Nutr Biochem 2015;26:1491–501 [DOI] [PubMed] [Google Scholar]
- 18. Han Y, Wang X, Ma D, Wu X, Yang P, Zhang J. Ipriflavone promotes proliferation and osteogenic differentiation of periodontal ligament cells by activating GPR30/PI3K/AKT signaling pathway. Drug Des Devel Ther 2018;12:137–48 [DOI] [PMC free article] [PubMed] [Google Scholar]
- 19. Zhao B, Xiong Y, Zhang Y, Jia L, Zhang W, Xu X. Rutin promotes osteogenic differentiation of periodontal ligament stem cells through the GPR30-mediated PI3K/AKT/mTOR signaling pathway. Exp Biol Med (Maywood) 2020;245:552–61 [DOI] [PMC free article] [PubMed] [Google Scholar]
- 20. Wu QC, Tang XY, Dai ZQ, Dai Y, Xiao HH, Yao XS. Sweroside promotes osteoblastic differentiation and mineralization via interaction of membrane estrogen receptor-α and GPR30 mediated p38 signalling pathway on MC3T3-E1 cells. Phytomedicine 2020;68:153146. [DOI] [PubMed] [Google Scholar]
- 21. Yang M, Wang D, Gan S, Wang B, Yu L, Xie Y, Fan L, Ma J, Chen W. Triiodothyronine ameliorates silica-induced pulmonary inflammation and fibrosis in mice. Sci Total Environ 2021;790:148041. [DOI] [PubMed] [Google Scholar]
- 22. Major E, Győry F, Horváth D, Keller I, Tamás I, Uray K, Fülöp P, Lontay B. Smoothelin-like protein 1 regulates development and metabolic transformation of skeletal muscle in hyperthyroidism. Front Endocrinol (Lausanne) 2021;12:751488. [DOI] [PMC free article] [PubMed] [Google Scholar]