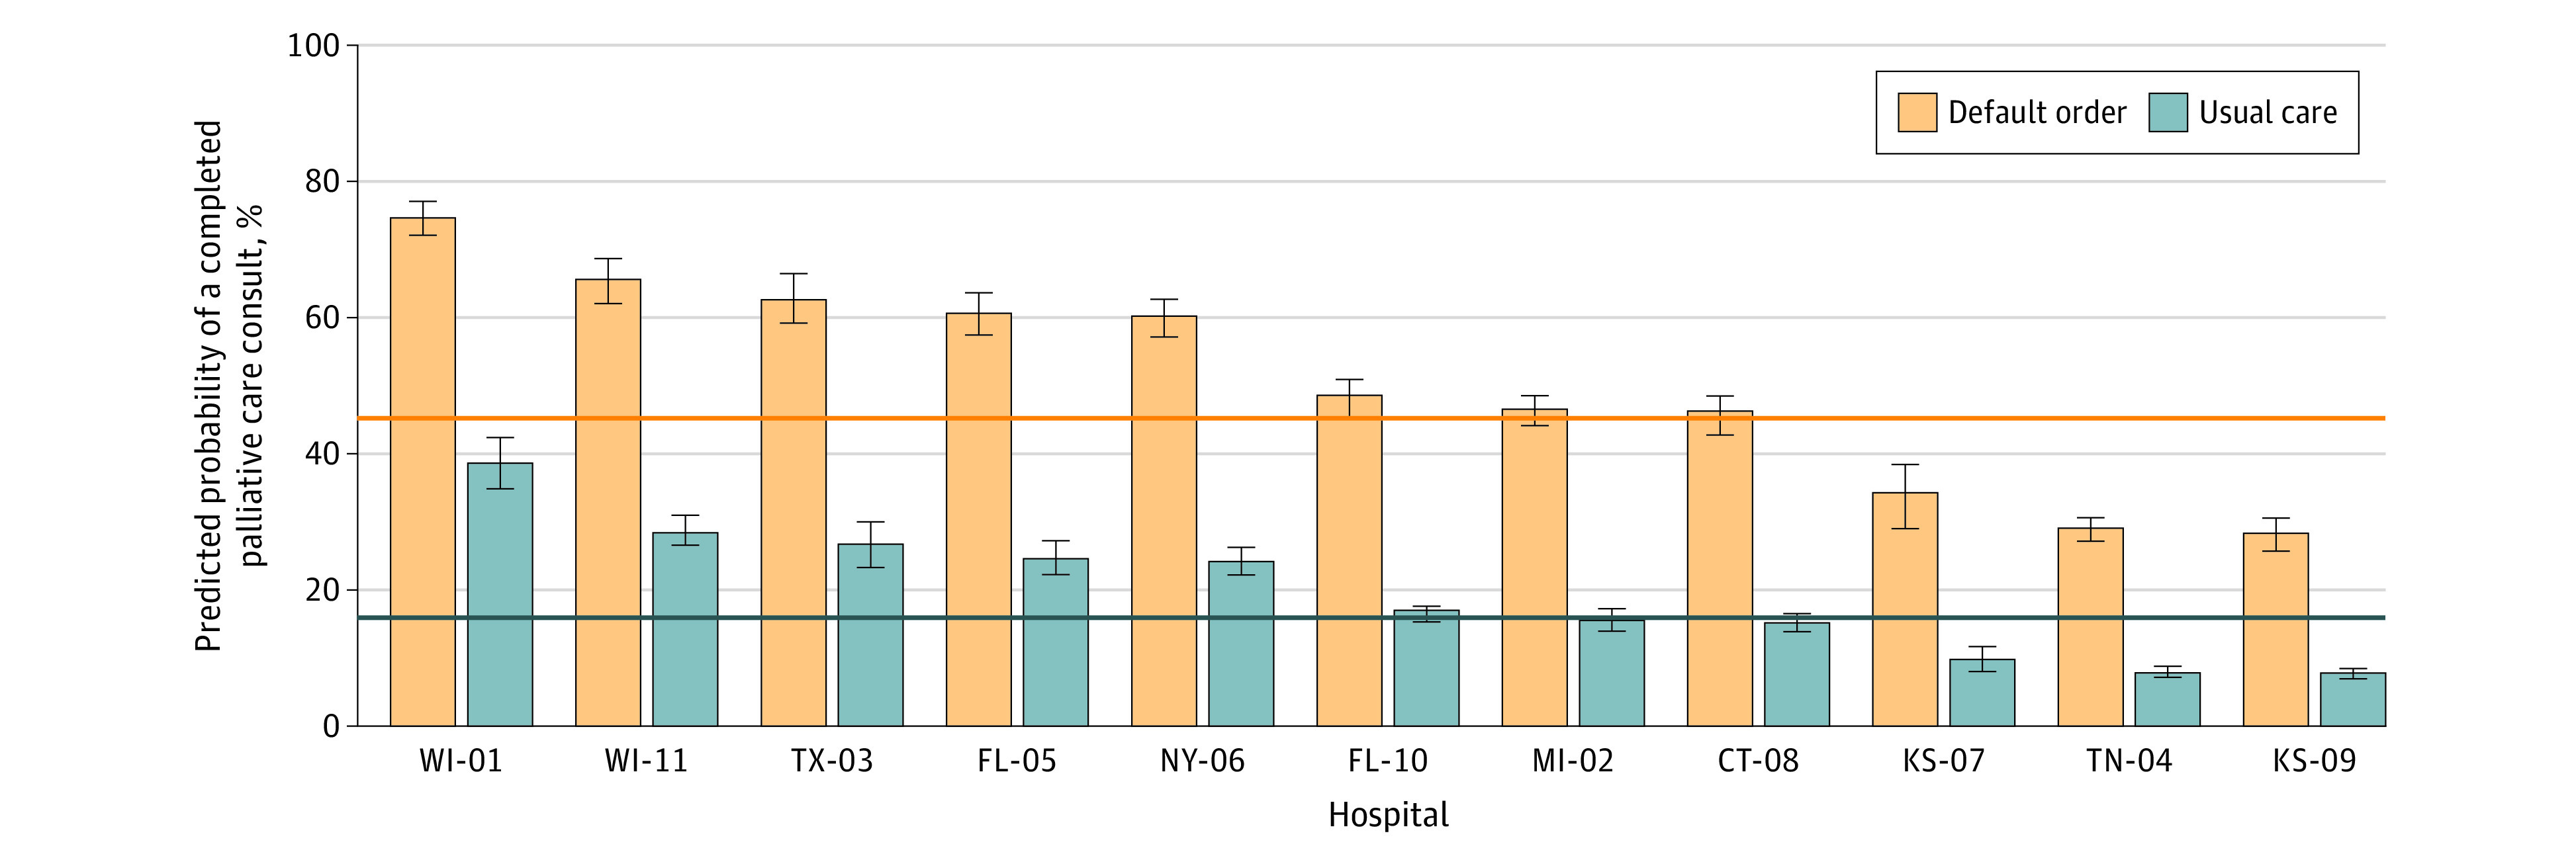
Figure 2. Predicted Probability of a Completed Palliative Care Consult by Hospital.

Results are shown for the primary analytic sample. Estimates were adjusted for time and cluster. Hospital number corresponds to randomization sequence; see eFigure 3 in Supplement 3 for more details. Horizonal lines denote the overall mean probability of a completed palliative care consult for usual care (16.6%) and intervention (43.9%) groups. Whiskers indicate 95% CIs. Percentages may not total to 100 due to rounding.
