

Abstract
BACKGROUND & AIMS:
Fibrosis is a key determinant of clinical outcomes in nonalcoholic fatty liver disease (NAFLD), but time-dependent risk of mortality has not been reported in previous meta-analyses. We performed an updated time-to-event meta-analysis to provide robust estimates for all-cause and liver-related mortality in biopsy-confirmed NAFLD with comparisons between fibrosis stages.
METHODS:
Medline and Embase databases were searched to include cohort studies reporting survival outcomes by fibrosis stage in biopsy-proven NAFLD. Survival estimates were pooled using reconstructed individual participant data. Conventional meta-analysis was conducted to pool adjusted hazard ratios (HRs) using DerSimonian and Laird random effects model.
RESULTS:
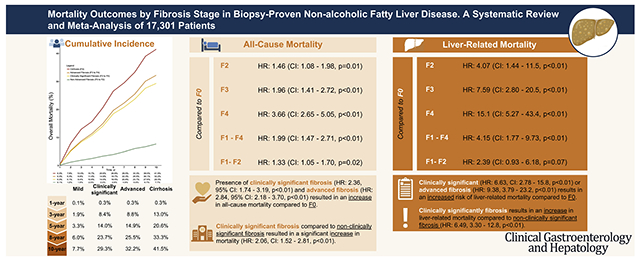
A total of 14 articles involving 17,301 patients with NAFLD were included. All-cause mortality at 1, 5, and 10 years for stage 0 to 2 fibrosis was 0.1%, 3.3%, and 7.7% vs 0.3%, 20.6%, and 41.5% for stage 4 fibrosis. Compared with stage 0 fibrosis, all-cause mortality increased with fibrosis stage: stage 2; HR, 1.46 (95% confidence interval [CI], 1.08–1.98), stage 3; HR, 1.96 (95% CI, 1.41–2.72), and stage 4; HR, 3.66 (95% CI, 2.65–5.05). Risk for liver-related mortality increased exponentially as fibrosis stage increased: stage 2; HR, 4.07 (95% CI, 1.44–11.5), stage 3; HR, 7.59 (95% CI, 2.80–20.5), and stage 4; HR, 15.1 (95% CI, 5.27–43.4). Stage 3 to 4 fibrosis had a higher all-cause (HR, 3.32) and liver-related mortality (HR, 10.40) compared with stage 0 to 2 fibrosis, whereas stage 4 fibrosis had higher all-cause (HR, 2.67; 95% CI, 1.47–4.83) and liver-related mortality (HR, 2.57; 95% CI, 1.22–5.42) vs stage 3 fibrosis.
CONCLUSIONS:
Risk of all-cause and liver-related mortality increases substantially with fibrosis stage. These data have important implications for prognostication and trial design.
Keywords: Disease Progression, Fibrosis, Liver Disease, Mortality
Graphical Abstract
Nonalcoholic fatty liver disease (NAFLD) is the most common cause of chronic liver disease affecting 22% to 33% of the global population.1,2 NAFLD encompasses a spectrum of disease, ranging from nonalcoholic fatty liver to nonalcoholic steatohepatitis (NASH).3–5 The presence of NAFLD is a known risk factor for increasing cardiovascular disease and mortality.3,4 Increasing fibrosis stage is associated with liver-related endpoints including hepatocellular carcinoma,6–8 decompensation, and overall mortality, particularly at the advanced stages.9. The alterations of the hepatic architecture in fibrosis results in increased portal vascular resistance, evoking portal hypertension, which is mechanistically related to hepatic decompensation.10,11 A recent study by Sanyal et al demonstrated an association between fibrosis stages 3 (F3) and 4 (F4) with hepatic decompensation and a 6- to 13-fold increase in risk of mortality in patients with NAFLD.12 Similarly, a previous meta-analysis found an increase in risk for liver morbidity, liver mortality, and all-cause mortality in patients with advancing fibrosis.13
Although prior meta-analyses have demonstrated higher risks of all-cause and liver-related mortality in patients with NAFLD with increasing fibrosis stages,13,14 these studies examined the risk of mortality with reference to stage 0 fibrosis (F0) without performing comparisons among differing stages of fibrosis. In addition, previous meta-analyses pooled risk ratios, which may be a less appropriate measure in the context of time-dependent survival analysis, as risk ratios do not account for time-to-event.15,16 By contrast, the use of hazard ratios (HRs) account for censoring of events, which provides more robust estimates of survival. In addition, more data on this topic has been published since the previous meta-analyses on this topic, including a landmark prospective study from the NASH Clinical Research Network.12,17 In light of these considerations, we conducted an updated time-to-event meta-analysis to assess the impact of fibrosis stage on all-cause and liver-related mortality in patients with biopsy-confirmed NAFLD. Additionally, we aimed to pool the survival estimates of individual fibrosis stage based on reconstructed individual patient data and compare mortality between different stages of fibrosis.
Methods
Search Strategy
With reference to the Preferred Reporting Items for Systematic Reviews and Meta-Analyses (PRISMA) guidelines,18 a search was conducted in Medline and Embase databases for articles relating to survival outcomes in NAFLD from inception up to November 11, 2021. The search strategy was updated from a previously published systematic review on NAFLD.13 Keywords and MeSH terms relating to ‘nonalcoholic fatty liver disease,’ ‘nonalcoholic steatohepatitis,’ ‘mortality,’ and ‘clinical outcomes’ were applied to the search strategy. The full search strategy can be found in the Supplementary Appendix. All references were imported into Endnote X9 for removal of duplicates. Manual screening of the references in the included articles was also conducted for a comprehensive search.
Eligibility and Selection Criteria
Four authors (W.H.L., G.E.H.L., C.H.N., and D.J.H.T.) independently screened titles and abstracts for eligibility before selected articles underwent a full-text review. Disputes were resolved through consensus with a senior author (D.Q.H.). Studies were considered for inclusion if they fulfilled the following criteria: (1) cohort study (retrospective or prospective); (2) biopsy-confirmed diagnosis of NAFLD; (3) adult patients with NAFLD above 18 years of age; and (4) reported time-to-event mortality data by fibrosis stage. The premise of the meta-analysis requires time-dependent data and cross-sectional studies to be excluded from the meta-analysis. Only English language articles were considered for inclusion, and no date filter was applied. Case-control, conference abstracts, editorials, systematic reviews, meta-analyses, and commentaries were excluded. In addition, studies that reported liver-related events without mortality data and studies conducted in the pediatric population were also removed. When there were multiple studies arising from the same cohort, only the most updated cohort was included for analysis.
Data Extraction and Outcomes
Two pairs of authors (W.H.L. and G.E.H.L., C.H.N. and D.J.H.T.) independently extracted relevant data from included articles including but not limited to (1) study characteristics: author, year, country, study design, follow-up duration; (2) patient characteristics: total sample size, age, gender, body mass index, comorbidities such as hypertension or diabetes, sample size of patients with NASH, criteria for NASH diagnosis, and (3) outcomes: fibrosis stage, all-cause mortality, and liver-related mortality. Discrepancies were resolved in consultation with a senior author (D.Q.H.). The primary outcome of this study was all-cause mortality across different fibrosis stages in patients with NAFLD. The secondary outcome was liver-related mortality across different fibrosis stages in patients with NAFLD. Liver-related mortality was defined as deaths from liver cirrhosis, sequelae of chronic liver disease, hepatocellular carcinoma, or hepatic failure. There were 2 primary groups in the classification of fibrosis used in the analysis. Firstly, fibrosis was classified into individual fibrosis stages (F0, stage 1 fibrosis [F1], stage 2 fibrosis [F2], F3, F4). An additional stratification was done where fibrosis was classified into all fibrosis (F1–4), nonclinically significant fibrosis (F0–1), nonadvanced fibrosis (F0–F2), early fibrosis (F1–F2), clinically significant fibrosis (≥F2 fibrosis), and advanced fibrosis (≥F3 fibrosis).
Quality Assessment
Quality assessment for cohort studies was graded using the Joanna Briggs Institute (JBI) Critical Appraisal Tool.19 The JBI critical assessment grades articles based on generalizability of study cohorts, statistical analysis including dealing with confounding variables, reporting of outcomes, and losses to follow-up.
Statistical Analysis
All analyses were conducted in R Studio (Version 1.3.1093). A P-value ≤ .05 was considered as the threshold for statistical significance. An individual patient data cumulative incidence meta-analysis was first conducted to assess the proportion of mortality in nonadvanced fibrosis (F0–2), clinically significant fibrosis (F2–4), advanced fibrosis (F3–4), and cirrhosis (F4) for all-cause mortality. Individual patient data were extracted from reported Kaplan-Meier curves and reconstruction of survival information was performed using the formula detailed by Guyot et al.20 Guyot et al proposes a robust algorithm that accounts for censoring of events and has been widely adopted as the gold standard approach in the extraction of individual patient data for survival analysis.21–23 A random effects model was subsequently used to aggregate data derived from the arcsine transformed conditional survival probabilities using the product-limit estimator,24,25 and survival probabilities were estimated from the extracted survival data at prespecified timepoints from published survival curves.24,25 The 95% confidence intervals (CIs) were obtained by extension of Greenwood’s formula.26 Next, survival estimates between groups were pooled in hazard ratios (HRs) with the DerSimonian and Laird random effects model. To adjust for confounders, regression analysis was conducted to examine the effect of baseline characteristics on mortality. Statistical heterogeneity was assessed via I2 and Cochran Q test values, where an I2 value of 25%, 50%, and 75% represented low, moderate, and high degrees of heterogeneity respectively.27,28 Random effects models were used in all analyses regardless of heterogeneity estimates as they are a more robust measure of effect size for observational data.29 Publication bias was assessed via visual inspection of the funnel plots where appropriate.30
Results
Summary of Included Articles
A systematic search of the literature yielded 727 articles, after removal of duplicates. Following the exclusion of 610 articles based on study title and abstract, 117 articles were selected for full-text review, of which 14 articles met the final inclusion criteria (Figure 1). In total, 17,301 patients had biopsy-proven NAFLD. Of the 14 studies, 3 were conducted in Japan, 2 in the United States, 2 in Sweden, 1 in Canada, 1 in Hong Kong, and 1 in Israel, with 4 multicenter studies spanning multiple regions. The median follow-up duration was 7.7 years (interquartile range, 5.9–13.9 years). There were a total of 7 retrospective and 7 prospective studies respectively. Overall, mean age of the patients was 50.5 years (95% CI, 49.1–51.8 years), and 52.1% were males (95% CI, 46.3%–57.9%). A total of 6069 patients were assessed for overall mortality and 3421 for liver-related mortality. The breakdown of the sample size can be found in Supplementary Table 2. A summary of the key characteristics and quality assessment for the included articles can be found in Supplementary Table 2, and all included studies were assessed to be of high quality based on the JBI appraisal tool.
Figure 1.
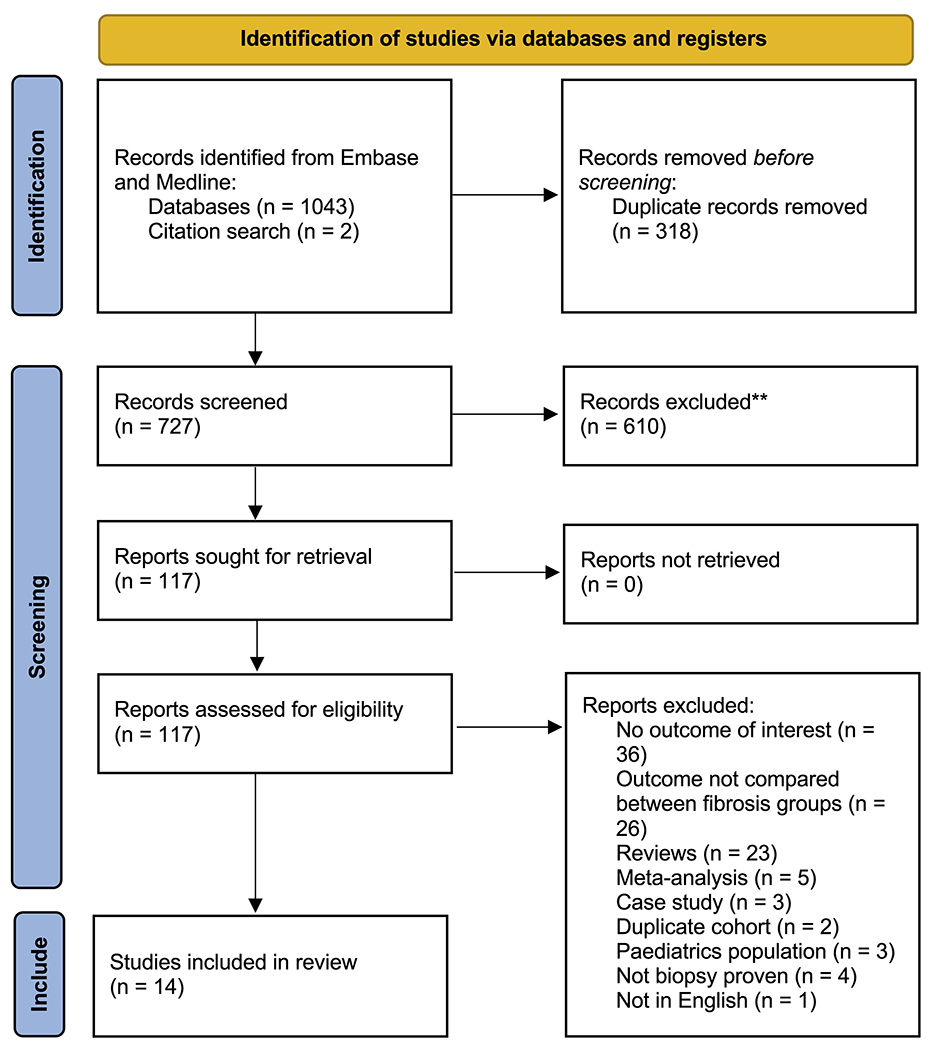
Preferred Reporting Items for Systematic Reviews and Meta-Analysis (PRISMA) flowchart of included articles. **Excluded from independent title and abstract sieve.
Cumulative Incidence of All-cause and Liver-related Mortality
All-cause mortality and liver-related mortality rates in patients with biopsy-confirmed NAFLD were estimated from individual patient data meta-analysis (Figure 2) and are summarized in Table 1. The 1-, 3-, 5-, 8-, and 10-year all-cause mortality were: 0.1%, 1.9%, 3.3%, 6.0%, and 7.7%, respectively, in nonadvanced fibrosis (F0–F2); 0.3%, 8.4%, 14.0%, 23.7%, and 29.3%, respectively, in clinically significant fibrosis (F2–F4); 0.3%, 8.8%, 14.9%, 25.5%, and 32.2%, respectively, in advanced fibrosis (F3 and F4); and 0.3%, 13.0%, 20.6%, 33.3%, and 41.5%, respectively, in cirrhosis (F4).
Figure 2.
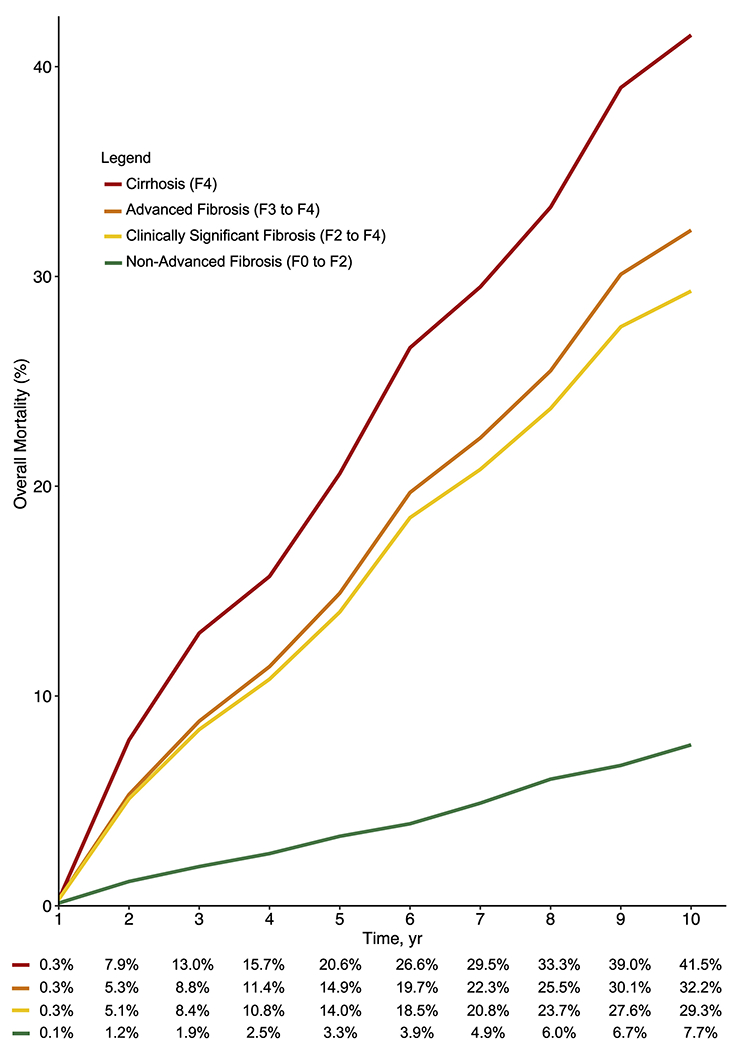
Reconstructed individual patient meta-analysis of all-cause mortality by fibrosis stage.
Table 1.
Cumulative Mortality by Fibrosis Stage
| Empty Cell | 1-year | 3-year | 5-year | 8-year | 10-year |
|---|---|---|---|---|---|
| All-cause mortality | |||||
| Nonadvanced fibrosis (F0–F2) | 0.1 (0.0–0.3) | 1.9 (0.0–4.3) | 3.3 (0.0–6.7) | 6.0 (1.0–10.8) | 7.7 (1.2–13.7) |
| Clinically significant fibrosis (F2–F4) | 0.3 (0.1–0.6) | 8.4 (7.1–9.6) | 14.0 (12.4–15.6) | 23.7 (21.6–25.8) | 29.3 (26.8–31.6) |
| Advanced fibrosis (F3–F4) | 0.3 (0.1–0.6) | 8.8 (7.5–10.1) | 14.9 (13.1–16.5) | 25.5 (23.2–27.8) | 32.2 (29.5–34.8) |
| Cirrhosis (Stage 4, F4) | 0.3 (0.0–0.5) | 13.0 (11.0–15.0) | 20.6 (18.1–23.1) | 33.3 (30.1–36.4) | 41.5 (37.9–44.9) |
Note: Data are presented as percentage (95% confidence interval).
F0, Stage 0 fibrosis; F1, stage 1 fibrosis; F2, stage 2 fibrosis; F3, stage 3 fibrosis; F4, stage 4 fibrosis/cirrhosis.
Fibrosis Stage-specific All-cause Mortality
Compared With F0.
The results for all-cause mortality are summarized in Tables 2 and 3. Compared with F0 as the reference group, there were no statistically significant differences in all-cause mortality for F1 vs F0 (HR, 1.24; 95% CI, 0.85–1.81; P = .27). However, the presence of F2 (HR, 1.46; 95% CI, 1.08–1.98; P = .01), F3 (HR, 1.96; 95% CI, 1.41–2.72; P < .01), and F4 (HR, 3.66; 95% CI, 2.65–5.05; P < .01) significantly increased the risk of mortality. The presence of any fibrosis (F1–4) also significantly increased the risk of mortality (HR, 1.99; 95% CI, 1.47–2.71; P < .01). Early fibrosis (F1–2) resulted in a statistically significant increase of all-cause mortality (HR, 1.33; 95% CI, 1.05–1.70; P = .02). Similarly, the presence of clinically significant fibrosis and advanced fibrosis resulted in an increase in all-cause mortality compared with F0. There was no evidence of publication bias from the funnel plot in Supplementary Figure 1.
Table 2.
Comparative Clinical Outcomes According to Fibrosis Stage
| Fibrosis stage | HR | 95% CI | Cochran Q | I2 | P-value |
|---|---|---|---|---|---|
| All-cause mortality | |||||
| F1 vs F0 | 1.24 | 0.85–1.81 | 0.23 | 28.0% | .27 |
| F2 vs F0 | 1.46 | 1.08–1.98 | 0.60 | 0.00% | .01 |
| F3 vs F0 | 1.96 | 1.41–2.72 | 0.86 | 0.00% | < .01 |
| F4 vs F0 | 3.66 | 2.65–5.05 | 0.06 | 31.0% | < .01 |
| Liver-related mortality | |||||
| F1 vs F0 | 1.69 | 0.56–5.14 | 0.87 | 0.00% | .35 |
| F2 vs F0 | 4.07 | 1.44–11.5 | 0.94 | 0.00% | < .01 |
| F3 vs F0 | 7.59 | 2.80–20.5 | 0.69 | 0.00% | < .01 |
| F4 vs F0 | 15.1 | 5.27–43.4 | 0.81 | 0.00% | < .01 |
Note: Boldface P-value (< .05) denotes statistical significance.
CI, Confidence interval; F0, stage 0 fibrosis; F1, stage 1 fibrosis; F2, stage 2 fibrosis; F3, stage 3 fibrosis; F4, stage 4 fibrosis/cirrhosis; HR, hazard ratio.
Table 3.
Comparative Clinical Outcomes by Fibrosis Classification
| Fibrosis stage | HR | 95% CI | Cochran Q | I2, % | P-value |
|---|---|---|---|---|---|
| All-cause mortality | |||||
| Compared with F0 | |||||
| Fibrosis (F1–F4) vs F0 | 1.99 | 1.47–2.71 | <0.01 | 80.0 | < .01 |
| Early fibrosis (F1–F2) vs F0 | 1.33 | 1.05–1.70 | 0.27 | 20.0 | .02 |
| Clinically significant fibrosis (F2–F4) vs F0 | 2.36 | 1.74–3.19 | <0.01 | 69.0 | < .01 |
| Advanced fibrosis (F3–F4) vs F0 | 2.84 | 2.18–3.70 | 0.10 | 41.0 | < .01 |
| Compared with nonclinically significant fibrosis (F0–F1) | |||||
| Clinically significant fibrosis (F2–F4) vs F0–F1 | 2.06 | 1.52–2.81 | 0.33 | 12.0 | < .01 |
| Compared with nonadvanced fibrosis (F0–F2) | |||||
| Advanced fibrosis (F3–F4) vs F0–F2 | 3.32 | 2.38–4.65 | 0.09 | 40.0 | < .01 |
| F3 vs F0–F2 | 1.98 | 1.47–2.67 | 0.59 | 0.00 | < .01 |
| F4 vs F0–F2 | 3.49 | 2.21–5.49 | 0.24 | 28.0 | < .01 |
| Compared with stage 3 fibrosis | |||||
| F4 vs F3 | 2.67 | 1.47–4.83 | 0.07 | 51.0 | < .01 |
| Liver–related mortality | |||||
| Compared with F0 | |||||
| Fibrosis (F1–F4) vs F0 | 4.15 | 1.77–9.73 | 0.62 | 0.00 | < .01 |
| Early fibrosis (F1–F2) vs F0 | 2.39 | 0.93–6.18 | 0.70 | 0.00 | .07 |
| Clinically significant fibrosis (F2–F4) vs F0 | 6.63 | 2.78–15.8 | 0.73 | 0.00 | < .01 |
| Advanced fibrosis (F3–F4) vs F0 | 9.38 | 3.79–23.2 | 0.74 | 0.00 | < .01 |
| Compared with nonclinically significant fibrosis (F0–F1) | |||||
| Clinically significant fibrosis (F2–F4) vs F0–F1 | 6.49 | 3.30–12.8 | 0.90 | 0.00 | < .01 |
| Compared with nonadvanced fibrosis (F0–F2) | |||||
| Advanced fibrosis (F3–F4) vs F0–F2 | 10.40 | 6.18–17.5 | 0.75 | 0.00 | < .01 |
| F3 vs F0–F2 | 6.25 | 3.21–12.2 | 0.88 | 0.00 | < .01 |
| F4 vs F0–F2 | 10.9 | 5.15–22.9 | 0.88 | 0.00 | < .01 |
| Compared with F3 | |||||
| F4 vs F3 | 2.57 | 1.22–5.42 | 0.66 | 0.00 | .01 |
Note: Boldface P-value (< .05) denotes statistical significance.
CI, Confidence interval; F0, stage 0 fibrosis; F1, stage 1 fibrosis; F2, stage 2 fibrosis; F3, stage 3 fibrosis; F4, stage 4 fibrosis/cirrhosis; HR, hazard ratio.
Compared with nonclinically significant fibrosis.
The presence of clinically significant fibrosis (F2–F4) compared with nonclinically significant fibrosis (F0–F1) resulted in a statistically significant increase in mortality (HR, 2.06; 95% CI, 1.52–2.81; P < .01).
Compared with nonadvanced fibrosis.
The presence of advanced fibrosis (F3–F4) resulted in a significantly increased risk of mortality (HR, 3.32; 95% CI, 2.38–4.65; P < .01) compared with no advanced fibrosis. There was no evidence of publication bias from the funnel plot in Supplementary Table 2. Similarly, F3 and F4 resulted in a significant increase in all-cause mortality compared with nonadvanced fibrosis (F0–2).
F4 vs F3.
A comparison between F4 and F3 found that F4 resulted in a statistically significant increase in mortality compared with F3 (HR, 2.67; 95% CI, 1.47–4.83; P < .01). Sensitivity analysis was conducted for 3 studies including NASH; albeit there was limited sample size (n = 853). Patients with NASH had significantly increased risk of mortality in F4 vs F3 (HR, 5.08; 95% CI, 2.70–9.55; P < .01).
Meta-regression.
Meta-regression was performed to identify associations between study-level clinical characteristics and all-cause mortality (Supplementary Table 3). Age, gender, body mass index, smoking status, presence of hypertension, and diabetes did not have significant effects on all-cause mortality in the analysis of presence of fibrosis or clinically significant fibrosis when compared with no fibrosis. Only male gender significantly increased mortality in the analysis of advanced fibrosis compared with no advanced fibrosis (P = .02).
Fibrosis Stage-specific Liver-related Mortality
Compared with F0.
The results for liver-related mortality are summarized in Tables 2 and 3. The presence of F1 did not result in a statistically significant increase in liver-related mortality events (Table 2). However, F2 resulted in an increased risk of liver-related mortality (HR, 4.07; 95% CI, 1.44–11.5; P < .01). Similarly, the presence of F3 (HR, 7.59; 95% CI, 2.80–20.5; P < .01) and F4 (HR, 15.1; 95% CI, 5.27–43.4; P < .01) significantly increased the risk of mortality. The presence of any fibrosis (F1–4) resulted in an increased risk of mortality (HR, 4.15; 95% CI, 1.77–9.73; P < .01). Early fibrosis (F1–2) resulted in a borderline nonsignificant increased risk of mortality (HR, 2.39; 95% CI, 0.93–6.18; P = .07). However, the presence of clinically significant (HR, 6.63; 95% CI, 2.78–15.8; P < .01) or advanced fibrosis (F3–F4) (HR, 9.38; 95% CI, 3.79–23.2; P < .01) resulted in an increased risk of liver-related mortality compared with F0.
Compared with nonclinically significant fibrosis.
The presence of clinically significantly fibrosis (F2–F4) resulted in an increase in liver-related mortality compared with nonclinically significant fibrosis (F0–F1) (HR, 6.49; 95% CI, 3.30–12.8; P < .01).
Compared with nonadvanced fibrosis.
The presence of advanced fibrosis (F3–F4) resulted in a statistically significant increase in liver-related mortality (HR, 10.4; 95% CI, 6.18–17.5; P < .01). Similarly, the presence of F3 or F4 increased the risk of liver-related mortality compared with nonadvanced fibrosis (Table 3).
F4 vs F3.
F4 resulted in a significant increased risk of liver-related mortality compared with F3 (HR, 2.57; 95% CI, 1.22–5.42; P = .01).
Heterogeneity.
There was low to moderate heterogeneity in the analyses for mortality and liver-related events by individual fibrosis stages (Table 2) (all I2 ≤31%). There was generally low to moderate heterogeneity in the analyses for mortality and liver-related events by fibrosis classification (I2 ≤51%), except in the analyses for F1 to F4 vs F0 (I2 = 80%) and F2 to F4 vs F0 (I2 = 69%).
Discussion
Main Findings
In this meta-analysis of 14 studies and 17,301 patients, we utilized HRs to account for censoring to provide robust time-to-event estimates of mortality. We determined that all-cause mortality at 1, 5, and 10 years for F0 to F1 was 0.1%, 3.3%, and 7.7% vs 0.3%, 20.6%, and 41.5% for F4. Compared with F0, the risk of all-cause mortality increased along with fibrosis stage from F2 onwards (F2: HR, 1.5; F3: HR, 2.0; F4: HR, 3.7). Importantly, the risk of liver-related mortality increased exponentially with fibrosis stage from F2 onward (F2: HR, 4.1; F3: HR, 7.6; F4: HR, 15.1).
We performed an individual patient data meta-analysis to provide comparisons for mortality between fibrosis stages. Compared with nonclinically significant fibrosis (F0–F1), clinically significant fibrosis (F2–F4) had an increased risk for all-cause mortality (HR, 2.1) and liver-related mortality (HR, 6.5), affirming the importance of developing therapies for patients with F2 onwards.31 Compared with nonadvanced fibrosis (F0–F2), advanced fibrosis (F3–F4) had an increased risk for all-cause mortality (HR, 3.3) and liver-related mortality (HR, 10.4). In addition, we compared F4 vs F3 and found an increased risk of all-cause mortality (HR, 2.7) and liver-related mortality (HR, 2.6). Although the presence of F4 results in the greatest risk of mortality, selection criteria in NASH clinical trials have predominately targeted patients with F0 to F3.32 NASH is currently the fastest growing cause for liver transplant and remains the only known curative treatment for cirrhosis.33 However, with the global shortage of suitable grafts34 for transplant and lack of viable treatment, our results highlight that there is an urgent need for an efficacious treatment for patients with NASH and F4.31 These findings have important implications for clinical practice and trial design. These data provide high-level evidence that provides prognostication for each stage of fibrosis to inform care providers and patients. In addition, these findings have important implications for clinical trial design and highlight the importance of developing therapeutics for F4. Furthermore, these data suggest that regression of fibrosis from F4 to F3 may improve clinical outcomes, and further studies to validate these are required.
In Context With Current Literature
The current study builds on the data provided by Taylor et al and Dulai et al, whose studies demonstrated that all-cause mortality and liver-related mortality increased with fibrosis stage.13,14 Unlike the study by Dulai et al, we did not find significant differences in the risk of all-cause mortality between patients with F1 vs F0. In addition, Taylor et al found a significant increase in liver-related mortality from F3 onwards, whereas our analysis demonstrated an increase in liver-related mortality from F2 onwards. These differences in results may be because our study included updated data from recently published studies and used HRs for comparison of outcomes, which accounts for censoring of data. By contrast, the studies by Taylor and Dulai utilized risk ratios, which may result in an overestimation of the number-at-risk when pooling outcomes. In addition, the current analysis included a recent landmark prospective study of 1773 patients with NAFLD that demonstrated an increased risk of liver-related complications and death with F3 and F4.13
Limitations
We acknowledge the following limitations. The sample size involved in liver-related mortality was considerably smaller relative to overall mortality. Time-to-event data on nonliver-related mortality and cardiovascular-related mortality were sparse, which precluded pooling of estimates. Although we sought to report sensitivity analysis by NASH, the results should be interpreted with caution, given the limited sample size. The development of hepatocellular carcinoma and its effects on survival lie beyond the scope of this paper and warrant further investigations. An analysis of liver-related mortality by proportion was not conducted due to insufficient studies. Data were insufficient to perform subgroup analyses by gender, age, study design, medication use, and diagnostic modality for fibrosis stage. However, we performed meta-regression to evaluate the impact of demographic and clinical characteristics on all-cause mortality. When comparing each individual fibrosis stage with F0, all analyses had a low degree of heterogeneity (Table 2) (all I2 <31%). However, in analyses combining several fibrosis stages into a single group for comparison against F0 (Table 3) (F1–F4 vs F0; F2–F4 vs F0), these analyses had a moderate to high degree of heterogeneity, which is not unexpected due to the combination of 3 or more fibrosis stages into a single group. We were unable to provide a statistical test to compare advanced fibrosis and clinically significant fibrosis using reconstructed participant data, as this would not be appropriate due to between-study heterogeneity. Finally, we did not include data from randomized controlled trials as most trials have a limited follow-up duration, which may lead to an underestimation of the mortality rate.
Conclusion
Patients with NAFLD and advanced fibrosis have a 3-fold higher risk of all-cause mortality and 10-fold higher risk of liver-related mortality vs patients without advanced fibrosis. Patients with F4 have a 3-fold higher risk of all-cause and liver-related mortality vs patients with F3, highlighting the urgent need to develop therapeutic agents for NASH cirrhosis. These data have important implications in prognostication and the design of therapeutic intervention trials.
Supplementary Material
What You Need to Know.
Background
Fibrosis is a key determinant of clinical outcomes in nonalcoholic fatty liver disease (NAFLD). This study sought to assess impact of fibrosis stage on all-cause and liver-related mortality in patients with NAFLD.
Findings
Risk of all-cause and liver-related mortality increases substantially with fibrosis stage. Patients with cirrhosis have a 3-fold higher risk of death versus those with stage 3 fibrosis.
Implications for patient care
These data have important implications in assessing the prognosis of each stage of fibrosis and the design of therapeutic intervention trials aimed at preventing fibrosis progression.
Funding
Rohit Loomba receives funding support from NCATS (5UL1TR001442), NIDDK (U01DK061734, U01DK130190, R01DK106419, R01DK121378, R01DK124318, P30DK120515), NHLBI (P01HL147835), and NIAAA (U01AA029019).
Conflicts of interest
These authors disclose the following: Rohit Loomba serves as a consultant or advisory board member for Anylam/Regeneron, Arrowhead Pharmaceuticals, AstraZeneca, Bristol-Myer Squibb, CohBar, Eli Lilly, Galmed, Gilead, Glympse Bio, Inipharm, Intercept, Ionis, Janssen Inc, Merck, Metacrine Inc, NGM Biopharmaceuticals, Novartis, Novo Nordisk, Pfizer, Promethera, Sagimet, 89 Bio, and Viking Therapeutics. In addition, his institution has received grant support from Allergan, Boehringer-Ingelheim, Bristol-Myers Squibb, Cirius, Eli Lilly and Company, Galectin Therapeutics, Galmed Pharmaceuticals, GE, Genfit, Gilead, Intercept, Inventiva, Janssen, Madrigal Pharmaceuticals, Merck, NGM Biopharmaceuticals, Pfizer, pH Pharma, and Siemens. He is also co-founder of Liponexus, Inc. Daniel Q. Huang serves as an advisory board member for Eisai. The remaining authors disclose no conflicts.
Abbreviations used in this paper:
- CI
confidence interval
- F0
stage 0 fibrosis
- F1
stage 1 fibrosis
- F2
stage 2 fibrosis
- F3
stage 3 fibrosis
- F4
stage 4 fibrosis/cirrhosis
- HR
hazard ratio
- JBI
Joanna Briggs Institute
- NAFLD
nonalcoholic fatty liver disease
- NASH
nonalcoholic steatohepatitis
Footnotes
CRediT Authorship Contributions
Cheng Han Ng (Conceptualization: Equal; Data curation: Equal; Formal analysis: Equal; Validation: Equal; Writing – original draft: Equal)
Wen Hui Lim (Data curation: Equal; Formal analysis: Equal; Writing – original draft: Equal)
Grace En Hui Lim (Data curation: Equal)
Darren Jun Hao Tan (Data curation: Equal; Formal analysis: Equal; Validation: Equal)
Nicholas Syn (Formal analysis: Equal)
Mark D. Muthiah (Conceptualization: Equal; Supervision: Equal; Validation: Equal; Writing – original draft: Equal)
Daniel Q. Huang (Conceptualization: Equal; Supervision: Equal; Validation: Equal; Writing – original draft: Equal)
Rohit Loomba, MD, MHSc (Conceptualization: Equal; Supervision: Equal; Validation: Equal; Writing – original draft: Equal)
Supplementary Material
Note: To access the supplementary material accompanying this article, visit the online version of Clinical Gastroenterology and Hepatology at www.cghjournal.org, and at https://doi.org/10.1016/j.cgh.2022.04.014.
References
- 1.Younossi ZM, Koenig AB, Abdelatif D, et al. Global epidemiology of nonalcoholic fatty liver disease: meta-analytic assessment of prevalence, incidence, and outcomes. Hepatology 2016;64:73–84. [DOI] [PubMed] [Google Scholar]
- 2.Lim GEH, Tang A, Ng CH, et al. An observational data meta-analysis on the differences in prevalence and risk factors between MAFLD vs NAFLD. Clin Gastroenterol Hepatol 2021:Online ahead of print. [DOI] [PubMed] [Google Scholar]
- 3.Muthiah MD, Cheng Han N, Sanyal AJ. A clinical overview of non-alcoholic fatty liver disease: a guide to diagnosis, the clinical features, and complications– what the non-specialist needs to know. Diabetes Obes Metab 2022;24(Suppl 2):3–14. [DOI] [PubMed] [Google Scholar]
- 4.Muthiah MD, Sanyal AJ. Burden of disease due to nonalcoholic fatty liver disease. Gastroenterol Clin North Am 2020;49:1–23. [DOI] [PubMed] [Google Scholar]
- 5.Loomba R, Friedman SL, Shulman GI. Mechanisms and disease consequences of nonalcoholic fatty liver disease. Cell 2021; 184:2537–2564. [DOI] [PubMed] [Google Scholar]
- 6.Huang DQ, El-Serag HB, Loomba R. Global epidemiology of NAFLD-related HCC: trends, predictions, risk factors and prevention. Nat Rev Gastroenterol Hepatol 2021;18:223–238. [DOI] [PMC free article] [PubMed] [Google Scholar]
- 7.Huang DQ, Muthiah MD, Zhou L, et al. Predicting HCC response to multikinase inhibitors with in vivo cirrhotic mouse model for personalized therapy. Cell Mol Gastroenterol Hepatol 2021; 11:1313–1325. [DOI] [PMC free article] [PubMed] [Google Scholar]
- 8.Tan DJH, Ng CH, Lin SY, et al. Clinical characteristics, surveillance, treatment allocation, and outcomes of non-alcoholic fatty liver disease-related hepatocellular carcinoma: a systematic review and meta-analysis. Lancet Oncol 2022;23:521–530. [DOI] [PMC free article] [PubMed] [Google Scholar]
- 9.Ekstedt M, Hagström H, Nasr P, et al. Fibrosis stage is the strongest predictor for disease-specific mortality in NAFLD after up to 33 years of follow-up. Hepatology 2015;61:1547–1554. [DOI] [PubMed] [Google Scholar]
- 10.Abraldes JG, Trebicka J, Chalasani N, et al. Prioritization of therapeutic targets and trial design in cirrhotic portal hypertension. Hepatology 2019;69:1287–1299. [DOI] [PMC free article] [PubMed] [Google Scholar]
- 11.Nagula S, Jain D, Groszmann RJ, Garcia-Tsao G. Histological-hemodynamic correlation in cirrhosis-a histological classification of the severity of cirrhosis. J Hepatol 2006;44:111–117. [DOI] [PubMed] [Google Scholar]
- 12.Sanyal AJ, Van Natta ML, Clark J, et al. , NASH Clinical Research Network (CRN). Prospective study of outcomes in adults with nonalcoholic fatty liver disease. N Engl J Med 2021;385:1559–1569. [DOI] [PMC free article] [PubMed] [Google Scholar]
- 13.Taylor RS, Taylor RJ, Bayliss S, et al. Association between fibrosis stage and outcomes of patients with nonalcoholic fatty liver disease: a systematic review and meta-analysis. Gastroenterology 2020;158:1611–1625.e12. [DOI] [PubMed] [Google Scholar]
- 14.Dulai PS, Singh S, Patel J, et al. Increased risk of mortality by fibrosis stage in nonalcoholic fatty liver disease: Systematic review and meta-analysis. Hepatology 2017;65:1557–1565. [DOI] [PMC free article] [PubMed] [Google Scholar]
- 15.Riley RD, Lambert PC, Abo-Zaid G. Meta-analysis of individual participant data: rationale, conduct, and reporting. BMJ 2010; 340:c221. [DOI] [PubMed] [Google Scholar]
- 16.Higgins JPT, Thomas J, Chandler J, et al. Cochrane Handbook for Systematic Reviews of Interventions, version 6.2. 9.4.8: Meta-analysis of counts and rates. Vol 92021. [Google Scholar]
- 17.Younes R, Govaere O, Petta S, et al. Caucasian lean subjects with non-alcoholic fatty liver disease share long-term prognosis of non-lean: time for reappraisal of BMI-driven approach? Gut 2022;71:382–390. [DOI] [PubMed] [Google Scholar]
- 18.Page MJ, McKenzie JE, Bossuyt PM, et al. The PRISMA 2020 statement: an updated guideline for reporting systematic reviews. BMJ 2021;372:n71. [DOI] [PMC free article] [PubMed] [Google Scholar]
- 19.Munn Z, Moola S, Riitano D, et al. The development of a critical appraisal tool for use in systematic reviews addressing questions of prevalence. Int J Health Policy Manag 2014;3:123–128. [DOI] [PMC free article] [PubMed] [Google Scholar]
- 20.Guyot P, Ades AE, Ouwens MJ, Welton NJ. Enhanced secondary analysis of survival data: reconstructing the data from published Kaplan-Meier survival curves. BMC Med Res Methodol 2012;12:9. [DOI] [PMC free article] [PubMed] [Google Scholar]
- 21.Ahmad N, Ahuja SD, Akkerman OW, et al. Treatment correlates of successful outcomes in pulmonary multidrug-resistant tuberculosis: an individual patient data meta-analysis. Lancet 2018;392:821–834. [DOI] [PMC free article] [PubMed] [Google Scholar]
- 22.Gaudry S, Hajage D, Benichou N, et al. Delayed versus early initiation of renal replacement therapy for severe acute kidney injury: a systematic review and individual patient data meta-analysis of randomised clinical trials. Lancet 2020;395:1506–1515. [DOI] [PubMed] [Google Scholar]
- 23.Syn NL, Cummings DE, Wang LZ, et al. Association of metabolic-bariatric surgery with long-term survival in adults with and without diabetes: a one-stage meta-analysis of matched cohort and prospective controlled studies with 174,772 participants. Lancet 2021;397:1830–1841. [DOI] [PubMed] [Google Scholar]
- 24.Jackson D, White IR, Thompson SG. Extending DerSimonian and Laird’s methodology to perform multivariate random effects meta-analyses. Stat Med 2010;29:1282–1297. [DOI] [PubMed] [Google Scholar]
- 25.Kaplan EL, Meier P. Nonparametric estimation from incomplete observations. J Am Stat Assoc 1958;53:457–481. [Google Scholar]
- 26.Hosmer DW Jr, Lemeshow S, May S. Applied survival analysis: regression modeling of time to event data. John Wiley and Sons Inc, 1999. [Google Scholar]
- 27.Higgins JP, Thompson SG, Deeks JJ, et al. Measuring inconsistency in meta-analyses. BMJ 2003;327:557–560. [DOI] [PMC free article] [PubMed] [Google Scholar]
- 28.Fletcher J What is heterogeneity and is it important? BMJ 2007; 334:94–96. [DOI] [PMC free article] [PubMed] [Google Scholar]
- 29.Tufanaru C, Munn Z, Stephenson M, Aromataris E. Fixed or random effects meta-analysis? Common methodological issues in systematic reviews of effectiveness. Int J Evid Based Healthc 2015;13:196–207. [DOI] [PubMed] [Google Scholar]
- 30.Sedgwick P What is publication bias in a meta-analysis? BMJ 2015;351:h4419. [DOI] [PubMed] [Google Scholar]
- 31.Loomba R, Ratziu V, Harrison SA, NASH Clinical Trial Design International Working Group. Expert panel review to compare FDA and EMA guidance on drug development and endpoints in nonalcoholic steatohepatitis. Gastroenterology 2022; 162:680–688. [DOI] [PMC free article] [PubMed] [Google Scholar]
- 32.Noureddin M, Muthiah MD, Sanyal AJ. Drug discovery and treatment paradigms in nonalcoholic steatohepatitis. Endocrinol Diabetes Metab 2020;3:e00105. [DOI] [PMC free article] [PubMed] [Google Scholar]
- 33.Yong JN, Lim WH, Ng CH, et al. Outcomes of non-alcoholic steatohepatitis following liver transplantation. An updated meta-analysis and systematic review. Clin Gastroenterol Hepatol 2021:Online ahead of print. [DOI] [PubMed] [Google Scholar]
- 34.Bodzin AS, Baker TB. Liver transplantation today: where we are now and where we are going. Liver Transpl 2018; 24:1470–1475. [DOI] [PubMed] [Google Scholar]
Associated Data
This section collects any data citations, data availability statements, or supplementary materials included in this article.