Abstract
Purpose:
Spectral CT uses energy-dependent measurements that enable material discrimination in addition to reconstruction of structural information. Flat-panel detectors (FPDs) have been widely used in dedicated and interventional systems to deliver high spatial resolution, volumetric cone-beam CT (CBCT) in compact and OR-friendly designs. In this work, we derive a model-based method that facilitates high-resolution material decomposition in a spectral CBCT system equipped with a prototype dual-layer FPD. Through high-fidelity modeling of multilayer detector, we seek to avoid resolution loss that is present in more traditional processing and decomposition approaches.
Method:
A physical model for spectral measurements in dual-layer flat-panel CBCT is developed including layer-dependent differences in system geometry, spectral sensitivities, and detector blur (e.g., due to varied scintillator thicknesses). This forward model is integrated into a model-based material decomposition (MBMD) method based on minimization of a penalized weighted least-squared (PWLS) objective function. The noise and resolution performance of this approach was compared with traditional projection-domain decomposition (PDD) and image-domain decomposition (IDD) approaches as well as one-step MBMD with lower-fidelity models that use approximated geometry, projection interpolation, or an idealized system geometry without system blur model. Physical studies using high-resolution three-dimensional (3D)-printed water-iodine phantoms were conducted to demonstrate the high-resolution imaging performance of the compared decomposition methods in iodine basis images and synthetic monoenergetic images.
Results:
Physical experiments demonstrate that the MBMD methods incorporating an accurate geometry model can yield higher spatial resolution iodine basis images and synthetic monoenergetic images than PDD and IDD results at the same noise level. MBMD with blur modeling can further improve the spatial-resolution compared with the decomposition results obtained with IDD, PDD, and MBMD methods with lower-fidelity models. Using the MBMD without or with blur model can increase the absolute modulation at 1.75 lp/mm by 10% and 22% compared with IDD at the same noise level.
Conclusion:
The proposed model-based material decomposition method for a dual-layer flat-panel CBCT system has demonstrated an ability to extend high-resolution performance through sophisticated detector modeling including the layer-dependent blur. The proposed work has the potential to not only facilitate high-resolution spectral CT in interventional and dedicated CBCT systems, but may also provide the opportunity to evaluate different flat-panel design trade-offs including multilayer FPDs with mismatched geometries, scintillator thicknesses, and spectral sensitivities.
Keywords: dual-layer detector, material decomposition, model-based iterative reconstruction, spectral CT
1. INTRODUCTION
Spectral CT has found a number of clinical applications including contrast-enhanced lesion detection,1–3 kidney stone detection4 and classification,5,6 virtual non-contrast imaging,4,7,8 virtual monoenergetic imaging,9 and multiphasic functional imaging10 using multiple contrast agents injected in a single scan. Spectral CT systems collect energy-dependent measurements data separable into two or more channels. Since different materials have different energy-dependent attenuation coefficients, the measurements can be processed to differentiate materials and estimate material densities in addition to providing the structural information available in single-energy CT. A variety of spectral CT systems have been designed to collect energy-dependent measurements and can be roughly divided into two types: 1) CT systems that utilize varied x-ray source spectral modulations, where each spectral channel has a different incident spectrum, for example, through multiple sources,2,11–13 kV switching,14 and split3,15 or tiled filters16–18; and 2) CT systems that equip energy-resolving detectors such as dual-layer detectors11,12 and photon-counting detectors19–21 that can differentiate between x rays of different energies.
Flat-panel detectors (FPDs) have found widespread use in both digital radiography imaging and cone-beam CT (CBCT) systems, including interventional and dedicated scanners.22 A FPD enables measurement of projection data of a large volume in one rotation and the small sub-millimeter pixels are useful for imaging fine structures such as trabecular bone, the inner ear, small vessels, etc. Flat-panel CBCT systems can potentially benefit from the additional capability of material discrimination and material density estimation in both interventional and dedicated scanners. Interventional procedures that involve contrast agent injection can take advantage of the inherent separation in material decomposition providing both contrast and non-contrast images. Similarly, spectral CBCT enables improved quantitative imaging through direct density estimation with applications, for example, in osteology examinations with bone mineral density estimates. In previous work,23 Lu et al. have implemented a prototype dual-layer FPD that stacks two indirect amorphous silicon detectors each with its own CsI scintillator. Filtered by an intermediate copper filter sandwiched between the two layers, the incident x-ray beam to the second layer exhibits higher average energy for detected x rays, as compared with the first layer. These two channels provide the necessary data for material decomposition. The dual-layer FPD has shown promising preliminary results in both dual-energy x-ray radiography and spectral CBCT imaging.24
While the FPD has the potential for high spatial resolution imaging tasks due to the small native pixel size, scintillator blur in the indirect detectors plays an important role in overall spatial resolution properties. Imaging performance involves an inherent trade-off between the detector blur and quantum absorption efficiency.25,26 Specifically, thicker scintillators have more stopping power; however, there is also more light spread within the scintillator, producing a broader point spread function. This trade-off is more complicated in the dual-layer FPD as compared with a single-layer FPD, since the two scintillators may have different thicknesses. Different scintillator thicknesses can permit better efficiency and spectral separation by making the first layer thin (relatively more sensitive to low-energy (LE) photons) and the second layer thicker to stop the higher energy photons. However, accurate quantitative evaluation of material density can be challenging to multilayer systems because: 1) different scintillator thicknesses yield inconsistent blur between detection layers; 2) the detector grids may not be perfectly aligned due to manufacturing limitations; and 3) there is an inherent geometry mismatch due to the small gap between the two detector grids and divergent beam. Because of the noncoincident geometry, projection-domain decomposition (PDD)27,28 methods (that first decompose the measurements from all energy channels into line integrals of materials) can be more difficult to implement. Generally, such approaches necessitate some form of interpolation onto a common geometry; however, this interpolation will generally result in spatial resolution loss. Image domain decomposition (IDD)29,30 methods that estimate material densities after reconstruction of each spectral channel are potentially easier to implement and accommodate geometry changes between channels. However, IDD presumes a simple linear or polynomial model that is a mismatch with the intrinsic nonlinear behavior in spectral CT. Further post-processing is needed to reduce beam-hardening artifacts and may be suboptimal in quantitative studies. Compared with PDD and IDD methods that estimate the densities in two steps, one-step model-based methods31–36 can directly estimate the material densities from the spectral measurements using a high-fidelity system model as well as more sophisticated regularization design to potentially retain more high-resolution advantages with accurate quantification.
In this work, we propose a MBMD method with blur modeling dedicated to dual-layer FPD. Physical experiments on a CBCT test bench equipped with a prototype dual-layer FPD were conducted. MBMD performance with an averaged geometry model (aMBMD), single geometry model with projection-domain interpolation preprocessing (pMBMD), an idealized model (iMBMD), and the high-fidelity model including the detector blur (bMBMD) were compared with projection- and image-domain decomposition estimated from FBP reconstructions. Preliminary simulation studies were first presented in Wang et al,37 and initial physical experiments were shown in Ma et al.38 The paper presents a refined development of both the theory and performance investigations in physical experiments, building significantly upon those conference proceedings. The paper is organized as follows: Section 2 introduces the proposed MBMD method and the physical experiments setup. The results and analysis are summarized in Section 3. Finally, conclusion and discussion are presented in Section 4.
2. METHODS
2.A. Multilayer flat-panel detector model
In this section, we propose a general model for multilayer FPDs that stack multiple indirect amorphous silicon detectors each with its own scintillator layer. Importantly, each scintillator layer may have different thickness imparting different sensitivity and spatial resolution. Such varying resolution can be characterized and represented mathematically with a blur kernel in a forward model. Specifically, we write the energy-integral spectral measurement model presuming a -material imaging object as,
| (1) |
where is the spectral sensitivity at projection location , including all spectral filtering and source settings that affect the incident spectrum as well as energy-dependent detector sensitivities, denotes the blur kernel weight of location in the neighborhood of pixel centered at , and and denote the density and the energy-dependent mass attenuation coefficients of material , respectively. Lines of response are given by . Note that indexes pixels in all panel layers.
For digital estimation purpose, it is convenient to discretize this forward model. Specifically, we discretize (1) using image voxels, energy bins, and presampling “pixels” so that the mean measurements can be written as follows:
| (2) |
where is the material density in the voxel and is the corresponding path length of the projection through the voxel. The energy spectrum is sampled with the unit . A total of energy bins are considered . The projection image is presampled with interval , permitting modeling of the presampling blur, . Note that the pre-blurred image is a function of and may have different sampling than the post-blur image which is a function of representing physical pixels and the measurement index. Using a matrix formulation, one can write the forward model compactly as follows:
| (3) |
where is a vectorized stack of all materials density images with voxels in material bases, is a vectorized stack of all spectral projections with projections (the number of pixels in each frame times the number of views) in spectral channels, is the system matrix that forward projects all material bases to all spectral channels, and is the mass attenuation coefficients matrix that weights and sums the path lengths over all materials to compute energy-dependent line integrals. System spectral sensitivities and blur are characterized by and , respectively. When applying the generalized model to the dual-layer flat-panel CBCT system, the geometry, spectral sensitivities, and system blur vary between the spectral channels. For example, the general system matrix includes system matrix of the LE channel (first layer) and that of the high-energy (HE) channel (second layer) . Detailed compositions of the matrices in the dual-layer flat-panel CBCT system are shown in Appendix A. We will use the above formulation in Equation 3 to derive our proposed MBMD approach. The model is general and can accommodate lower-fidelity system models that do not include the geometry mismatch through substituting of each channel with an approximated system matrix or neglecting the detector blur by using the same expression with .
2.B. Model-based material decomposition
Presuming the spectral measurements follow a multivariate Gaussian distribution where the mean is given by the proposed forward model in Equation 3 and has covariance ,
| (4) |
one can write the regularized likelihood-based objective function as37
| (5) |
We further presume the measurements follow an independent Poisson distribution. The covariance matrix is diagonal where the variance is approximated with the measurements, . The regularizer controls the smoothness level of the estimated images. In this work, we adopt a quadratic penalty on differences in the 4-nearest neighborhood in each material basis.
| (6) |
where denotes the regularization strength for the material.
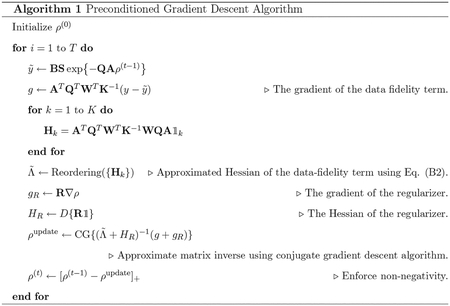
The material decomposition results are estimated by minimizing the objective function iteratively using a preconditioned gradient descent (pGD) algorithm reported in Tivnan et al.39 Details of the algorithm implementation and convergence performance evaluation are summarized in Appendix B.
2.C. Dual-layer flat-panel detector characterization
Flat-panel spectral sensitivities and blurs are essential inputs in the proposed MBMD method and need to be calibrated before decomposition. In this section, we outline a characterization method that we will adopt in our physical experiments using a prototype dual-layer FPD23 by Varex Imaging, Inc.
Spectral sensitivities are modeled with the incident spectrum and detector spectral sensitivities :
| (7) |
The spectrum incident on the first layer includes an idealized source spectrum and additional filtration modeled with aluminum thickness , where was computed with Spektr.40
| (8) |
We fit one aluminum thickness for all pixels in both channels. This additional filtration in the model permits calibration between the our physical system and the ideal spectrum provided by . The spectrum incident on the second layer is modeled as the composition of the incident spectrum of the first layer attenuated with the scintillator in the first layer and any intermediate filtration. Specifically, for the prototype Varex detector, the top layer of the dual-layer FPD has a CsI scintillator and the second layer has a CsI scintillator. Between the two layers, there is a 1-mm copper filter to improve spectral separation between the two spectral channels. Therefore, the CsI thickness and the copper filtration thickness . Energy-dependent linear attenuation coefficients of CsI and copper are denoted with and , respectively.
| (9) |
Detector sensitivities were computed with an energy- and depth-dependent sensitivity model of CsI.41 To incorporate the depth dependence, each scintillator is divided into thin slabs of thickness . The mean absorption of x-ray photons of energy at depth is follows:
| (10) |
where denotes the density of CsI and denotes the energy-dependent mass attenuation coefficients of CsI. For each detection, we consider three pathways of x-ray photon energy deposit: A) an x-ray photon absorption without yielding a K-fluorescence, B) and x-ray photon absorption with a K-fluorescence, and C) absorption of a K-fluorescence produced locally at a remote site.
| (11) |
| (12) |
| (13) |
The probability of a K-fluorescence yield is denoted with , which is zero when the incident x-ray photon energy is below the K-fluorescence energy . The fraction of K-fluorescence reabsorption is . We adopt a depth-dependent light escape fraction that models the fraction of locally converted optical photons that reach at the exit surface of the scintillator. A linear model proposed by Howansky et al.42 is used for a direct deposit CsI scintillator detector:
| (14) |
The parameters and vary with different scintillator thicknesses. For the first layer of thickness, we adopt and . For the second layer of thickness, we use and . The overall spectral sensitivity of each detector is modeled with an integration of all scintillator slabs among three pathways,
| (15) |
where is a constant that models the additional gain.
In our system, the only unknown parameter in the spectral sensitivities model is the aluminum filter thickness . This is calibrated through fitting the measurements with varying thickness of aluminum plates and copper plates to the model. Specifically, the optimized aluminum thickness in the incident spectrum model is computed through minimizing the mean square error between the measurements and model predictions.
| (16) |
The overall spectral sensitivities in the two spectral channels are shown in Fig. 1a. The detector modulation transfer functions (MTFs) of each layer have been measured using an edge device43 and reported in previous work.23 The MTFs are shown in Fig. 1b. A one-dimensional (1D) blur kernel in the horizontal direction is constructed and convolved with the projection data for in-plane resolution improvement. This can be easily extended to a two-dimensional (2D) case presuming the system blur is isotropic.
Fig. 1.

The calibrated (a) spectral sensitivities and the (b) MTFs of the low-energy and high-energy channels.
2.D. Material decomposition methods for comparison
2.D.1. Image-domain decomposition and projection-domain decomposition
Conventional two-step material decomposition methods including IDD and PDD were implemented for comparison. For IDD, we first reconstructed each spectral channel using filtered back-projection (FBP) method and then decomposed the two attenuation maps into two material densities through a linear combination by applying the inverse of the effective attenuation coefficients matrix.
| (17) |
In the physical experiment, the attenuation coefficients were estimated from two small uniform regions in the phantoms that contained only iodine solution or only solid three-dimensional (3D)-printing materials. To implement the PDD method, projections for each layer must be on a common grid. The geometrically matched measurements were approximated through interpolation of LE channel data to the HE channel grid. The line integrals of each material were estimated with a fourth-order polynomial of the post-log interpolated spectral measurements.24
| (18) |
| (19) |
where coefficients and were precomputed using a 2D grid of water and iodine line-integrals and corresponding measurements simulated with the calibrated spectral model. The material densities and are reconstructed from the estimated line integrals and using FBP. In both IDD and PDD, the noise-resolution trade-offs are explored through filter width sweeps on the following filter design in FDK:
| (20) |
The higher spatial frequencies are increasingly regularized with a smaller . We performed a sweep of between 0.6 and 1 with a 0.05 step size. In resolution measurement, a scalar was applied to match the mean CT value in small uniform regions in both material bases with the MBMD results for comparison.
2.D.2. Model-based material decomposition
We implemented four versions of the proposed one-step MBMD method using models with increasingly higher fidelity to demonstrate the impact of modeling the geometry mismatch and detector blur in the dual-layer CBCT system.
aMBMD: A simplest model was used that approximates the geometry between the two layers with an averaged geometry using the averaged source-to-detector distance (SDD) and source projection coordinates . The layer-dependent magnification and grid mismatch were neglected. The system blur was not included in the model .
pMBMD: The measurements of the first layer (LE channel) are interpolated onto the second-layer grid in the projection domain using bi-linear interpolation. The interpolated measurements were then decomposed using the proposed MBMD method with the geometry of the second layer . The system blur was not included in the model .
iMBMD: For each detector layer, the geometry was calibrated and implemented that models the magnification difference and pixel grid misalignment. The system blur was not included in the model .
bMBMD: The complete high-fidelity model that includes the layer-dependent geometry and the system blur model.
In each decomposition, we initialized the estimates with IDD results and used 60 iterations of the pGD algorithm to achieve a good convergence.
2.E. Experimental setup
In the physical experiments, we investigated quantitative accuracy using a water-iodine phantom and the high-resolution capability with two specialized 3D-printed phantoms designed with high-resolution patterns/textures. The water-iodine phantom used in quantitative evaluation study includes 6 vials containing a water and iodine solution with concentration varying from 10 mg/mL to 50 mg/mL in 10 mg/mL increment (Fig. 2e). The digital design and photographs of the 3D-printed high-resolution phantoms are shown in Figs. 2a, 2b, 2c and 2d. The first phantom includes seven groups of line-pairs designed with spatial frequencies varying from 0.25 lp/mm to 1.75 lp/mm in 0.25 lp/mm increment. The second phantom has a number of spherical voids ranging from 1 to 2 mm in a cylinder that emulate trabecular bone structures.44 Both phantoms are immersed in a 40 mg / mL iodine solution and vacuum processed to eliminate air bubbles. The material decomposition used water and iodine as basis materials.
Fig. 2.
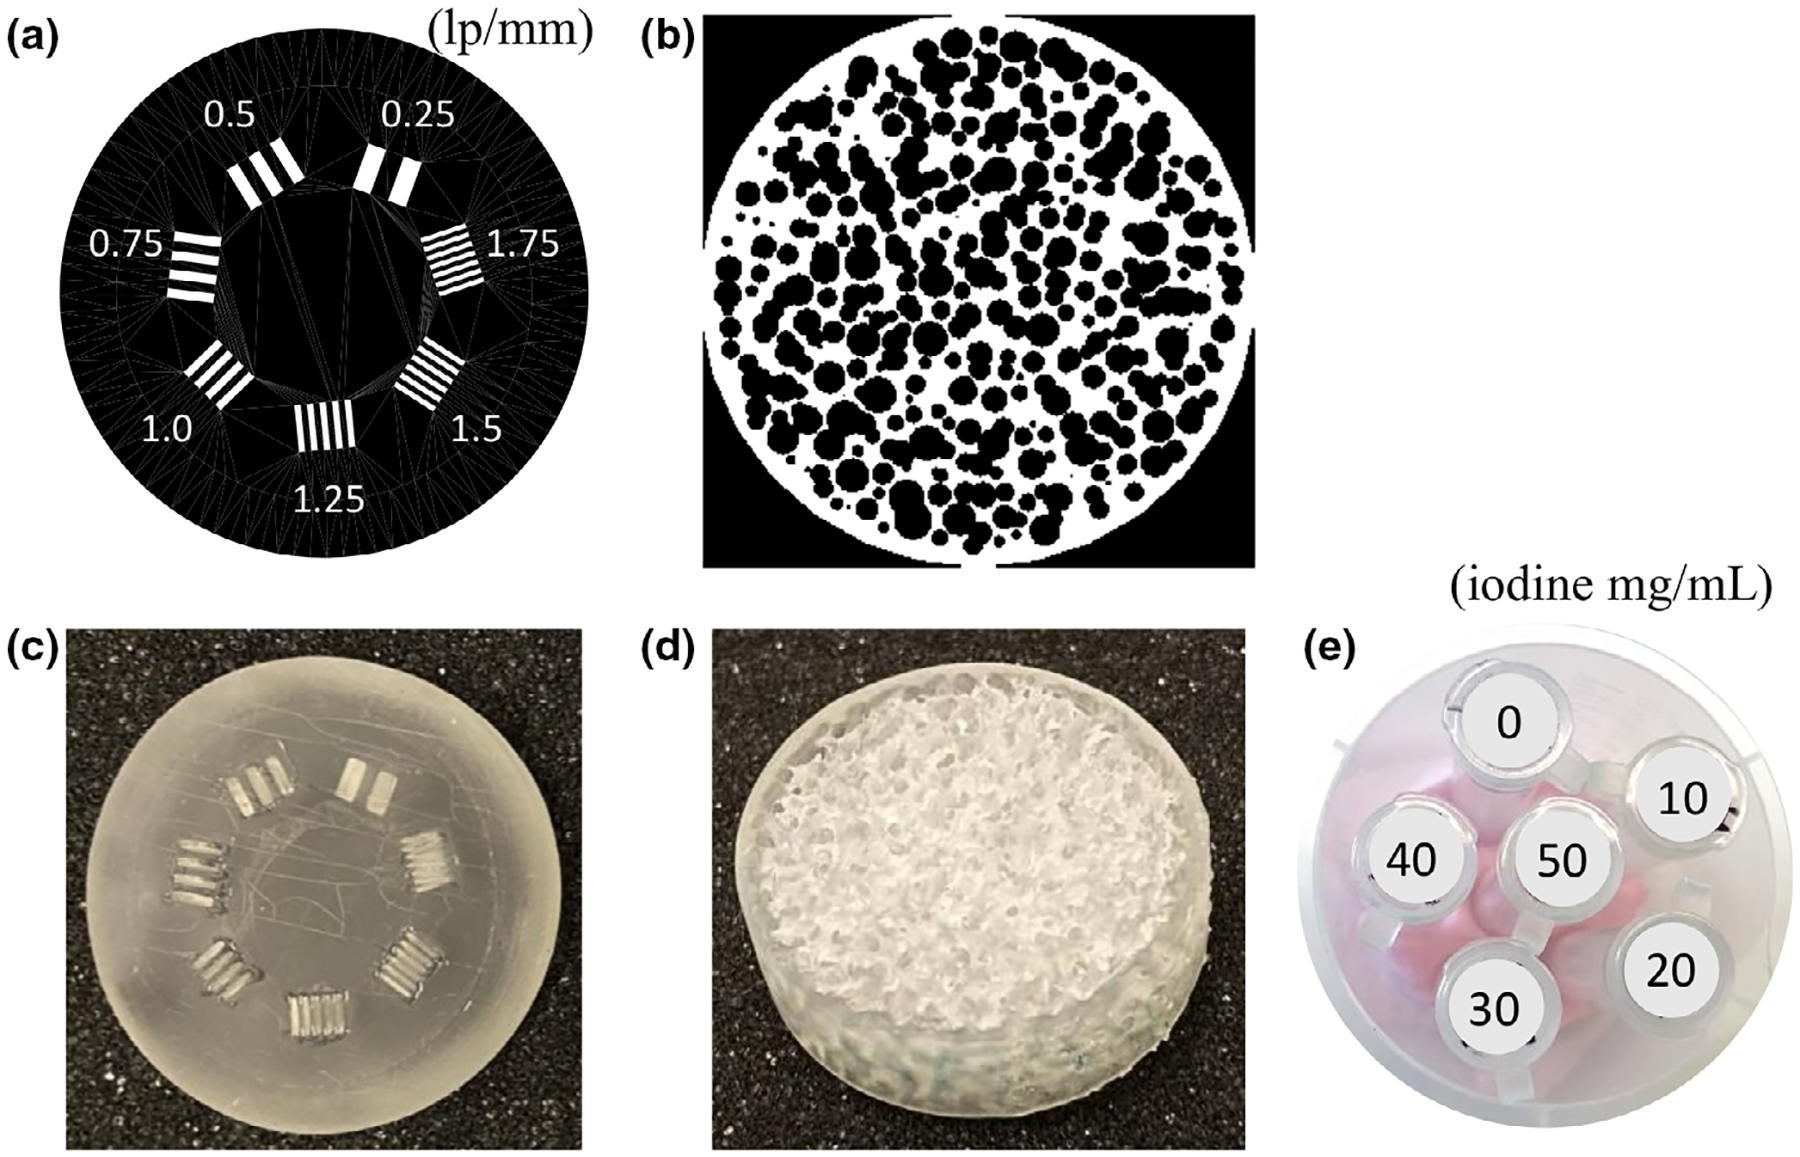
Digital designs of (a) the line-pair phantom and (b) the trabecular phantom. (c) Photograph of the 3D-printed line-pair phantom. (d) Photograph of the 3D-printed trabecular phantom. (e) Photograph of the physical phantom for quantification accuracy validation.
A prototype dual-layer FPD with 43 cm × 43 cm field-of-view (Varex Imaging, San Jose, CA) was investigated with a CsI scintillator top layer that collects relatively low-energy measurements and a CsI scintillator bottom layer for a relatively high-energy channel. Both channels use a-Si detector panel consisting of 2880 × 2880 pixels. A 1-mm copper filtration layer is sandwiched between the two layers to improve spectral separation.
The prototype dual-layer FPD is equipped on a CBCT test bench (Fig. 3) consisting of a rad/fluoro x-ray source (Rad-94, Varex Imaging, San Jose, CA) and a rotary stage (Alio Industries, Arvada, CO).
Fig. 3.
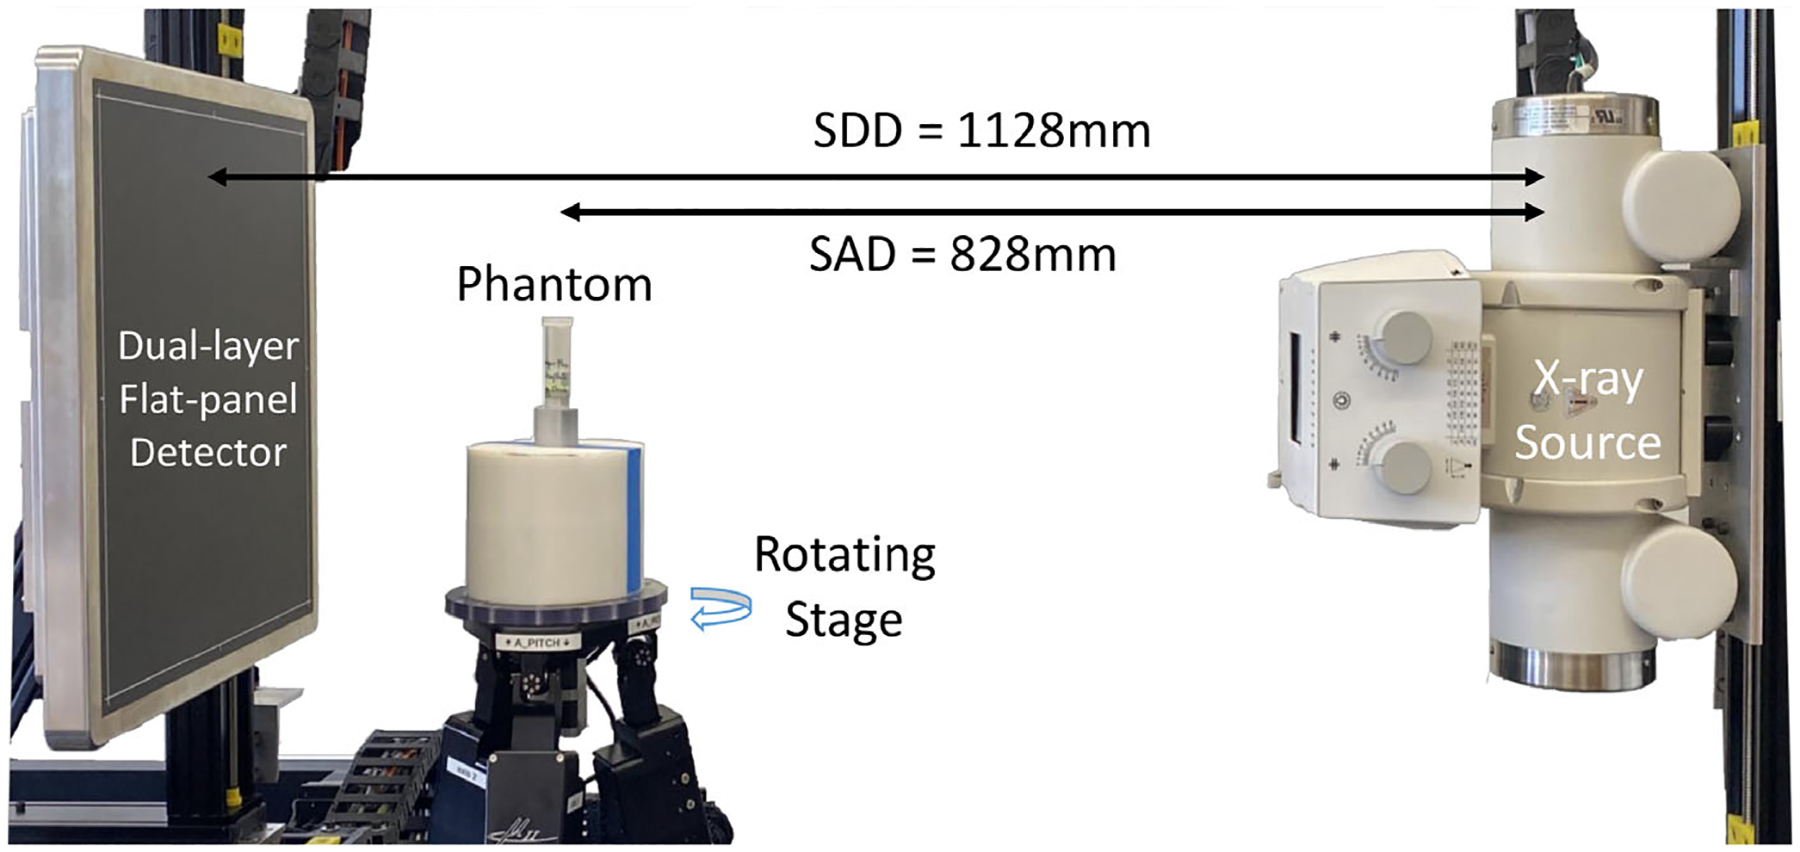
Cone-beam CT test bench equipped with a prototype dual-layer flat-panel detector.
For each phantom, projections were acquired over 720 views in a 360° rotation with uniform angular sampling. The x-ray technique was a constant 90 kVp and 1 mAs per frame. The SDDs, SAD, and the projection point of the source at each of the pixel-grids were calibrated using Cho et al45 for each layer. The SAD was 828 mm and the SDD was 1126 mm for the first layer and 1132 mm for the second layer. The mismatch between the two pixel-grids was 2 pixels in the horizontal direction and 0.4 pixel in the vertical direction. Native 150 pixels were used without binning. Incident fluence levels were estimated by computing the mean over variance of the normalized measurements in the air region presuming all noise was quantum and Poisson distributed. Estimated incident fluence was 1.3 × 10⁴ photons/pixel in the first layer, and 6.7 × 10³ photons/pixel in the second layer. Six different methods were used to estimate material decomposition results in water/iodine: IDD, PDD, aMBMD, pMBMD, iMBMD, and bMBMD. All methods used two 360 × 360 × 3 volumes (i.e., iodine and water bases) with 0.11 mm cubic voxels. The impact of regularization strength was investigated with 8 regularization strengths in the iodine basis applied between 104.5 and 108 with an uniform exponential interval of 100.5. The regularization strength in the water basis was scaled to be proportional to with a fixed ratio of 6 × 10⁻⁴ to balance the regularization in both material bases.
3. RESULTS
3.A. Quantitative evaluation
Reconstructions of the quantitative phantom using IDD, PDD, aMBMD, pMBMD, iMBMD, and bMBMD are summarized in Fig. 4. The mean estimates and standard deviations of five iodine concentration levels varying from 10mg/mL to 50mg/mL are reported in Fig. 5, in which the reference concentration levels are marked with black dashed lines. In the IDD iodine basis image, the nonuniformity in each vial is obvious with higher estimates at the boundaries of the circles due to beam-hardening effect. This artifact is not observed in PDD and MBMD results. From the bar plots, we observe that the IDD, PMBMD, IMBMD, and bMBMD methods slightly overestimate the iodine concentration, while the PDD and aMBMD methods underestimate the iodine concentration. Specifically, iMBMD and bMBMD estimates show good agreement at all concentration levels, suggesting that the incorporation of the system blur model does not influence the quantification accuracy. The relative errors of the PMBMD, iMBMD, and bMBMD methods at all concentration levels do not exceed 8.7%, 11.9%, and 12.3%, respectively.
Fig. 4.
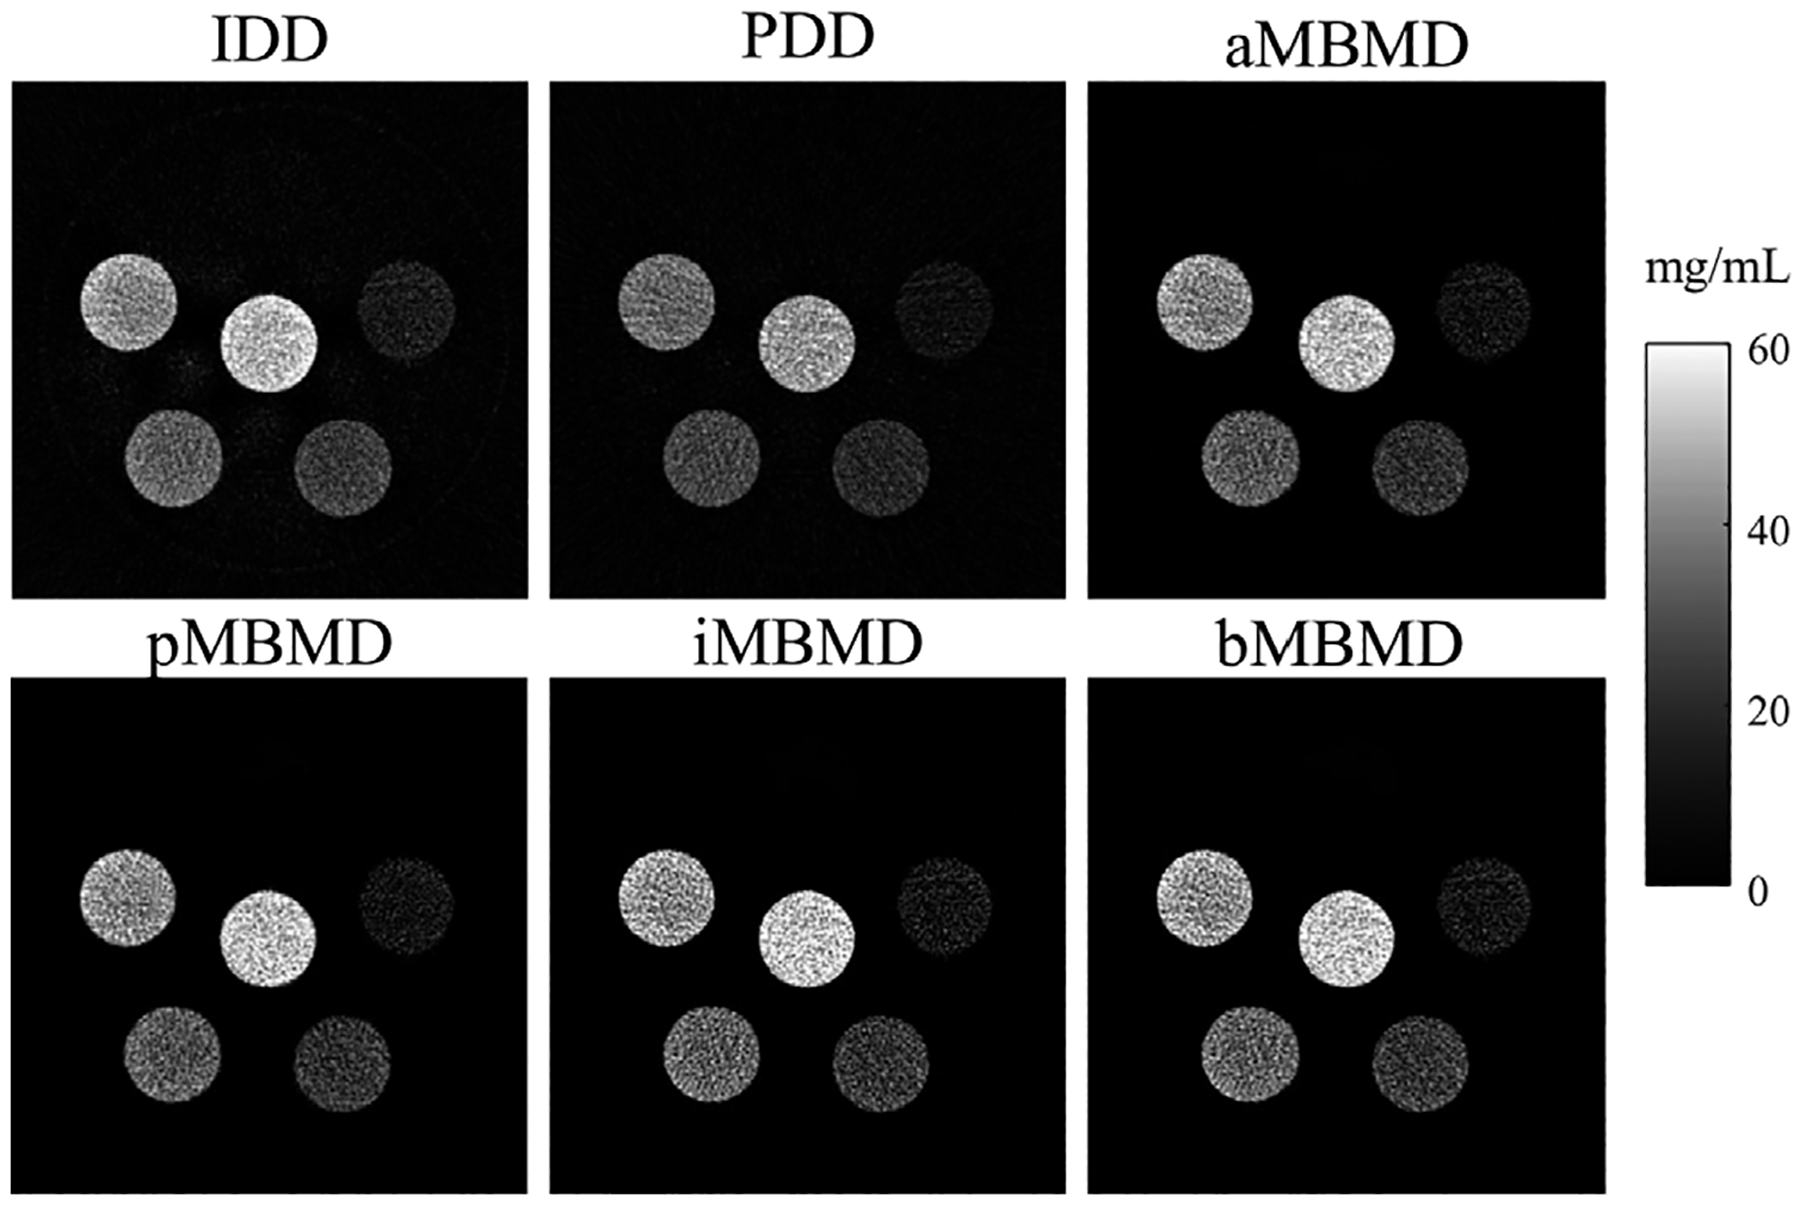
Decomposed iodine images of the quantitative phantom in Fig. 2e using IDD, PDD, aMBMD, pMBMD, iMBMD, and bMBMD.
Fig. 5.
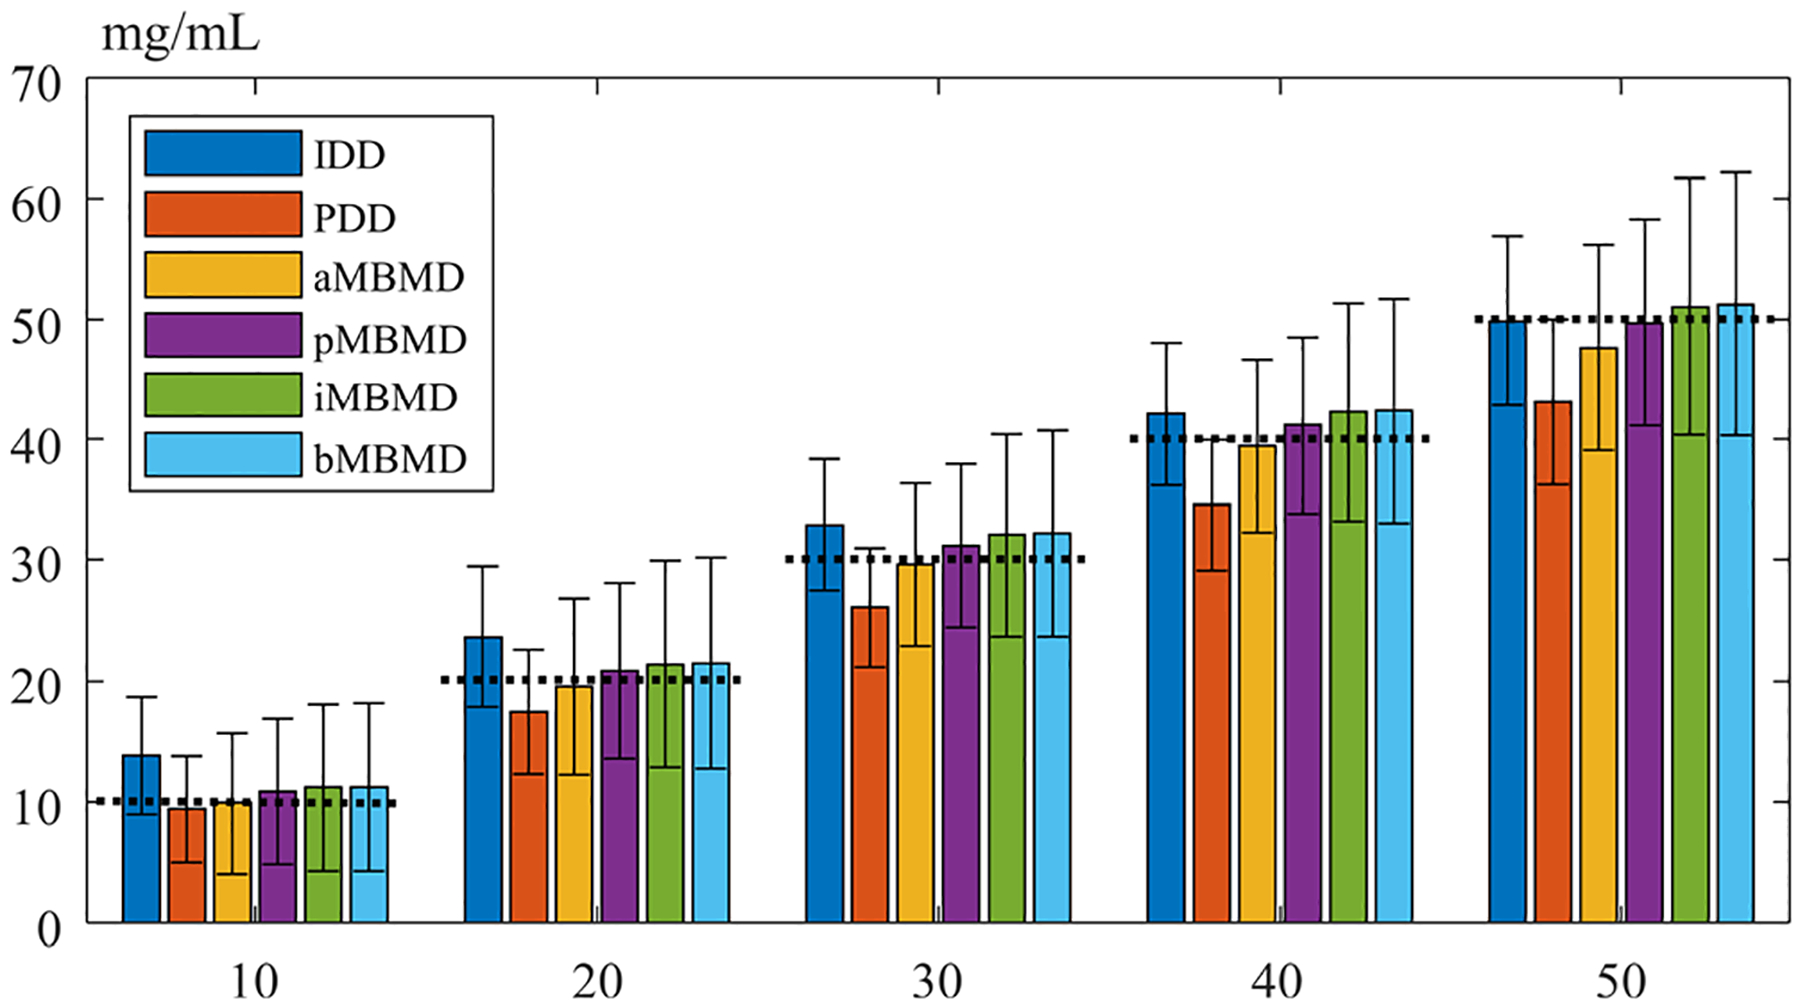
Mean estimates and standard deviations of the iodine concentrations at 10 to 50 / using IDD, PDD, aMBMD, pMBMD, iMBMD, and bMBMD.
3.B. High-resolution imaging performance evaluation
Iodine material decompositions of the 3D-printed line-pair phantom are shown in Fig. 6 for qualitative comparison. The finest line pairs at 1.75 lp/mm are highlighted in the yellow square and are shown in the zoomed-in figures on the left upper corner of each subplot. The iodine noise level is measured as the standard deviation in a uniform region. We chose the regularization parameters for each material decomposition method so that the noise is approximately at the same level. Specifically, the filter widths (as defined in Equation 20) of IDD and PDD are 0.95 and 0.9. The regularization strengths in iodine are 105.5, 105, 105.5, and 106 in aMBMD, pMBMD, iMBMD, and bMBMD, respectively. The measured noise is noted at the lower right corner of the plots. The aMBMD result shows the worst spatial resolution where the 1.75 lp/mm line pairs are not visible. This is because of the excessive blur introduced by the inaccurate geometry model. The 1.75 lp/mm line pairs can be recognized in IDD and PDD results, but are blurrier as compared with the PMBMD, iMBMD, and bMBMD results. The line pairs in bMBMD estimates show the sharpest structure and the highest contrast among all iodine images.
Fig. 6.
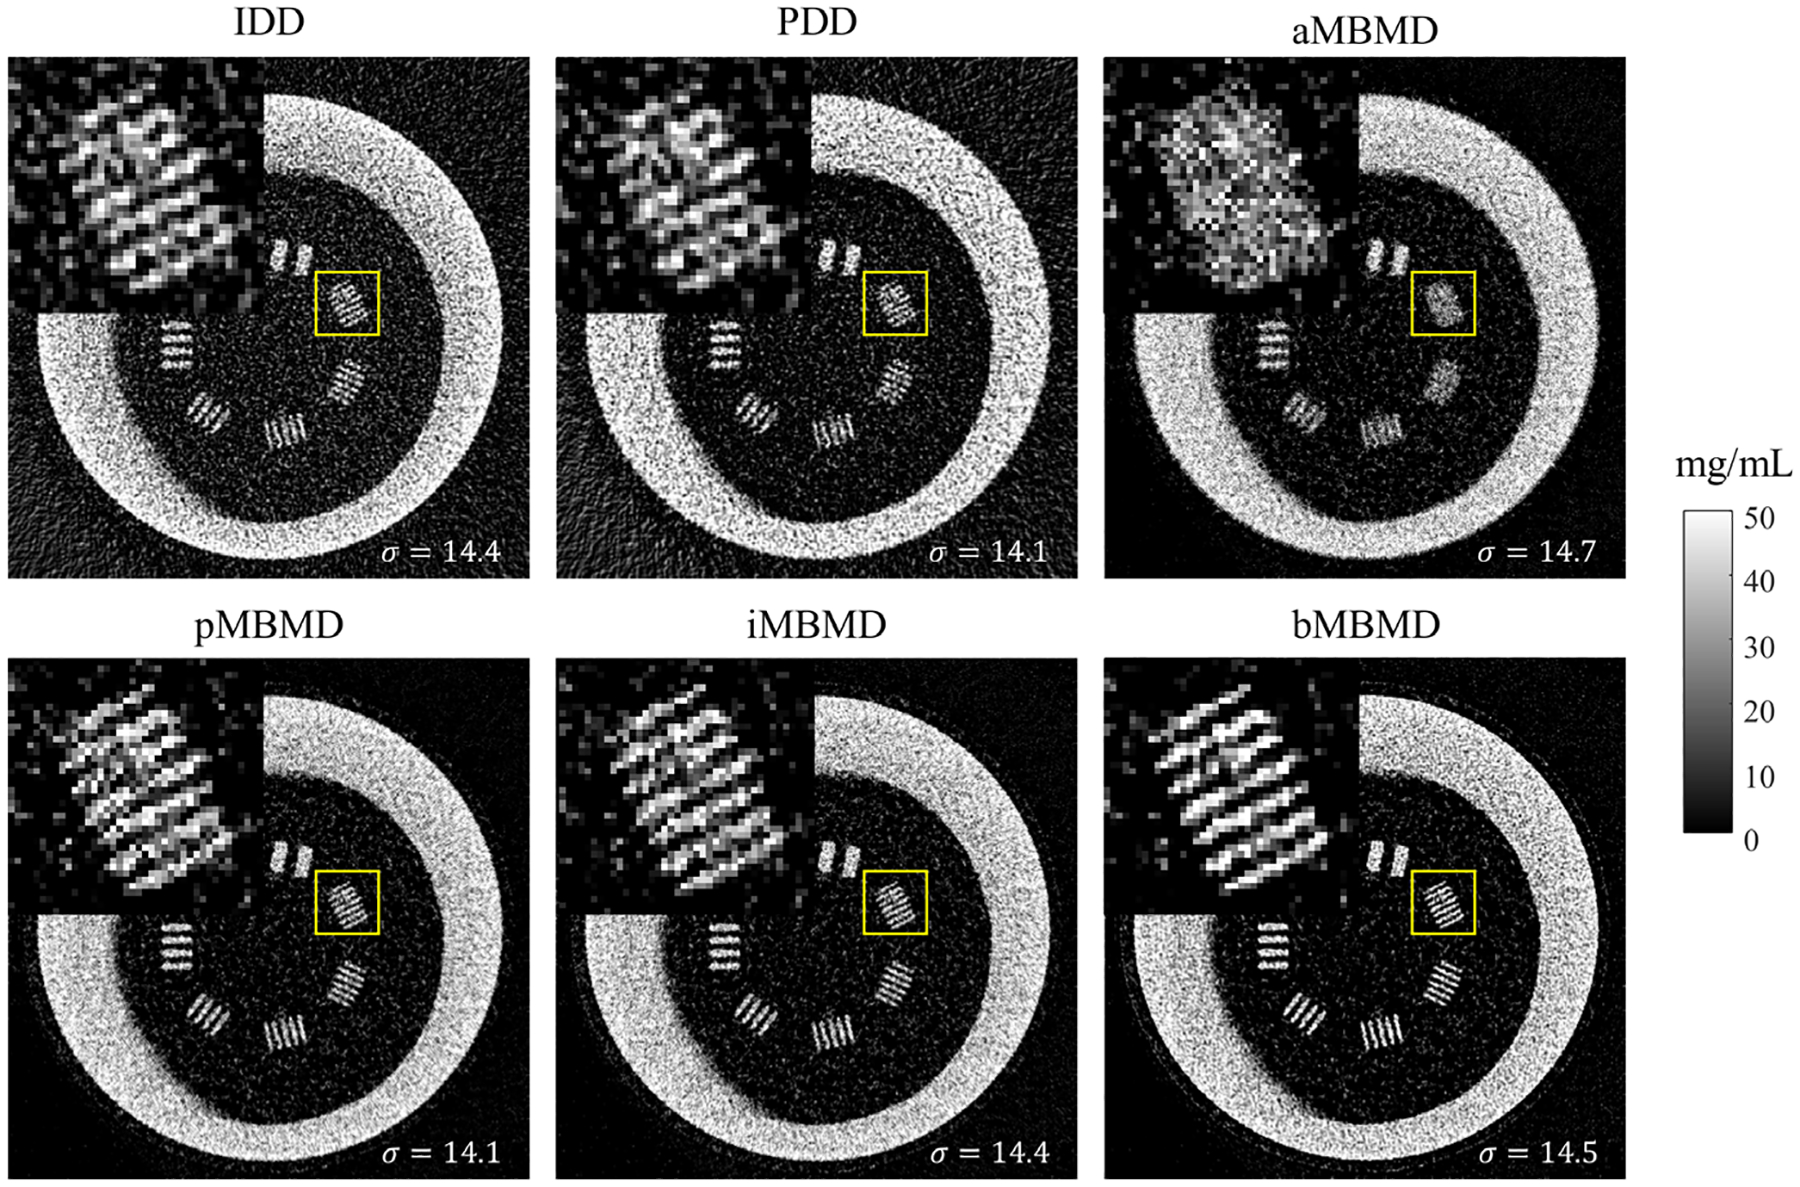
Material decomposition results of the line-pair 3D-printed phantom. Each of the subplots shows the iodine basis images using IDD, PDD, aMBMD, pMBMD, iMBMD, and bMBMD.
We show the iodine material decomposition results in the 3D-printed trabecular phantom in Fig. 7. We chose the regularization parameters to achieve a good match in the noise level between the methods. The filter widths of IDD and PDD are 1.0 and 0.95, respectively. The regularization strengths in iodine are 105.5, 104.5, 105.5, and 106 in aMBMD, pMBMD, iMBMD, and bMBMD, respectively. Again, the aMBMD result qualitatively shows the worst spatial resolution performance, and the bMBMD result shows the sharpest features.
Fig. 7.
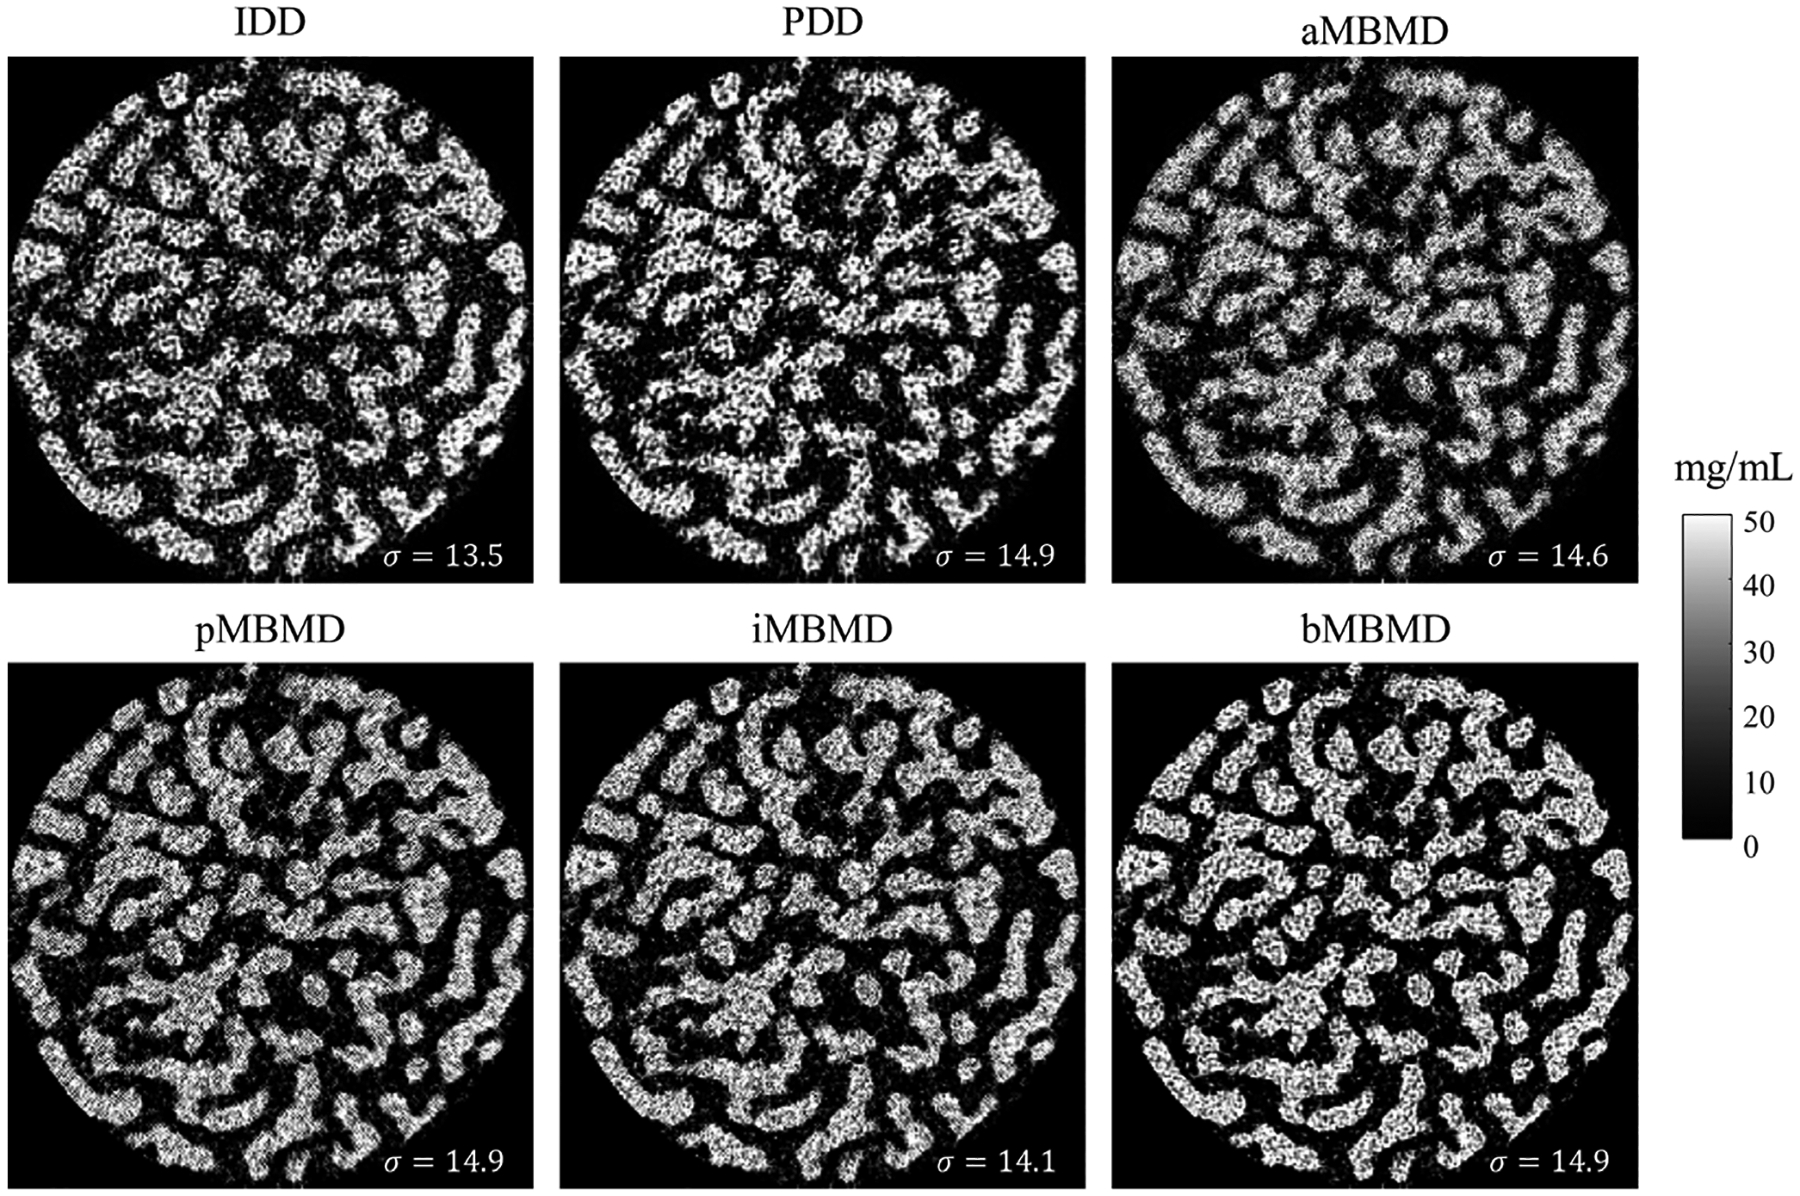
Material decomposition results of the trabecular 3D-printed phantom. Each of the subplots shows the iodine basis images using IDD, PDD, aMBMD, pMBMD, iMBMD, and bMBMD.
For quantitative comparison of methods, the noise and resolution properties were computed in the iodine material decomposition images with different filter widths in IDD and PDD, and varying regularization parameters in MBMD methods. The resolution is characterized as the modulation of the line pairs at 1.75 lp/mm and the noise is measured as the standard deviation in a uniform region. To eliminate the influence of absolute quantification mismatch, each of the iodine images is normalized to attain 40 mg/ml in the uniform region. The noise-resolution curves are plotted in Fig. 8. The aMBMD results were not included here because the line pairs at 1.75 lp/mm in aMBMD were completely blurred across all investigated regularization parameters. The trade-off between noise and spatial resolution was tuned by the filter window width in IDD and PDD, and by the regularization strength in MBMD. With a broader frequency window in FBP (larger ), the spatial resolution in IDD and PDD results is higher, but with increased noise. Similarly, with lower regularization strength, all MBMD results exhibit improvement in spatial resolution and higher noise. Compared with IDD results, the PDD results show reduced spatial resolution at matched noise level. This spatial resolution loss is potentially due to the spatial interpolation in the projection domain. This spatial resolution loss also affects the performance of pMBMD, where the same interpolation is used in projection preprocessing. The iMBMD and bMBMD methods outperform the PDD and IDD methods with higher spatial resolution and lower noise. At a similar noise level (12mg/mL), the iMBMD approach can achieve a 10% absolute improvement and the bMBMD approach can achieve a 22% absolute improvement over IDD in modulation at 1.75 lp/mm. With further decreased regularization strength, the bMBMD approach can further improve the spatial resolution at a cost of higher noise. The iMBMD approach reaches a resolution limit despite lower regularization due to the mismatched ideal blur model.
Fig. 8.
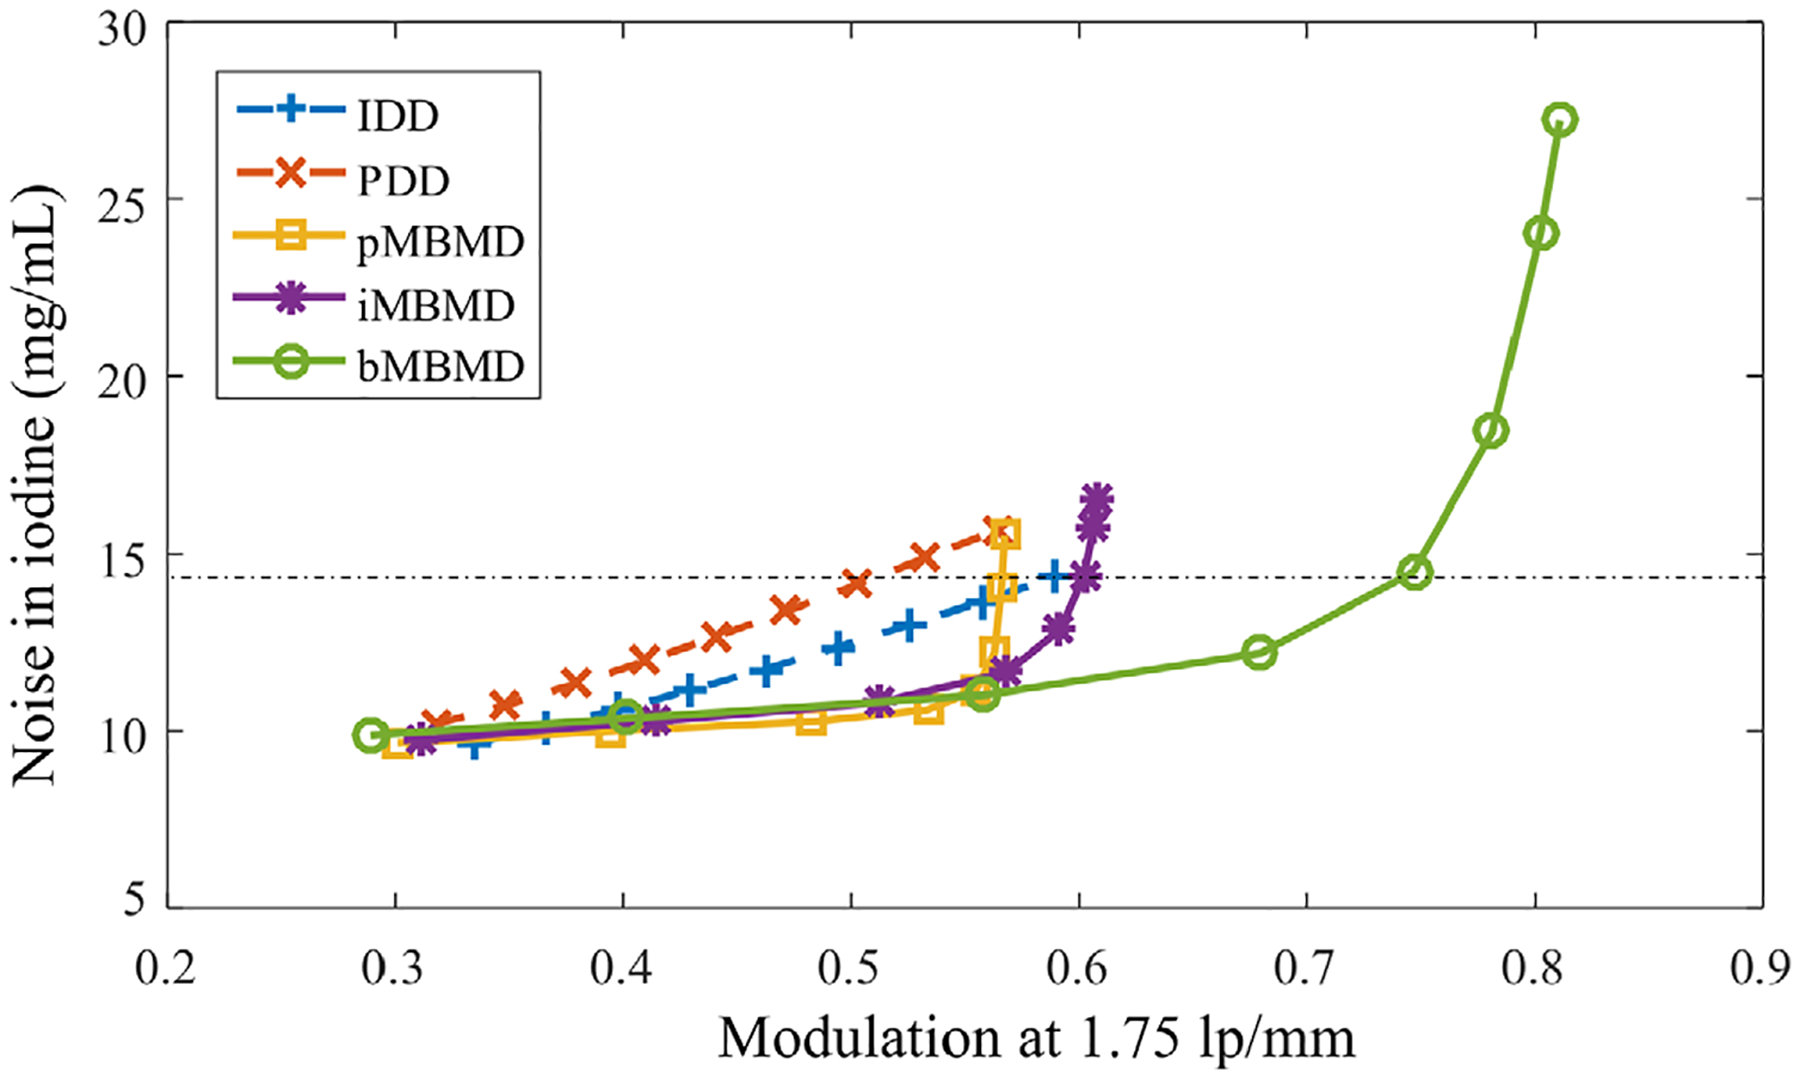
Noise-resolution characterization curves in the iodine basis images estimated through IDD, PDD, pMBMD, iMBMD, and bMBMD with varying regularization parameters. The black horizontal dashed line indicates the noise level of the images shown in Fig. 6.
Synthetic monoenergetic images of the line-pair phantom at 40, 50, and 60 kV are shown in Fig. 9. The regularization parameters are chosen to match the noise level in 50 kV monoenergetic images. Specifically, the filter widths of IDD and PDD are 1.0 (no additional filtration). The regularization strengths in iodine are 106.5, 106, 106.5, and 106.5 in aMBMD, pMBMD, iMBMD, and bMBMD, respectively. The measured noise levels are displayed at the lower right corner of each subplot. In the IDD results, beam-hardening artifacts are observed, particularly in monoenergetic images at lower energy. The PDD and MBMD results eliminate the beam-hardening artifacts due to the intrinsic nonlinear spectral modeling. The spatial resolution of the MBMD methods, except for the aMBMD, is finer than the PDD results at all energies. In the monoenergetic images of the IDD and PDD, the spatial resolution decreases at higher energies because the high-energy channel has lower intrinsic resolution due to the thicker scintillator layer. This trend is not observed in the MBMD methods, but the noise in MBMD results at 60 kV are higher than the IDD and PDD results. The different noise-resolution trade-off of MBMD as compared to conventional methods has potential benefits for high-resolution imaging tasks. The bMBMD method that incorporates the system blur model demonstrates the best spatial resolution improvement in monoenergetic images. Similar to the analysis in iodine basis images, the noise and resolution properties are computed in the 50-kV monoenergetic images with varying filter width in IDD and PDD, and varying regularization parameters in MBMD methods. The noise-resolution curves are plotted in Fig. 10. At the same noise level (7 × 10⁻³)-mm−1)), the MBMD methods show improved spatial resolution. Moreover, the highest achievable spatial resolution is improved with iMBMD and bMBMD methods by 5% and 26%, respectively.
Fig. 9.
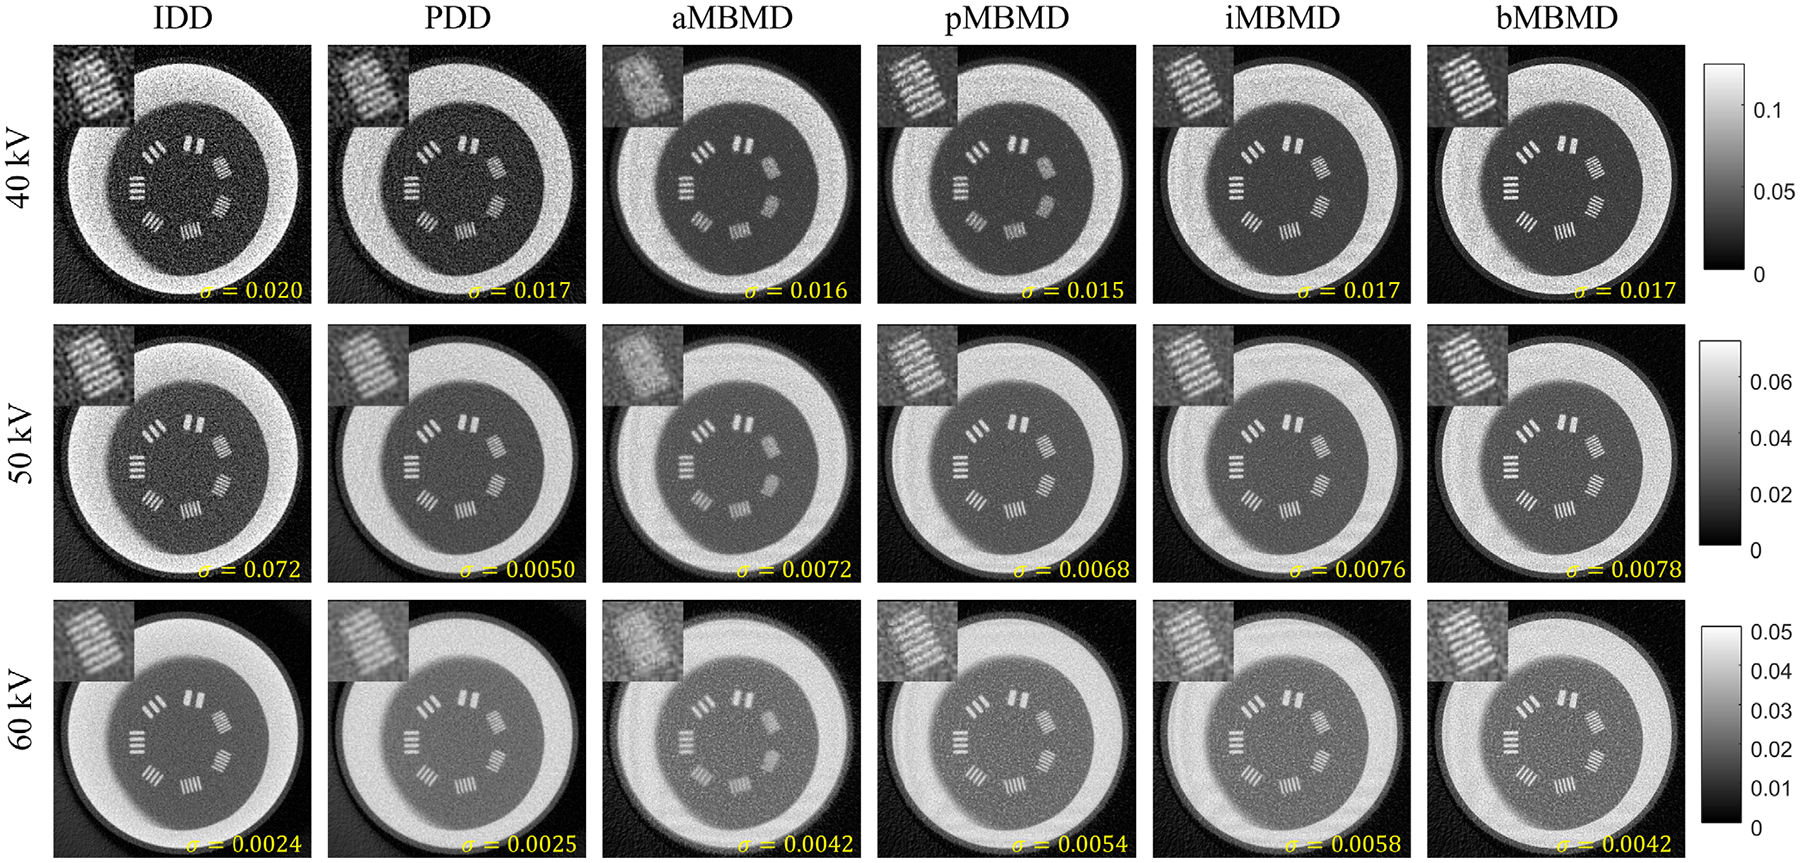
Synthetic monoenergetic images at 40, 50, and 60 kV of the 3D-printed line-pair phantoms. Each of the columns shows the estimates using IDD, PDD, aMBMD, pMBMD, iMBMD, and bMBMD.
FIG. 10.
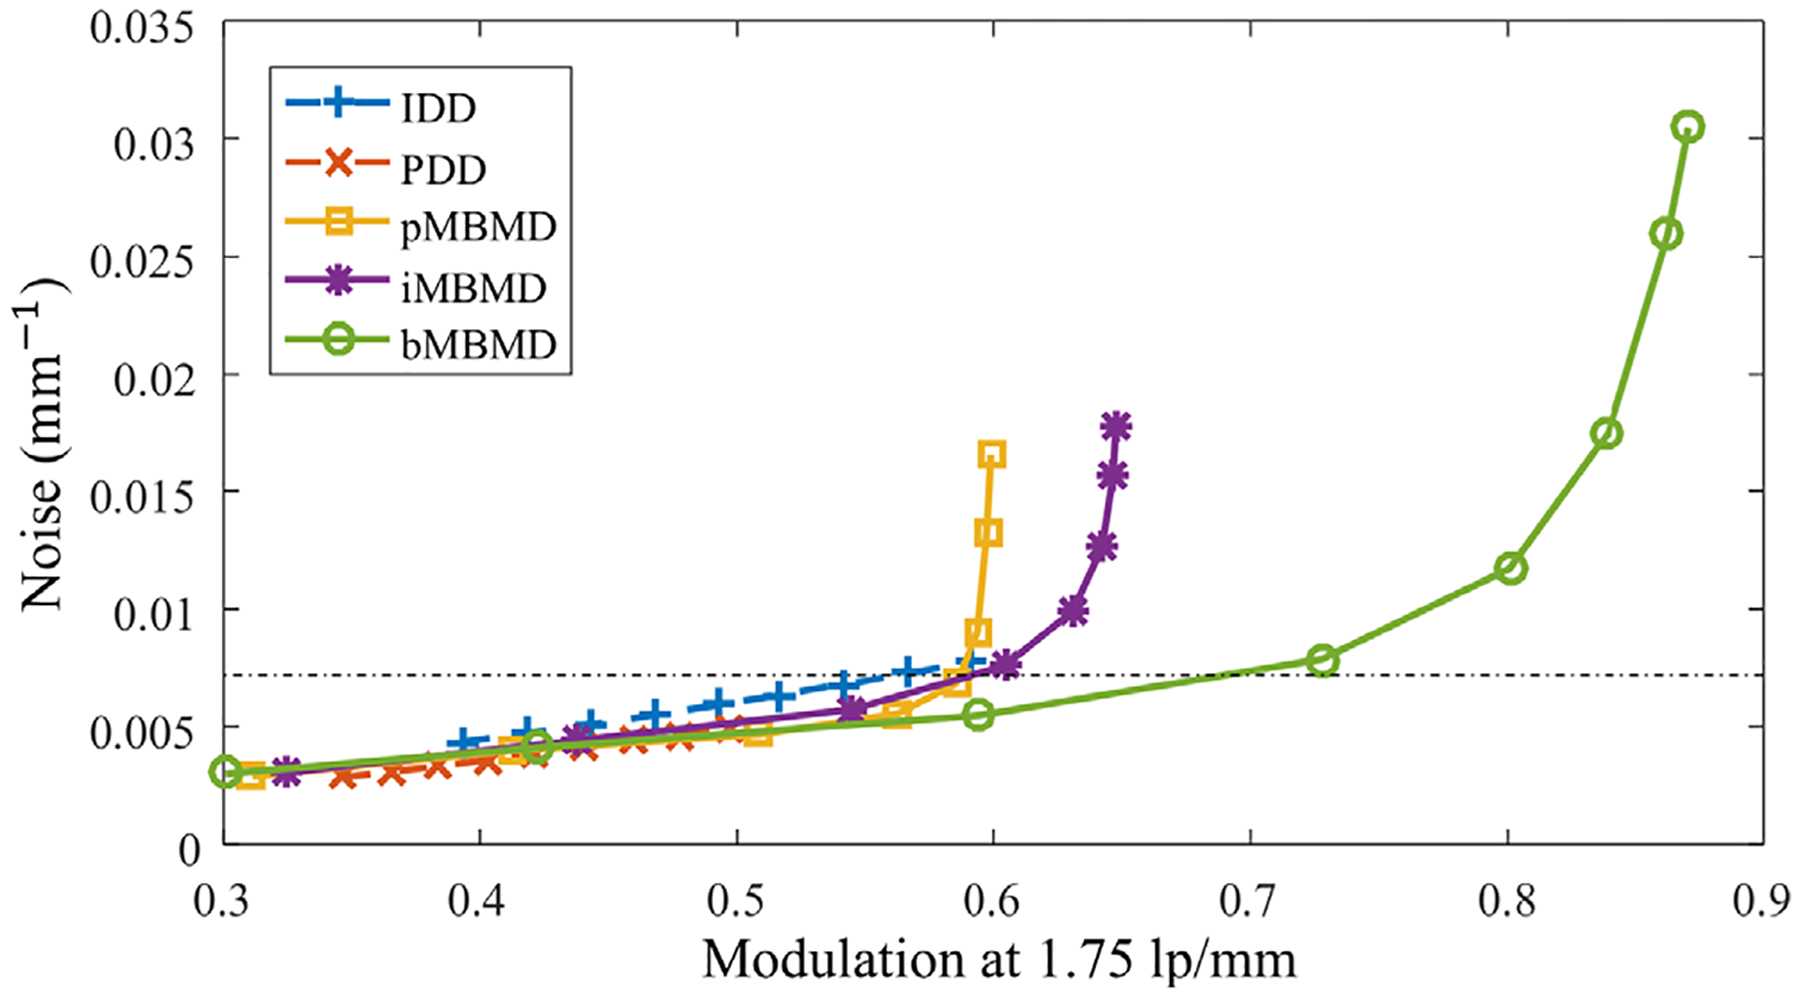
Noise-resolution characterization curves in the 50-kV synthetic monoenergetic images estimated through IDD, PDD, pMBMD, iMBMD, and bMBMD with varying regularization parameters. The black horizontal dashed line indicates the noise level of the images shown in the 50-kV monoenergetic images in Fig. 9.
4. CONCLUSIONS AND DISCUSSION
In this work, we proposed a model-based method for high-resolution material decomposition in a dual-layer flat-panel CBCT system. The model includes layer-dependent geometry, spectral sensitivity, and detector blur. In physical experiments with a prototype dual-layer FPD, we investigated four MBMD methods with increasingly high-fidelity models of the dual-layer flat-panel CBCT and compared their performance with conventional IDD and PDD methods. The results validated the capability of the MBMD with high-fidelity model in high-resolution spectral CT imaging. The proposed method demonstrates improved noise-resolution trade-offs and provides good quantification ability in dual-energy CT. It can achieve extended high spatial resolution when an accurate system blur model is included. These results are consistent with prior work46 in model-based iterative reconstruction (MBIR), where methods with blur modeling outperform methods without blur modeling by extending the feasible range of noise-resolution tradeoffs. Specifically, while traditional methods permit higher spatial resolution at the cost of increased noise with decreased regularization or finer reconstruction kernels, those methods are ultimately limited by unmodeled system blurs. At some point, less regularization only increases noise without a resolution advantage—effectively “hitting a wall.” Blur modeling extends the range—pushing the “wall” to finer resolutions but still at the expense of increased noise. In regions before this limit, the effects of blur modeling can be marginal or non-existent. In essence, all the blur modeling is counteracted by increased regularization. That is, if lower resolutions are desired (with decreased noise) there may not be a noise advantage in modeling the blur and then, effectively, blurring out the results via regularization. In contrast, when comparing model-based approaches to non-statistical approaches including FBP, there is a noise advantage even at these lower spatial resolutions. This improvement is at the price of a 50% extra computational cost because the forward projection of the estimated volume is computed separately for each spectral channel compared with the aMBMD and PMBMD where two spectral channels share a common geometry.
The proposed model is flexible and can be adapted for other spectral CT systems, especially for detectors where the geometry and blur vary between spectral channels. Because the proposed approach changes and improves upon traditional trade-offs, there is also an opportunity to design new FPDs based on these new trade-offs. For example, one might intentionally vary alignments and scintillator thicknesses between layers knowing that the proposed model-based approach can leverage differential resolution and sampling. The system blur implemented in the current work is shift-invariant, which is a good approximation for relatively small cone angles. In the case of larger cone angles, the obliquity of x rays interacting in the scintillator can result in broadening of the detector blur. While such shift-variant blur can be accommodated in the system model, we do not investigate such effects in this work. Similarly, other physical shiftvariance, for example focal spot blur, is also ignored, though previously reported methods47 could be applied here if those physical effects are significant. In the physical experiments, the concentration of the iodine solution used in the high-resolution phantoms is relatively high. Further investigation using different contrast and at varying noise levels is merited to evaluate the contrast- and noise-dependent performance of MBMD, particularly at lower iodine concentrations. The presented work used relatively simple regularization to make performance comparison more straightforward; however, in ongoing work, we are implementing more sophisticated regularization schemes (e.g., cross-material penalties48 in addition to in-material regularization) to provide increased advantage. This work is dedicated to high spatial resolution imaging capability of a dual-layer flat-panel CBCT where we used a relatively small phantom in the physical experiment. The impact of scattering was small and neglected. In a more realistic scenario where a larger imaging object is examined, proper scatter correction for both spectral channels is important, which is investigated in ongoing work.49 There may be a benefit in an optimized sampling with intentionally misaligned pixel grids. However, there are a number of challenges in terms of physical implementation, including precision alignment in manufacturing and divergent beam effects where the misalignment varies across the panel. A thorough investigation of all the above factors is beyond the scope of this paper and reserved for future investigation.
ACKNOWLEDGMENTS
This work was supported in part by NIH grant R21EB026849 and R01EB025470, and an academic-industry partnership between Johns Hopkins University and Varex Imaging Corporation.
APPENDIX A
MATRICES IN THE SPECTRAL CT MODEL OF DUAL-LAYER FLAT-PANEL CBCT
The generalized spectral CT model we propose in Equation 3 can be generalized to arbitrary spectral CT systems. Specifically in this work, we consider a dual-material estimation problem with a dual-layer CBCT system that has a low-energy (LE) channel and a high-energy (HE) channel. The system matrix is composed as follows:
| (A1) |
where are the system matrices that forward project an image in one material basis to the projections in the corresponding projection grid in the LE and HE channels, respectively. The mass attenuation matrix is written as follows:
| (A2) |
where is an identity matrix. Similarly, the blur model and the spectral sensitivity matrix can be written as follows:
| (A3) |
Here are the blurring matrices in each of the spectral channels. The matrix is capable of modeling different spectral sensitivities at different pixels and between spectral channels. In this work, the spectral sensitivities are considered shift-invariant for all pixels in each of the two spectral channels, but different between the spectral channels. The spectral sensitivity matrices of the LE and HE channels are written as follows:
| (A4) |
| (A5) |
APPENDIX B
PRECONDITIONED GRADIENT DESCENT ALGORITHM
In previous work, Tilley et al. developed a separable paraboloidal surrogates (SPS) algorithm for MBMD36 that presumes all image voxels are uncorrelated. Tivnan et al.39 developed a preconditioned gradient descent (pGD) algorithm for MBMD that uses a curvature based on an estimate of the curvatures that accounts for correlations between the materials at each voxel with the current estimates.
| (B1) |
| (B2) |
where denotes the estimates of curvature with respect to the material basis, denotes an image vector that has ones in the material basis and zeros else-where, denotes the element in . The off-diagonal elements characterize the correlation between the densities at the same location of different material bases, which is neglected in the SPS algorithm. The denotes the energy-dependent statistical weights that occurs when computing the derivative of the mean spectral measurements with respective to material densities :
| (B3) |
The pseudo-code is shown in Algorithm 1.
The convergence curves of SPS and pGD are shown in Fig. B1. Compared with the SPS algorithm, the convergence rate is relatively fast and can achieve good convergence with 30 iterations. In this work. we used 60 iterations to achieve good convergence in all regularization conditions.
Fig. B1.
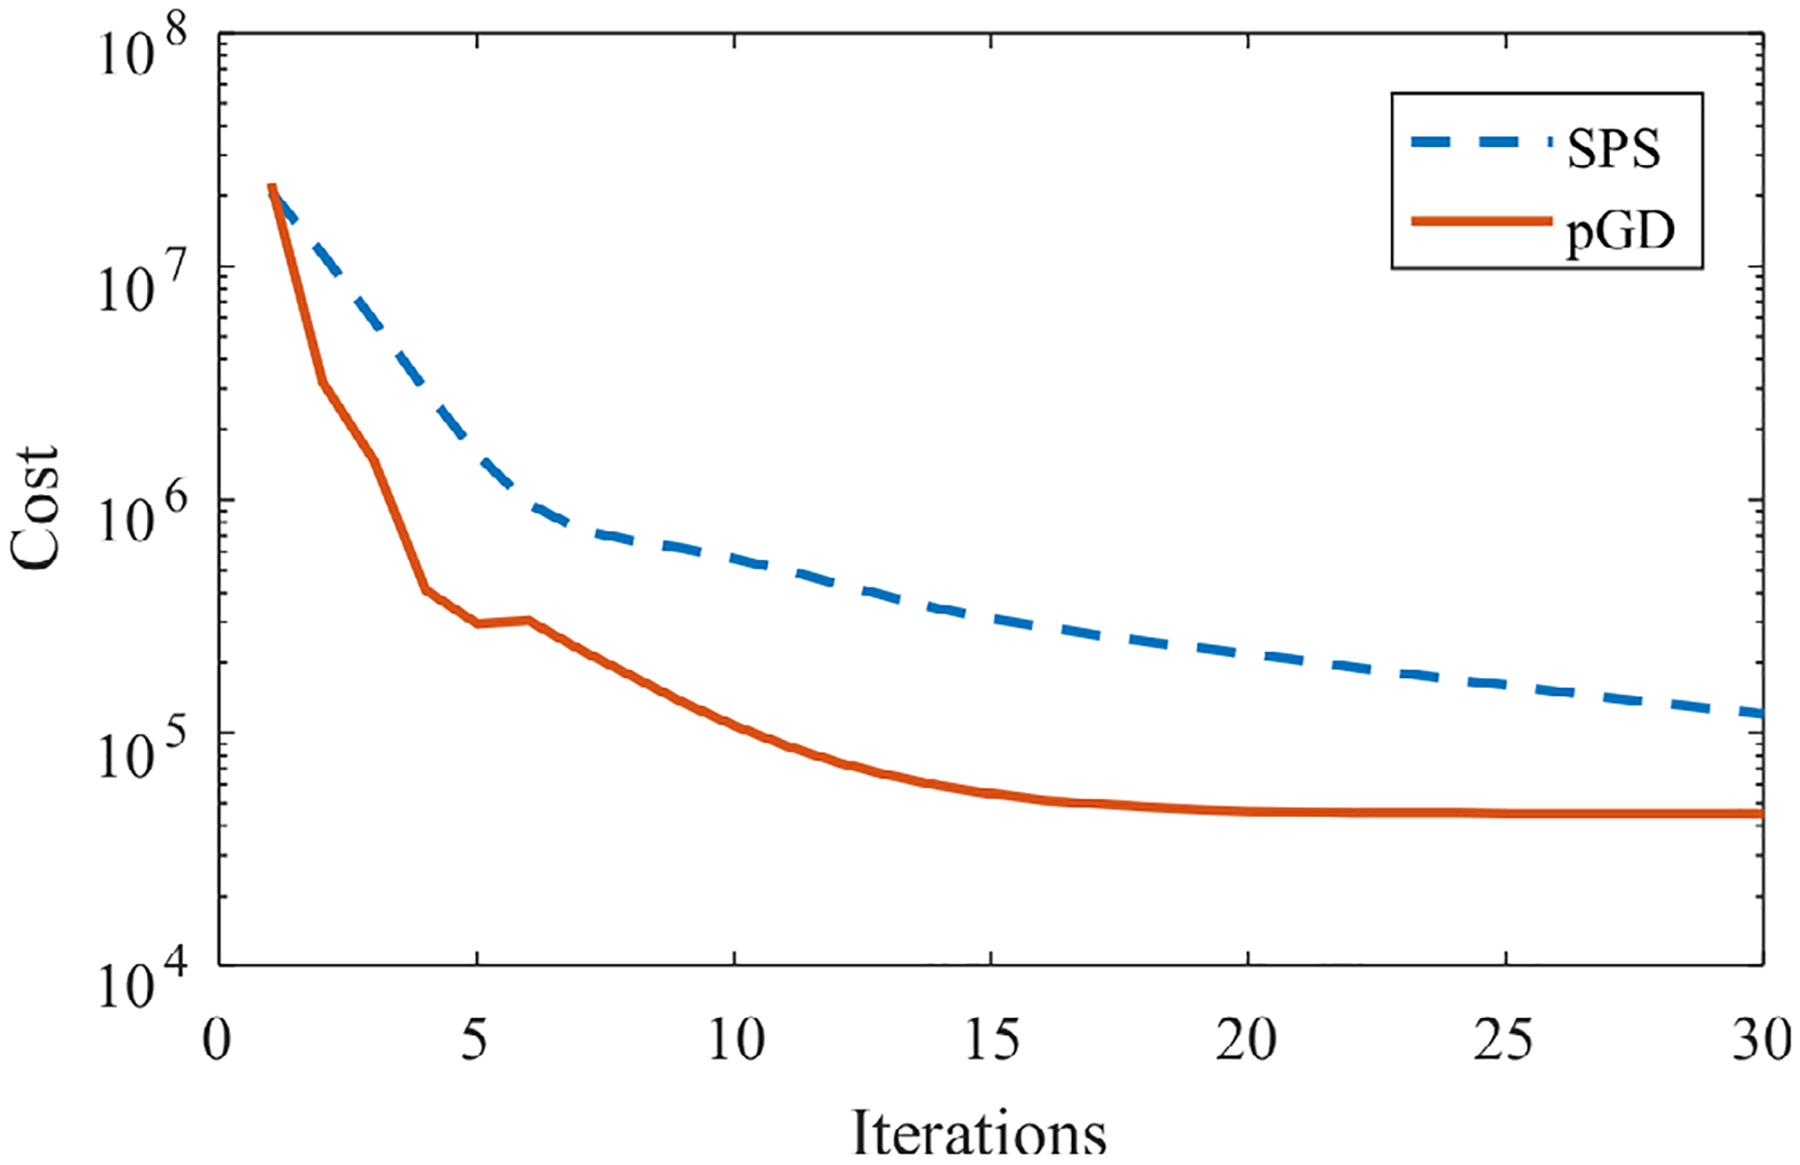
Convergence curves of the SPS and pGD algorithms.
Footnotes
CONFLICT OF INTEREST
The authors have no conflict of interest to disclose.
Contributor Information
Wojciech Zbijewski, Department of Biomedical Engineering, Johns Hopkins University, Baltimore, MD 21205, USA.
Richard E. Colbeth, Varex Imaging Corp., 683 River Oaks Pkwy, San Jose, CA 95134, USA
J. Webster Stayman, Department of Biomedical Engineering, Johns Hopkins University, Baltimore, MD 21205, USA.
DATA AVAILABILITY STATEMENT
The data that support the findings of this study are available from the corresponding author upon reasonable request.
REFERENCES
- 1.Riederer SJ, Mistretta CA. Selective iodine imaging using K -edge energies in computerized x-ray tomography. Medical Phys. 1977;4:474–481. 10.1118/1.594357 [DOI] [PubMed] [Google Scholar]
- 2.Flohr TG, McCollough CH, Bruder H, et al. First performance evaluation of a dual-source CT (DSCT) system. Eur Radiol. 2006;16:256–268. [DOI] [PubMed] [Google Scholar]
- 3.Euler A, Parakh A, Falkowski AL, et al. Initial results of a single-source dual-energy computed tomography technique using a split-filter: Assessment of image quality, radiation dose, and accuracy of dual-energy applications in an in vitro and in vivo study. Invest Radiol. 2016;51:491–498. [DOI] [PubMed] [Google Scholar]
- 4.Toepker M, Kuehas F, Kienzl D, et al. Dual energy computerized tomography with a split bolus - A 1-stop shop for patients with suspected urinary stones? J Urol. 2014;191:792–797. [DOI] [PubMed] [Google Scholar]
- 5.Primak AN, Fletcher JG, Vrtiska TJ, et al. Noninvasive differentiation of uric acid versus non-uric acid kidney stones using dual-energy CT. Academic Radiology. 2007;14:1441–1447. [DOI] [PMC free article] [PubMed] [Google Scholar]
- 6.Stolzmann P, Kozomara M, Chuck N, et al. In vivo identification of uric acid stones with dual-energy CT: Diagnostic performance evaluation in patients. Abdom Imaging. 2010;35:629–635. [DOI] [PubMed] [Google Scholar]
- 7.Graser A, Johnson TRC, Hecht EM, et al. Dual-energy CT in patients suspected of having renal masses: Can virtual nonenhanced images replace true nonenhanced images? Radiology. 2009;252:433–440. 10.1148/radiol.2522080557 [DOI] [PubMed] [Google Scholar]
- 8.Zhang L-J, Peng J, Wu S-Y, et al. Liver virtual non-enhanced CT with dual-source, dual-energy CT: A preliminary study. Eur Radiol. 2010;20:2257–2264. [DOI] [PubMed] [Google Scholar]
- 9.Yu L, Leng S, McCollough CH. Dual-energy CT-based monochromatic imaging. Am J Roentgenol. 2012;199:S9–S15. 10.2214/ajr.12.9121 [DOI] [PubMed] [Google Scholar]
- 10.Symons R, Krauss B, Sahbaee P, et al. Photon-counting CT for simultaneous imaging of multiple contrast agents in the abdomen: Anin vivostudy. Med Phys. 2017;44:5120–5127. 10.1002/mp.12301 [DOI] [PMC free article] [PubMed] [Google Scholar]
- 11.Pelgrim GJ, van Hamersvelt RW, Willemink MJ, et al. Accuracy of iodine quantification using dual energy CT in latest generation dual source and dual layer CT. Eur Radiol. 2017;27:3904–3912. [DOI] [PMC free article] [PubMed] [Google Scholar]
- 12.Hua C-H, Shapira N, Merchant TE, Klahr P, Yagil Y. Accuracy of electron density, effective atomic number, and iodine concentration determination with a dual layer dual-energy computed tomography system. Med Phys. 2018;45:2486–2497. [DOI] [PubMed] [Google Scholar]
- 13.Gang GJ, Zbijewski W, Mahesh M, et al. Image quality and dose for a multisource cone-beam CT extremity scanner. Med Phys. 2018;45:144–155. [DOI] [PubMed] [Google Scholar]
- 14.Shen L, Xing Y. Multienergy CT acquisition and reconstruction with a stepped tube potential scan. Medical Physics. 2014;42 (1):282–296. 10.1118/1.4903756 [DOI] [PubMed] [Google Scholar]
- 15.Rutt B, Fenster A. Split-filter computed tomography. J Comput Assist Tomogr. 1980;4:501–509. 10.1097/00004728-198008000-00019 [DOI] [PubMed] [Google Scholar]
- 16.Petrongolo M, Zhu L. Single-scan dual-energy CT using primary modulation. IEEE Trans Med Imaging. 2018;37:1799–1808. [DOI] [PubMed] [Google Scholar]
- 17.Stayman JW, Tilly S II. Model-based multi-material decomposition using spatial spectral CT filters in Proceedings of the international conference on image formation in X-ray computed tomography, 2018:102–105. [PMC free article] [PubMed] [Google Scholar]
- 18.Tivnan M, Tilley S II, Stayman JW, et al. Physical modeling and performance of spatial-spectral filters for CT material decomposition. In: Schmidt TG, Chen G-H, Bosmans H, eds. Proc SPIE Medical Imaging 2019: Physics of Medical Imaging. Bethesda: International Society for Optics and Photonics SPIE; 2019:10948. [DOI] [PMC free article] [PubMed] [Google Scholar]
- 19.Roessl E, Brendel B, Engel KJ, Schlomka JP, Thran A, Proksa R. Sensitivity of photon-counting based K-edge imaging in X-ray computed tomography. IEEE Trans Med Imaging. 2011;30:1678–1690. 10.1109/tmi.2011.2142188 [DOI] [PubMed] [Google Scholar]
- 20.Si-Mohamed S, Bar-Ness D, Sigovan M, et al. Review of an initial experience with an experimental spectral photon-counting computed tomography system. Nucl Instrum Methods Phys Res A. 2017;873:27–35. [Google Scholar]
- 21.Wang S, Xing Y, Zhang L, Xu X. Enhanced material separation with a quasi-monochromatic CT imaging method using a photon counting detector. Nucl Instrum Methods Phys Rest A. 2018;881:9–15. 10.1016/j.nima.2017.10.066 [DOI] [Google Scholar]
- 22.Zbijewski W, Gang GJ, Xu J, et al. Dual-energy cone-beam CT with a flat-panel detector: Effect of reconstruction algorithm on material classification. Med Phys. 2014;41:021908. 10.1118/1.4863598 [DOI] [PMC free article] [PubMed] [Google Scholar]
- 23.Lu M, Wang A, Shapiro E, et al. Dual energy imaging with a dual-layer at panel detector. In: Schmidt TG, Chen GH, Bosmans H, eds. Proc SPIE Medical Imaging 2019: Physics of Medical Imaging. Bethesda: International Society for Optics and Photonics SPIE; 2019:269–278. [Google Scholar]
- 24.Shi L, Lu M, Bennett NR, et al. Characterization and potential applications of a dual-layer flat-panel detector. Medical Phys. 2020;47:3332–3343. 10.1002/mp.14211 [DOI] [PMC free article] [PubMed] [Google Scholar]
- 25.Siewerdsen JH, Zbijewsk W, XU J. Cone-beam CT image quality. In: Cone Beam Computed Tomography. 2014;4:37–58. [Google Scholar]
- 26.Wang W, Gang GJ, Siewerdsen JH, Stayman JW. Predicting image properties in penalized-likelihood reconstructions of flat-panel CBCT. Med Phys. 2019;46:65–80. 10.1002/mp.13249 [DOI] [PMC free article] [PubMed] [Google Scholar]
- 27.Alvarez RE, Macovski A. Energy-selective reconstructions in X-ray computerised tomography. Phys Med Biol. 1976;21:733–744. 10.1088/0031-9155/21/5/002 [DOI] [PubMed] [Google Scholar]
- 28.Alvarez RE. Estimator for photon counting energy selective x-ray imaging with multibin pulse height analysis. Med Phys. 2011;38:2324–2334. [DOI] [PMC free article] [PubMed] [Google Scholar]
- 29.Liu X, Yu L, Primak AN, McCollough CH. Quantitative imaging of element composition and mass fraction using dual-energy CT: Three-material decomposition. Med Phys. 2009;36:1602–1609. [DOI] [PMC free article] [PubMed] [Google Scholar]
- 30.Zimmerman KC, Schmidt TG. Experimental comparison of empirical material decomposition methods for spectral CT. Phys Med Biol. 2015;60:3175–3191. 10.1088/0031-9155/60/8/3175 [DOI] [PMC free article] [PubMed] [Google Scholar]
- 31.Schmidt TG, Barber RF, Sidky EY. A spectral CT method to directly estimate basis material maps from experimental photon-counting data IEEE Trans Med Imaging. 2017;36:1808–1819. [DOI] [PMC free article] [PubMed] [Google Scholar]
- 32.Mechlem K, Ehn S, Sellerer T, et al. Joint statistical iterative material image reconstruction for spectral computed tomography using a semi-empirical forward model. IEEE Trans Med Imaging. 2018;37:68–80. 10.1109/tmi.2017.2726687 [DOI] [PubMed] [Google Scholar]
- 33.Schirra CO, Roessl E, Koehler T, et al. Statistical reconstruction of material decomposed data in spectral CT. IEEE Trans Med Imaging. 2013;32:1249–1257. [DOI] [PubMed] [Google Scholar]
- 34.Long Y, Fessler JA. Multi-material decomposition using statistical image reconstruction for spectral CT. IEEE Trans Med Imaging. 2014;33:1614–1626. 10.1109/tmi.2014.2320284 [DOI] [PMC free article] [PubMed] [Google Scholar]
- 35.Zhang R, Thibault JB, Bouman CA, Sauer KD, Hsieh J. Model-based iterative reconstruction for dual-energy X-ray CT using a joint quadratic likelihood model. IEEE Trans Med Imaging. 2014;33:117–134. 10.1109/tmi.2013.2282370 [DOI] [PubMed] [Google Scholar]
- 36.Tilley S II, Zbijewski W, Stayman JW. Model-based material decomposition with a penalized nonlinear least-squares CT reconstruction algorithm. Phys Med Biol. 2019;64:035005. 10.1088/1361-6560/aaf973 [DOI] [PMC free article] [PubMed] [Google Scholar]
- 37.Wang W, Tivnan M, Gang GJ, et al. Model-based material decomposition with system blur modeling. Proc SPIE Medical Imaging: Physics of Medical Imaging. 11312. 2020. 10.1117/12.2549549 [DOI] [PMC free article] [PubMed] [Google Scholar]
- 38.Ma YQ, Wang W, Tivnan M, et al. High-resolution model-based material decomposition for multi-layer flat-panel detectors. Conf Proc Int Conf Image Form Xray Comput Tomogr. 2020:62–64. [PMC free article] [PubMed] [Google Scholar]
- 39.Tivnan M, Wang W, Stayman JW. A preconditioned algorithm for model-based iterative CT reconstruction and material decomposition from spectral CT data. arXiv. 2020;1–6. [Google Scholar]
- 40.Punnoose J, Xu J, Sisniega A, Zbijewski W, Siewerdsen JH. Technical Note: SPEKTR 3.0-A computational tool for x-ray spectrum modeling and analysis. Med Phys. 2016;43:4711–4717. [DOI] [PMC free article] [PubMed] [Google Scholar]
- 41.Cao Q, Sisniega A, Brehler M, et al. Modeling and evaluation of a high resolution CMOS detector for cone-beam CT of the extremities. Med Phys. 2018;45:114–130. [DOI] [PMC free article] [PubMed] [Google Scholar]
- 42.Howansky A, Peng B, Lubinsky AR, Zhao W. Deriving depth-dependent light escape efficiency and optical Swank factor from measured pulse height spectra of scintillators. Med Phys. 2017;44:847–860. 10.1002/mp.12083 [DOI] [PMC free article] [PubMed] [Google Scholar]
- 43.Samei E, Flynn MJ, Reimann DA. A method for measuring the presampled MTF of digital radiographic systems using an edge test device. Med Phys. 1998;25:102–113. 10.1118/1.598165 [DOI] [PubMed] [Google Scholar]
- 44.Shi H, Gang G, Li J, Liapi E, Abbey C. Performance assessment of texture reproduction in high-resolution CT. In Samuelson FW, Taylor-Phillips S, eds. Proc SPIE Medical Imaging 2020: Image Perception, Observer Performance, and Technology Assessment. March 2020:25SPIE 2020. 2020:113160R-1–113160R-6. https://www.spiedigitallibrary.org/conference-proceedings-of-spie/11316/113160R/Performance-assessment-of-texture-reproduction-in-high-resolution-CT/10.1117/12.2550579.full?casa_token=n7247MByIfkAAAAA%3aXcAHFNEoNI_erSGPP-V4YcYDqrsKnxf-upb4KSyoZvGterJH9KrRdyvwSB10P0mH8Z66iJPr&SSO=1 [DOI] [PMC free article] [PubMed] [Google Scholar]
- 45.Cho Y, Moseley DJ, Siewerdsen JH, Jaffray DA. Accurate technique for complete geometric calibration of cone-beam computed tomography systems. Med Phys. 2005;32:968–983. 10.1118/1.1869652 [DOI] [PubMed] [Google Scholar]
- 46.Tilley S, Jacobson M, Cao Q. Penalized-likelihood reconstruction with high-fidelity measurement models for high-resolution cone-beam imaging. IEEE Trans Med Imaging. 2018;37:988–999. 10.1109/tmi.2017.2779406 [DOI] [PMC free article] [PubMed] [Google Scholar]
- 47.Tilley S, Siewerdsen JH, Stayman JW. Model-based iterative reconstruction for flat-panel cone-beam CT with focal spot blur, detector blur, and correlated noise. Phys Med Biol. 2016;61:296–319. 10.1088/0031-9155/61/1/296 [DOI] [PMC free article] [PubMed] [Google Scholar]
- 48.Wang W, Tivnan M, Gang GJ, Stayman JW. Prospective prediction and control of image properties in model-based material decomposition for spectral CT. In Chen G-H, Bosmans H, eds. Proc SPIE Medical Imaging 2020: Physics of Medical Imaging. 11312. SPIE; 2020:475–480. 10.1117/12.2549777 [DOI] [PMC free article] [PubMed] [Google Scholar]
- 49.Zhao C, Liu SZ, Wang W, et al. Effects of X-Ray scatter in quantitative dual-energy imaging using dual-layer flat panel detectors. In Bosmans H, Zhao W, Yu L, eds. Proc SPIE Medical Imaging: Physics of Medical Imaging;11595. SPIE; 2021. 10.1117/12.2581822 [DOI] [Google Scholar]
Associated Data
This section collects any data citations, data availability statements, or supplementary materials included in this article.
Data Availability Statement
The data that support the findings of this study are available from the corresponding author upon reasonable request.


