

Abstract
Background
Intervertebral disc degeneration (IDD) is a leading contributor to low back pain (LBP). Autophagy, strongly activated by hypoxia and nutrient starvation, is a vital intracellular quality control process that removes damaged proteins and organelles to recycle them for cellular biosynthesis and energy production. While well‐established as a major driver of many age‐related diseases, autophagy dysregulation or deficiency has yet been confirmed to cause IDD.
Methods
In vitro, rat nucleus pulposus (NP) cells treated with bafilomycin A1 to inhibit autophagy were assessed for glycosaminoglycan (GAG) content, proteoglycan synthesis, and cell viability. In vivo, a transgenic strain (Col2a1‐Cre; Atg7 fl/fl ) mice were successfully generated to inhibit autophagy primarily in NP tissues. Col2a1‐Cre; Atg7 fl/fl mouse intervertebral discs (IVDs) were evaluated for biomarkers for apoptosis and cellular senescence, aggrecan content, and histological changes up to 12 months of age.
Results
Here, we demonstrated inhibition of autophagy by bafilomycin produced IDD features in the rat NP cells, including increased apoptosis and cellular senescence (p21 CIP1 ) and decreased expression of disc matrix genes Col2a1 and Acan. H&E histologic staining showed significant but modest degenerative changes in NP tissue of Col2a1‐Cre; Atg7 fl/fl mice compared to controls at 6 and 12 months of age. Intriguingly, 12‐month‐old Col2a1‐Cre; Atg7 fl/fl mice did not display increased loss of NP proteoglycan. Moreover, markers of apoptosis (cleaved caspase‐3, TUNEL), and cellular senescence (p53, p16 INK4a , IL‐1β, TNF‐α) were not affected in 12‐month‐old Col2a1‐Cre; Atg7 fl/fl mice compared to controls. However, p21 CIP1 and Mmp13 gene expression were upregulated in NP tissue of 12‐month‐old Col2a1‐Cre; Atg7 fl/fl mice compared to controls, suggesting p21 CIP1 ‐mediated cellular senescence resulted from NP‐targeted Atg7 knockout might contribute to the observed histological changes.
Conclusion
The absence of overt IDD features from disrupting Atg7‐mediated macroautophagy in NP tissue implicates other compensatory mechanisms, highlighting additional research needed to elucidate the complex biology of autophagy in regulating age‐dependent IDD.
Keywords: aging, apoptosis, autophagy, cellular senescence, intervertebral disc degeneration
This is the first study to investigate whether autophagy is essential for IVD health in vivo using a novel transgenic rodent model of NP‐targeted autophagy ablation. We found only modest degenerative features disc tissue of Col2a1‐Cre; Atg7fl/fl mice up to 12 months of age suggesting that contrary to the prevailing thinking in the IVD field, NP autophagy inhibition does not accelerate IDD in mice up to 12 months of age.

1. INTRODUCTION
Intervertebral discs (IVD), situated between the vertebrae within the spine, are composed of three tissue types: the cartilaginous end plate (CEP), annulus fibrosus (AF), and nucleus pulposus (NP). Intervertebral disc degeneration (IDD) is a major contributor to low back pain (LBP) that represents a significant global public health burden. 1 , 2 , 3 The IVD is the largest avascular tissue in the body, which results in a unique biochemical microenvironment that is hypoxic, acidic, hyperosmotic, and low in nutrients. 4 , 5 Resident disc cells are chronically deprived of nutrients as evident by the low in vivo glucose concentrations reported for NP (0.5–1 mM) and AF (1–5 mM) tissue. 6 , 7
Macroautophagy (herein referred to as autophagy) is an important cellular quality control mechanism that has been shown to be essential for preventing metabolic and degenerative diseases, and many other disorders across a variety of tissue types. 8 , 9 , 10 , 11 , 12 Autophagy is an intracellular degradation process that targets cytoplasmic material, damaged organelles, misfolded proteins, and so forth to the lysosome for degradation. 13 Upregulated by cellular stress such as nutrient deprivation or hypoxia, autophagy plays an important role in maintaining cellular protein homeostasis, especially for terminally differentiated non‐dividing cells that accumulate greater molecular damage than proliferative cells, as the latter can dilute the damage by mitosis. 10 , 11 , 14 , 15 , 16 , 17 Deletion of autophagy in tissues containing post‐mitotic differentiated cells, such as the brain, heart, and skeletal muscle, leads to accumulation of ubiquitin‐positive inclusion bodies/aggregates and subsequent degeneration or dysfunction of each tissue type. 18 Hence, the quality control mechanism for removing damaged or toxic proteins and organelles by autophagy is particularly vital to non‐dividing cells.
Substantial similarities exist between features of the IVD cellular microenvironment and known cellular stresses that induce autophagy, specifically nutrient deprivation and hypoxia—with nutrient deprivation being the most potent physiological inducer of autophagy. 19 Furthermore, IVD cells are mostly non‐dividing after childhood. 20 In most of the tissues, autophagy plays a vital role in maintaining function and viability of post‐mitotic differentiated cells, and in case disc cells too, a comprehensive review of the literature 21 affirmed the presence of autophagy molecular machinery components. However, it is not known whether IVD autophagy is constitutively active due to their chronic low nutrient and hypoxic environment. It is also not confirmed whether IVD autophagy changes with age and if autophagy defect promotes age‐related IDD. 21 , 22 Moreover, whether autophagy has beneficial or detrimental effects on IVD function is further muddled with conflicting findings on how IVD cells modulate autophagy in response to stresses such as mechanical loading or inflammation. 21 Several studies have reported therapeutic effects of autophagy modulating agents such as metformin and curcumin in rodent model of disc‐injury induced IDD. 23 , 24 The reported therapeutic efficacies of these treatments have been correlatively attributed to enhanced autophagy with few direct supporting evidence. 23 , 24 , 25 , 26 , 27 Although emerging studies have identified autophagy as an important regulator of IVD cell health, several limitations exist as most of the studies are done using siRNA targeted knockdown in vitro/in vivo. 28 , 29
In this study, we treated rat NP cell cultures with bafilomycin to inhibit autophagy, which produced significant cell death and decreased expression of key disc matrix genes Col2a1 and Acan 48 h post‐treatment. To establish whether autophagy is essential for IVD health in vivo, we generated Col2a1‐Cre; Atg7 fl/fl mice, which successfully disrupted autophagy in NP tissues by Atg7 gene knockout, evidenced by accumulation of p62 and LC3‐I protein in NP but no other tissues. However, we found that NP‐targeted autophagy disruption in Col2a1‐Cre; Atg7 fl/fl mice had no impact on disc aggrecan matrix homeostasis or apoptosis. Modest histological structural changes were observed in NP tissue of 6‐ and 12‐month‐old Col2a1‐Cre; Atg7 fl/fl mice compared to controls. The markers for senescence and inflammation, with the exception of p21 CIP1 gene expression, were not significantly different between control and Col2a1‐Cre; Atg7 fl/fl mice. Overall, our findings challenge the current notion in the field that autophagy inhibition or dysregulation is a major contributor to age‐related IDD and implicate other compensatory mechanisms needed to maintain disc proteostasis with age.
2. MATERIALS AND METHODS
2.1. Ethics statement
All animal experiments were approved by the Institutional Animal Care and Use Committee of the University of Pittsburgh and conducted in accordance with the principles of the Declaration of Helsinki and with the laws and regulations of the US.
2.2. In vitro cell culture model
NP tissue from 8‐week‐old male Fischer F344 rats (Charles Rivers, Wilmington MA, USA) were used to generate cell cultures for all in vitro experiments. Isolated NP tissue was washed 3 times in PBS, spun down at 2000 RPM for 5 min, and digested in pronase (0.1%) for 1 h. After spinning down the tissue and washing with PBS 3 times, NP cells were isolated by digestion with collagenase (0.01%) for 20 min. NP cells were cultured in six‐well plates in F‐12/D‐MEM (11 320 033, Thermo Fisher) containing 10% FBS and 1% antibiotic/antimycotic (A/A) (A5955, Millipore Sigma) under standard conditions (37°C, 5% CO2, 5% O2). Once expanded, rat NP cells were used at passage two for experimentation. To mimic low nutrients in vivo during autophagy inhibition experiments, NP cells were given DMEM with no glucose, no glutamine, and no phenol red (A1443001, Thermo Fisher) supplemented with 1% FBS, 1% antibiotic/antimycotic (A5955, Millipore Sigma), and 1 mM glutaMAX (35 050 061, Thermo Fisher) for the duration of the experiments—48 h. 30 In control conditions, NP cells were cultured in DMEM with 10% FBS and 1% P/S. The low nutrient (LN) condition mentioned throughout was defined as DMEM no glucose supplemented with 1 mM glutaMAX and 1% A/A.
To inhibit autophagy, rat NP cells from passage 2 of the culture were seeded in 6‐ or 12‐well plates, and treated with 10 nM bafilomycin A1 (B1793, Millipore Sigma) for up to 48 h.
2.3. Western blotting
NP and AF protein from spine discs of mice were separately extracted using T‐PER tissue protein extraction reagent (78510, Thermo Fisher) with Halt proteinase inhibitor cocktail (87786, Thermo Fisher) overnight on a shaker. Protein from different rat tissues also were extracted using the same method. For in vitro experiments, NP cells were collected using MPER reagent on ice with a cell scraper. All samples were measured for total protein concentration using a BCA Protein Assay Kit (23225, Thermo Fisher) to ensure equal loading.
Following electrophoresis using Mini‐PROTEAN TGX 12% polyacrylamide denaturing gels (4561043, Bio‐Rad), separated proteins were transferred to a polyvinylidene difluoride (PVDF) membrane (88 518, Thermo Fisher). The blots were blocked using 5% non‐fat dry milk (1706404XTU, Bio‐Rad) at room temperature, shaken for 1 h, and then incubated overnight with primary antibodies. Primary antibodies to LC3 (12741, cell signaling technology), ATG7 (8558, cell signaling technology), ATG12‐ATG5 (4180, cell signaling technology), SQSTM1/p62 (5114, Cell Signaling Technology), TNF‐α (3707, cell signaling technology), IL‐1β (12 242, cell signaling technology), p53 (2524, cell signaling technology), GAPDH (2118, cell signaling technology) and β‐actin (A2066, Millipore Sigma), and secondary anti‐rabbit HRP antibody (31460, Thermo Fisher) were used. All antibodies were diluted using SignalBoost Immunoreaction Enhancer kit (407207, Millipore Sigma). HRP activity signals were measured using chemiluminescent detection (34095, Thermo Fisher) and ChemiDoc MP system (Bio‐Rad). Quantification for all Western blots was performed with densitometry analysis using Image J (https://imagej.nih.gov/ij/) and background subtraction. Uncropped images for Western blots are shown in supplemental file.
To measure disc aggrecan fragmentation, previously established protocol was used. 31 Anti‐aggrecan antibody (ab36861, Abcam) and anti‐rabbit horse radish peroxidase (HRP) secondary antibody were used to detect the aggrecan proteolytic fragments by western blot.
2.4. Generation of ATG7 conditional knockout mice for in vivo experiment
Floxed Atg7 mice (Atg7 fl/fl ) were crossed with collagen 2 alpha 1‐Cre (Col2a1‐Cre) transgenic mice to generate NP‐targeted Atg7 knockout mice (Col2a1‐Cre; Atg7 fl/fl ) (Figure 1A–D). In these mice, Col2a1‐Cre; Atg7 fl/fl , Cre recombinase is expressed in NP cells causing the deletion of the loxP flanked gene (Figure 1D). The characterization of Atg7 fl/fl mice 32 and Col2a1‐Cre mice 33 have been described previously. We bred these two mouse strains to knockout Atg7 primarily in NP tissue. Genomic DNA samples isolated from an ear punch during weaning were sent to Transnetyx (Cordova, TN, USA) for genotyping analysis by qPCR. A total of six mice groups were used separated by genotype and age: Col2a1‐Cre; Atg7 fl/fl and Atg7 fl/fl , and 3, 6, and 12 months of age; and their spines were collected and analyzed.
FIGURE 1.

Effect of bafilomycin‐mediated autophagy flux inhibition in NP cells in vitro. (A) Experimental design for the bafilomycin treatment in rat NP cell culture. Rat NP cells were treated with Bafilomycin A1 in high nutrients (HN) and low nutrients (LN) media for indicated time and analyzed for different measures. (B) Expression of two common autophagy markers LC3‐II and SQSTM1/p62 as determined by western blot following baf A1 treatment for 8–48 h in HN and LN media. (C) Cellular morphology of NP cells in LN media with baf (10 nM, 8–48 h) treatment was visualized using light microscopy. Cellular metabolism of NP cells in LN media with 10 nM baf treatment (8–48 h) was quantified using CCK‐8 assay. (D) Representative images of live NP cells (stained green) and dead NP cells (stained red) following incubation in LN media +/− baf (8–48 h) treatment. The ratio of live (green)/ dead (red) cells in LN media +/− 10 nM baf treatment was quantified using image J. Data shown are mean ± SEM of 3 technical replicates. Two‐tailed Student's t test was used to quantify significance. *p < 0.05 baf A1, bafilomycin A1.
2.5. Histology
A lumbar segment containing L3–L5 isolated from three Col2a1‐Cre; Atg7 fl/fl and three Atg7 fl/fl control mice were fixed and decalcified in Decacifier I solution (3800440, Lecia) at 4°C overnight. All tissues were dehydrated through a graded alcohol series and then embedded in paraffin (Tissue Tek processor and Leica Embedder) and cut into 4‐μm thick sections in the coronal plane. The sections were stained with hematoxylin and eosin (HT110280‐2.5L, HHS128‐4L, Millipore Sigma) by standard procedures and then photographed under 40–100× times magnification (E800 microscope, Nikon Eclipse).
Degenerative changes in IVD histological features were evaluated by four blinded scorers using the histological grading system established for mouse discs. 34 Three mice per genotype from each of the age groups were analyzed. Three lumbar coronal sections from each mouse were scored for specific features in the NP, AF, EP, and interfaces between NP and AF and between NP and EP as specified by Melgoza et al. 34 NP, AF, EP tissue, and interfaces were scored individually, and a composite score was calculated by adding all the individual scores for NP, AF, and EP tissue as well as the interface scores. The features of NP and AF that were scored included NP cellularity and morphology, NP fibrosis, NP matrix organization, AF cellularity, AF bulging, AF lamellar organization, and AF clefts/fissures. 34 Each feature was scored individually from 0 to 3 whereby, 0 represented the young healthy state and 3 represented the maximum degenerative state. 34
2.6. Immunohistochemistry
Detection of aggrecan was performed on deparaffinized coronal IVD tissue sections of 4‐μm thickness. The sections were pretreated with chondroitinase ABC (0.25 U/mL; C3667 Millipore Sigma) at 37°C for 1‐h to unmask epitopes on aggrecan. Endogenous peroxidase activity was eliminated by the treatment with 3% hydrogen peroxide, and then incubated 15 min with Avidin D solution and 15 min with biotin solution (SP‐2001, Vector laboratories). Permeabilization and blocking was done with 10% goat serum, 1% BSA, and 0.25% triton x‐100 in PBS for 30 min. Primary antibody against aggrecan (1:200; AB1031, Millipore Sigma) was applied at 4°C overnight, then thoroughly washed with washing buffer (0.05% Tween20 in PBS). Biotinylated goat anti‐rabbit secondary antibody (1:200; BA‐1000, Vector Laboratories) was applied for 30 min and the sections were washed again in washing buffer, followed by the avidin‐biotin amplification (PK‐6100, Vector Laboratories) for 30 min. AEC substrate/chromogen KIT (ACG500, ScyTek Laboratories) was used for 10 min. Hematoxylin was used as a counterstain. All mounted slides with mounting medium Cytoseal 60 (8310‐4, Thermo Fisher Scientific) were visualized on a Nikon Eclipse E800 microscope. Mean aggrecan intensity was calculated on image J using an established protocol. 35
2.7. Immunofluorescence
Mouse lumbar IVDs were isolated and fixed overnight at 4°C in 2% paraformaldehyde and then immersed in 30% sucrose overnight before being frozen in 2‐methylbutane cooled in liquid nitrogen. Frozen lumbar disc cryosections (5 mm) were rehydrated in PBS and blocked with 5% normal donkey serum in 0.5% BSA for 45 min at room temperature. Incubation with primary antibodies for anti‐aggrecan (AB1031, Millipore Sigma) and anti‐keratin 19 (TROMA‐III, Developmental Studies Hybridoma Bank) were carried out overnight at 4°C. Sections were washed 5× in 0.5% BSA and incubated in secondary antibodies donkey anti‐rabbit Cy3 (715‐165‐152, Jackson Immuno) or donkey anti‐rat Alexa 488 (A21208, Invitrogen) for 1 h, washed 5 times in 0.5% BSA followed by 1 min in Hoechst dye (B2883, Millipore Sigma) at 1 mg/mL, and mounted with Gelvatol. In situ cell death was analyzed by TMR red TUNEL (12156792910, Millipore Sigma) staining carried out according to the manufacturer's instructions. Images were collected with a Nikon A1 confocal microscope at 40× magnification using large area scanning and analyzed using NIS‐Elements software by a research technician blinded to the image identities (version 5.30).
2.8. qRT‐PCR
Total RNA from NP and AF tissue of mouse tail discs were isolated using Biomasher Ii Closed System Disposable Micro Tissue Homogenizer and TRIzol™ Reagent per manufacturer's instructions (15 596 026, Thermo Fisher). Real‐time quantitative PCR (RT‐qPCR) was performed using iTaq™ Universal SYBR Green One‐Step Kit (1 725 151, Bio‐Rad) and Bio‐Rad CFX OPUS 96 Real‐time PCR system. Relative gene expression was determined after normalizing to GAPDH, a housekeeping gene, by calculating the average ΔCt for each group then calculating relative gene expression between groups using the 2−ΔΔCt method. Primers used in this study are listed in Table S2.
2.9. DMMB assay
Proteoglycan content of NP cells was measured using 1,9‐dimethylmethylene blue buffer (DMMB) assay for total glycosaminoglycan (GAG). GAG was released by papain digestion of cell extract at 60°C for 2 h. Concentration of GAG was measured according to the DMMB procedure using Chondroitin‐6‐sulfate (C6737, Millipore Sigma) as the standard and normalized to DNA as measured by the Pico green assay (P11496, Thermo Fisher).
2.10. Proteoglycan synthesis
35S‐sulfate incorporation was performed, as previously described 36 to measure PG synthesis. Briefly, 35S‐sulfate (ARS 0105‐10 mCi/mL, American Radiolabeled Chemical) was added to NP cell culture media treated with or without bafilomycin in triplicate wells per condition in a 24‐well plate format. Cells were radiolabeled at the beginning of bafilomycin treatment experiments for 48 h and extracted by addition of homogenization buffer containing 200 mM sodium chloride, 50 mM sodium acetate, 0.1% Triton X‐100 (X‐100, Millipore Sigma), 10 mM EDTA, 50 μM DL‐Dithiothreitol (D D9779, Millipore Sigma), and 1× Protease Inhibitor (P8340, Millipore Sigma) and shaking at 4°C for 1 h in a separate 1.5 mL micro centrifuge tube. Proteoglycans in NP cell lysate were extracted with shaking in 4 M guanidine hydrochloride solution (G3272, Millipore Sigma) containing 50 mM sodium acetate, 10 mM EDTA, and 1X protease inhibitor at 4°C for 4 h. Extracted samples were mixed with Alcian blue solution containing 0.2% Alcian blue (A9186, Millipore Sigma), 50 mM sodium acetate, and 85 mM magnesium chloride for 1 h at room temperature then loaded onto nitrocellulose membranes (HAWP02500, Millipore Sigma). The membranes were washed with a buffer containing 50 mM sodium acetate (S2889, Millipore Sigma), 50 mM magnesium chloride, and 100 mM sodium sulfate (239 313, Millipore Sigma) to eliminate unincorporated 35S‐sulfate. The membranes were dissolved in scintillation fluid (LS‐201, National Diagnostics) and counted in a scintillation counter (Packard Tri‐Carb 2100TR). Counts per minute (CPM) were converted to number of Pico moles of sulfate, using the specific activity of 35S‐sulfate measured in the conditioned media, and then normalized to the amount of DNA per sample as determined by the Pico green assay (P7589, Thermo Fisher).
2.11. CCK‐8
Cells were plated in triplicate in 12‐well tissue culture plate. P2 rat NP cells cultured in media containing 1 mM glutaMAX and 1% FBS were treated with 10 nM bafilomycin for varying time points (0–48 h) at 5% O2. Cell viability was measured by CCK‐8 assay (CK04, Dojindo Molecular Technologies INC.) following the manufacturer's instructions.
2.12. Red/green cytotoxicity/viability assay
Cells were plated in triplicate in 12‐well tissue culture plate were assessed by the live/dead cell viability/cytotoxicity assay kit (L3224, Thermo Fisher), which allows for simultaneous staining of living cells by intracellular esterase conversion of the substrate calcein acetoxymethyl ester and for dead cells by detecting membrane damage visualized by ethidium bromide binding to nuclear DNA. Fluorescence microscopy was performed using a fluorescein optical filter (485 ± 10 nm) for calcein AM and a rhodamine optical filter (530 ± 12.5 nm) for ethidium homodimer 1. Viability was assessed by live/dead two‐color fluorescence assay according to the manufacturer's instructions. Image analysis to quantify live/dead fluorescence was performed by using image J. Ratio of live to dead cells was calculated by averaging the total number of live cells by total number of dead cells from the three replicates of each condition, as specified by the manufacturer's instructions.
2.13. Light microscopy
Cell morphology and density were visualized and photographed under 100 times magnification (TS100 microscope, Nikon Eclipse).
2.14. Statistical analysis
Data are presented as the mean ± standard deviation (SD) or standard error or mean (SEM). Statistical analyses (either Student t test or analysis of variance (ANOVA) as mentioned in the figure legends) were performed with GraphPad Prism 8.0 (GraphPad Software, Inc.), and a p‐value of <0.05 defined statistically significant differences.
3. RESULTS
3.1. Effect of autophagy blockage on NP cells in vitro
To investigate the role of autophagy in cell survival and function, rat NP cell cultures were treated with the autophagy chemical inhibitor bafilomycin A1 (Figure 1A). Bafilomycin A1 inhibits the proton pump on the lysosomal membrane, which is responsible for acidifying the lysosome, leading to an increase in lysosomal pH that impairs autophagosome‐lysosome fusion needed to form autolysosomes to degrade the cellular material within the autophagosome. 37 Dose dependent treatment of bafilomycin (0–100 nM) showed maximum inhibition of autophagy with the minimum dose of 10 nM after 4‐h of treatment in rat NP cells grown in low‐nutrient media (Figure S1). Time‐dependent treatment of bafilomycin caused an accumulation of the key autophagy markers p62 and LC3II, confirming that autophagy flux is active in NP cells under both nutrient poor and rich culture condition (Figures 1B and S1). Of note, there was no difference in the level of autophagy markers p62 and LC3II in NP cells grown in nutrient rich or nutrient poor condition, suggesting that in rat NP cells autophagy is active and not dependent on nutrient level (Figure 1B).
Further, to determine whether autophagy inhibition affects NP cell viability, CCK‐8 assay was performed on NP cell cultures treated with bafilomycin for 0–48 h. Bafilomycin caused significant NP cell death at 48 h of treatment. These results were consistent with loss of cell morphology and cell density observed at 48 but not 8 or 24 h post‐bafilomycin treatment (Figure 1C). The Red/Green Cell Viability/Toxicity assay also revealed a significant decrease in the ratio of live to dead cells in the 48‐h bafilomycin treatment with no effect at 8 or 24 h of treatment (Figure 1D). These results suggest that bafilomycin A1 blocks autophagy flux in rat NP cells and induces cell death in long‐term (48‐h) but not short‐term (0–24‐h) treatment. Interestingly, at 8 h of bafilomycin treatment, CCK‐8 signal was increased by almost 200% (Figure 1D) and cell viability by about 30% by Live/Dead viability assay, implying possible robust cell viability induced by short‐term stress from autophagy inhibition.
As cellular senescence is involved in the pathophysiology of IDD, 38 markers of cellular senescence were assessed. As shown in Figure 2A,B, gene expression of p16 INK4a was not affected while p21 CIP1 was increased after 48 h of bafilomycin treatment. Overproduction of MMPs and pro‐inflammatory cytokines is also a unique feature of cellular senescence, so the two key genes implicated in IDD, Mmp13 and the inducible Cox2, were also measured in response to bafilomycin treatment. There was no effect of bafilomycin in mRNA level of Mmp13 (Figure 2C) or Cox2 in NP cells (Figure 2D), suggesting that NP cell autophagy inhibition has little impact on gene expression involved in matrix catabolism or inflammation. However, gene expression level of aggrecan (Acan) and collagen type II (Col2) was reduced by bafilomycin (Figure 2E,F). Intriguingly, total GAG, a surrogate marker of aggrecan content, as measured by DMMB assay in NP cells after treatment with bafilomycin was not significantly affected after 48 h (Figure 2G). It is possible that the drop in aggrecan transcription caused by bafilomycin requires longer treatment (>48 h) to propagate an observable decrease in the downstream GAG production. Overall, our in vitro findings suggest that autophagy plays a role in maintaining NP cell viability and transcription of matrix genes, but its role in modulating NP cellular senescence is less clear.
FIGURE 2.

Effects of blocking autophagy on cellular senescence and NP cell matrix homeostasis. (A‐F) qPCR analysis of mRNA expressions of p21, p16, MMP13, COX2, ACAN, COL‐II in rat NP cells treated with baf A1 for different time duration as indicated. (G) Total GAG content from NP cells cultured in LN media +/− baf (8–48 h) treatment was quantified using DMMB assay. Data shown are mean ± SD of 3 technical replicates. The one‐way ANOVA with multiple comparison was performed to determine the statistical significance, and p‐values are shown in the graphs. baf, bafilomycin A1.
3.2. Generation and validation of Col2a1‐Cre ; Atg7 fl/Fl mouse line
First, to confirm the occurrence of autophagy in disc tissue, we compared the basal level of autophagy in the disc and other body tissues from rats. As shown in Figure 3A, NP tissue exhibited the highest level of LC3II:LC3I ratio, a surrogate marker for the number of autophagosmes, compared to kidney, paraspinal muscle, or vertebral bone. The LC3II:LC3I ratio of NP were two times higher than that of AF tissue in both young and aged rats, indicating high basal autophagy activity in NP cells in vivo (Figure 3B). However, there was no difference in LC3II:LC3I ratio level in AF or NP tissue in young (3 months) compared to old rats (24 months; Figure 3B). It remains to be determined whether disc autophagy flux changes with age as we only measured the static levels of LC3 proteins in AF and NP tissue, which do not necessarily reflect autophagy flux.
FIGURE 3.

Assessment of autophagy in vivo. (A) Western blot analysis of LC3I/II in the AF, NP tissues as well as kidney, muscle, and bone from rats. Graph shows the ratio of LC3II to LC3I. GAPDH is used as loading control. (B) Comparison of LC3I/II expression in AF and NP tissues from young (Y1‐Y4; n = 4) and old (O1‐O4; n = 4) rats. Graph shows the ratio of LC3II to LC3I. The one‐way ANOVA with multiple comparison was performed to determine the statistical significance, and p‐values are shown in the graphs.
To investigate the physiological role of autophagy in NP cell survival and function in vivo, we generated NP‐targeted Atg7 knockout mice. ATG7 is an E1‐like ligase that facilitates two important and essential conjugation steps in the macroautophagy pathway. 39 Specifically, ATG7 conjugates microtubule‐associated protein 1 light chain 3 (LC3)‐I and phosphatidylethanolamine (PE) to form LC3‐II; ATG7 also conjugates ATG12 and ATG5 to form ATG12/ATG5. Both LC3‐II and ATG12/ATG5 are important for forming the isolation membrane and vesicle expansion in the autophagy pathway. 39 The mouse Atg7 gene is encoded by 17 exons that span 216‐kb with exon 14 encodes for the active site cysteine residue essential for activation for the substrates. 32 The targeting vector is designed to conditionally disrupt this exon 14 by the Cre‐loxP technology. Mice homozygous for the floxed Atg7 fl allele (referred to as Atg7 fl/fl mice) express intact Atg7 and are born healthy and fertile without any noticeable pathological phenotypes. To achieve NP‐targeted expression of Cre recombinase, a Col2a1‐Cre gene fusion was used as the Col2a1 promoter is transcriptionally active in NP tissue but not AF, EP, or most other tissues. The generation of Col2a1‐Cre mice has been described elsewhere. 33 We crossed Atg7 fl/fl mice with B6;SJL‐Tg (Col2a1‐cre) 1Bhr/J mice (Jackson Laboratory) to generate progenies with NP‐targeted deletion of Atg7 (henceforth referred to as Col2a1‐Cre; Atg7 fl/fl mice; Figure 4A).
FIGURE 4.

Generation and validation of Col2a1‐Cre; Atg7 fl/fl mice. (A) Schematic representation of how Col2a1‐Cre; Atg7 fl/fl mice were bred, starting with the breeding of 2 heterozygous Atg7 fl/+ mice to make Atg7 fl/fl mice (1). Heterozygous Col2a1‐Cre; Atg7 fl/+ mice were bred by mating Atg7 fl/fl mice with Col2a1‐Cre mice (2). Heterozygous Col2a1‐Cre; Atg7 fl/+ mice were bred again with Atg7 fl/fl mice to generate experimental Col2a1‐Cre; Atg7 fl/fl mice (3). The Cre‐lox system works by Cre recombinase cutting loxP sites surrounding the gene of interest in a specific tissue that expresses the gene of interest. In my model, Atg7 was specifically knocked out of NP tissues by Cre expressed under the control of Col2 promoter in the NP of IVD (4). (B) Expression of ATG7 and LC3‐II protein in various tissues from male Atg7 fl/fl and Col2‐Cre; Atg7 fl/fl (Atg7 KO) mice as determined by Western blotting. β‐actin was used as an internal loading control.
Col2a1‐Cre; Atg7 fl/fl mice were born normally and survived neonatal starvation. There were no major observable differences in Col2a1‐Cre; Atg7 fl/fl mice compared to control mice (Atg7 fl/fl ) for both sexes. For this study, we focused on studying only male mice. Male mouse weights were measured at 3, 6, and 12 months (Figure S2). Col2a1‐Cre; Atg7 fl/fl mice on average had significantly lower weight (26.8 g) compared to Atg7 fl/fl mice (32.5 g) at 3 months of age, but this weight difference resolved at 6 months (29.8 g Col2a1‐Cre; Atg7 fl/fl and 35.8 g Atg7 fl/fl ). There were no significant body weight differences between Col2a1‐Cre; Atg7 fl/fl and control mice at 6 (p = 0.12) or 12 months (p = 0.96; Figure S2).
To determine NP‐targeted knock out of Atg7 in male Col2a1‐Cre; Atg7 fl/fl mice, we measured the ATG7 protein from several spinal tissues (vertebral bone, paraspinal muscle, AF, and NP) from 2‐month‐old mice using Western blot. ATG7 protein expression in NP tissue was dramatically reduced (4 times) in Col2a1‐Cre Atg7 fl/fl mice compared to Atg7 fl/fl controls (Figure 4B). In contrast, ATG7 protein expression in AF, muscle, and vertebral bone remained relatively high and unaffected in both Col2a1‐Cre Atg7 fl/fl mice and Atg7 fl/fl control mice. We chose Atg7 fl/fl mice as the control for our study of Col2a1‐Cre Atg7 fl/fl mice based on disc gene expression comparison between their original parental strains of different genetic backgrounds, C57BL/6 mice, B6;SJLF1 mice, and Atg7 fl/fl mice, which showed no significant differences in ACAN, COL1, COL2, COX2, or MMP13 gene expression (Figure S3). Histology of whole disc and NP from 2‐month‐old C57BL/6 mice, B6;SJLF1, and Atg7 fl/fl mice also showed no significant differences, although B6;SJLF1 mice tend to have a shorter island of NP cells and some AF lamellar penetration into the NP compartment, which might represent degenerative changes (Figure S3). Given the similar IVD phenotypes among these strains, we chose Atg7 fl/fl mice as controls in our experiments due to their availability and ease of generation.
To further confirm disc Atg7 knockdown was permanent, ATG7 protein expression was measured in AF and NP tissue of 3‐, 6‐, and 12‐month‐old Col2a1‐Cre; Atg7 fl/fl and Atg7 fl/fl control mice using Western blot. NP tissue ATG7 protein in Col2a1‐Cre; Atg7 fl/fl mice was almost completely depleted compared to controls at 3, 6, and 12 months of age (Figure 5A,B ATG7 panel). AF tissue of Col2a1‐Cre; Atg7 fl/fl mice did not show significant differences in ATG7 protein level at 3 and 6 months of age (Figure 5A,B ATG7 panel), however at 12 months of age, it had significantly less ATG7 protein compared to controls (Figure 5A,B ATG7 panel), most likely due to some moderate expression of COL2 in the inner AF tissue.
FIGURE 5.

Successful inhibition of autophagy in NP tissue. Autophagy was inhibited primarily in NP tissue of Col2‐Cre; Atg7 fl/fl mice. (A) Expression of ATG7, p62, LC3‐II, and ATG12‐ATG5 protein in AF and NP tissue from Atg7 fl/fl control and Col2‐Cre; Atg7 fl/fl experimental mice at 3, 6, and 12 months (mo) of age was determined by Western blotting. β‐actin was used as an internal loading control. (B) Densitometric analysis of the proteins in AF and NP tissue were quantified by dividing the amount of each protein by β‐actin and normalizing to control protein amount for each age group. Data shown are mean ± SD of 3 independent mice per tissue per age group. Two‐tailed unpaired t test was used to quantify significance and p‐values are shown in the graphs. fl/fl, Atg7 fl/fl , KO or Atg7 KO, Col2‐Cre; Atg7 fl/fl .
3.3. Macroautophagy was inhibited in NP tissue of Col2a1‐Cre; Atg7 fl/fl mice
Atg7 depletion prevents autophagy as ATG7 is important to generate both LC3‐II and ATG12‐ATG5, which are essential for forming the isolation membrane and for vesicle expansion in the first step of the autophagy pathway. 39 Specifically, ATG7 conjugates microtubule‐associated protein 1 light chain 3 (LC3)‐I and phosphatidylethanolamine (PE) to form LC3‐II, and ATG7 conjugates ATG12 and ATG5 to form ATG12‐5. Both LC3‐II and ATG12‐5 are essential for forming the isolation membrane and vesicle expansion in the first step of the autophagy pathway. 39 To confirm that Atg7 knockdown in Col2a1‐Cre; Atg7 fl/fl mice successfully inhibited autophagy in NP tissue, protein expression of key autophagy markers LC3‐I, LC3‐II, p62, and ATG12‐ATG5 were measured in AF and NP tissues of 3‐, 6‐, and 12‐month‐old Col2a1‐Cre; Atg7 fl/fl and control mice using Western blot (Figure 5A,B). Significant autophagy inhibition was observed in NP tissue of Col2a1‐Cre; Atg7 fl/fl mice at 6 and 12 months of age, evidenced by increased accumulation of p62 and LC3‐I protein and substantial reduction of LC3‐II and ATG12‐5 protein (Figure 5A,B). These findings indicate overall decreased autophagy in NP tissue of Col2a1‐Cre; Atg7 fl/fl mice (Figure 5A,B).
Interestingly, LC3‐I protein was also increased in AF tissue of Col2a1‐Cre; Atg7 fl/fl mice compared to control, but p62 protein was unchanged (Figure 5A). Furthermore, ATG12‐ATG5 protein was slightly decreased in AF tissue of 3‐ and 6‐month‐old Col2a1‐Cre; Atg7 fl/fl mice compared to controls (Figure 5A,B ATG12‐ATG5 panel). Densitometry analysis showed significantly less LC3‐II protein and ATG12‐ATG5 protein in AF of 12‐month‐old Col2a1‐Cre; Atg7 fl/fl Col2a1‐Cre; Atg7 fl/fl mice compared to controls (Figure 5A,B LC3 and ATG12‐ATG5 panel). These results demonstrate that autophagy inhibition was mostly targeted to NP, although by 12 months of age there was also a modest inhibition of autophagy in AF tissue. However, the absence of changes in AF p62 protein between Col2a1‐Cre; Atg7 fl/fl Col2a1‐Cre; Atg7 fl/fl and control mice implies that autophagic flux was not completely inhibited in AF tissue (Figure 5A,B p62 panel). These results are consistent with the observation that AF tissue from Col2a1‐Cre; Atg7 fl/fl mice at 12 months of age had significantly less ATG7 protein compared to control (Figure 4C), likely due to partial expression of Col2 in the inner AF tissue.
3.4. Autophagy ablation affects NP tissue structure with age
To determine whether autophagy inhibition promotes IDD, H&E histological analysis was performed to compare morphological IVD features between homozygous knockout Col2a1‐Cre; Atg7 fl/fl mice and Atg7 fl/fl control mice at 3, 6, and 12 months of age (Figure 6A). Changes in several key IVD histological features were evaluated using a recently established histological grading system. 34 Blinded histology grading was performed by four scorers on multiple H&E‐stained disc sections from each of the five individual mice in the Atg7 fl/fl control and Col2a1‐Cre; Atg7 fl/fl group. Compared to control Atg7 fl/fl mice, Col2a1‐Cre; Atg7 fl/fl mice exhibited no significant degenerative histological changes in their IVDs at 3 months of age (Figure 6A), which was reflected in the quantified composite histological score (Figure 6B). However, scores for NP tissue and combined composite histological scores showed statistically significant higher values for Col2a1‐Cre; Atg7 fl/fl mice at 6 and 12 months of age compared to control mice (Figure 6B). In contrast, histological scores of AF and EP tissue, as well as the interface, showed no changes between control and Col2a1‐Cre; Atg7 fl/fl mice at 3, 6, or 12 months of age (Figure 6A,B and Table S1 ). Hence, degenerative changes were mostly confined to NP tissues of in older Col2a1‐Cre; Atg7 fl/fl mice (6 or 12 months). At higher magnification, abnormal structural changes were seen in the NP matrix and its island of cells in Col2a1‐Cre; Atg7 fl/fl mice compared to control that worsen with age from 3 to 6 months (Figure 6). These changes include decreased cell density and invasion of matrix into the NP cell island of Col2a1‐Cre; Atg7 fl/fl mice, resulting in cleft looking NP cell island as opposed to the smooth looking NP cell island seen in control mice (Table 1). Other severe degenerative changes such as AF lamella disorganization, loss of NP compartment, NP/AF interface disruption and so forth, were absent in Col2a1‐Cre; Atg7 fl/fl mice (Figure 6 and Table S1). Together, these results suggest NP autophagy is important for maintaining IVD health after skeletal maturation but is not critical for IVD development as Atg7 genetic knockout in Col2a1‐Cre; Atg7 fl/fl mice occurred earlier on during spine development.
FIGURE 6.

Effect of autophagy inhibition on IVD maturation and IDD progression in aging mice. (A) H&E staining of lumbar disc was performed to assess gross morphological changes between control and KO mice at 3, 6, and 12 months of age. Whole disc images were taken at 100× (scale bar 200 μm), and NP images were taken at 400× (scale bar 50 μm) whereas AF images were taken at 200× (scale bar 100 μm). (B) Individual histology scores for each tissue of the IVD and the interface between tissues were calculated by 4 blind reviewers. Composite score was calculated by adding all individual scores together. Data shown are mean ± SEM of 5 independent mice. Two‐tailed unpaired t test was used to quantify significance. *p < 0.05. Atg7 KO, Col2‐Cre; Atg7 fl/fl .
3.5. Autophagy is not essential for maintaining NP proteoglycan matrix homeostasis
Loss of proteoglycan (PG) matrix, of which aggrecan is the primary constituent in NP tissue, is a key marker of IDD. 40 To study the effect of autophagy inhibition on disc PG, disc aggrecan immunofluorescence (IF), immunohistochemistry (IHC), and gene expression were measured in 12‐month‐old Col2a1‐Cre; Atg7 fl/fl mice and control mice. IF assay showed an abundance of aggrecan (red) staining in NP tissue compared to AF tissue of both control and Col2a1‐Cre; Atg7 fl/fl mice at 12 months of age (Figure 7A). However, there was no difference in mean aggrecan intensity in NP or AF tissue between 12‐month‐old control and Col2a1‐Cre; Atg7 fl/fl mice (Figure 7A). Likewise, aggrecan IHC showed no significant difference in mean aggrecan staining of NP tissue between 12‐month‐old control and Col2a1‐Cre; Atg7 fl/fl mice (Figure 7B). DMMB assay showed no significant difference in GAG content in NP or AF tissue between 12‐month‐old control and Col2a1‐Cre; Atg7 fl/fl mice (Figure 7C). Acan gene expression in NP or AF tissue between age‐matched control and Col2a1‐Cre; Atg7 fl/fl mice was not changed, however, Acan gene expression in AF and NP tissues was significantly decreased at 12 months compared to 3 months in both control and Col2a1‐Cre; Atg7 fl/fl mice, indicating that IVD Acan gene expression declines with age (Figure 7D). Together, these independent assays measuring aggrecan protein and mRNA levels indicate that autophagy inhibition in NP tissue had no effect on IVD PG content and production in vivo. Interestingly, MMP‐ and ADAMTS‐mediated proteolysis within the globular domain of disc aggrecan was reduced in Col2a1‐Cre; Atg7 fl/fl mice as compared to control mice of same age, suggesting that NP autophagy blockage has no adverse effects on IVD aggrecan catabolism (Figure 7E).
FIGURE 7.

Effects of disc Atg7 deficiency on disc matrix. (A, B) Aggrecan protein levels in 12‐month‐old control and KO mice were quantified by immunofluorescence signals (A) and immunohistochemistry staining (B). Graphs of mean aggrecan intensity in AF and NP were calculated by quantifying mean aggrecan intensity in the region of interest for control and KO mice. (C) Total GAG content, a surrogate marker of aggrecan content, in 12‐month‐old NP and AF tissue from control and KO mice was measured using DMMB assay. (D) Aggrecan mRNA levels in NP and AF tissue of 3‐ and 12‐month‐old control and KO mice was quantified using qRT‐PCR. (E) Western blot analysis of ADAMTS‐generated (~65 kDa) and MMP‐generated (~55 kDa) aggrecan fragments with graphs showing quantification results. (L represents ladder and lane 1–4 are the samples from different mice for control and KO group). Structure of aggrecan with location of fragmentation is shown. Data shown are mean ± SD of 4 or 5 independent mice. Representative images from 5 independent mice are shown (A, B). Two‐tailed Student's t test was used to quantify significance. *p < 0.05. Atg7 KO, Col2‐Cre; Atg7 fl/f .
3.6. Autophagy inhibition does not affect cell death in vivo
Next, the effects of autophagy inhibition on cell death was analyzed using western blot and TUNEL assay. Results revealed no detectable cleavage of caspase‐3, a marker of apoptosis, and no difference in intact caspase‐3 protein level in AF and NP tissues from 3‐, 6‐, or 12‐month‐old control and Col2a1‐Cre; Atg7 fl/fl mice (Figure 8A). TUNEL assay on IVD sections of 12‐month‐old mice also showed no difference between control and Col2a1‐Cre; Atg7 fl/fl mice, suggesting apoptotic cell death was not affected by autophagy inhibition, in either NP or AF tissue (Figure 8B). Quantification of TUNEL positive cells revealed an almost complete absence of apoptotic cells in AF or NP in 12‐month‐old control and Col2a1‐Cre; Atg7 fl/fl mice (Figure 8B). These data indicate autophagy inhibition in NP tissue does not induce apoptosis in vivo, up to 12 months of age.
FIGURE 8.
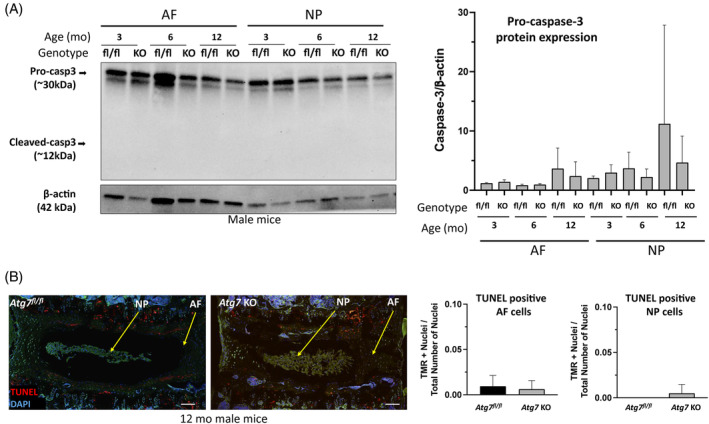
Effect of autophagy inhibition on IVD cell death in vivo. (A) Western blot analysis to detect the cleavage of apoptosis marker caspase‐3 in AF and NP tissues from 3‐, 6‐, or 12‐month‐old control and KO mice. Densitometry analysis of caspase‐3 expression normalized to β‐actin expression is shown. (B) TUNEL assay was performed to label the damaged sites of DNA and was visualized by fluorescence microscopy. TUNEL‐positive apoptotic cells in control and KO mice were assessed by immunofluorescence (red) scale bar 200 μm. Representative images are shown. Graphs of TMR+ nuclei, TUNEL‐positive staining, divided by the total number of nuclei show the ratio of TUNEL positive cells to total cells in NP and AF. Data shown are mean ± SD of 5 independent mice. Two‐tailed Student's t test was used to quantify significance. fl/fl, Atg7 fl/fl , KO or Atg7 KO, Col2‐Cre; Atg7 fl/fl . fl/fl = Atg7 fl/fl mice (non KO control); KO or Atg7 KO = Col2‐Cre; Atg7 fl/fl mice.
3.7. Effects of autophagy inhibition on IVD cellular senescence and inflammation in vivo
To study the effect of autophagy inhibition on cellular senescence and inflammation, both of which contribute to IDD, protein expression of senescence markers p53, as well as inflammatory markers TNF‐α and IL‐1β were measured by using western blot analysis. Protein expression levels of p53 and TNF‐α were not different in AF and NP tissues between 12‐month‐old control and Col2a1‐Cre; Atg7 fl/fl mice (Figure 9A,B). However, expression of IL‐1β was significantly lower in AF as well as NP tissues from Col2a1‐Cre; Atg7 fl/fl mice compared to controls (Figure 9A,B). qRT‐PCR analysis of key markers of IVD matrix metalloproteinases (Mmp13), cellular senescence (p16 INK4a and p21 CIP1 ), and inflammation (Cox2 and iNos) genes in AF and NP yielded mixed results. In AF tissue, iNos, p16 INK4a , and p21 CIP1 expression remained unchanged while Mmp13 and Cox2 mRNA expression was significantly reduced in Col2a1‐Cre; Atg7 fl/fl mice compared to controls at 3 and 12 months of age (Figure 9C,E). In NP tissue, iNos, Cox2, and p16 INK4a expression remained unchanged while MMP13 and p21 CIP1 mRNA expression was significantly increased in Col2a1‐Cre; Atg7 fl/fl mice compared to control at 12 months of age (Figure 9D,F). Collectively, these data revealed that autophagy inhibition has mixed effects on disc cellular senescence and inflammation, warranting further studies to clarify possible regulatory mechanisms of autophagy on these processes in IVD.
FIGURE 9.

Effect of autophagy inhibition on cellular senescence and inflammation in vivo. (A) Western blot analysis to detect the protein expression of TNF‐α, IL1β and p53 in AF and NP tissues from male control and KO mice. (B) Graphs of densitometry analysis of western blot bands normalized to β‐actin are shown. (C, D) mRNA levels of MMP13, COX2 and iNOS in AF (C) and NP tissue (D) of 3‐ and 12‐month‐old (mo) Atg7 fl/fl and Atg7 KO mice was quantified using qRT‐PCR. Data shown are mean ± SD of 3 independent mice. Two‐tailed Student's t test was used to quantify significance. *p < 0.05, **p < 0.01, ***p < 0.005, ***p < 0.001. Atg7 KO, Col2‐Cre; Atg7 fl/fl .
4. DISCUSSION
Autophagy inhibition or dysregulation is associated with many diseases including, but not limited to, liver disease, neurodegeneration, Crohn's disease, and metabolic syndrome. 8 , 9 , 11 , 12 Whether autophagy inhibition drives IDD has never been clearly established. Although some autophagy‐inducing drugs have been reported to reduce degenerative changes in IVDs of injury‐induced rat models of IDD, these drugs are not specific for inducing only autophagy but also act on multiple molecular pathway targets, making it difficult to attribute how much autophagy contributes to disc health maintenance. 23 , 24 , 25 Whether autophagy occurs in disc cells is another unresolved question due to the scarcity of disc literature in measuring disc cell autophagic flux, a gold standard for demonstrating the existence of autophagy. 21 In this study, we unequivocally demonstrated autophagy flux in NP cells by treating them with bafilomycin to block the last step of the autophagy process, which caused a time‐dependent buildup of the key autophagy proteins p62 and LC3II involved in the earlier autophagy steps (Figure 1B).
Other important knowledge gaps in disc autophagy research include the absence of direct evidence supporting autophagy as an essential process for NP cell health and function and that autophagy inhibition or defect directly drive IDD in vivo. Although, using RNA interference (RNAi) technique in vivo and in vitro, recent study suggested anti‐apoptotic and anti‐senescence role for ATG5 in rat disc NP cells to maintain the homeostasis, 28 study is limited to disc disruption method rather than aging associated IDD. Many phenotypes of tissue specific knockout mice of ATG‐related genes involved in autophagy have been published, 41 , 42 but none have looked at IVD tissue. In this study, we investigated whether autophagy is essential for NP cell health and if inhibition of autophagy in NP tissue leads to IDD in vivo by specifically knocking out Atg7 in the NP tissue of the IVD using the cre‐lox reporter system. We chose ATG7 because its genetic knockout resulting in autophagy ablation has been well investigated in other tissues. 39 Significant loss of ATG7 protein was seen in NP tissue of our generated Col2a1‐Cre; Atg7 fl/fl mice, but not in AF, paraspinal muscle, or vertebral bone, indicating our mouse model successfully deleted ATG7 predominantly in NP cells. Furthermore, autophagy was inhibited primarily in NP tissue of Col2a1‐Cre; Atg7 fl/fl mice, but not paraspinal muscle or vertebral bone. Compared to control mice, AF tissue of Col2a1‐Cre; Atg7 fl/fl mice showed a slight increase in LC3‐I and slight decrease in ATG12‐ATG5, which are markers of autophagy inhibition. However, p62 protein was unaffected, suggesting only partial inhibition of autophagy in AF cells of Col2a1‐Cre; Atg7 fl/fl mice. The partial autophagy inhibition in AF is likely due to some expression of Col2 by inner AF cells. Overall, we were able to establish a Col2a1‐Cre; Atg7 fl/fl mice as a useful model to study IVD autophagy. This study is limited to male mice, however several previous reports suggest that sex‐based differences in autophagy may contribute to the regulation of various diseases. 43 , 44 , 45 Hence, studying the phenomenon in female mice would clarify the role of autophagy in IVD health, which we will be pursuing in the future studies.
4.1. NP cell autophagy is constitutively active
Several observations implicate the presence of high autophagy activity in disc NP tissue. Potent cellular stressors that induce autophagy are nutrient deprivation and hypoxia, both of which are also key physiological features of NP. Cells activate autophagy under low nutrient stress to generate energy to maintain cell function and survival, at least temporarily, by degrading proteins and organelles. 11 In our rat NP cell culture model, lowering nutrient in the culture media did not further induce autophagy (Figure 1B). In fact, we found robust autophagy flux in NP cells grown in both nutrient‐rich and poor culture conditions, suggesting that NP cell autophagy activity is constitutively active and not dependent on nutrient level. To date, among the few studies examined the effect of nutrient stress on autophagy in NP cells, low nutrient was reported to induce autophagy in NP cells to variable degrees. 21 The variable and inconsistent effects of nutrients on NP cell autophagy might be due to the different model species, culture conditions, and nutrient treatment regimens tested in the reported studies. Nevertheless, our findings suggest that NP cells might adapt to their residence in a chronically nutrient poor tissue niche to enable survival in part by maintaining constitutively high autophagic activity independent of nutrient flux. This idea is also supported by high levels of basal NP autophagy in young and old rats, evidenced by the presence of the autophagosome marker, LC3‐II, in NP tissue at the level that is much higher compared to those found in other tissues such as paraspinal muscle, vertebral bone, and kidney (Figure 3).
4.2. Negligible impact of autophagy inhibition on NP cell death and senescence
If autophagy is essential for NP cells, then its inhibition is expected to lead to cell death. Our results showed NP cells can only tolerate the absence of autophagy short‐term but require autophagy for their long‐term survival. Because bafilomycin blocks other processes besides autophagy, bafilomycin‐induced NP cell apoptosis could be due to the combined effects of inhibition of autophagy and other cellular processes that rely on acidic compartments, ion channels, and signaling pathways. 46 , 47 Nevertheless, our in vivo results showed that inhibition of NP macroautophagy has no impact of apoptosis of NP cells indicating that NP cell viability does not depend solely on macroautophagy. Previous reports suggested that cartilage specific Atg7 knockout mice where autophagy was important for chondrocyte survival and proliferation (26077727), however apoptosis was not observed in Atg7 deficient osteocytes (23645674), suggesting a tissue specific role of Atg7 in apoptosis.
Cellular senescence is caused by accumulated molecular damage while autophagy is a mechanism of eliminating cellular damage. 38 Autophagy inhibition is reported to trigger cellular senescence but it is yet to be proven clearly whether autophagy has a positive or negative impact on senescence. 48 In our in vitro and in vivo observation, autophagy inhibition only induced the expression of the cellular senescence marker p21CIP but not of other senescence markers such as p16 INK4a , Tnf, Il1b, iNos, and Cox2. Although direct relation between p21CIP and autophagy is not established, a recent study showed that interaction of p21 with LC3B could promote autophagy for the improvement of cardiac function during sepsis, 49 and our observation also suggests that autophagy inhibition has no impact on cellular senescence markers except for p21CIP in NP cells, revealing complex interaction between autophagy and cellular senescence in disc cells, which requires further attention in future studies.
4.3. Negligeable impact of autophagy inhibition on NP matrix homeostasis
Although NP cell viability is not affected by autophagy ablation, we hypothesized that the stress of autophagy inhibition would perturb NP matrix homeostasis, specifically the balance between anabolism and catabolism of NP aggrecan because aggrecan is the prominent matrix constituent of NP tissue. 40 To our surprise, gene and protein expression of aggrecan, and NP GAG content was not changed between Col2a1‐Cre; Atg7 fl/fl and control mice at 12 months of age, however we observed that NP‐targeted autophagy ablation decreased NP aggrecanolysis. In our study, increased cellular senescence marker p21 could be associated with aggrecanolysis as cellular senescence is closely associated with the loss of disc PG in previous studies, 50 , 51 which needs further attention in the future. The lack of overall effects on NP cell viability and proteoglycan matrix homeostasis observed in Col2a1‐Cre; Atg7 fl/fl mice indicate that autophagy is not essential for IVD maturation and healthy aging up to 12 months of age. Also, aggrecan content and synthesis were not affected with bafilomycin treatment (8–48 h; data not shown). These results suggest autophagy dysregulation or inhibition is not a significant driver of IDD in mice. Further research is needed to confirm whether this is true for older mice (12–24 months of age).
4.4. Effects of autophagy inhibition on IDD in Col2a1‐Cre; Atg7fl/Fl mice
Loss of Atg7 in other body tissues, using tissue‐specific Cre reporter mouse models crossed with Atg7 fl/fl mice, produced severe pathological conditions. 39 , 52 Contrary to those findings, we found no significant differences in molecular, cellular, and histological feature, between 3‐month‐old control and Col2a1‐Cre; Atg7 fl/fl mice, suggesting that autophagy in NP tissue it is not essential for normal IVD maturation in mice. However, histological analysis did reveal some structural changes to the island of cells in the NP tissue including invasion of matrix into the NP cell island of 12 months old Col2a1‐Cre; Atg7 fl/fl mice, resulting in fissuring appearance to an otherwise smooth looking NP cell island seen in control mice. It is not clear how deletion of Atg7 in NP tissue causes these NP structural changes without affecting the typical IDD hallmarks (e.g., NP cell apoptosis, reduced aggrecan content, and integrity). Additionally, compared to age‐matched controls, Col2a1‐Cre; Atg7 fl/fl mice up to 12 months exhibit no severe histologic degenerative changes such as NP fibrosis, EP degeneration, AF lamella disorganization, loss of NP compartment, and NP/AF interface disruption. Previously, deletion of Atg5 or Atg7 in chondrocytes led to mild growth retardation, suggesting the tissue specific role of Atg7 in tissue function. 53 Our findings reveal that macroautophagy in NP tissue at best plays a modest role in maintaining IVD health after skeletal maturation as NP autophagy inhibition alone failed to drive severe IDD in mice up to 12 months of age.
4.5. Summary
This is the first study to investigate whether autophagy is essential for IVD health in vivo using a novel transgenic rodent model of NP‐targeted autophagy ablation. Contrary to the prevailing thinking in the IVD field, NP autophagy inhibition does not accelerate IDD in mice up to 12 months of age. Whether autophagy inhibition promotes IDD in mice older than 12 months requires further investigation. Our findings effectively eliminate macroautophagy as the principal cellular pathway NP cells adopted to survive in their low nutrient, hypoxic environment. It is important to note that other types of autophagy not investigated in this study, namely chaperone mediated autophagy and micro‐autophagy, could be playing important roles in maintaining NP cell health. The absence of overt IDD phenotype in Col2‐Cre; Atg7 fl/fl mice also implicates other compensatory mechanisms such as the ubiquitin‐proteosome pathway needed to eliminate the buildup of intracellular damaged proteins in NP tissue. The results presented here highlight the need for in‐depth research to elucidate the complex elusive biology of autophagy and other pathways disc cells utilize to remove molecular damage and adapt to survive and function in their harsh microenvironment.
AUTHOR CONTRIBUTIONS
Rebecca Kritschil, Joon Lee, Gwendolyn Sowa, and Nam Vo conceptualized and designed the experiments. Rebecca Kritschil, Vivian Li, Dong Wang, Qing Dong performed the experiments and data acquisition. Rebecca Kritschil and Nam Vo analyzed/interpreted the data and wrote the manuscript. Prashanta Silwal, Toren Finkel, Joon Lee, Gwendolyn Sowa provided technical expertise, analysis, and interpretation of data. All authors proofread the manuscript. All authors contributed to the article and approved the submitted version.
FUNDING INFORMATION
This work was supported by Albert B. Ferguson Jr, M.D. Orthopedic Fund of The Pittsburgh Foundation, Department of Orthopedic Surgery Internal Fund, Orland Bethel Endowed Professorship Fund, Ferguson Foundation Fund and US National Institutes of Health (NIA, R01 AG044376‐01) to Nam Vo and NIH grant 1R01HL142663 to Toren Finkel.
CONFLICT OF INTEREST STATEMENT
The authors declare no potential conflict of interest.
Supporting information
Figure S1. Effects of bafilomycin in NP cells in vitro. (A–C) Western blot analysis to detect the level of p62 and LC3I/II in NP cells treated with bafilomycin (10–100 nM) for 4 h in low‐nutrient medium. Densitometry analysis of p62 normalized to β‐actin (B) and ratio of LC3II to LC3I (C) are shown. (D–F) Expression level of p62 and LC3I/II in NP cells treated with bafilomycin for different time duration as indicated. Densitometry analysis of p62 normalized to β‐actin (E) and ratio of LC3II to LC3I (F) are shown. Data shown are mean ± SD of 3 independent mice. Two‐tailed Student's t test was used to quantify significance. *p < 0.05.
Figure S2. Mouse body weights. Control and KO mice weights at 3, 6, and 12 months were calculated using scale in grams. Data shown are mean ± SEM. Two‐tailed Student's t test was used to quantify significance. *p < 0.05. Control, Atg7 fl/fl ; KO, Col2‐Cre; Atg7 fl/fl .
Figure S3. Confirming IVD phenotype of different control mice. (A) Gene expression levels of selected NP markers ACAN, COL2, COL1, COX2, and MMP13 were quantified by qRT‐PCR. (B) H&E staining of lumbar disc was performed to assess gross morphological changes between potential control mice. Whole disc images were taken at 40×, and NP images were taken at 100×. Data shown are mean ± SD of 3 independent mice. Student's t test was used to quantify significance. **p < 0.01, ACAN, aggrecan; COL2, collagen 2 alpha 1; COL1, collagen 1, COX2, cyclooxygenase 2; MMP13, matrix metalloproteinase 13.
Table 1. Disc histological scores.
Table 2. qRT‐PCR primers used in this study.
Data S1. Supporting Information.
ACKNOWLEDGMENTS
We want to convey our sincere thanks to Center for Biologic Imaging in University of Pittsburgh, Amy Robertson Division of Laboratory Animal Resources (DLAR), Feng Li, Mark Ross, and Claudette St. Croix. The authors wish to thank Jessa Darwin for her editorial assistance on the manuscript.
Kritschil, R. , Li, V. , Wang, D. , Dong, Q. , Silwal, P. , Finkel, T. , Lee, J. , Sowa, G. , & Vo, N. (2024). Impact of autophagy inhibition on intervertebral disc cells and extracellular matrix. JOR Spine, 7(1), e1286. 10.1002/jsp2.1286
REFERENCES
- 1. Katz JN. Lumbar disc disorders and low‐back pain: socioeconomic factors and consequences. J Bone Joint Surg Am. 2006;88(suppl 2):21‐24. [DOI] [PubMed] [Google Scholar]
- 2. Rubin DI. Epidemiology and risk factors for spine pain. Neurol Clin. 2007;25(2):353‐371. [DOI] [PubMed] [Google Scholar]
- 3. Lyu FJ, Cui H, Pan H, et al. Painful intervertebral disc degeneration and inflammation: from laboratory evidence to clinical interventions. Bone Res. 2021;9(1):7. [DOI] [PMC free article] [PubMed] [Google Scholar]
- 4. Roughley PJ. Biology of intervertebral disc aging and degeneration: involvement of the extracellular matrix. Spine. 2004;29(23):2691‐2699. [DOI] [PubMed] [Google Scholar]
- 5. Urban JP, Smith S, Fairbank JC. Nutrition of the intervertebral disc. Spine. 2004;29(23):2700‐2709. [DOI] [PubMed] [Google Scholar]
- 6. Holm S, Maroudas A, Urban JP, Selstam G, Nachemson A. Nutrition of the intervertebral disc: solute transport and metabolism. Connect Tissue Res. 1981;8(2):101‐119. [DOI] [PubMed] [Google Scholar]
- 7. Holm S, Selstam G, Nachemson A. Carbohydrate metabolism and concentration profiles of solutes in the canine lumbar intervertebral disc. Acta Physiol Scand. 1982;115(1):147‐156. [DOI] [PubMed] [Google Scholar]
- 8. Cadwell K, Liu JY, Brown SL, et al. A key role for autophagy and the autophagy gene Atg16l1 in mouse and human intestinal Paneth cells. Nature. 2008;456(7219):259‐263. [DOI] [PMC free article] [PubMed] [Google Scholar]
- 9. Chu CT. A pivotal role for PINK1 and autophagy in mitochondrial quality control: implications for Parkinson disease. Hum Mol Genet. 2010;19(R1):R28‐R37. [DOI] [PMC free article] [PubMed] [Google Scholar]
- 10. Kuma A, Mizushima N. Physiological role of autophagy as an intracellular recycling system: with an emphasis on nutrient metabolism. Semin Cell Dev Biol. 2010;21(7):683‐690. [DOI] [PubMed] [Google Scholar]
- 11. Rabinowitz JD, White E. Autophagy and metabolism. Science. 2010;330(6009):1344‐1348. [DOI] [PMC free article] [PubMed] [Google Scholar]
- 12. Ueno T, Komatsu M. Autophagy in the liver: functions in health and disease. Nat Rev Gastroenterol Hepatol. 2017;14(3):170‐184. [DOI] [PubMed] [Google Scholar]
- 13. Dikic I, Elazar Z. Mechanism and medical implications of mammalian autophagy. Nat Rev Mol Cell Biol. 2018;19(6):349‐364. [DOI] [PubMed] [Google Scholar]
- 14. Cuervo AM. Autophagy and aging: keeping that old broom working. Trends Genet. 2008;24(12):604‐612. [DOI] [PMC free article] [PubMed] [Google Scholar]
- 15. Kuma A, Hatano M, Matsui M, et al. The role of autophagy during the early neonatal starvation period. Nature. 2004;432(7020):1032‐1036. [DOI] [PubMed] [Google Scholar]
- 16. Stroikin Y, Dalen H, Brunk UT, Terman A. Testing the “garbage” accumulation theory of ageing: mitotic activity protects cells from death induced by inhibition of autophagy. Biogerontology. 2005;6(1):39‐47. [DOI] [PubMed] [Google Scholar]
- 17. Terman A. Garbage catastrophe theory of aging: imperfect removal of oxidative damage? Redox Rep. 2001;6(1):15‐26. [DOI] [PubMed] [Google Scholar]
- 18. Mizushima N, Levine B. Autophagy in mammalian development and differentiation. Nat Cell Biol. 2010;12(9):823‐830. [DOI] [PMC free article] [PubMed] [Google Scholar]
- 19. Kroemer G, Marino G, Levine B. Autophagy and the integrated stress response. Mol Cell. 2010;40(2):280‐293. [DOI] [PMC free article] [PubMed] [Google Scholar]
- 20. Vernon‐Roberts B, Moore RJ, Fraser RD. The natural history of age‐related disc degeneration: the influence of age and pathology on cell populations in the L4‐L5 disc. Spine. 2008;33(25):2767‐2773. [DOI] [PubMed] [Google Scholar]
- 21. Kritschil R, Scott M, Sowa G, Vo N. Role of autophagy in intervertebral disc degeneration. J Cell Physiol. 2022;237(2):1266‐1284. [DOI] [PMC free article] [PubMed] [Google Scholar]
- 22. Dowdell J, Erwin M, Choma T, Vaccaro A, Iatridis J, Cho SK. Intervertebral disk degeneration and repair. Neurosurgery. 2017;80(3S):S46‐S54. [DOI] [PMC free article] [PubMed] [Google Scholar]
- 23. Kang L, Xiang Q, Zhan S, et al. Restoration of autophagic flux rescues oxidative damage and mitochondrial dysfunction to protect against intervertebral disc degeneration. Oxid Med Cell Longev. 2019;2019:7810320. [DOI] [PMC free article] [PubMed] [Google Scholar]
- 24. Chen D, Xia D, Pan Z, et al. Metformin protects against apoptosis and senescence in nucleus pulposus cells and ameliorates disc degeneration in vivo. Cell Death Dis. 2016;7(10):e2441. [DOI] [PMC free article] [PubMed] [Google Scholar]
- 25. Chen Y, Lin J, Chen J, et al. Mfn2 is involved in intervertebral disc degeneration through autophagy modulation. Osteoarthr Cartil. 2020;28(3):363‐374. [DOI] [PubMed] [Google Scholar]
- 26. Hashemzaei M, Entezari Heravi R, Rezaee R, Roohbakhsh A, Karimi G. Regulation of autophagy by some natural products as a potential therapeutic strategy for cardiovascular disorders. Eur J Pharmacol. 2017;802:44‐51. [DOI] [PubMed] [Google Scholar]
- 27. Jiang T, Yu JT, Zhu XC, et al. Acute metformin preconditioning confers neuroprotection against focal cerebral ischaemia by pre‐activation of AMPK‐dependent autophagy. Br J Pharmacol. 2014;171(13):3146‐3157. [DOI] [PMC free article] [PubMed] [Google Scholar]
- 28. Tsujimoto R, Yurube T, Takeoka Y, et al. Involvement of autophagy in the maintenance of rat intervertebral disc homeostasis: an in‐vitro and in‐vivo RNA interference study of Atg5. Osteoarthr Cartil. 2022;30(3):481‐493. [DOI] [PubMed] [Google Scholar]
- 29. Ito M, Yurube T, Kanda Y, et al. Inhibition of autophagy at different stages by ATG5 knockdown and chloroquine supplementation enhances consistent human disc cellular apoptosis and senescence induction rather than extracellular matrix catabolism. Int J Mol Sci. 2021;22(8):3965. [DOI] [PMC free article] [PubMed] [Google Scholar]
- 30. Yurube T, Buchser WJ, Moon HJ, et al. Serum and nutrient deprivation increase autophagic flux in intervertebral disc annulus fibrosus cells: an in vitro experimental study. Eur Spine J. 2019;28(5):993‐1004. [DOI] [PMC free article] [PubMed] [Google Scholar]
- 31. Kritschil R, Zhang Z, Lei C, et al. Effects of suppressing bioavailability of insulin‐like growth factor on age‐associated intervertebral disc degeneration. JOR Spine. 2020;3(4):e1112. [DOI] [PMC free article] [PubMed] [Google Scholar]
- 32. Komatsu M, Waguri S, Ueno T, et al. Impairment of starvation‐induced and constitutive autophagy in Atg7‐deficient mice. J Cell Biol. 2005;169(3):425‐434. [DOI] [PMC free article] [PubMed] [Google Scholar]
- 33. Sakai K, Hiripi L, Glumoff V, et al. Stage‐and tissue‐specific expression of a Col2a1‐Cre fusion gene in transgenic mice. Matrix Biol. 2001;19(8):761‐767. [DOI] [PubMed] [Google Scholar]
- 34. Melgoza IP, Chenna SS, Tessier S, et al. Development of a standardized histopathology scoring system using machine learning algorithms for intervertebral disc degeneration in the mouse model‐an ORS spine section initiative. JOR Spine. 2021;4(2):e1164. [DOI] [PMC free article] [PubMed] [Google Scholar]
- 35. Crowe AR, Yue W. Semi‐quantitative determination of protein expression using immunohistochemistry staining and analysis: an integrated protocol. Bio Protoc. 2019;9(24):e3465. [DOI] [PMC free article] [PubMed] [Google Scholar]
- 36. Nasto LA, Robinson AR, Ngo K, et al. Mitochondrial‐derived reactive oxygen species (ROS) play a causal role in aging‐related intervertebral disc degeneration. J Orthop Res. 2013;31(7):1150‐1157. [DOI] [PMC free article] [PubMed] [Google Scholar]
- 37. Mauvezin C, Neufeld TP. Bafilomycin A1 disrupts autophagic flux by inhibiting both V‐ATPase‐dependent acidification and Ca‐P60A/SERCA‐dependent autophagosome‐lysosome fusion. Autophagy. 2015;11(8):1437‐1438. [DOI] [PMC free article] [PubMed] [Google Scholar]
- 38. Silwal P, Nguyen‐Thai AM, Mohammad HA, et al. Cellular senescence in intervertebral disc aging and degeneration: molecular mechanisms and potential therapeutic opportunities. Biomolecules. 2023;13(4):686. [DOI] [PMC free article] [PubMed] [Google Scholar]
- 39. Xiong J. Atg7 in development and disease: panacea or Pandora's box? Protein Cell. 2015;6(10):722‐734. [DOI] [PMC free article] [PubMed] [Google Scholar]
- 40. Wei Q, Zhang X, Zhou C, Ren Q, Zhang Y. Roles of large aggregating proteoglycans in human intervertebral disc degeneration. Connect Tissue Res. 2019;60(3):209‐218. [DOI] [PubMed] [Google Scholar]
- 41. Yao H, Li J, Liu Z, et al. Ablation of endothelial Atg7 inhibits ischemia‐induced angiogenesis by upregulating Stat1 that suppresses Hif1a expression. Autophagy. 2023;19(5):1491‐1511. [DOI] [PMC free article] [PubMed] [Google Scholar]
- 42. Livingston MJ, Shu S, Fan Y, et al. Tubular cells produce FGF2 via autophagy after acute kidney injury leading to fibroblast activation and renal fibrosis. Autophagy. 2023;19(1):256‐277. [DOI] [PMC free article] [PubMed] [Google Scholar]
- 43. Patrizz AN, Moruno‐Manchon JF, O'Keefe LM, et al. Sex‐specific differences in autophagic responses to experimental ischemic stroke. Cell. 2021;10(7):1825. [DOI] [PMC free article] [PubMed] [Google Scholar]
- 44. Shang D, Wang L, Klionsky DJ, Cheng H, Zhou R. Sex differences in autophagy‐mediated diseases: toward precision medicine. Autophagy. 2021;17(5):1065‐1076. [DOI] [PMC free article] [PubMed] [Google Scholar]
- 45. Congdon EE. Sex differences in autophagy contribute to female vulnerability in Alzheimer's disease. Front Neurosci. 2018;12:372. [DOI] [PMC free article] [PubMed] [Google Scholar]
- 46. Stransky L, Cotter K, Forgac M. The function of V‐ATPases in cancer. Physiol Rev. 2016;96(3):1071‐1091. [DOI] [PMC free article] [PubMed] [Google Scholar]
- 47. Yuan N, Song L, Zhang S, et al. Bafilomycin A1 targets both autophagy and apoptosis pathways in pediatric B‐cell acute lymphoblastic leukemia. Haematologica. 2015;100(3):345‐356. [DOI] [PMC free article] [PubMed] [Google Scholar]
- 48. Rajendran P, Alzahrani AM, Hanieh HN, et al. Autophagy and senescence: a new insight in selected human diseases. J Cell Physiol. 2019;234(12):21485‐21492. [DOI] [PubMed] [Google Scholar]
- 49. Huang S, Xu M, Liu L, et al. Autophagy is involved in the protective effect of p21 on LPS‐induced cardiac dysfunction. Cell Death Dis. 2020;11(7):554. [DOI] [PMC free article] [PubMed] [Google Scholar]
- 50. Patil P, Dong Q, Wang D, et al. Systemic clearance of p16(INK4a)‐positive senescent cells mitigates age‐associated intervertebral disc degeneration. Aging Cell. 2019;18(3):e12927. [DOI] [PMC free article] [PubMed] [Google Scholar]
- 51. Ngo K, Patil P, McGowan SJ, et al. Senescent intervertebral disc cells exhibit perturbed matrix homeostasis phenotype. Mech Ageing Dev. 2017;166:16‐23. [DOI] [PMC free article] [PubMed] [Google Scholar]
- 52. Aoki A, Nakashima A, Kusabiraki T, et al. Trophoblast‐specific conditional Atg7 knockout mice develop gestational hypertension. Am J Pathol. 2018;188(11):2474‐2486. [DOI] [PubMed] [Google Scholar]
- 53. Vuppalapati KK, Bouderlique T, Newton PT, et al. Targeted deletion of autophagy genes Atg5 or Atg7 in the chondrocytes promotes caspase‐dependent cell death and leads to mild growth retardation. J Bone Miner Res. 2015;30(12):2249‐2261. [DOI] [PubMed] [Google Scholar]
Associated Data
This section collects any data citations, data availability statements, or supplementary materials included in this article.
Supplementary Materials
Figure S1. Effects of bafilomycin in NP cells in vitro. (A–C) Western blot analysis to detect the level of p62 and LC3I/II in NP cells treated with bafilomycin (10–100 nM) for 4 h in low‐nutrient medium. Densitometry analysis of p62 normalized to β‐actin (B) and ratio of LC3II to LC3I (C) are shown. (D–F) Expression level of p62 and LC3I/II in NP cells treated with bafilomycin for different time duration as indicated. Densitometry analysis of p62 normalized to β‐actin (E) and ratio of LC3II to LC3I (F) are shown. Data shown are mean ± SD of 3 independent mice. Two‐tailed Student's t test was used to quantify significance. *p < 0.05.
Figure S2. Mouse body weights. Control and KO mice weights at 3, 6, and 12 months were calculated using scale in grams. Data shown are mean ± SEM. Two‐tailed Student's t test was used to quantify significance. *p < 0.05. Control, Atg7 fl/fl ; KO, Col2‐Cre; Atg7 fl/fl .
Figure S3. Confirming IVD phenotype of different control mice. (A) Gene expression levels of selected NP markers ACAN, COL2, COL1, COX2, and MMP13 were quantified by qRT‐PCR. (B) H&E staining of lumbar disc was performed to assess gross morphological changes between potential control mice. Whole disc images were taken at 40×, and NP images were taken at 100×. Data shown are mean ± SD of 3 independent mice. Student's t test was used to quantify significance. **p < 0.01, ACAN, aggrecan; COL2, collagen 2 alpha 1; COL1, collagen 1, COX2, cyclooxygenase 2; MMP13, matrix metalloproteinase 13.
Table 1. Disc histological scores.
Table 2. qRT‐PCR primers used in this study.
Data S1. Supporting Information.