

Abstract
Following acute injury, stromal cells promote tissue regeneration by a diversity of mechanisms. Time-resolved single-cell RNA sequencing of muscle mesenchymal stromal cells (MmSCs) responding to acute injury identified an “early-responder” subtype that spiked on day 1 and expressed a striking array of transcripts encoding immunomodulators. IL-1β, TNFα and oncostatin M each strongly and rapidly induced MmSCs transcribing this immunomodulatory program. Macrophages amplified the program but were not strictly required for its induction. Transfer of the inflammatory MmSC subtype, tagged with a unique surface marker, into healthy hindlimb muscle induced inflammation primarily driven by neutrophils and macrophages. Among the abundant inflammatory transcripts produced by this subtype, Cxcl5 was stroma-specific and highly upregulated with injury. Depletion of this chemokine early after injury revealed a substantial impact on recruitment of neutrophils, a prolongation of inflammation to later times, and an effect on tissue regeneration. mSC subtypes expressing a comparable inflammatory program were found in a mouse model of muscular dystrophy and in several other tissues and pathologies in both mice and humans. These “early-responder” mSCs, already in place, permit rapid and coordinated mobilization and amplification of critical cell collaborators in response to injury.
INTRODUCTION:
Upon acute skeletal-muscle injury, local muscle stem cells (MuSCs) become activated, proliferate, differentiate into myotubes, and eventually fuse to damaged myofibers1–4. Loss of this MuSC response results in complete abrogation of tissue repair5–7. The immune system similarly undergoes a dynamic and orchestrated reaction to acute muscle injury, involving rapid infiltration of neutrophils (NFs), followed by accumulation of inflammatory and subsequently reparative macrophages (MFs)8–17. Later, adaptive immunocytes, such as Foxp3−CD4+ conventional T cells (Tconvs) and Foxp3+CD4+ regulatory T cells (Tregs), accrue at the injury site15,16,18–20. If key elements of this sequence are disrupted, muscle regeneration is compromised9,13,14,17–20.
Muscle mesenchymal stromal cells (MmSCs), which encompass fibro-adipogenic progenitors (FAPs), are another cell type important for effective muscle regeneration21,22. Depending on the stimulus, these cells can differentiate into fibroblasts, adipocytes, chondrocytes or osteocytes23–27. In various chronic muscle diseases, they are associated with pathological fibrosis and fat deposition23–25,28–34. Nonetheless, after acute muscle injury, MmSCs promote proliferation, commitment and differentiation of the stem cells necessary for tissue regeneration7,21,23,30,35–37. MmSCs are also responsible for the transient deposition of extracellular matrix that supports repair38–42. Ablating MmSCs before acute injury results in a dramatic decrease in accumulation of CD45+ cells, suggesting an important immunomodulatory role21,22, but the cellular and molecular underpinnings of this MmSC:immunocyte cross-talk remain largely unknown.
We exploited single-cell RNA sequencing (scRNA-seq) of MmSCs at key time-points after acute injury to identify potential mediators of stromal-cell:immunocyte communication; assessed their function in vivo using monoclonal-antibody(mAb)-driven depletions and MmSC transfers; and extended these findings to a muscular dystrophy model of chronic muscle injury. The resulting data highlight the importance of an acutely induced “inflammatory” MmSC subtype, which we also detected in other mouse and human mSC compartments responding to a diversity of challenges.
RESULTS:
An inflammatory MmSC subtype emerges soon after acute injury
We performed scRNA-seq on MmSCs flow-cytometrically sorted from the hindlimb muscles (tibialis anterior, gastrocnemius and quadriceps) of 6- to 8-wk-old B6.Foxp3-Ires-Gfp (Foxp3GFP) male mice at homeostasis and at 0.5, 1, 3, 7 and 14 days after intramuscular (im) injection of cardiotoxin (CTX) (Extended Data Fig. 1a). A total of 44,231 high-quality cells were sequenced, encompassing an average of 7,372 cells per time-point, with an average depth of 2,174 genes per cell. To obtain an overview of the regeneration time-course, we merged and clustered the data from all time-points. Visualization by Uniform Manifold Approximation and Projection (UMAP) revealed the cells to cluster largely according to the day post-injury (Fig. 1a). As expected, the day 14 (D14) cluster began to overlap with the D0, indicating that the tissue was approaching homeostasis.
Fig. 1: Identification of an inflammatory MmSC subtype after acute skeletal-muscle injury.
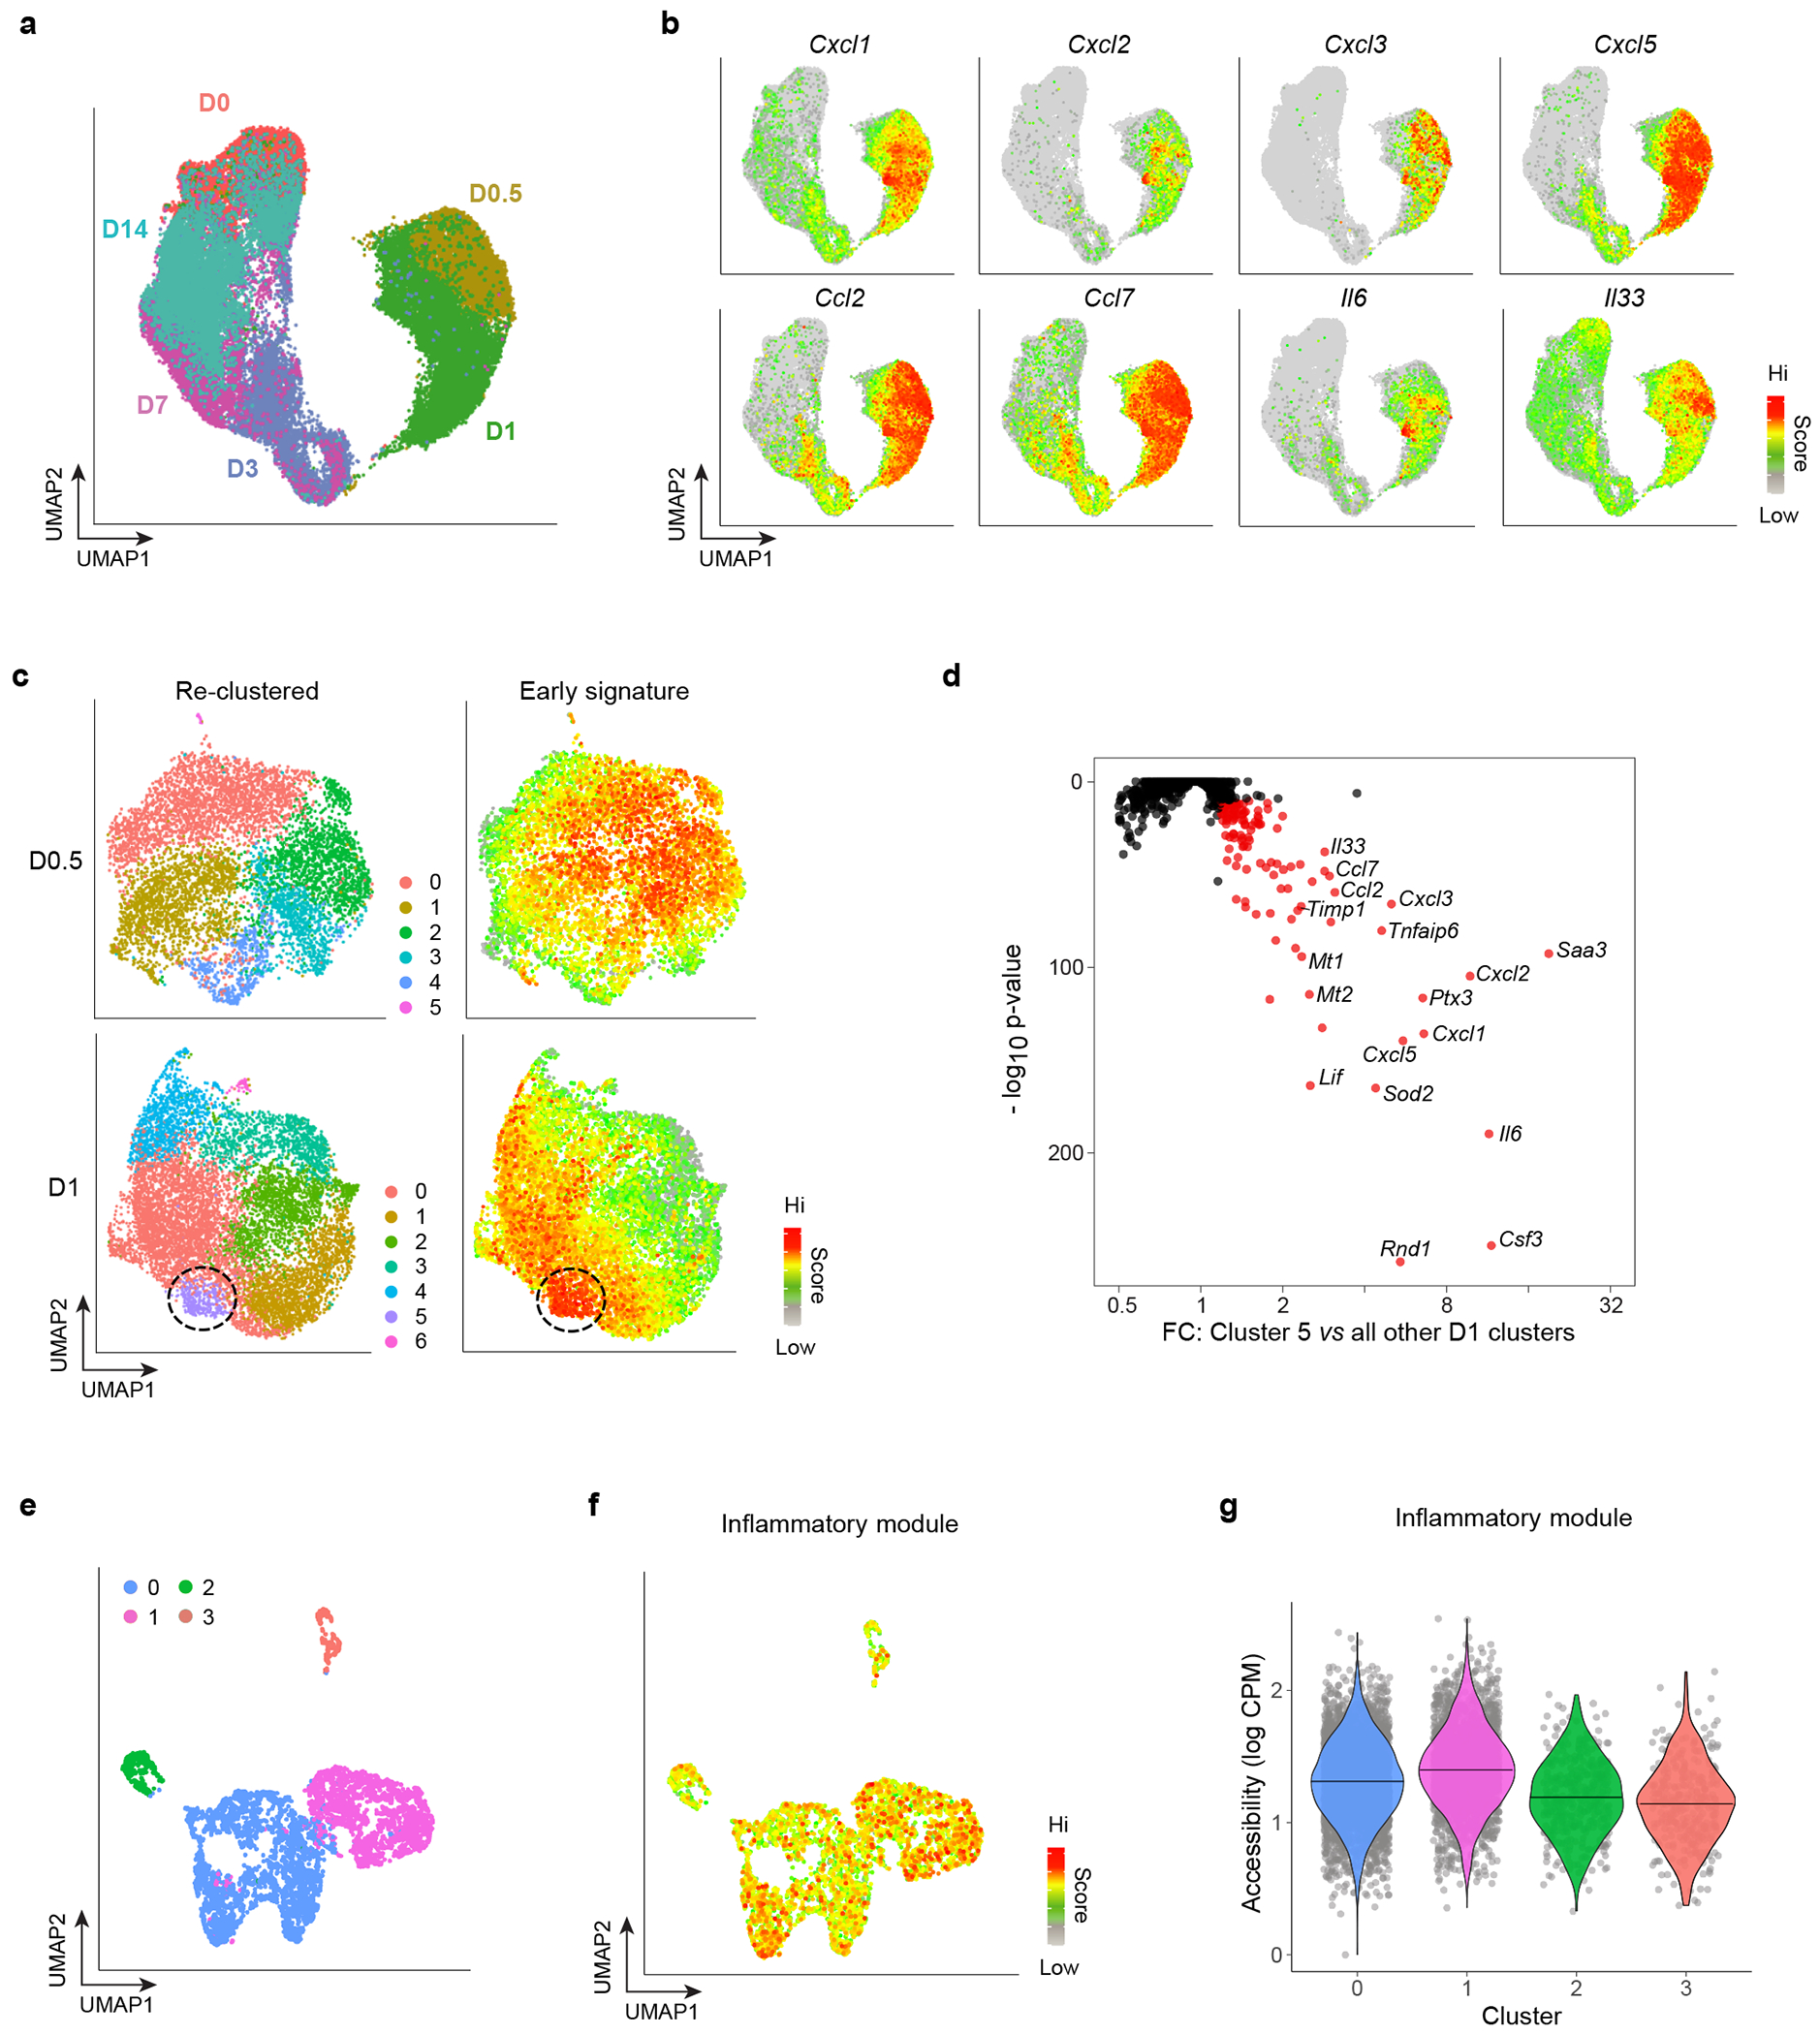
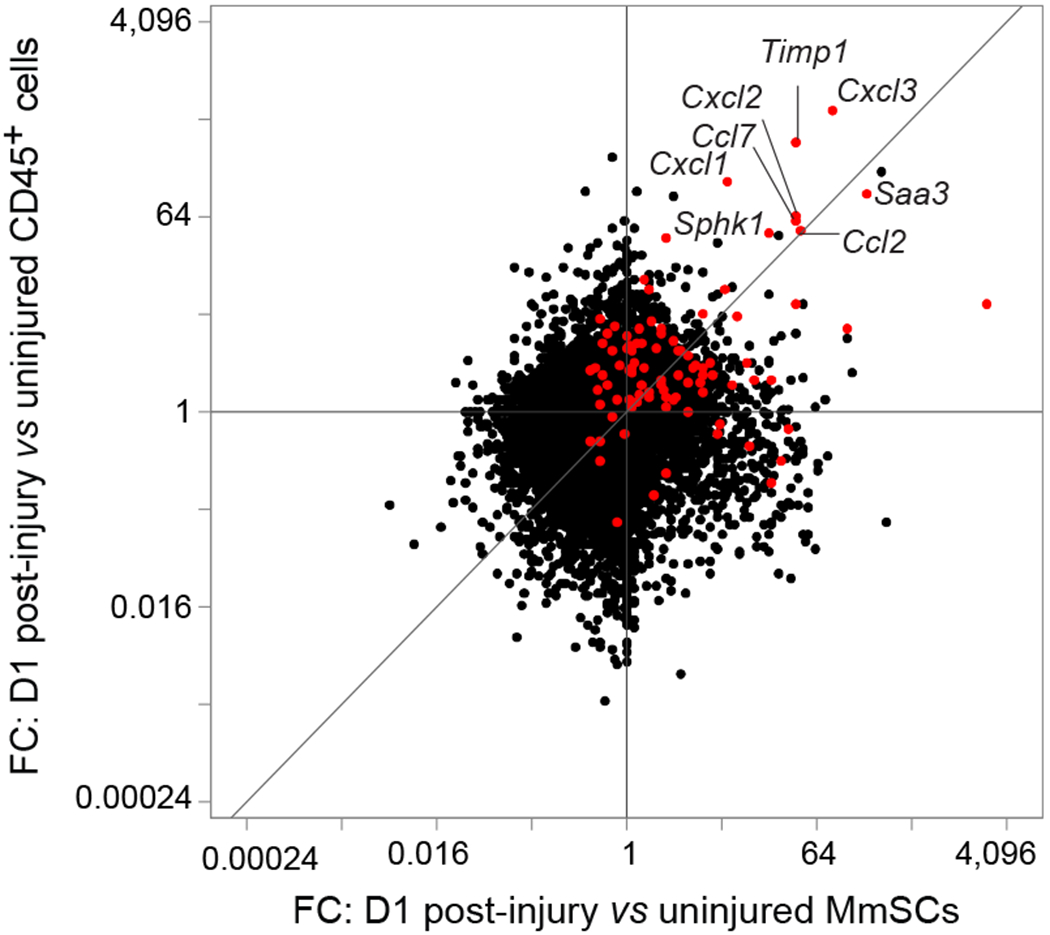
a, UMAP plot of MmSCs from hindlimb muscle of 6- to 8-wk-old male Foxp3GFP mice at homeostasis (D0) and 12 hrs (D0.5), 1 day (D1), 3 days (D3), 7 days (D7) and 14 days (D14) following CTX-induced injury. b, Same UMAP plot as in panel a overlain with expression heatmaps of the indicated transcripts. c, Left: UMAP plot of re-clustered MmSCs from the D0.5 (top) and D1 (bottom) time-points. Right: Superimposition of a signature composed of the top 100 transcripts distinguishing these early time-points from the rest. d, P-value vs fold-change (FC) plot of the transcripts most differentially enriched in D1 cluster 5 compared with the other D1 clusters. e, UMAP of a public scATAC-seq dataset of muscle stromal cells at homeostasis44. f, Same UMAP plot as in panel e overlain with a signature score of the accessibility at loci encoding the top 100 differentially expressed transcripts from our D1 cluster 5. g, Violin plot of the signature score in panel f across clusters.
The D0.5 and D1 clusters cleanly separated from the cells of all the other time-points. In assessing which transcripts drove this separation, we found by visual inspection an enrichment for those encoding inflammatory mediators, in particular cytokines and chemokines (Fig. 1b). We then individually re-clustered the two earliest time-points (D0.5 and D1) and super-imposed a signature consisting of the top 100 transcripts distinguishing these time-points from the rest (Fig. 1c). There was moderate dispersion at D0.5, but by D1, a distinct subpopulation highly enriched for this signature had emerged. Differential transcript analysis between this cluster (cluster 5, purple) and the rest of them revealed D1 cluster 5 cells to transcribe even more genes encoding inflammatory mediators (Fig. 1d, Extended Data Fig. 1b). Transcription of these genes was particularly low in clusters 2, 3, 4 and 6, which expressed markers of the previously described Col15a1+ and Pi16+ steady-state mSC populations, proliferating mSCs and tenocytes, respectively (Extended Data Fig. 1b–d)43,44.
Next, we addressed whether the bulk of MmSCs or just a specialized subtype had the potential to take on this inflammatory flavor. Scott et al. reported scRNA-seq and scATAC-seq data from muscle stromal cells at homeostasis44. Employing Hic1 as a stromal-cell marker, they identified four main clusters: two fibro-adipogenic, one tenogenic and one pericytic. Recapitulating these four clusters (Fig. 1e), we looked for increased accessibility at the loci encoding the top 100 transcripts differentially expressed by cluster 5 (“inflammatory signature”) (Extended Data Table 1) in comparison with random, accessibility-matched loci. There was no strong enrichment of the inflammatory module amongst the various clusters (Fig. 1f, g). Similarly, superimposing on our dataset the transcripts encoded by differentially accessible loci in the four stromal subtypes from Scott et al. revealed no obvious correspondence between inflammatory cluster 5 and the steady-state stromal-cell subtypes (Extended Data Fig. 1e).
The inflammatory subtype is induced by a cytokine triplet
Pathway analyses on the 100-gene inflammatory signature revealed four major signaling pathways: IL-1, TNFα, Oncostatin M (OSM) and IL-17 (Fig. 2a). We initially followed an in vivo gain-of-function approach to weigh the importance of these pathways. Just to set the parameters of the in vivo conditions, we intraperitoneally (ip) co-injected all four cytokines into uninjured mice, and sorted MmSCs from the hindlimb muscles 2, 4 and 8 hrs later for population-level RNA-seq. There was a robust increase in the transcripts encoding many key inflammatory molecules, 2 hrs post-injection being the optimal time-point to capture the inflammatory induction (Extended Data Fig. 2a). We then repeated the experiment but injected the cytokines individually or as pairs. Volcano plots of each cytokine compared with the phosphate-buffered saline (PBS) control revealed that IL-1β, TNFα and OSM, but not IL-17A, strongly induced the inflammatory signature, IL-1β provoking the strongest response (Fig. 2b; note the differing x-axes). Hierarchical clustering of the top 25 transcripts from the inflammatory signature across all conditions demonstrated that IL-1β alone and IL-1β plus OSM induced a set of transcripts most similar to that induced by the four cytokines together (Fig. 2c). Some discrete gene modules were also observed: one wherein transcripts were most highly expressed in the IL-1β group, and two in which transcripts were more highly expressed by pairing OSM with IL-1β over IL-1β alone. Small gene modules also emerged among the other conditions. Thus, IL-1β, TNFα and OSM induced a complex signaling network within MmSCs, invoking additive, discordant or redundant responses.
Fig. 2: IL-1β, TNFα and OSM produced by myeloid cells strongly induce the inflammatory MmSC subtype.
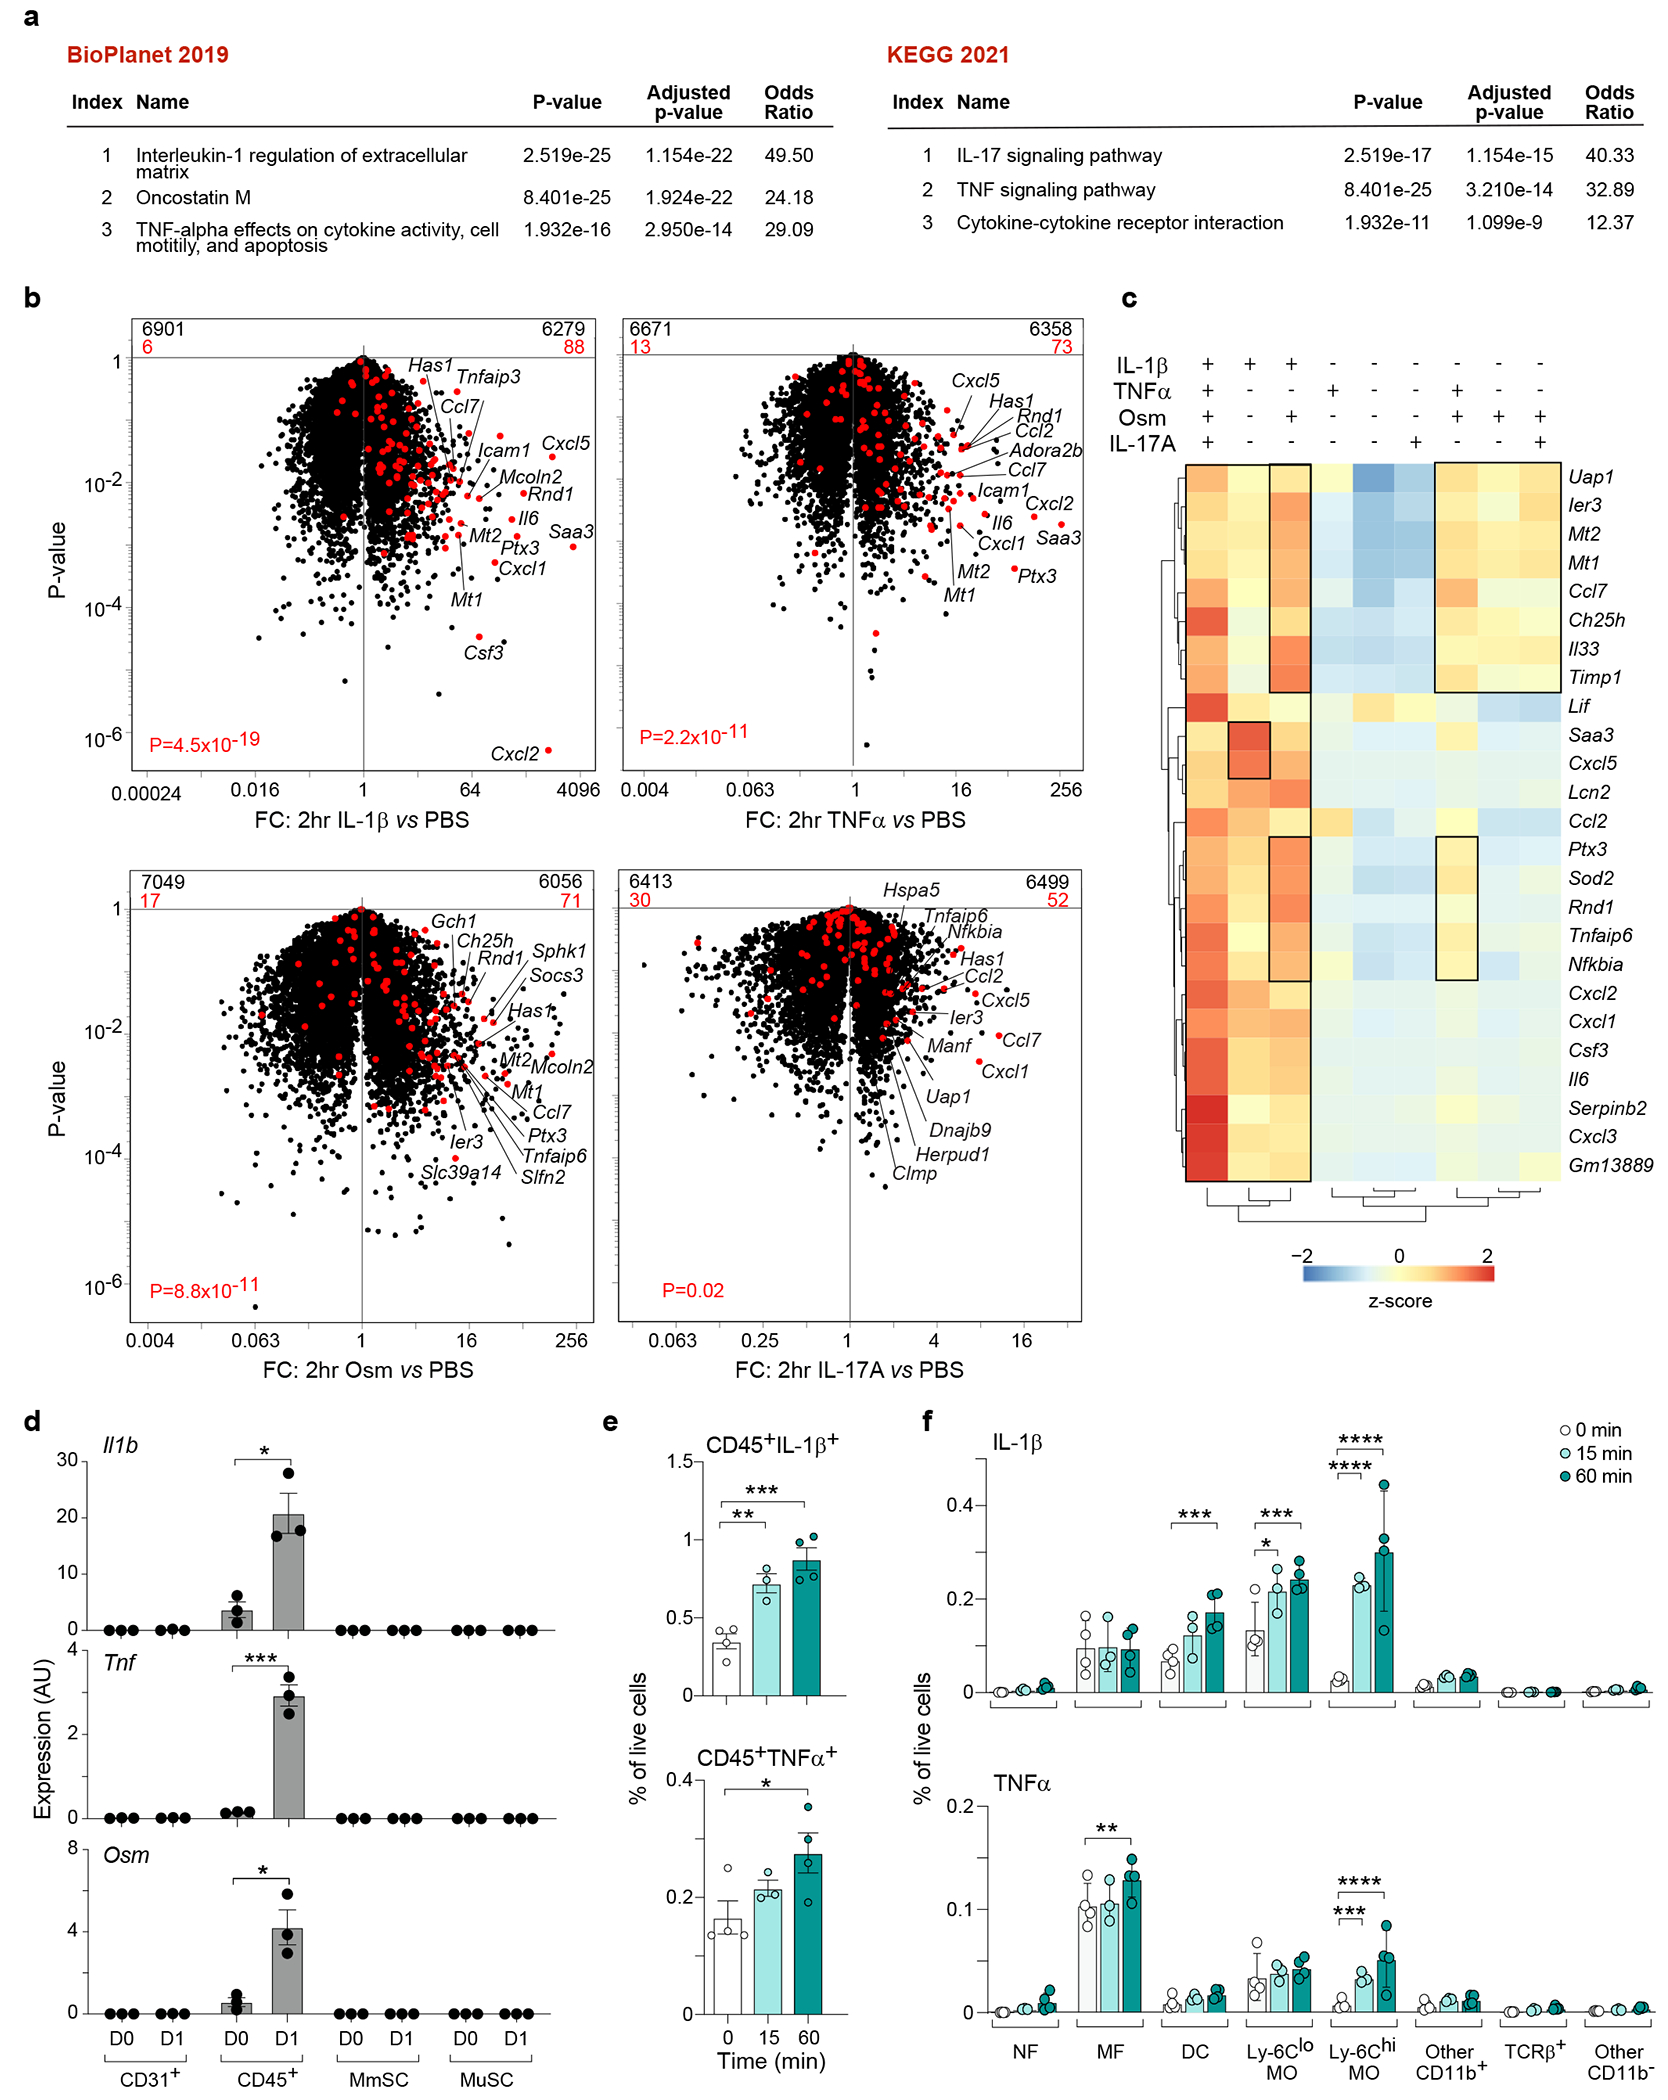
a, Pathway analyses of the 100-gene inflammatory signature. b, Volcano-plot comparisons of MmSCs after injections of IL-1β vs PBS (top, left), TNFα vs PBS (top, right), OSM vs PBS (bottom, left) or IL-17A vs PBS (bottom, right). The 100-gene inflammatory signature is shown in red, with the numbers at the top of each plot indicating numbers of up- and down-regulated transcripts (in comparison with total transcript numbers in black). c, Hierarchically clustered heatmap of the top 25 transcripts in the inflammatory signature across the cytokine augmentation conditions. d, Expression of inflammatory-MmSC-inducing transcripts across the major skeletal-muscle-cell compartments at homeostasis (D0) and on D1 after CTX-induced injury. Cytofluorimetrically sorted cells were subject to RNA-seq (n = 3 mice per time-point). e,f, Cytofluorimetric analysis of IL-1β and TNFα levels in CD45+ cells in uninjured hindlimb muscle and at 15 and 60 min post-CTX-injection (n = 4 mice per time-point). Note: one sample was removed from the 15 min group, as it was 3 SDs from the mean. (e) Total CD45+IL-1β+ (top) and CD45+TNFα+ (bottom) cells. (f) Distribution of IL-1β+ (top) and TNFα+ (bottom) cells. Cytofluorimetric data were pooled from two independent experiments. Data are from 7- to 9-wk-old B6 male mice. ip, intraperitoneal; PBS, phosphate-buffered saline; MmSC, muscle mesenchymal stromal cell; MuSC, muscle stem cell; AU, arbitrary units; NF, neutrophil; MF, macrophage; DC, dendritic cell; MO, monocyte; FC, fold-change. Plots with error bars displayed as mean +/− standard error of the mean (SEM). *P < 0.05, **P < 0.01, ***P < 0.001, ****P < 0.0001. One-sided Fisher’s exact test with and without correction by the Benjamini-Hochberg method (panel a), Chi-squared test (panel b), two-tailed unpaired t-test (panel d), one-way ANOVA (panel e), and two-way ANOVA with Dunnett’s multiple comparisons test (panel f).
Population-level RNA-seq on the four major muscle-cell compartments at homeostasis and on D1 after CTX-induced injury revealed that the CD45+ compartment was the sole expressor of transcripts encoding these cytokines (Fig. 2d). To examine their expression amongst hematopoietic-lineage cells, we took advantage of a scRNA-seq dataset from Oprescu et al. depicting whole hindlimb muscle at various time-points after CTX-induced injury16. Re-analysis of the earliest time-point, D0.5, demonstrated that MFs, monocytes (MOs) and NFs expressed the most Il1b, Tnf and Osm transcripts (Extended Data Fig. 2b). (There was only low expression of the three cytokines in muscle cells, themselves.) We also employed flow cytometry to quantify IL-1β and TNFα levels in uninjured hindlimb muscle and at 15 and 60 min post-CTX (Fig. 2e, Extended Data Fig. 2c). (There are no commercially available antibodies suitable for cytofluorimetric quantification of OSM levels.) MOs, followed by dendritic cells, were the most abundant and rapidly accumulating IL-1β-producing populations (Fig. 2f). (Here and subsequently, we use fraction of live cells as a surrogate for cell numbers to correct for extraction efficiencies, which can be variable with such tissue preps.) MFs and MOs were the most abundant TNFα+ cells (Fig. 2f).
Myeloid cells are dispensable for the inflammatory subtype
Myeloid cells, primarily NFs followed by MFs, are usually the earliest arrivals in damaged tissues, and their role in activating stromal cells has been described45,46. Thus, we addressed whether induction of the inflammatory MmSC subtype was strictly dependent on soluble factors derived from myeloid cells.
Some initial observations argued for a different scenario. Firstly, loss of IL-1β alone did not substantially alter induction of the inflammatory MmSC program (Extended Data Fig. 3a); moreover, this module was only mildly decreased by Ab-mediated co-neutralization of IL-1β, TNFα and OSM (Extended Data Fig. 3b).
To formally address the contribution of NFs and MFs in MmSC acquisition of the inflammatory program, we depleted NFs with anti-Ly-6G mAb or MFs by diphtheria toxin (DT) administration to LysmCre X Csf1rLsL-DTR mice47, and assessed the inflammatory signature in MmSCs 12 hr after CTX-induced injury (to avoid secondary effects) by population-level RNA-seq. PCA analysis showed that the injury status contributed the largest principal component, followed by the effect of MF depletion (Fig. 3a); NF depletion had no impact on the MmSC inflammatory program (Fig. 3b). MF-depleted mice still upregulated the inflammatory module, but to a lower degree than did their MF-containing counterparts, as evidenced by the off-diagonal cloud on the fold-change/fold-change plot of Fig. 3c. Transcripts encoding some components of the inflammatory program were reduced in the absence of MFs (eg Il6 and Cxcl2) while others were not affected (eg Cxcl5 and Cxcl3) (Fig. 3d). We also calculated a signature score for the inflammatory gene-set, and observed only a mild attenuation of this program after MF depletion (Fig 3e), suggesting that MFs might amplify the inflammatory program, but were dispensable for MmSC activation, at least at this early time-point post-injury.
Fig. 3: Induction of the inflammatory MmSC subtype is not strictly dependent on myeloid cells.
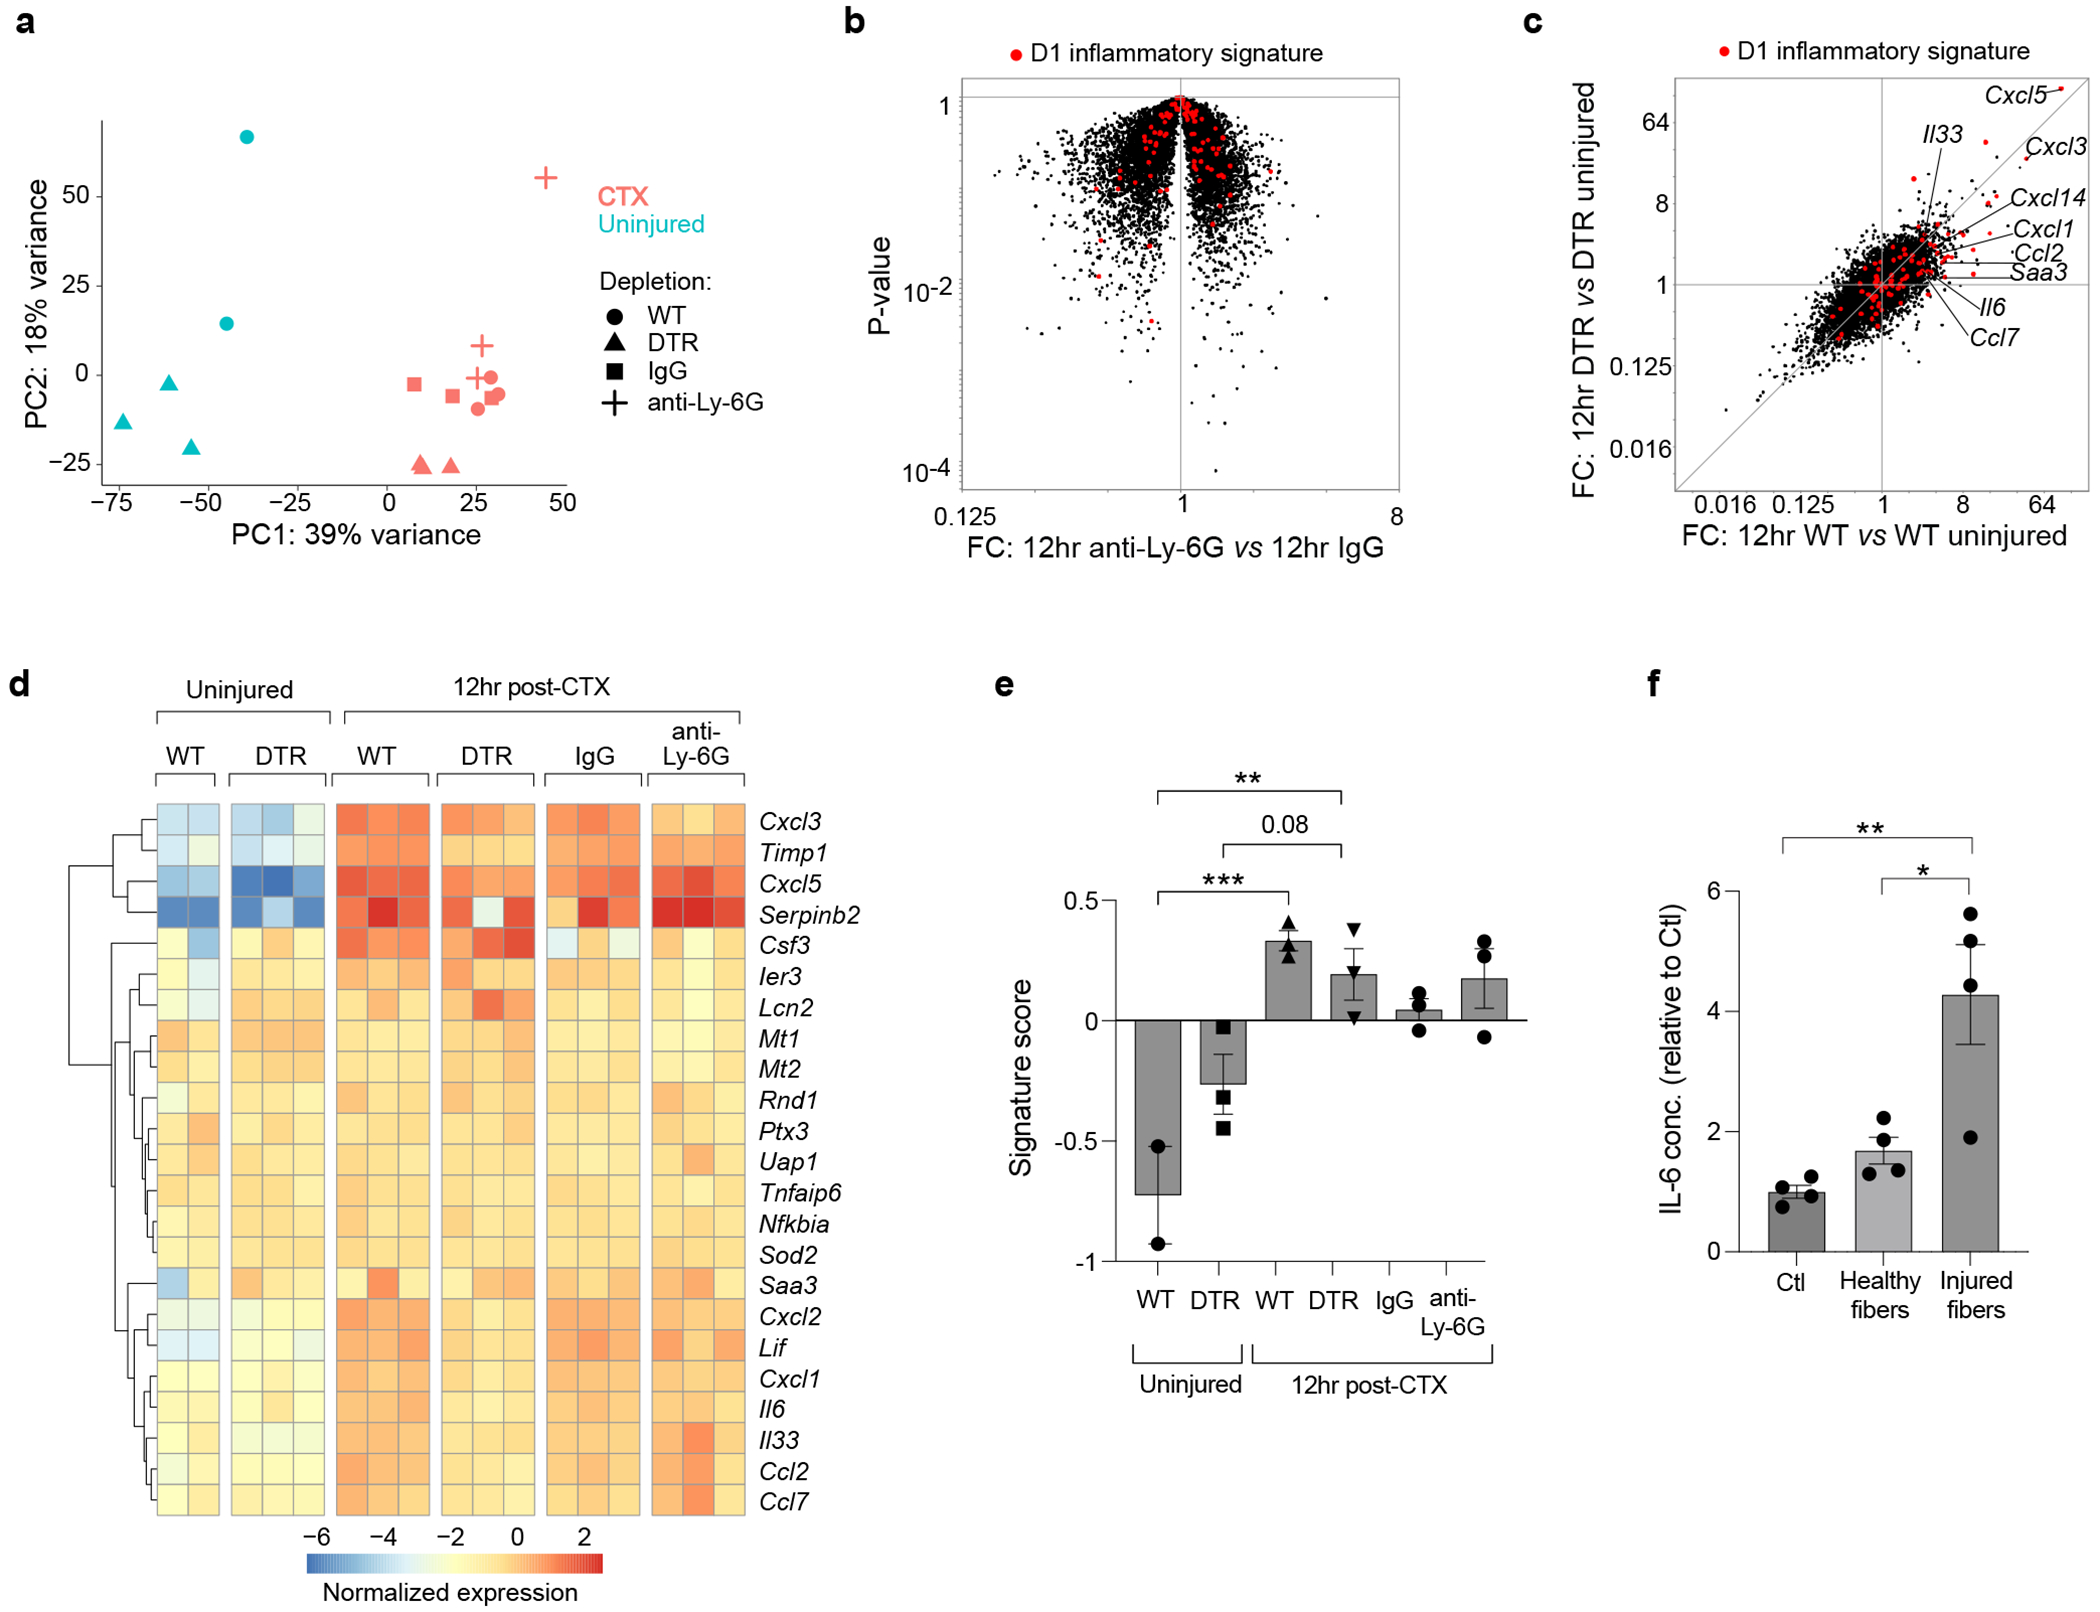
a-e, RNA-seq analysis of cytofluorimetrically sorted MmSCs from uninjured and CTX-injured mice (n = 2-3 mice per group). (a) PCA analysis. (b) Volcano-plot comparisons of MmSCs from B6 male mice treated with anti-Ly6G vs IgG isotype control. The 100-gene inflammatory signature is shown in red. (c) Transcriptomic fold-change/fold-change (FC) plot of MmSCs from CTX-injured vs uninjured Lysmwt X Csf1rLsL-DTR (WT; macrophage-containing) mice (x-axis) vis-a-vis CTX-injured vs uninjured LysmCre X Csf1rLsL-DTR (DTR; macrophage-depleted) mice (y-axis). The 100-gene inflammatory signature is shown in red. (d) Hierarchically clustered heatmap of the top 25 transcripts in the inflammatory signature across the different conditions. (e) Signature score of the 100-gene inflammatory MmSC gene set. Scores calculated as per materials and methods. f, Freshly-isolated MmSCs were cultured alone (Ctl) or co-cultured with muscle fibers that were pre-treated either with vehicle (healthy fibers) or CTX (injured fibers), and IL-6 levels in the culture supernatants were determined by ELISA (2 independent experiments). Data are from 7- to 9-wk-old male mice. DTR, diphtheria toxin receptor. Plots with error bars displayed as mean +/− SEM. *P < 0.05, **P < 0.01, ***P < 0.001. Chi-squared test (panel b) and one-way ANOVA with Tukey’s multiple comparisons test (panels e and f).
These data raised the possibility that MmSCs could sense muscle damage independently of myeloid-cell input. To address this possibility, we sorted MmSCs from uninjured mice and co-cultured them with single muscle fibers pre-treated with either vehicle or CTX. As a measure of MmSC activation, we quantified IL-6 levels in the supernatant after 24 hours. CTX-injured, but not healthy, muscle fibers induced a higher level of IL-6 in the supernatant (Fig. 3f). Thus, parenchymal damage and, potentially, signals from other non-myeloid cells could trigger induction of the MmSC inflammatory subtype, a process further amplified by multiple cytokines derived from myeloid cells acting in a redundant manner.
Isolated inflammatory MmSCs induce inflammation
We then attempted to identify cell-surface markers that would permit cytofluorometric discrimination of inflammatory MmSCs from other MmSCs. Among the transcripts enriched in the inflammatory subtype, there were only a few that encoded surface markers, and these proved useless for cytofluorimetric distinction. Instead, we generated a new line of reporter mice. According to our scRNA-seq dataset, Il6 expression was highly specific to the inflammatory subtype (Extended Data Fig. 4a). Re-analysis of the scRNA-seq dataset from Oprescu et al. confirmed that Il6 was induced in stromal cells only following injury (Extended Data Fig. 4b). Recently, Heink et al. developed an IL-6 reporter/depleter mouse line (Il6tm3307(Cerulean-P2A-CD90.1)Arte, abbreviated as Il6RD), which, when crossed with a Cre line, allows for the coupling of Thy1.1 and Il6 expression in a designated population of cells48. The Il6RD line is carried on a Thy1.2+ genetic background, making Il6-expressing cells the only ones that are Thy1.1+. We crossed the Il6RD line with the C57BL/6-Tg(Pdgfra-Cre)1Clc/J (Pdgfra-Cre) line, and profiled Thy1.1 expression across the major muscle-cell compartments at homeostasis and 12 hrs after CTX injury, the first time-point at which we had identified inflammatory transcripts in MmSCs by scRNA-seq. There was minimal Thy1.1 expression at steady-state, consistent with low baseline Il6 expression in the muscle (Extended Data Fig. 4b). A Thy1.1+ MmSC population emerged at 12 hrs, while there was low signal across the other compartments (Fig. 4a). To confirm that Thy1.1+ MmSCs were enriched in inflammatory transcripts, we isolated Thy1.1+ and Thy1.1− MmSCs 12 hrs following CTX injury and performed population-level RNA-seq. Indeed, Thy1.1+ cells were significantly enriched in the inflammatory MmSC program (Fig. 4b).
Fig. 4: Transfer of inflammatory MmSCs can induce inflammation.
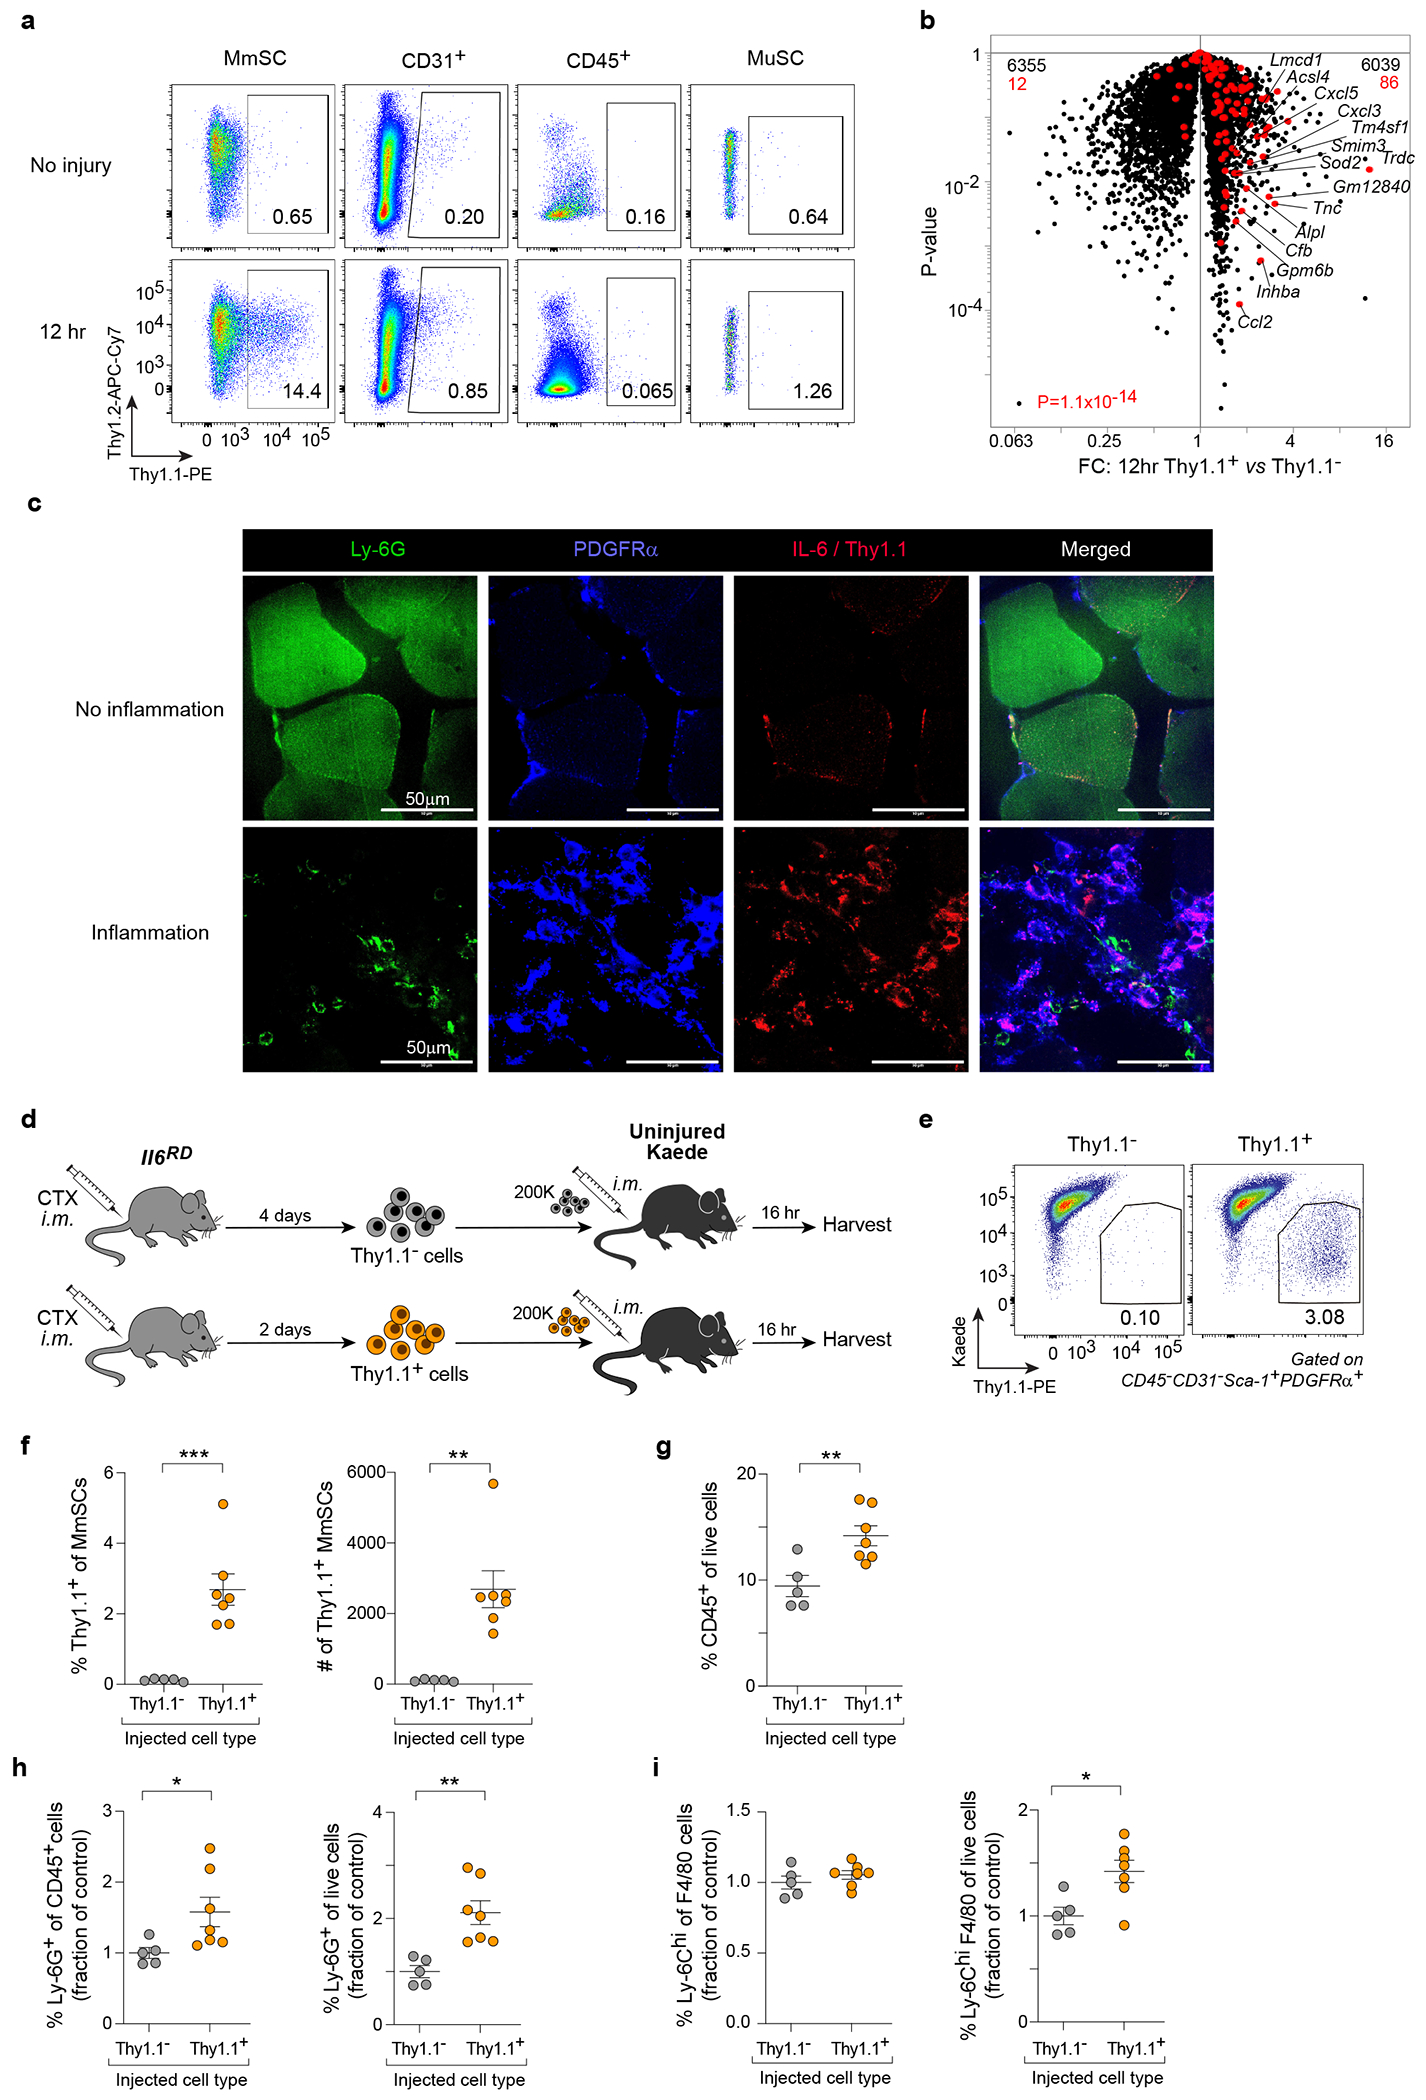
a, Cytofluorometric quantification of Thy1.1 expression across the major skeletal-muscle-cell compartments in Il6RD x Pdgfra-Cre mice at homeostasis and 12 hrs following CTX-induced injury. b, Volcano-plot comparison of transcripts expressed by Thy1.1+ and Thy1.1− MmSCs 12 hrs after CTX injection (n = 3). The 100-gene inflammatory signature is shown in red; numbers at the top indicate up- and down-regulated transcripts (in comparison with total transcript numbers in black). c, Immunofluorescence imaging of the indicated markers in muscle sections of Il6RD x Pdgfra-Cre mice 2 days following CTX-induced injury (60X magnification). Upper panels: representative images of areas with no NF infiltration (no inflammation). Lower panels: representative images of areas with high NF infiltration (inflammation). Experiment repeated twice with similar results. d, Schematic of the adoptive-transfer design used to generate the data in (panels e-i). e-i, Cytofluorometric profiling of cells from hindlimb muscles of recipient mice following Thy1.1+ (n = 7) vs Thy1.1− (n = 5) MmSC transfer. (e) Representative flow plots; (f) summary quantification of Thy1.1+ cells; (g) quantification of CD45+ cells, (h) NFs and (i) Ly-6Chi MFs. Transfer data were pooled from two independent experiments. Each data point represents an individual mouse within a group. All data are from 7- to 9-wk-old male mice. FC, fold-change; CTX, cardiotoxin; im, intramuscular; other abbreviations as per Fig 2. Plots with error bars displayed as mean +/− SEM. *P < 0.05, **P < 0.01, ***P < 0.001 by a two-tailed unpaired t-test except for panel b, in which a Chi-squared test was performed.
We first used this system to investigate the spatial distribution of inflammatory MmSCs. Confocal imaging of injured muscles from Il6RD x Pdgfra-Cre mice showed that Thy1.1+PDGFRα+ MmSCs localized to areas of high NF infiltration and muscle-fiber damage (Fig. 4c).
To determine whether isolated inflammatory MmSCs could induce inflammation in muscle tissue, we prepared Thy1.1+ and Thy1.1− MmSCs from hindlimb muscles two and four days after CTX injury, respectively, and im-injected them into uninjured hindlimb muscles (Fig. 4d). Thy1.1+ MmSCs were isolated on D2 because the MmSC population expands with injury, allowing for more cells to be collected; Thy1.1− MmSCs were isolated on D4 because some of these cells could convert to Thy1.1+ MmSCs during the earliest stages of muscle injury, while on D4 their inflammatory potential was minimal. We transferred the MmSCs into B6.Cg-Tg(CAG-tdKaede)15Utr (Kaede) mice, a line in which all cells express Kaede, a green-fluorescent reporter. By 16 hrs after transfer, Kaede-negative donor cells were readily identified in hindlimb muscle of the recipient mice (Fig. 4e, f). Mice harboring Thy1.1+ cells showed a significant increase in CD45+ hematopoietic-lineage cells vis-à-vis those receiving Thy1.1− cells (Fig. 4g). Within the CD45+ compartment, NFs and Ly-6Chi MFs, key innate immunocytes in the early response to muscle injury, were specifically increased in mice that received Thy1.1+ MmSCs (Fig. 4h, i).
CXCL5 non-redundantly promotes the influx of NFs
As Thy1.1+ MmSCs proved resistant to conventional (mAb-driven) depletions, we took up a candidate mediator approach, favoring transcripts that: 1) were part of the inflammatory MmSC signature; 2) were enriched in stroma relative to the other major muscle-cell compartments; and 3) were induced by injury. Cxcl5 emerged as the strongest candidate as it was one of the most differentially expressed transcripts in the inflammatory MmSC subtype, was strongly enriched in the stroma, and was the most highly induced MmSC transcript upon injury, with a fold-change of > 2,500 (Fig. 5a–c, Extended Data Fig. 4c). Re-analysis of the scRNA-seq dataset from Oprescu et al. confirmed that Cxcl5 transcripts were not made at homeostasis, but upon injury were highly enriched in stromal cells at half a day and 2 days following injury (Extended Data Fig. 4d). CXCL5 is primarily known as a chemoattractant for NFs and can regulate the levels of other chemokines, such as CXCL1 and CXCL249. During acute skeletal-muscle injury, NFs at early stages of injury are important for removing cellular debris to permit effective tissue repair9,50,51. Furthermore, following myocardial infarction, NFs in the heart actively secrete factors that help polarize MFs to a pro-reparative phenotype52. To investigate the role of CXCL5 during skeletal-muscle injury, we administered anti-CXCL5 mAb before and coincident with im injection of CTX. At 24 hrs after injury, there was no change in total CD45+ hematopoietic-lineage cells. However, there was a decrease in the percent of NFs, suggesting that CXCL5 was a non-redundant NF chemoattractant during muscle injury (Fig. 5d, e). While there was no evident change in MF numbers, there were, surprisingly, significant increases in the representation of adaptative immunocyte populations such as T and B cells (Fig. 5f–h). This increase was recapitulated by depleting NFs with anti-Ly-6G mAb, also administered before and coincident with im injection of CTX (Fig. 5j, l, m). Total CD45+ hematopoietic-lineage cell numbers were unaffected; however, MF numbers were elevated in the treatment group (Fig. 5i, k).
Fig. 5: CXCL5 is a stroma-specific chemokine that promotes NF influx following CTX-induced injury.
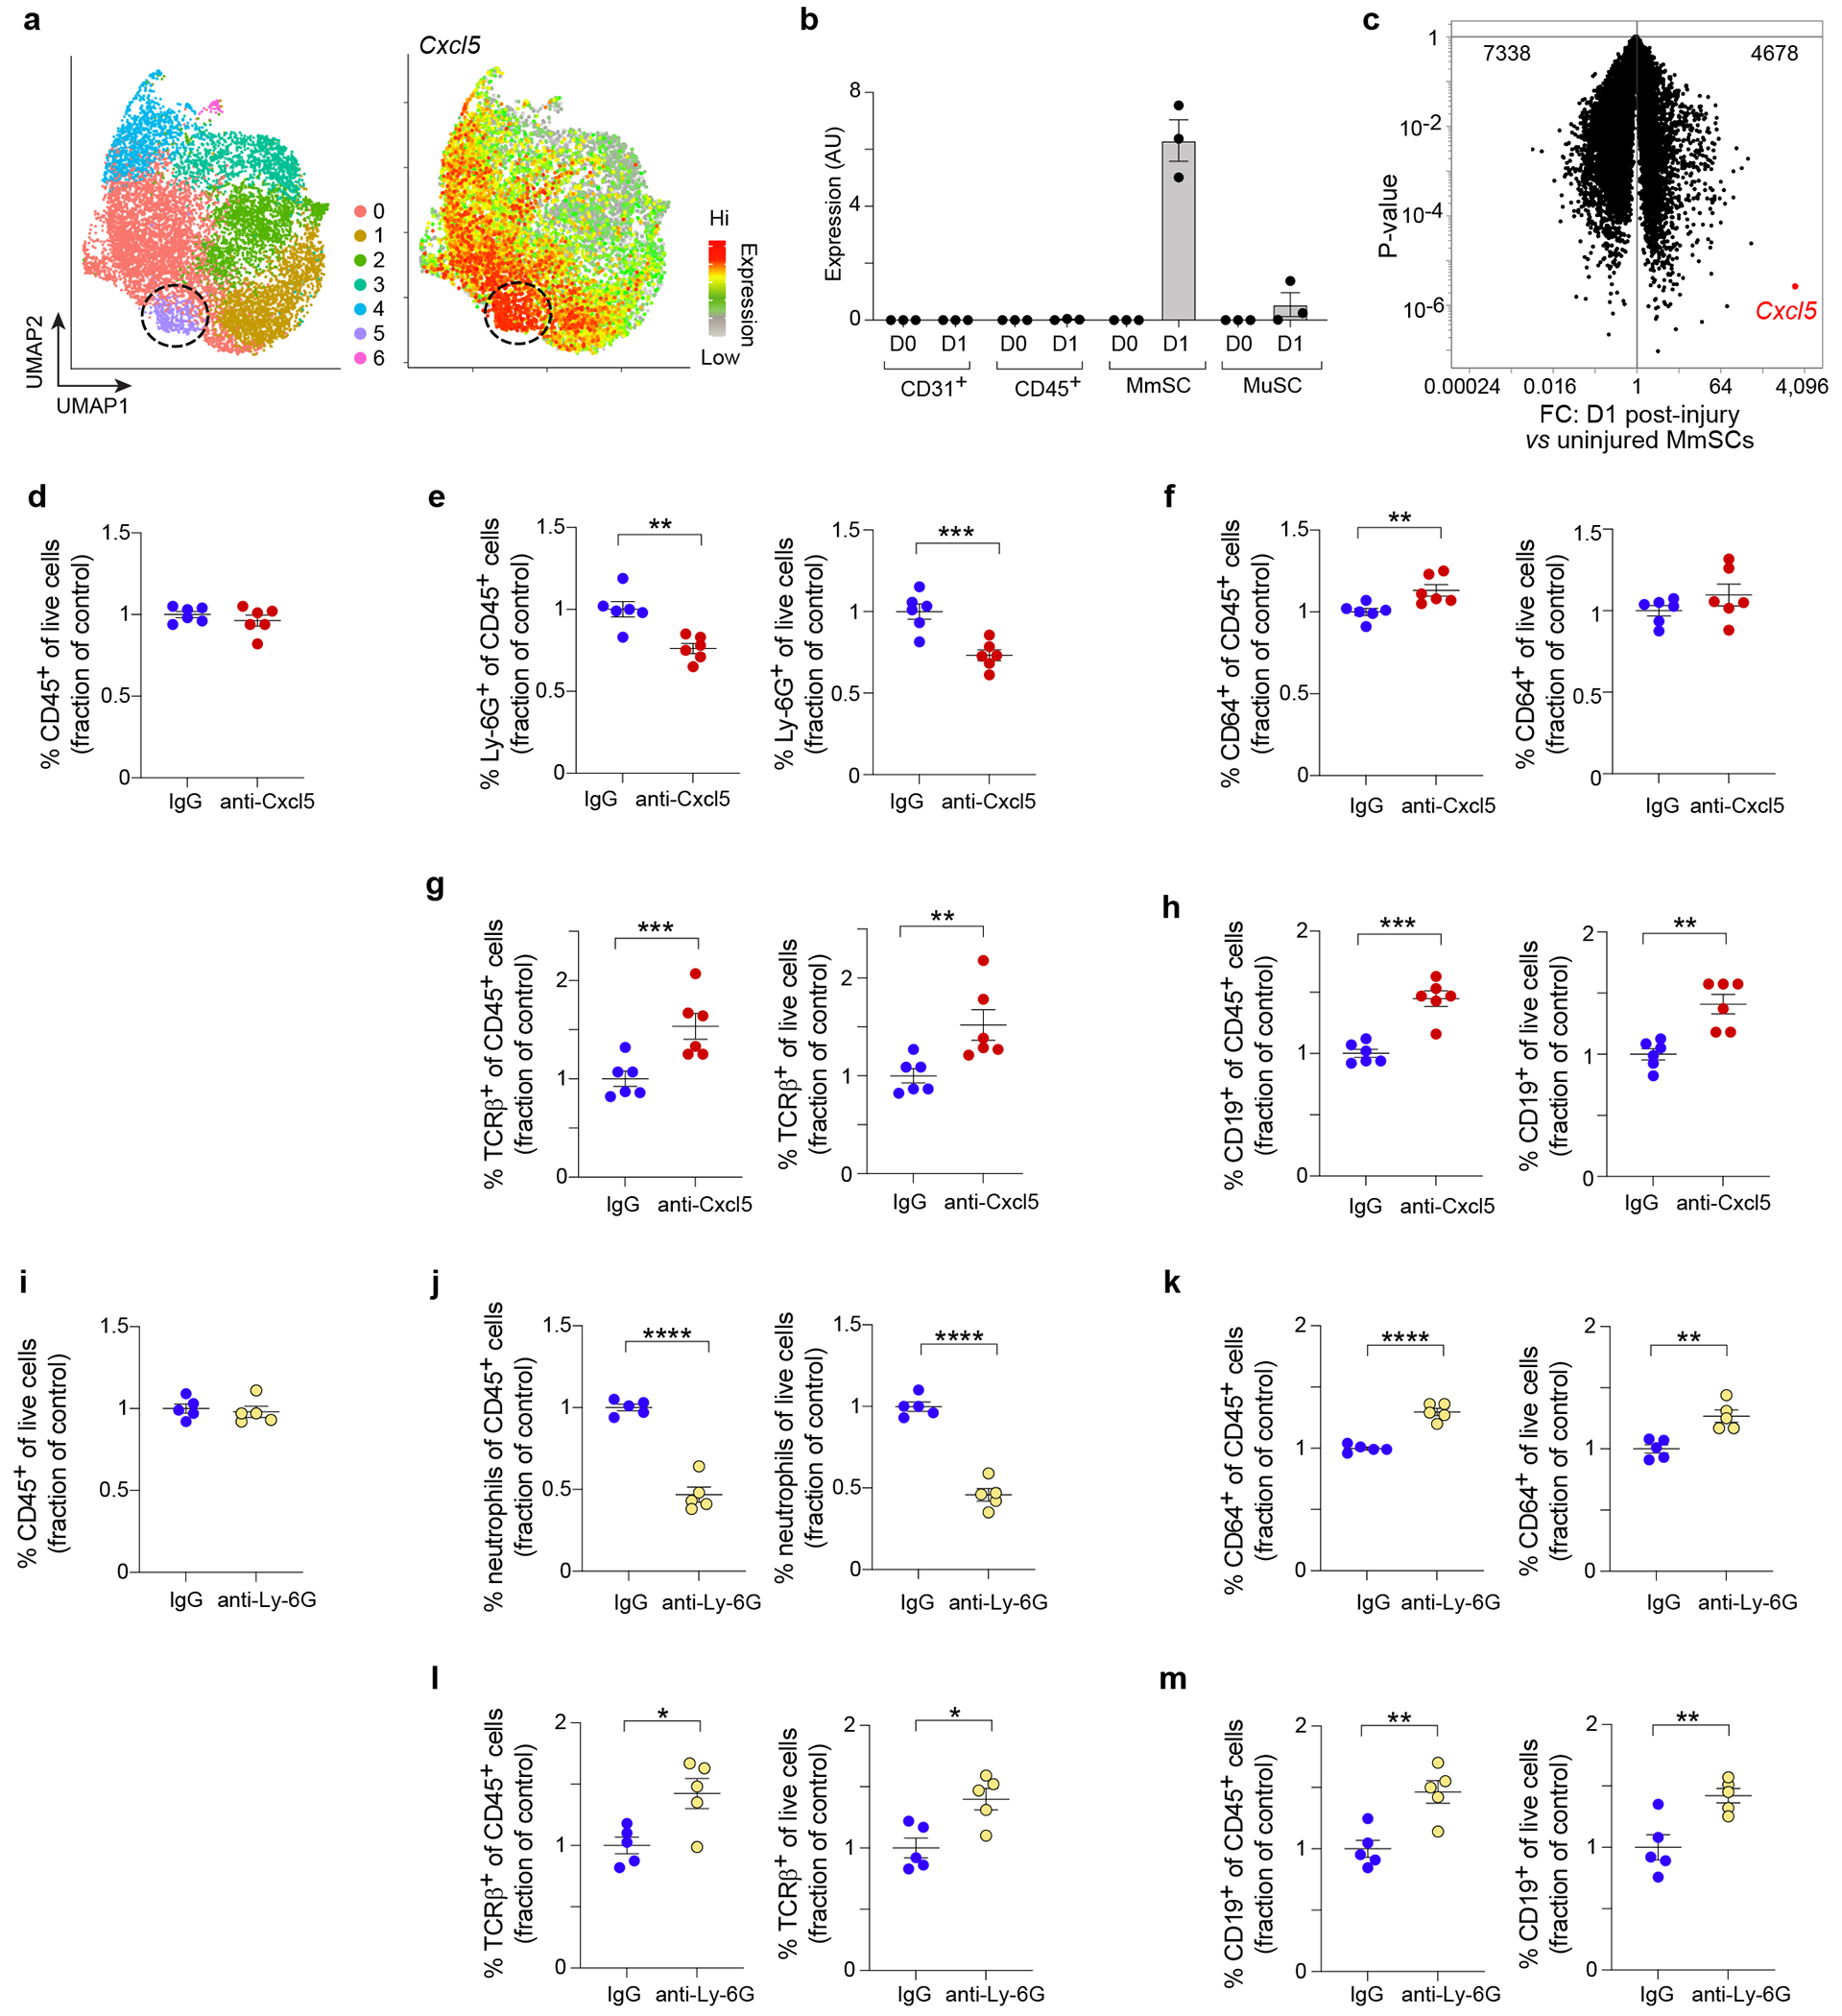
a, UMAP plot of MmSCs from D1 following CTX-induced injury (left) overlain with a heatmap of Cxcl5 expression (right). b, Cxcl5 expression across the major skeletal-muscle-cell compartments at homeostasis (D0) and on D1 after CTX-induced injury (n = 3 mice per time-point). c, Volcano-plot comparison of D0 vs D1 MmSCs (n = 3 mice per time-point). Cxcl5 is highlighted in red. Numbers at the top indicate total genes up- and down-regulated in response to injury. d-h, Anti-CXCL5 mAb or IgG was administered 12 hrs before and coincident with CTX injection, and cells from hindlimb muscles were cytofluorimetrically profiled one day after injury (n = 6 per group). Quantification of (d) total CD45+ cells, (e) NFs, (f) MFs, (g) αβ T cells and (h) B cells. i-m, Anti-Ly-6G mAb or IgG was administered 2 days, 1 day and coincident with CTX injection, and cells from hindlimb muscles were cytofluorimetrically profiled one day after injury (n = 5 per group). Quantification of (i) total CD45+ cells, (j) NFs, (k) MFs, (l) αβ T cells and (m) B cells. Since the depleting antibody covered the Ly-6G epitope, NFs were defined as CD45+CD11b+CD64−CD11c−Ly-6C−GR-1+. Ab-mediated depletion data were pooled from two independent experiments. Besides panels a and c, each data point represents an individual mouse within a group. All, except the scRNA-seq, data derived from 7- to 9-wk-old B6 male mice. Abbreviations as per Figs 3 and 4. Plots with error bars displayed as mean +/− SEM. *P < 0.05, **P < 0.01, ***P < 0.001, ****P < 0.0001 by a two-tailed unpaired t-test. Data were normalized to the IgG group as repeated experiments had different control setpoints.
Early loss of CXCL5 prolongs inflammation and inhibits repair
We neutralized CXCL5 during the earliest stage of recovery after CTX-induced injury (D-0.5, D0, D1 and D2), and analyzed hindlimb muscle at D7 by flow cytometry, whole-tissue RNA-seq and histology. There was no difference in the accumulation of CD45+ hematopoietic-lineage cells, but NFs and pro-inflammatory Ly-6Chi MFs were elevated in the anti-CXCL5-treated, compared with the IgG-treated, group (Fig. 6a–c). At D7, the levels of these innate immunocyte populations are usually very low as they are key elements of the early inflammatory stage of the injury response but not the later reparative stage15,16. Thus, elevated numbers of these immunocytes at D7 points to aberrantly persistent inflammation.
Fig. 6: CXCL5 is necessary for effective tissue repair.
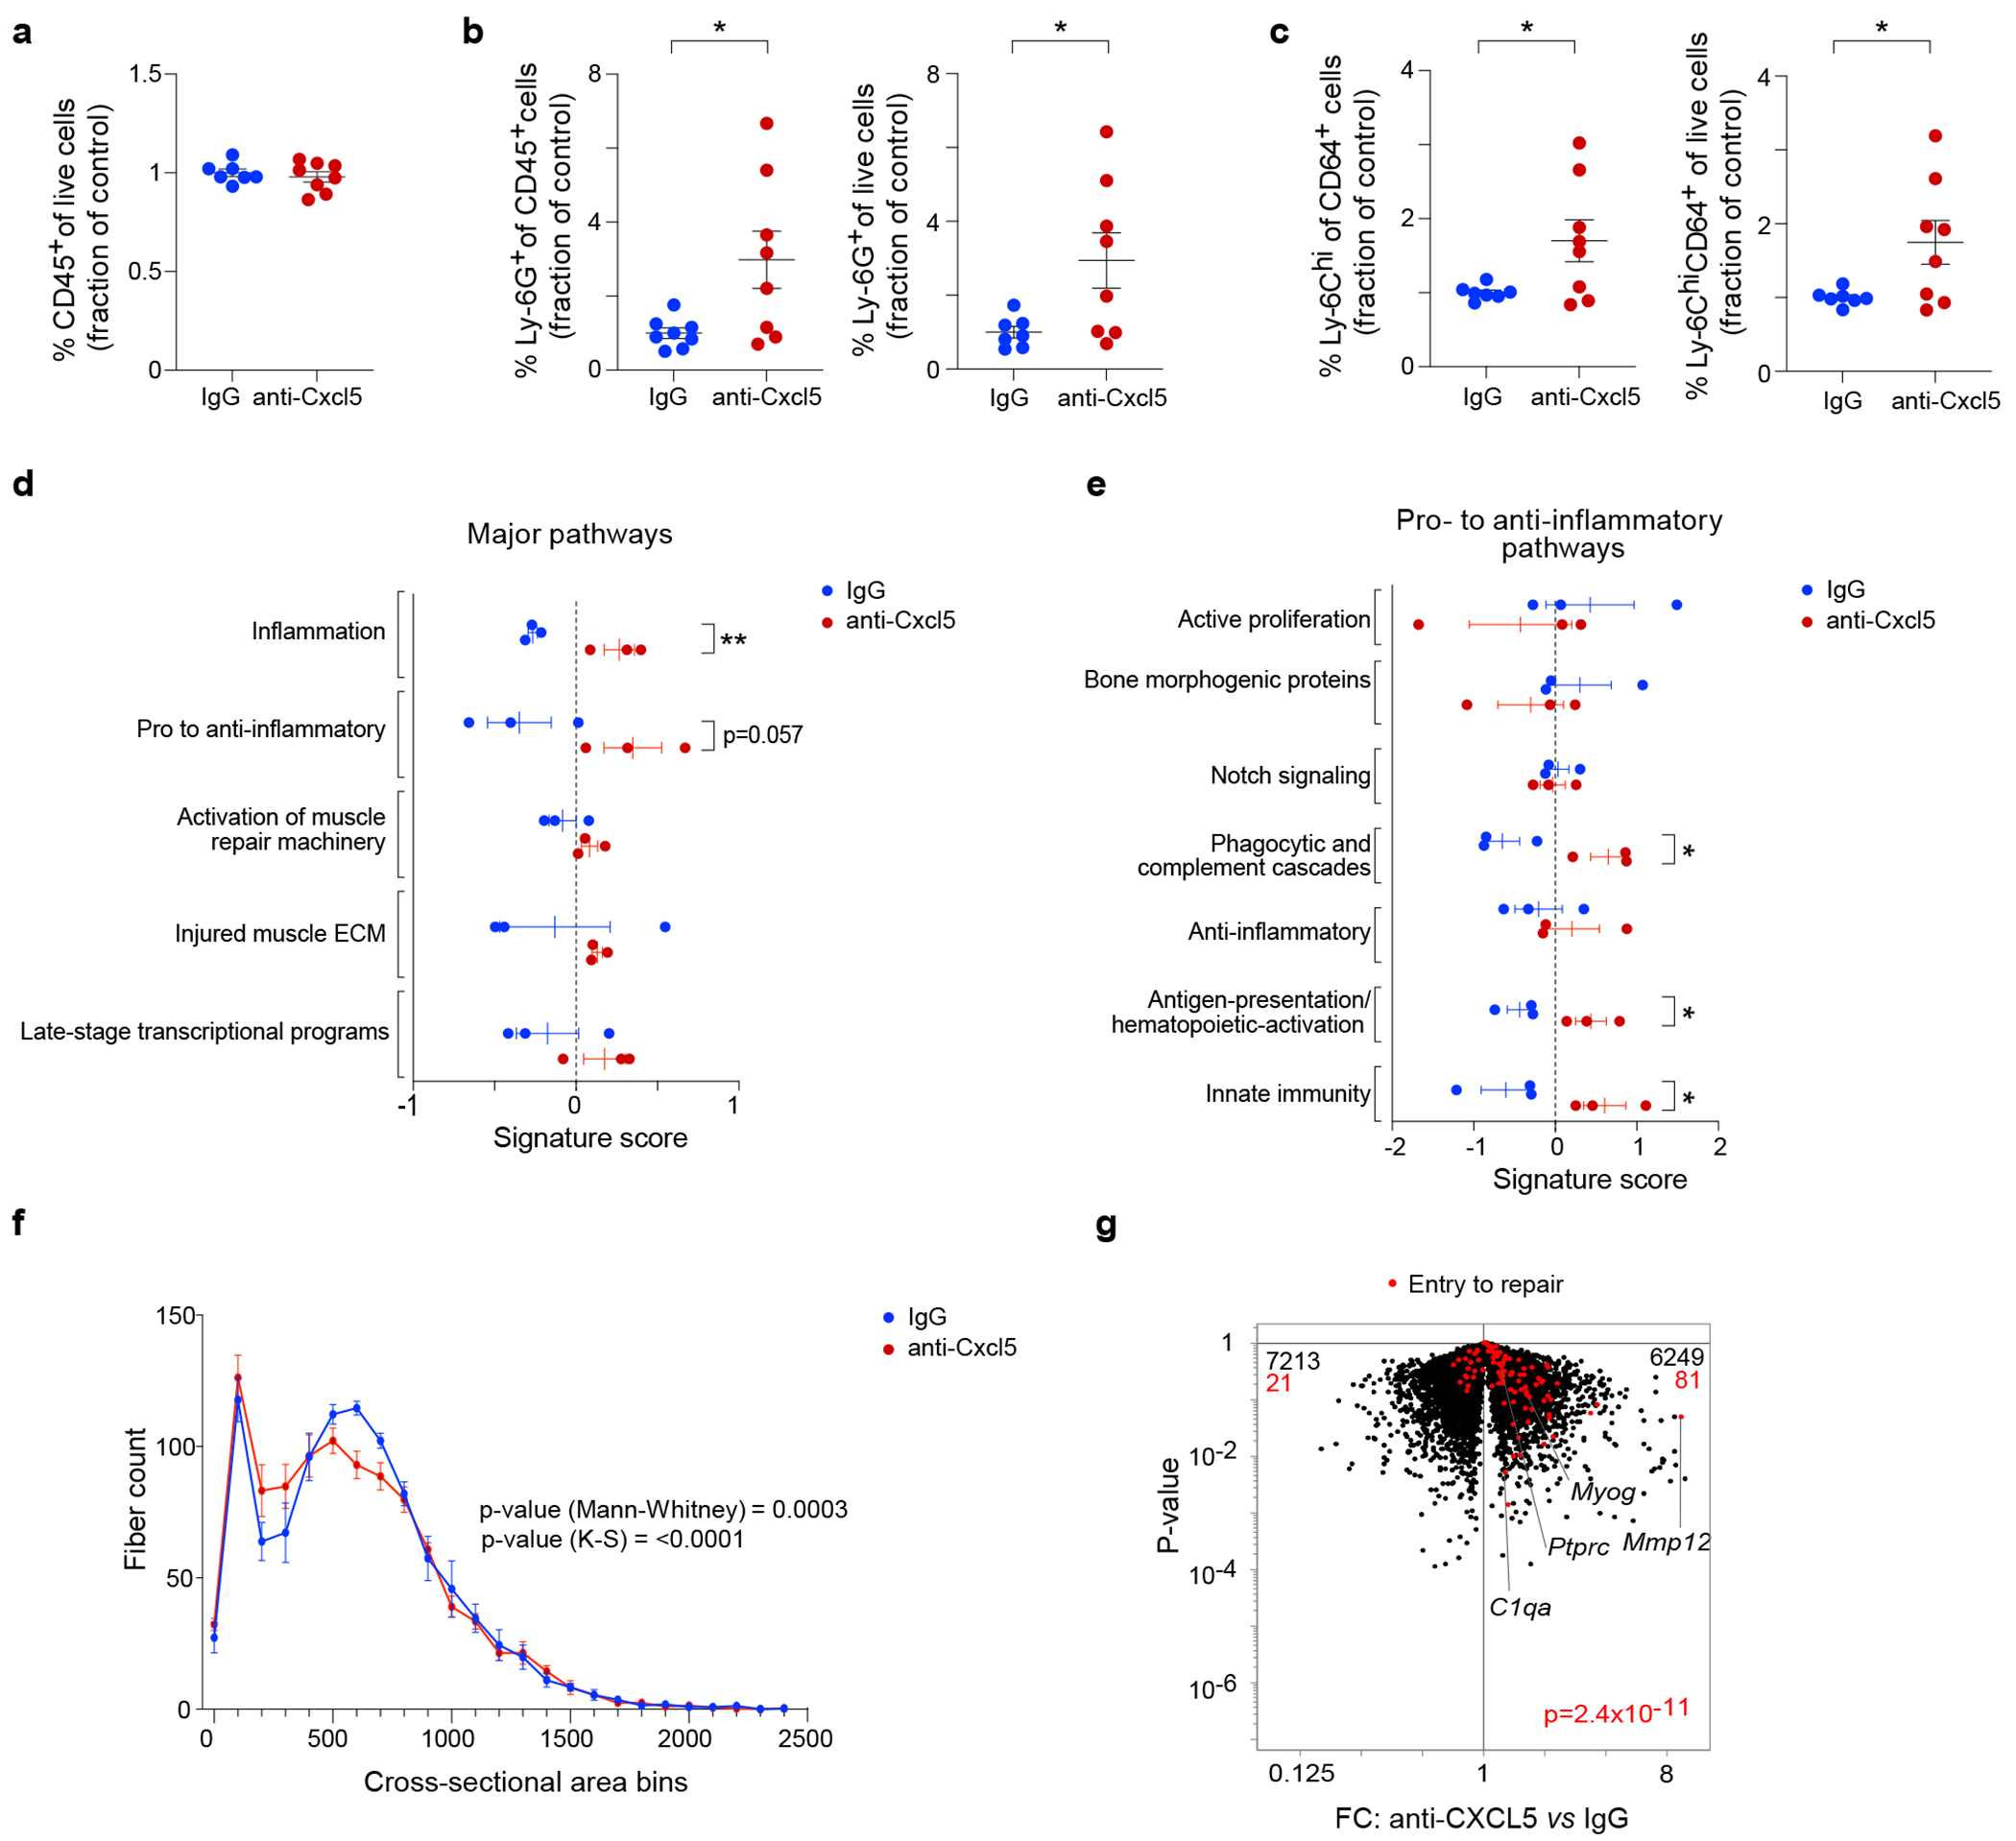
Anti-CXCL5 mAb (n = 8) or control IgG (n = 7) was injected during the earliest stage of recovery after CTX-injury (D-0.5, D0, D1 and D2) and at D7, hindlimb muscle was profiled by cytofluorimetry. a, Total CD45+ cells. b, NFs. c, Ly-6Chi MFs. d, e, Transcriptional analyses of whole muscle tissue at D7 (n = 3 mice per condition). Signature scores of major (d) and pro- to anti-inflammatory (e) pathways, as per53. Scores calculated as per materials and methods. f, Histogram of the cross-sectional areas of centrally-nucleated muscle fibers at D7 (n = 5 mice per condition). g, Volcano plot comparing whole-muscle transcripts from anti-Cxcl5- and control-IgG-treated mice overlain with a signature of genes ordinarily shut down during the transition from inflammation to repair18. Except for panels f and g, each data point represents an individual mouse within a group. All data are from 7- to 9-wk-old B6 male mice. Plots with error bars displayed as mean +/− SEM. *P < 0.05, **P < 0.01 by a two-tailed unpaired t-test except for panel f, in which two-tailed Mann-Whitney and Kolmogorov-Smirnov tests were performed, and panel g in which a Chi-squared test was performed. Data were normalized to the IgG group as repeated experiments had different control setpoints.
Whole-tissue RNA-seq data aligned with these findings. Aguilar et al. recently published highly useful gene-sets that define key pathways in skeletal muscle recovering from acute injury53. We calculated signature scores based on the expression of these gene-sets to identify pathways that varied in the presence and absence of anti-CXCL5 treatment. There were distinct increases in the “Inflammation” and “Pro- to anti-inflammatory” pathways in the anti-CXCL5-treated group (Fig. 6d). Subcategories within the “Pro- to anti-inflammatory” pathway revealed more specific enrichments in “Phagocytic and complement cascades,” “Antigen-presentation/hematopoietic-activation” and “Innate immunity” (Fig. 6e).
Lastly, we assessed the impact of anti-CXCL5 treatment on muscle regeneration, quantifying the cross-sectional areas of 1,000 representative muscle fibers per mouse on hematoxylin and eosin (H&E)-stained tissue sections. Administration of anti-CXCL5 resulted in a profile of cross-sectional areas shifted towards smaller values in comparison with those observed with injections of IgG, which was an indication of less mature muscle fibers and, therefore, a defect or slow-down in the regeneration process (Fig. 6f). Moreover, overlaying an “Entry to repair” signature18 on a volcano plot of whole-muscle transcripts showed that anti-CXCL5-treated mice did not down-regulate this program as control mice do – for example, key transcripts such as C1qa, Mmp12 and Ptprc (Fig. 6g). Given that the early inflammatory MmSC subtype was the primary expressor of Cxcl5 transcripts, these observations argue for the importance of this stromal element.
Inflammatory MmSCs occur in a model of muscular dystrophy
To extend these findings to chronic injury, we performed scRNA-seq on MmSCs isolated from a mouse model of Duchenne’s muscular dystrophy (DMD), D2.B10 Dmdmdx (mdx), compared with its control line, DBA/2J (CTL). DMD is an X-linked disease caused by a mutation in the dystrophin gene. Without functional dystrophin, the structural integrity and contractile activity of skeletal muscle is compromised, leading to repetitive injury and ultimately the replacement of muscle tissue with fibrosis and fat.
We isolated MmSCs from the hindlimb muscles of 2.5-, 5- and 12.5-wk-old mdx mice, and from 2.5- and 12.5-wk-old CTL mice, time-points chosen to survey the onset and early progression of the disease process. 13,650 cells were sequenced, with an average of 2,730 cells per condition and an average depth of 2,686 genes per cell. We initially clustered cells from mdx mice only. UMAP visualization revealed the time-points to cluster predominantly separately, indicating that MmSCs changed dramatically as the disease progressed, even over a mere 10-wk span (Fig. 7a). Surprisingly, by overlaying on the UMAP plot the inflammatory signature derived from CTX-induced muscle injury (top 100 genes defining the inflammatory MmSC subtype; referred to as the “CTX-inflammatory signature”) (Extended Data Table 1), we could distill a small group of cells enriched for this inflammatory module. These cells were members of cluster 5 (light blue), composed mainly of MmSCs from the 5 and 12.5 wk time-points, indicating that cells turned this program on at an early age, though primarily after weaning.
Fig. 7: Identification of an inflammatory MmSC subtype in a mouse model of muscular dystrophy.
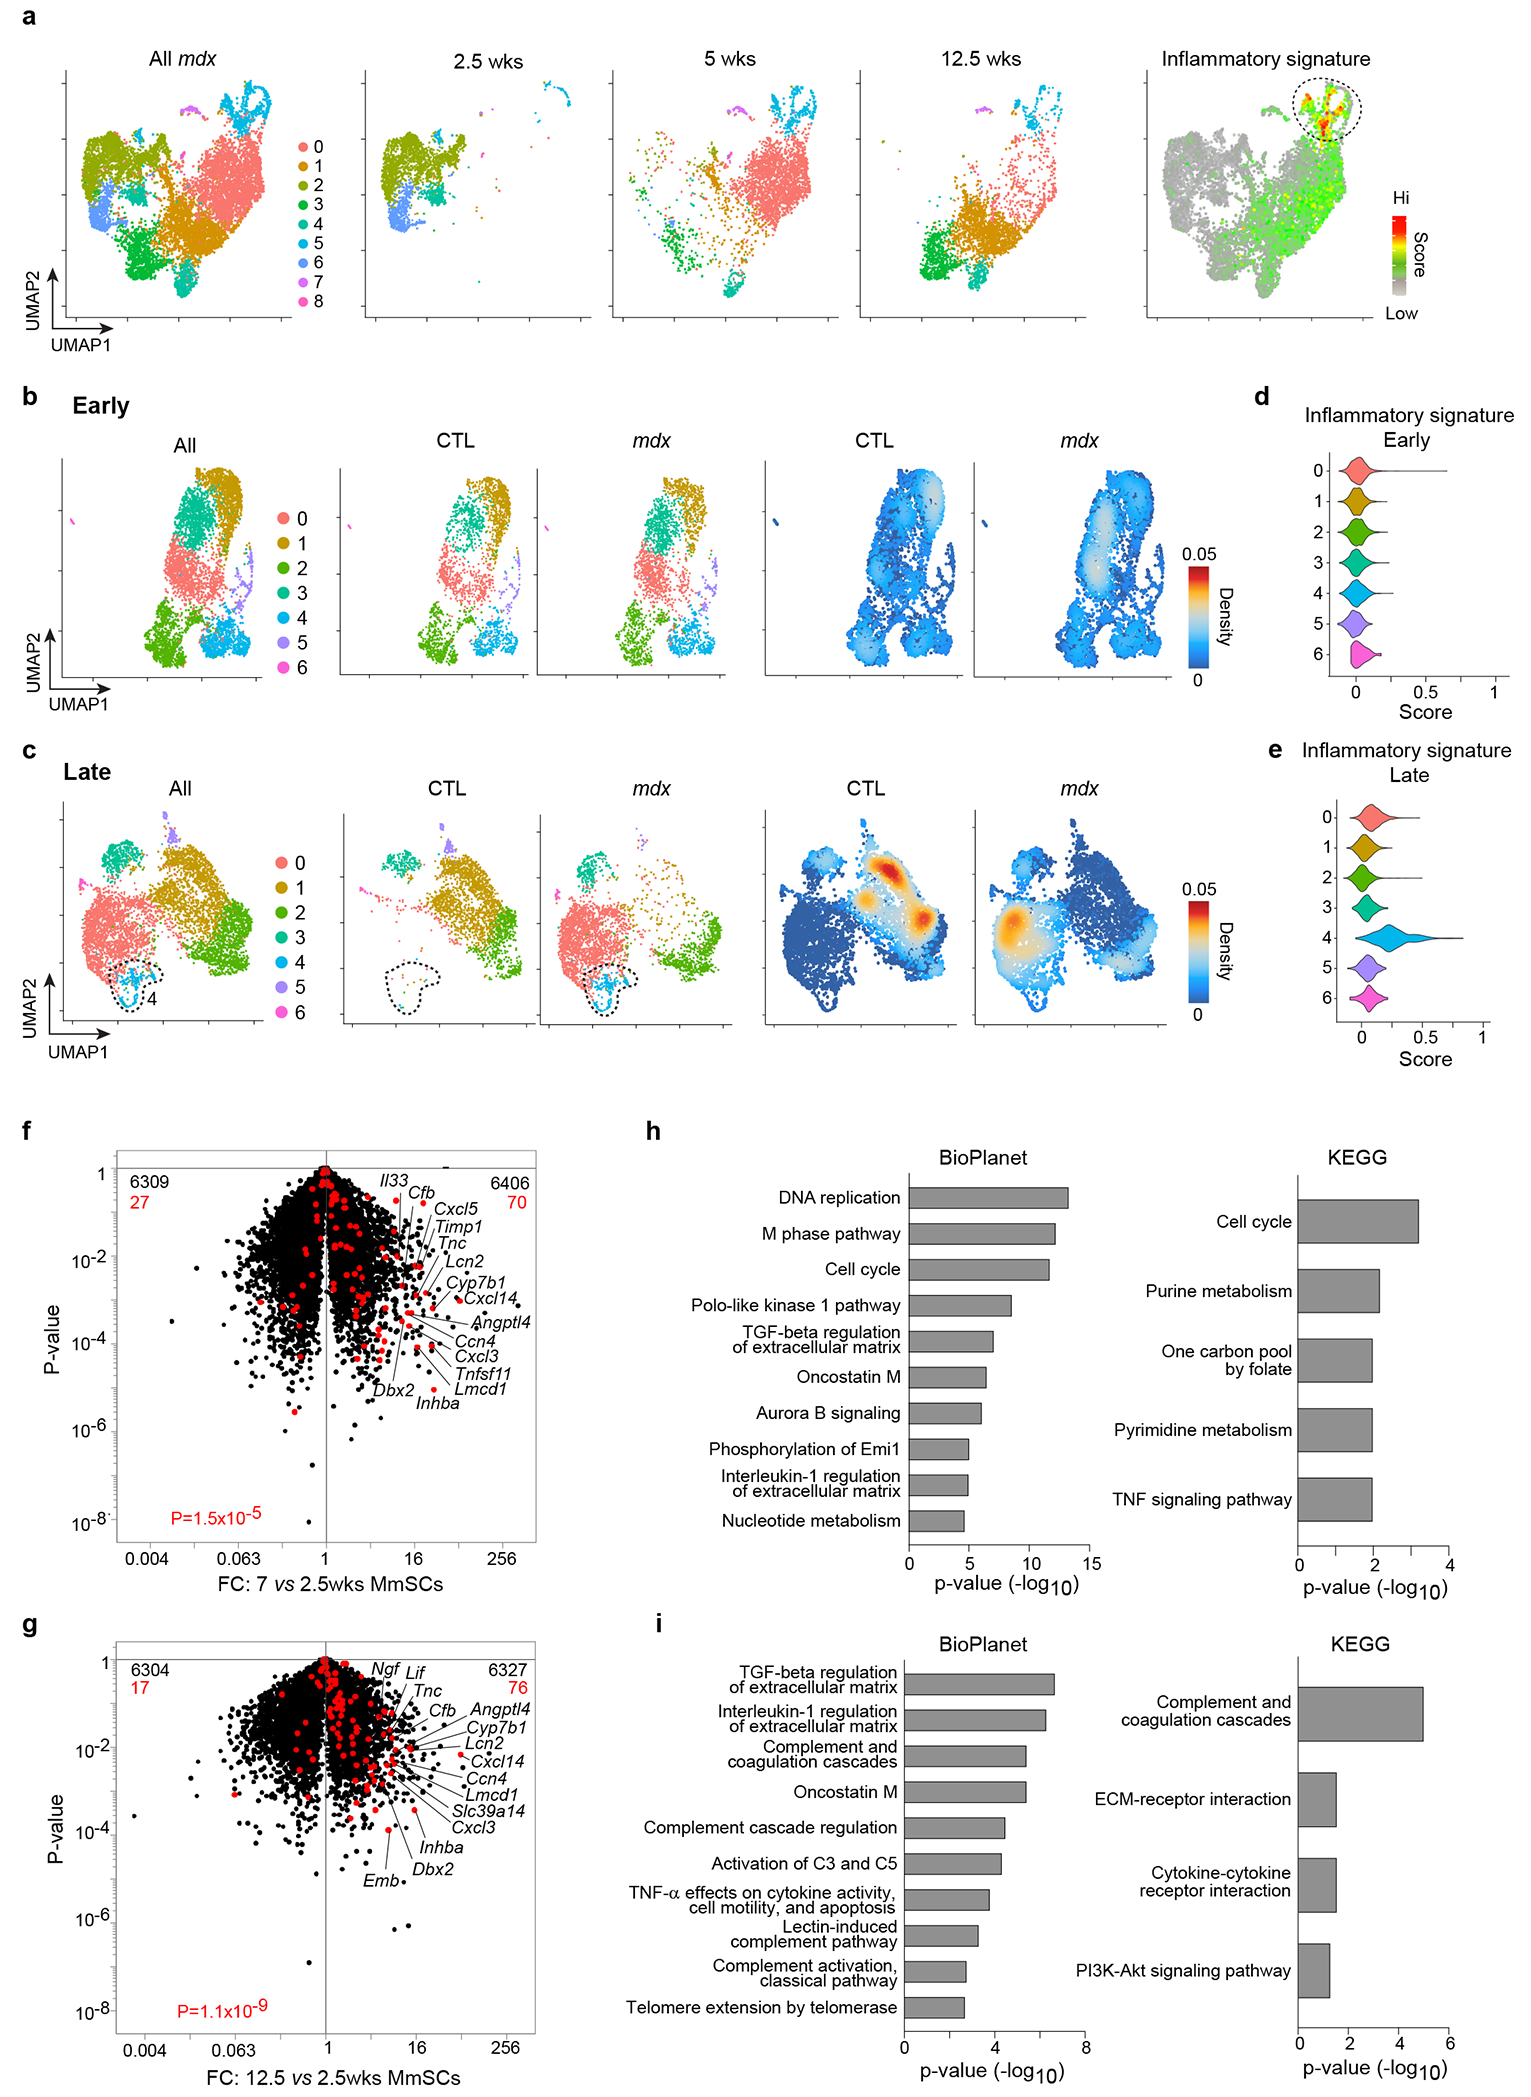
a-e, scRNA-seq of MmSCs from 2.5-, 5- and 12.5-wk-old mdx mice, and from 2.5- and 12.5-wk-old CTL mice. (a) UMAP plots of all cells from mdx mice (leftmost), cells from each time-point (three middle panels), and cells superimposed with the 100-gene CTX-inflammatory signature (rightmost). UMAP plots of mdx and CTL cells from (b) 2.5-wk-old mice (“Early”) and from (c) 12.5-wk-old mice (“Late”). Left: both genotypes; center: individual genotypes; right: density plots of individual genotypes. Violin plots of the CTX-inflammatory signature for the (d) “Early” and (e) “Late” clusters. f-i, Population-level RNA-seq of MmSCs from 2.5-, 7- and 12.5-wk-old mdx mice. Volcano-plot comparisons of MmSCs from (f) 7- vs 2.5-wk-old and (g) 12.5- vs 2.5-wk-old mice (n = 3 per time-point). 100-gene inflammatory signature is shown in red; numbers at the top indicate up- and down-regulated transcripts (in comparison with total transcript numbers in black). Pathway analyses of transcripts significantly up-regulated (> 2x, P < 0.05) in MmSCs from (h) 7-wk-old and (i) 12.5-wk-old mice compared with those from 2.5-wk-old mice. CTL, control; FC, fold-change. P determined by a Chi-squared test (panels f and g) and Fisher’s exact test corrected with the Benjamini-Hochberg method (panels h and i).
We then co-clustered MmSCs from 2.5 wk-old mdx and CTL mice (“early time-point”). Cells from both genotypes were distributed across all of the clusters (Fig. 7b). Density plots highlighting areas on the UMAP plot enriched for a particular genotype indicated that, while there were some minor condition-specific areas, cells from the two genotypes primarily overlapped. In contrast, cells from 12.5-wk-old mdx and CTL mice (“late time-point”) primarily did not overlap (Fig. 7c). Thus, as disease progressed, mdx MmSCs acquired a transcriptome largely distinct from that of baseline MmSCs. We next imposed the CTX-inflammatory signature on the early and late UMAP plots: at the early time-point, the signature score was low across all clusters (Fig. 7d), but later, cluster 4 (light blue) emerged with an elevated signature score (Fig. 7e). Cluster 4 was unique to the mdx condition. These data reveal that the inflammatory MmSC subtype indeed 1) was present in a chronic muscle-injury model; 2) emerged as the disease progressed; and 3) was disease-specific.
While single-cell datasets are helpful for understanding cellular heterogeneity, their lack of depth can compromise accurate determination of gene expression. Therefore, we performed population-level RNA-seq on double-sorted MmSCs from mdx mice at 2.5, 7 and 12.5 wks of age. Given that MmSCs from the mdx and CTL genotypes were transcriptionally similar at 2.5 wks, we used this time-point as our primary reference. Superimposition of the CTX-inflammatory signature on a volcano plot comparing MmSCs from 7 and 2.5 wks demonstrated a significant enrichment in the MmSCs of 7-wk-old mice (Fig. 7f). Numerous signature transcripts were highly upregulated, notably Cxcl5. A comparison of MmSCs from 12- and 2.5-wk-old mice revealed a persistent enrichment of the CTX-inflammatory signature at this later stage, albeit with slightly lower transcript fold-changes (Fig. 7g). Pathway analyses of genes that were 2-fold enriched at either the 7-wk (1239 genes) or 12.5-wk (701 genes) compared with the 2.5-wk time-point indicated that most of the top pathways enriched at 7 wks were, not surprisingly, related to inflammation and cell cycle (Fig. 7h), while those enriched at 12.5 wks similarly related to inflammation, but with an additional prominence of complement terms (Fig. 7i).
Inflammatory MmSCs occur in diverse tissues and pathologies
We exploited previously published data to determine whether an inflammatory MmSC subtype could be found in other tissues, either at homeostasis or with perturbation. Given the similarities between skeletal and cardiac muscle, we began by analyzing a scRNA-seq dataset from mouse heart tissue at homeostasis (D0) and at numerous time-points (D1, D3, D5, D7, D14 and D28) following myocardial infarction (MI)54. At each time-point, cardiomyocytes, debris and dead cells were removed, and the remaining cells were captured and sequenced. We clustered these cells, extracted the Pdgfra+ clusters, re-clustered them, and visualized the new clusters on a UMAP plot, both in toto and day-by-day (Fig. 8a). To search for the inflammatory module across tissues and to reduce contributions that might be intrinsic to the skeletal-muscle environment, we created a condensed inflammatory signature using only the top 25 genes from the 100-gene CTX-inflammatory signature (Extended Data Table 1). A few focal areas with high signature scores (encircled) emerged (Fig. 8b). D1 Pdgfra+ cells were clearly most enriched in these regions of the UMAP plot. With time following injury, the signature score was attenuated. Violin and dot-plots of the signature score across the time-points confirmed these findings (Fig. 8c, d). In contrast, at both homeostasis and the latest stages of recovery from injury (D14 and D28), the signature scores were very low.
Fig. 8: The inflammatory MmSC module appears in numerous tissues and pathologies in both mice and human datasets.
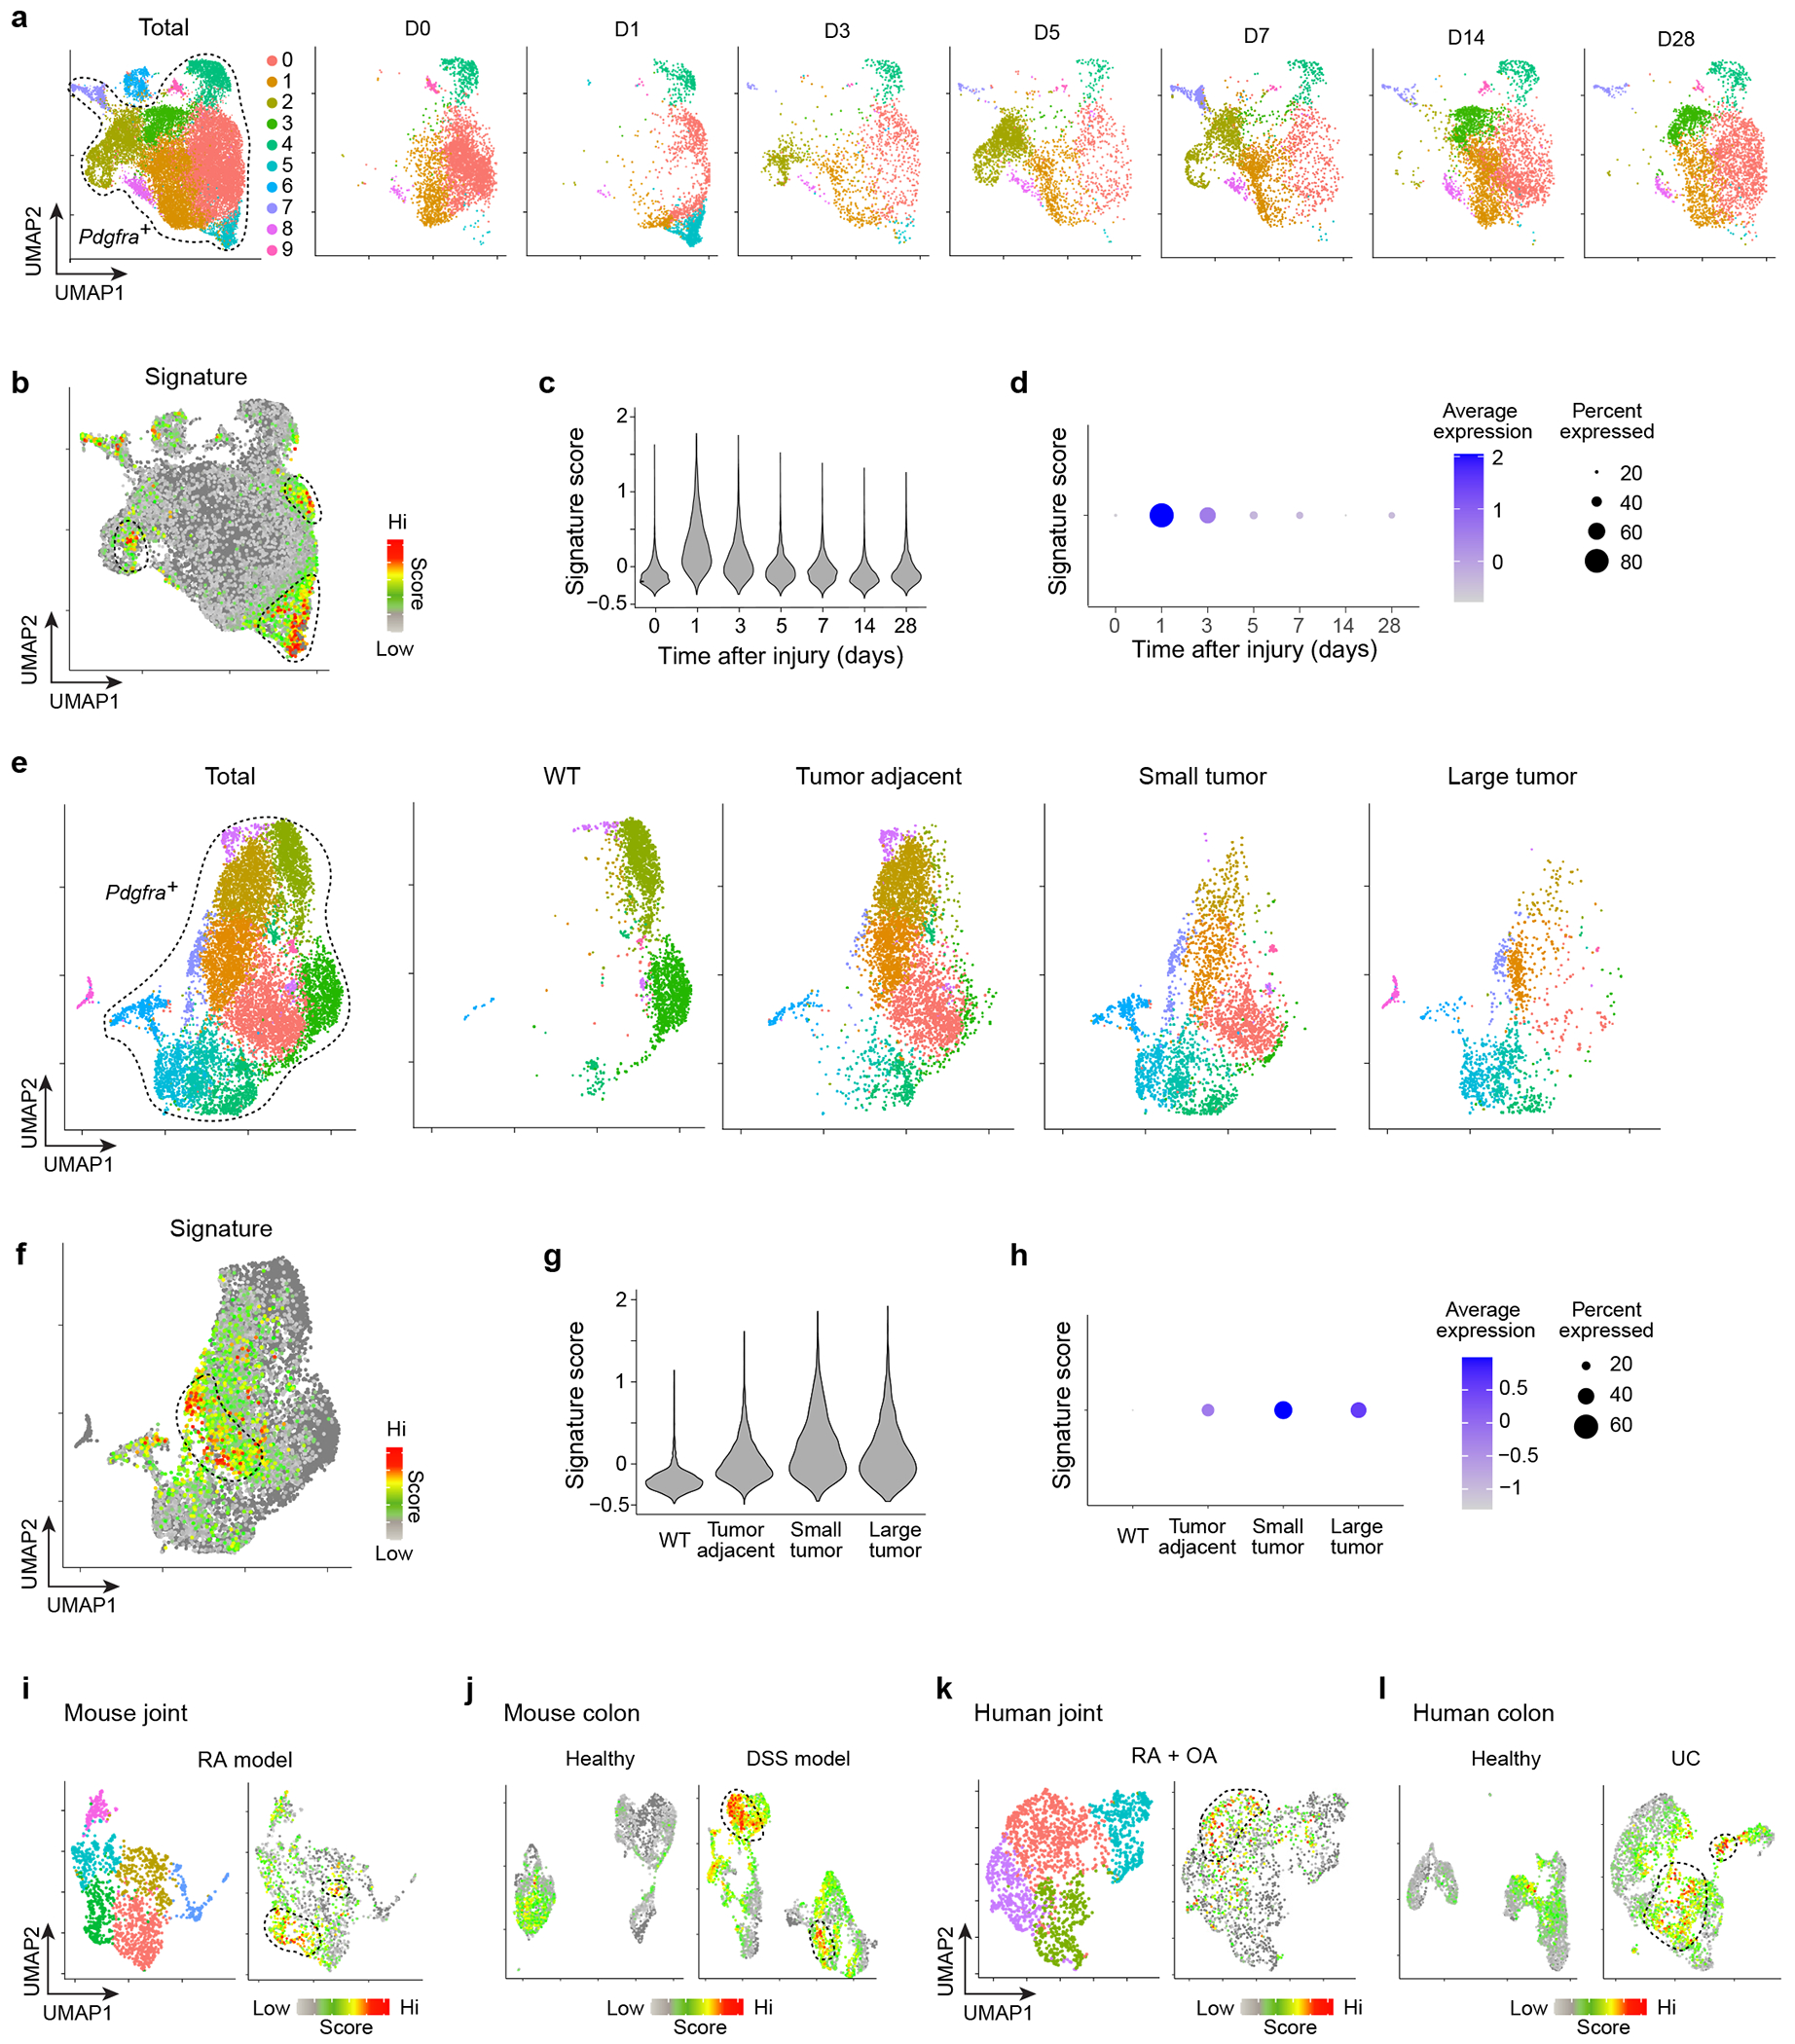
a-d, scRNA-seq of mouse heart tissue at homeostasis (D0) and at D1, D3, D5, D7, D14 and D28 following myocardial infarction54. (a) UMAP plots of Pdgfra+ cells as a whole and by time-point. (b) Same plot as (a) overlain with the 25-gene CTX-inflammatory signature. (c) Violin plot and (d) dot-plot of the inflammatory signature across time-points. e-h, Mouse scRNA-seq of Pdgfra+ cells from healthy pancreas tissue and pancreatic ductal adenocarcinoma tumors at various stages of tumor progression55. Organized as per (a-d). i, Mouse scRNA-seq of Pdgfra+ cells from the inflamed joints of the serum transfer induced arthritis model56. UMAP plot of all cells (left) and cells overlain with the 25-gene CTX-inflammatory signature (right). j, Mouse scRNA-seq of Pdgfra+ cells from colons of healthy mice and mice treated with dextran sodium sulfate (DSS)57. UMAP plot of cells from healthy (left) and DSS-treated (right) mice overlain with the 25-gene CTX-inflammatory signature. k, scRNA-seq of PDGFRA+ cells from patients with rheumatoid (RA) or osteo (OA) arthritis58. UMAP plot of all cells (left) and cells overlain with the 25-gene CTX-inflammatory signature (right). l, scRNA-seq of PDGFRA+ cells from colonic samples of healthy individuals and ulcerative colitis (UC) patients57. UMAP plot of cells from healthy colon (left) and UC-colon (right) overlain with the 25-gene CTX-inflammatory signature. WT, wild-type mice.
A mouse scRNA-seq dataset from podoplanin (PDPN)+ stromal cells derived from a pancreatic ductal adenocarcinoma model was analyzed next55. CD45−Epcam−CD24a−CD31−PDPN+ cells were isolated from healthy pancreas tissue, tumor-adjacent tissue, and small (1-4 mm) and large (5-10 mm) tumors. We clustered these cells, extracted Pdgfra+ clusters, re-clustered them, and visualized them together and by condition (Fig. 8e). Superimposing the 25-gene CTX-inflammatory signature on the UMAP plot highlighted a discrete area with a high signature score (Fig. 8f). At homeostasis (WT) there was no appreciable signature detection (Fig. 8g, h). However, in the sequence of tumor progression, the signature score became elevated in tumor-adjacent samples, peaked in small-tumor samples, and then was reduced in large-tumor samples.
Two murine models of auto-inflammatory disease were also examined. In one case, a scRNA-seq dataset covering CD45− synovial cells from the inflamed joints of a model of rheumatoid arthritis (RA) was analyzed56. We clustered all of the cells in the dataset, extracted the Pdgfra+ clusters, re-clustered them, and visualized the data on a UMAP plot. Overlaying the 25-gene CTX-inflammatory signature highlighted a focal region with enriched signal (Fig. 8i). In the second case, we similarly analyzed a scRNA-seq dataset from CD45−Epcam− cells isolated from colons of healthy or dextran-sodium-sulfate treated mice, a model of inflammatory bowel disease57. Low signature scores were observed in cells originating from healthy colons while those from mice with colitis showed specific areas of enrichment (Fig. 8j).
Finally, we analyzed two recently published human scRNA-seq datasets. The first was of B cells (CD45+CD3−CD19+), T cells (CD45+CD3+), monocytes (CD45+CD14+) and stromal fibroblasts (CD45−CD31−PDPN+) isolated from patients with either RA or osteoarthritis (OA)58. In the metadata associated with this dataset, all cells were classified as one of these four types, and were then sub-classified into subtypes that were examined in greater detail. Stromal fibroblasts were divided into 4 subtypes. We extracted all stromal fibroblasts, clustered the cells, and visualized the data with a UMAP plot (Fig. 8k). All of these clusters were PDGFRA+. One cluster, SC-F2, was enriched for the 25-gene CTX-inflammatory signature. Interestingly, this subtype was noted in the original paper to be overabundant in leukocyte-rich RA, compared with leukocyte-poor RA and OA. The second human dataset contained CD45−EPCAM−CD235a− cells sorted from colonic tissues originating from either healthy individuals or patients with ulcerative colitis (UC)57. For each condition, PDGFRA+ clusters were extracted, cells were re-clustered, and UMAP plots were overlain with the 25-gene CTX-inflammatory signature (Fig. 8l). Cells from healthy human tissues had low signature scores while those from UC patients showed specific areas enriched for the signature.
DISCUSSION:
Time-resolved scRNA-seq provided a dynamic view of how stromal cells communicate with immunocytes in response to acute skeletal-muscle injury. Our results highlight an inflammatory MmSC subtype, expressing an impressive array of incendiary mediators, that appeared acutely after CTX-induced injury and waned as the response to injury progressed. Cxcl5, the transcript most highly induced in MmSCs on D1 after injury and a transcript specifically expressed by this subtype, encoded a mediator with a non-redundant impact on the recruitment of NFs to injured muscle. In the absence of CXCL5 during the initial phase of the injury response, there was persistent inflammation at the later stages and tissue regeneration was hindered. Stromal-cell subtypes expressing the highlighted inflammatory program were detected in a diverse set of tissues and pathologies in both mice and humans, supporting the generality of our observations.
Unlike most immunocyte types, which infiltrate muscle tissue from the circulation in response to a perturbation, MmSCs are primarily resident cells, scattered throughout the tissue24. This feature, coupled with their rapid, direct response to parenchymal damage and sensitivity to key inflammatory signals render them ideal “early responders” to tissue insults. MmSCs had additive, discordant or redundant responses to these signals, demonstrating a capacity to direct different flavors of inflammatory responses upon perturbations associated with distinct milieus. Additionally, their ability to transcribe a battery of chemokines, cytokines and other mediators capable of inciting a diversity of target cells could be important in orchestrating a coordinated, multi-immunocyte injury response. Interestingly, while most MmSCs showed similar high chromatin-accessibility levels at signature inflammatory-gene loci at homeostasis, a small, discrete subset emerged as a highly inflammatory subtype within a day of injury. Imaging supported a scenario wherein the stromal support system across the tissue was prepared to respond to injury, but it was the cells closest to the lesion that took on the distinct inflammatory phenotype. Such a scenario would also explain why inflammatory MmSCs disappeared as the lesion resolved and why the injury response remained asymmetrical.
Although some MmSC mediators are stroma-specific, many (though not CXCL5) are also produced by immunocytes (Extended Data Fig. 5), suggesting that MmSCs might also be signal amplifiers. The timeframe in which the various cell sources produce these mediators could be critical; alternatively, the collective level of a mediator might be essential for optimal tissue repair/regeneration. Regardless of why there is this redundancy, it is unlikely to be by accident given the critical role of these mediators during injury. For example, genetic ablation of the Ccl2 gene, or the gene encoding its receptor, Ccr2, results in decreased MF recruitment following muscle injury and impaired tissue regeneration59–62. But, CCR2 also occurs on MuSCs and its activity has been linked to inhibition of MuSC fusion during injury, illustrating how these inflammatory mediators may also have functions that extend outside of their non-canonical roles63.
A comparable MmSC subtype emerged in the mouse model of muscle dystrophy, wherein there is chronic muscle injury. In contrast to the acute setting, where it was beneficial, the inflammatory MmSC subtype was likely deleterious in this disease associated with pathogenic inflammation. Given that disease pathogenesis entails repetitive contraction-induced muscle injury, MmSCs might still function as “early responders” to tissue injury and signal amplifiers; however, these signals likely contribute to the maladaptive chronic inflammation within the tissue as well.
Our study entailed some difficult challenges. A major issue was the lack of tools to study and manipulate MmSCs in vivo. While mice have recently been engineered to deplete all Pdgfra-expressing cells in skeletal muscle21,22, ablating more specific populations, like the inflammatory subtype remains problematic due to the lack of appropriate Cre mouse lines. As an alternative approach, we targeted a gene specifically expressed by this subtype to genetically tag the cells with a unique surface molecule susceptible to antibody-mediated depletion. Specifically, we generated a mouse line coupling Il6 transcription in Pdgfra-expressing cells with Thy1.1 expression for isolation and depletion of inflammatory MmSCs. While an analogous system was used to ablate dendritic cells via anti-Thy1.1 antibody administration48, MmSCs proved resistant to depletion, likely due to their expression of Cd55, a complement cascade inhibitor. Instead, we used our line as a reporter and performed transfer experiments of isolated Thy1.1+ MmSCs to study their function.
ONLINE METHODS:
Mice
B6.Foxp3-IRES-GFP (Foxp3GFP) mice64 were obtained from V. Kuchroo (Brigham and Women’s Hospital, Boston, MA). C57BL/6J (B6, Jax #000664) mice were purchased from The Jackson Laboratory and bred in-house. The B6.Cg-Tg(CAG-tdKaede)15Utr (Kaede) mouse line65 was obtained from O. Kanagawa. The IL-6 reporter/depleter (Il6RD; Il6tm3307(Cerulean-P2A-CD90.1)Arte) mouse line48 was provided by T. Korn (Technical University of Munich, Munich, Germany) and was crossed to the C57BL/6-Tg(Pdgfra-Cre)1Clc/J (Pdgfra-Cre, Jax #013148) mouse line. C57BL/6-Tg (Csf1r-HBEGF/mCherry)1Mnz/J (Csf1rLsL-DTR, Jax #024046) and B6.129P2-Lyz2tm1(cre)Ifo/J (LysmCre, Jax #004781) were purchased from The Jackson Laboratory and crossed together to generate LysmCre X Csf1rLsL-DTR mice. D2.B10 (DBA/2-congenic) Dmdmdx (mdx, Jax #013141) and DBA/2J (CTL, Jax #000671) mice were purchased from The Jackson Laboratory. C;129S2-Il1btm1Dch/MerJ (Il1b KO, Jax #034447) mice were purchased from The Jackson Laboratory and crossed to the suggested control line BALB/cByJ (BALB/c, Jax #001026). Heterozygotes were crossed to each other to produce littermates either homozygous for the knock-out allele or wild-type allele. Mice were used at the ages specified in the figure legends. Experiments were conducted under protocols approved by Harvard Medical School’s Institutional Animal Care and Use Committee and housed in specific-pathogen-free facilities at Harvard Medical School.
Mouse treatments
For CTX-induced muscle injury, mice were anesthetized with intraperitoneal (ip) injection of ketamine:xylazine in combination (10 mg/kg:2 mg/kg) and subsequently were injected with 0.03 mL of Naja mossambica CTX (0.03 mg/mL; Sigma-Aldrich) intramuscularly (im) in one or more hindlimb muscles (tibialis anterior, gastrocnemius, quadriceps), as previously described18.
For gain-of-function in vivo cytokine injections, recombinant IL-1β (Peprotech, AF-211-11B, 0.25 μg/injection), TNFα (Peprotech, AF-315-01A, 1 μg/injection), IL-17A (Peprotech, 210-17, 0.5 μg/injection) and OSM (Biolegend, 762806, 10 μg/injection) were administered ip either individually, in pairs or all four together. ip injection of phosphate-buffered saline (PBS) was used as a control. Uninjured hindlimb muscles were harvested at 2 hrs post-injection unless otherwise specified.
For neutralization of IL-1β, TNFα and OSM, anti-IL-1β Ab (BioXCell, BE0246), anti-TNFα Ab (BioXCell, BE0058), and anti-OSM Ab (R&D, AF-495-NA), or Armenian hamster IgG (BioXCell, BE0091), rat IgG1 (BioXCell, BE0088), and goat IgG (R&D, AB-108-C) isotype controls were used. 200 μg, 500 μg, and 50 μg of anti-IL-1β, anti-TNFα, and anti-OSM Ab, respectively, or the same quantity of matched isotype controls, were administered ip 24 hrs before injury and im coincident with CTX injection.
For NF depletion, anti-Ly-6G mAb (BioXCell, BE0075-1) or Rat IgG2a isotype control (BioXCell, BE0089) was used. 400 μg, 100 μg, and 100 μg of antibody was administered ip 2 days before injury, ip 1 day before injury, and im coincident with CTX injection, respectively. For MF depletion, LysmCre X Csf1rLsL-DTR mice or their Lysmwt X Csf1rLsL-DTR littermate controls were ip-injected with diphtheria toxin (D0564; Sigma-Aldrich) in PBS at 20 and 4 ng/g at 36 and 12 hr prior to CTX-induced injury, respectively.
For neutralization of CXCL5, anti-CXCL5 mAb (R&D Systems, MAB433) or Rat IgG2b isotype control (R&D Systems, MAB0061) was used. For harvesting tissue 1 day after CTX-induced injury, 40 μg of antibody was administered ip 12 hrs before injury and im coincident with CTX injection. For harvesting tissue 7 days after CTX-induced injury, 40 μg of antibody was administered ip 12 hrs before injury, im coincident with CTX injection and ip at 1 and 2 days after injury.
Cell isolations
Isolation of cells for experiments presented in Fig. 1, 2, 4b, 5a–c and 7, and Extended Data Fig. 2a, 4a, c and 5 was performed as previously described66. Briefly, hindlimb muscles were excised, minced and digested in collagenase VIII (2 mg/mL, Invitrogen) and dispase (0.5 mg/mL, Gibco 17105-041) for 30 min at 37°C, then filtered throμgh a 70 μM filter and washed twice before resuspension in staining medium. The remaining experiments were performed as previously described67. Briefly, hindlimb muscles were excised, minced and digested for 90 min at 37°C in collagenase II (800 units/mL, Gibco 17101-015) in 10 mL/sample of dissociation buffer (Ham’s F10 media supplemented with 10% horse serum and 1% penicillin/streptomycin). Samples were washed with 50 mL of dissociation buffer, triturated, and then digested for 30 min at 37°C in collagenase II (200 units/mL) and dispase (11 units/mL) in 10 mL/sample of dissociation buffer. Cell suspensions were passed through a 20-gaμge needle 10 times, washed, filtered through a 40-μm cell strainer, washed, and stained for analysis or sorting by flow cytometry.
Flow cytometry
The following antibodies were used for flow cytometric staining: -CD45 (30-F11), -CD11b (M1/70), -CD31 (MEC13.3), -Sca-1 (Ly6A/E; D7), -PDGFRα (CD140a; APA5), -VCAM-1 (CD106; 429), -Ly-6G (1A8), -Ly-6C (HK1.4), -Gr-1 (RB6-8C5), -F4/80 (BM8), -CD64 (X54-5/7.1), -CD11c (N418), -CD19 (6D5) and -TNFα (MP6-XT22) from Biolegend; -IL-1β (Pro-form, NJTEN3) and -Foxp3 (FJK-16s) from Invitrogen; -Thy1.1 (CD90.1; OX-7), -Thy1.2 (CD90.2; 53-2.1), -MyoG (F5D) and -Ki-67 (B56) from BD Pharmingen; anti-TCRβ (H57-597) from BD Horizon. Surface staining was performed at 4°C for 25 minutes (prior extra step for IL-1β and TNFα staining, see paragraph below). Cells were washed and either DAPI (4’, 6-diamidino-2-phenylindole) or LIVE/DEAD Fixable Viability Dye (ThermoFisher Scientific, per manufacturer’s protocol) was used to mark live and dead cells for fluorescence-activated cell sorting (FACS) or flow cytometry analysis, respectively. Intracellular staining was performed using the eBiosciences Intracellular Fixation & Permeabilization buffer set per manufacturer’s protocol. Flow cytometry was performed on a FACSymphony cytometry (BD Biosciences) and FACS on a FACSAria. Data was analyzed using FlowJo software.
For IL-1β and TNFα staining, cells were incubated for 3.5 hrs at 37°C in complete RPMI-1640 media supplemented with 10% fetal bovine serum (ThermoFisher Scientific) and 1x protein transport inhibitor cocktail (eBioscience, 00-4980-03). Cells were washed and then stained as detailed above.
Manipulation of cells ex vivo
For co-culture experiments, 40,000 cytofluorometrically sorted MmSCs were seeded in the bottom level of 24 well transwell plates (Corning #3422). To compare MmSC responses to co-culture with healthy versus injured myofibers, single myofibers were isolated from extensor digitorum longus (EDL) muscles by incubation in digestion buffer (Ham’s F10, 10% horse serum, collagenase II [800 U/mL; Gibco]) for 75 min at 37°C. Care was taken to touch only tendons of the EDL to prevent damage to myofibers. After digestion, muscles were transferred to warm wash medium (digestion buffer without collagenase, with 10 mM HEPES) in a serum-coated 10 cm petri dish. Myofibers were released by flushing EDL muscles with wash medium using a flame-polished, serum-coated glass pipet. Healthy myofibers, or fibers with a straight, non-contracted morphology, were transferred to new serum-coated petri dishes with fresh, warmed wash medium. One dish of fibers was challenged with 10 μM CTX for 10 min at 37°C. CTX-treated fibers were washed once in wash medium, and 10-15 fibers were subsequently transferred to the upper level of the transwell system. An equal number of healthy myofibers were included as controls. MmSCs and myofibers were co-cultured in complete medium (Ham’s F10, 10% FBS, 2 mM sodium pyruvate, 2 mM L-glutamine, 10 mM HEPES, and penicillin/streptomycin) for 24 hr before supernatants were collected for ELISA.
ELISA
Cell culture supernatants were spun down (5 min at 400g), diluted appropriately in 5% BSA and assayed for IL-6 using a standard ELISA kit (BioLegend #431304) according to the manufacturer’s instructions. Supernatants were analyzed from two independent experiments with conditions performed in duplicate or triplicate. Relative IL-6 concentrations were calculated as the fold-change in IL-6 in stimulated or co-cultured cells compared to unstimulated cells within an experiment.
Immunofluorescence of muscle sections
Tibialis anterior muscles were excised from Il6RD x Pdgfra-Cre mice 2 days following CTX-induced injury. Tissues were placed in chilled 4% paraformaldehyde (Sigma) and stored at 4°C overnight. Excess paraformaldehyde was then removed, and the tissues were placed in O.C.T. compound (Sakura) within small cryomolds (Fisher Scientific). 2-methylbutane was cooled using liquid nitrogen and samples were then submerged in the 2-methylbutane until completely frozen. Samples were stored at −80°C until sectioned. For staining, muscle sections were rinsed and permeabilized in PBS plus 0.05% Tween-20 (PBS-T), blocked for 30 minutes in PBS-T plus 5% donkey serum, and incubated with goat anti-mouse PDGFRα (R&D, AF1062) overnight at 4°C. Sections were washed in PBS-T and incubated for 1 hour at room temperature in the presence of APC-conjugated anti-Thy1.1 (Biolegend), BV421-conjgated anti-Ly6G (Biolegend) and Alexa Fluor 594-conjgated donkey anti-goat secondary antibody (Jackson ImmunoResearch). Sections were washed and mounted in ProLong Diamond mountant (Invitrogen), and imaged by spinning-disk confocal microscopy using a Nikon Ti inverted microscope, W1 Yokogawa spinning disk with 50μm pinholes and Plan Apo 20X air and 60X oil objectives. Images were analyzed in ImageJ. All images shown are representative of two independent experiments.
Transfer of MmSCs
Cell suspensions were prepared and stained with Abs against CD45, CD31, Sca-1, PDGFRα, and Thy1.1 utilizing DAPI to identify viable cells. Using Il6RD mice, hindlimb muscles at day 2 or day 4 following CTX-induced injury were excised and processed. Either DAPI-CD45-CD31-Sca-1+PDGFRα+Thy1.1+ (at day 2) or DAPI−CD45−CD31−Sca-1+PDGFRα+Thy1.1− (at day 4) cells were sorted into buffer using FACSAria. Cells were spun down and re-suspended in PBS. Kaede mice were anesthetized with ip injection of ketamine:xylazine in combination (10 mg/kg:2 mg/kg) and then 200K cells were injected im into the quadriceps on both sides. 16 hrs later, the quadriceps from the recipient Kaede mice were harvested and processed as detailed above except 5 mL was used as the total volume during enzymatic digestions given the lower amount of tissue present.
scRNA-seq
MmSCs were isolated by FACS from hindlimb muscles (tibialis anterior, gastrocnemius and quadriceps) of 6- to 8-wk-old male Foxp3GFP mice at homeostasis and at day 0.5, 1, 3, 7 and 14 following CTX-induced injury; 2.5-, 5- and 12.5-wk-old male mdx mice; or 2.5- and 12.5-wk-old male CTL mice. For sequencing of MmSCs from mdx/CTL mice, individual samples were tagged (hashed) with DNA-coded anti-biotin antibodies (Biolegend). MmSCs were submitted to the Broad Institute Genomics Platform, which performed encapsulation and library preparation following 10x Genomics protocols.
For the CTX dataset, sequenced reads were aligned, assigned to cells and output as count matrices using Cell Ranger (10x Genomics). scRNA-seq analysis was performed using the Seurat package68. Cells from each time-point were re-named by appending their time-point to each of their cell IDs. Cells were then merged into one large count matrix and initially filtered using gene and UMI number. Cells retained had > 300 genes and > 50 UMIs. As in the standard Seurat workflow, gene expression was log-normalized, the top 2000 variable genes were determined, data were scaled and centered, and PCA was performed on variable genes. The top 50 PCs were used for FindNeighbors and RunUMAP based on JackStraw and ElbowPlot functions. A resolution of 0.3 was used for FindClusters. MmSCs were sequenced with Tregs and B cells for additional studies and, therefore, Pdgfra+ clusters were extracted from the rest of the cells. Pdgfra+ cells were then filtered using more strict criteria. Cells retained had > 500 genes, > 50 UMIs and < 10 percent of reads that mapped to the mitochondrial genome. Starting with re-normalization, the same workflow as described above was used, with 50 PCs and a resolution of 0.3 used for cell clustering. Several small clusters expressing hematopoietic or endothelial/pericyte markers were assumed to be contaminants and removed. Once more, the standard workflow was implemented, however, using 60 PCs and a resolution of 0.3 for cell clustering. For day specific analysis, either D0.5 or D1 cells were extracted from Seurat object containing filtered Pdgfra+ cells. The standard workflow was used for re-analysis, with 35 PCs and 0.35 or 0.3 resolution used for clustering D0.5 or D1 cells, respectively.
For the mdx/CTL dataset, sequenced reads were demultiplexed, aligned, assigned to cells and output as count matrices using Cell Ranger (10x Genomics). Hash-by-cell matrices were obtained using CITE-seq-count69. scRNA-seq analysis was performed using the Seurat package68. Hash counts were first normalized. Single cells were assigned to hash groups by high expression of a single hash. Cells lacking hashes or with multiple hashes were removed. Cells were then filtered using gene number, UMI number and percent of reads mapping to the mitochondrial genome. Cells retained had > 500 genes, > 1000 UMIs and < 10 percent mitochondrial reads. As in the standard Seurat workflow (also described above), gene expression was log-normalized, the top 2000 variable genes were determined, data were scaled and centered, and PCA was performed on variable genes. The top 60 PCs and 0.6 resolution were used for cell clustering. Several small clusters did not express Pdgfra and were assumed to be contaminants and removed. Once more, the standard workflow was implemented, with 60 PCs and a resolution of 0.6 used for cell clustering. For age specific analysis, cells from either the early or late time-point were extracted from the Seurat object containing filtered Pdgfra+ cells. The standard workflow was used for re-analysis, with 36 PCs and 0.3 resolution and 50 PCs and 0.3 resolution used for clustering cells from early and late time-points, respectively. Similarly, the standard workflow was used for re-analyzing cells from only the mdx condition, with 50 PCs and 0.3 resolution used for cell clustering.
Signature scores were calculated using the Seurat function AddModuleScore. Cluster-based differential expression was performed using the Seurat function FindMarkers. UMAP density plots were made using the BuenColors package and the kde2d density function in the MASS package. Briefly, density values were computed for each condition and color scales were set according to the same min (0) and max (0.05) density values.
Re-analysis of published scRNA-seq datasets
We re-analyzed five published scRNA-seq datasets54–58. To generate the initial Seurat object for each of these datasets, we followed the authors’ analyses as much as possible per details provided in the respective methods sections. Pdgfra+ (mouse) or PDGFRA+ (human) cells were extracted from each dataset and re-clustered to produce final plots.
scATAC-seq
scATAC-seq of MmSCs was reanalyzed from published work 44. Reads were aligned to the mm10 genome and assigned to cells using Cell Ranger ATAC (v1.1, 10x Genomics). Aligned reads were converted into a snap file, a hdf5 format for scATAC-seq data, using Snaptools (v1.4.1; 70). Downstream analyses were performed in SnapATAC (v1.0.0; 70) following a published approach71. Cells with 103.5-105 unique reads and 20-75% reads in promoters were kept for analysis. Reads were assigned to 5kb genomic bins, ENCODE blacklist bins were removed, and the top 5% of bins (corresponding to housekeeping genes) were removed. Cells with coverage of <1000 bins after filtering were also removed. Dimensionality reduction was performed in several steps, first reducing the cell-by-bin matrix into a cell-by-cell Jaccard similarity matrix, normalizing for sequencing depth, reducing the similarity matrix using diffusion maps, and finally reducing the low-dimensional diffusion matrix into a 2D UMAP for visualization. Several small contaminating clusters with high accessibility at hematopoietic genes were removed. Ultimately, 6 eigenvectors were retained for UMAP generation and semi-supervised Louvain clustering using accessibility at known MmSC marker genes as a guide. The normalized inflammatory module score was calculated by computing gene scores for each inflammatory gene as log10(reads per million + 1) within the gene body, pairing each inflammatory gene to a random, accessibility-matched gene, computing the mean accessibility for inflammatory and control signatures for each cell, and normalizing the inflammatory score for each cell as the difference of the mean inflammatory and control scores, with the minimum value set at zero.
Histology
CTX-injured tibialis anterior muscles were dissected and immediately fixed in 10% formalin. Tissues were sectioned by the Rodent Histopathology Core at Harvard Medical School and stained with hematoxylin and eosin. Four sections, cut 200 μm apart, were used to represent areas throμghout the tissue. Images were acquired with a Nikon Ti inverted microscope. For each mouse, the section with the largest number of regenerating muscle fibers (centrally nucleated fibers) was identified for quantification. For 3 to 5 representative regions in each section, the cross-sectional areas of individual muscle fibers were calculated by manually tracing fiber circumference using Fiji72. 1000 fibers were traced per section. Experimenter was blinded to sample group during the entire process.
RNA-seq library construction, sequencing and data processing
For population-level RNA-seq, samples were double-sorted using FACSAria and 1000 cells from each population were collected into 5 μl Buffer TCL (Qiagen) containing 1% beta-mercaptoethanol (Sigma) in DNA LoBind tubes (Eppendorf). Library construction, sequencing and data processing was according to the Immgen protocol (https://www.immgen.org/img/Protocols/ImmGenULI_RNAseq_methods.pdf). Smart-Seq2 were prepared as previously described73,74 with minor modifications. Briefly, total RNA was captured and purified on RNAClean XP beads (Beckman Coulter). Polyadenylated mRNA was selected using an anchored oligo(dT) primer and converted to cDNA via reverse transcription. First-strand cDNA was subjected to limited PCR amplification followed by transposon-based fragmentation using the Nextera XT DNA Library Preparation Kit (Illumina). Samples were then PCR-amplified using barcoded primers such that each sample carried a specific combination of Illumina P5 and P7 barcodes and were pooled prior to sequencing. Paired-end sequencing was performed on an Illumina NextSeq500 (two full NextSeq runs per batch of 96 samples, for 10M raw reads/sample on average) using 2 × 38bp reads with no further trimming.
STAR 2.7.3a (https://github.com/alexdobin/STAR/releases) was used to align reads to the mouse genome (GENCODE GRCm38/mm10 primary assembly and gene annotations vM25; https://www.gencodegenes.org/mouse/release_M25.html). The ribosomal RNA genes were removed. Gene quantification was calculated by featureCounts (http://subread.sourceforge.net/). DESeq2 package (Bioconductor) was used to normalize raw read counts via median of ratios method and then converted to GCT and CLS format. Samples with less than 1 million uniquely mapped reads were excluded from normalization.
For whole-muscle RNA-seq, RNA was isolated from tissue during TRIzol (Invitrogen) following manufacturer’s instructions. Two nanograms of RNA in 5 μL of TCL containing 1% beta-mercaptoethanol in DNA LoBind tubes was used for library construction, sequencing and data processing, as described above.
Population-level RNA-seq analysis
Transcripts were further filtered by minimal expression and coefficient of variation cutoffs. To visualize transcriptional data, Multiplot Studio (developed by Scott Davis, Mathis/Benoist lab) or the Heatmaply R package was used.
To calculate whole-muscle gene-expression scores for each injury-related pathway, the gene-expression matrix was log-transformed and the z-score of each gene calculated. The score_genes function in the scanpy package in python was then used. Genes assigned to each pathway were obtained from53.
Pathway analysis
BioPlanet and KEGG pathway analyses were performed using Enrichr (https://maayanlab.cloud/Enrichr/)75–77
Statistical analysis
For volcano plots, a Chi-squared test was used to determine signature significance. For the histogram of fiber areas, Mann-Whitney U and Kolmogorov-Smirnov tests were used. For pathways analyses, Fisher’s exact test and the Benjamini-Hochberg method were used. Otherwise, two-tailed unpaired t-tests, one-way or two-way ANOVA with Dunnett’s or Tukey’s multiple comparisons tests were performed in Prism (v9.1.0, GraphPad) and displayed as mean +/− standard error of the mean (SEM), unless otherwise noted. *P < 0.05, **P < 0.01, ***P < 0.001, ****P < 0.0001. A value of more than three standard deviations (SDs) from the mean was adopted as criteria to exclude outliers and was noted in the relevant figure description. For Figures 4, 5, and 6, we used fraction of control as the y-axis. JAX mice and our in-house B6 mice have different immunocyte setpoints within the muscle. Repeat experiments showed similar deltas between experimental groups, but the setpoint for the control groups between experiments were often quite different. Therefore, we divided all points by the average of the control group.
Extended Data
Extended Data Fig. 1: Identification of an inflammatory MmSC subtype after acute skeletal-muscle injury.
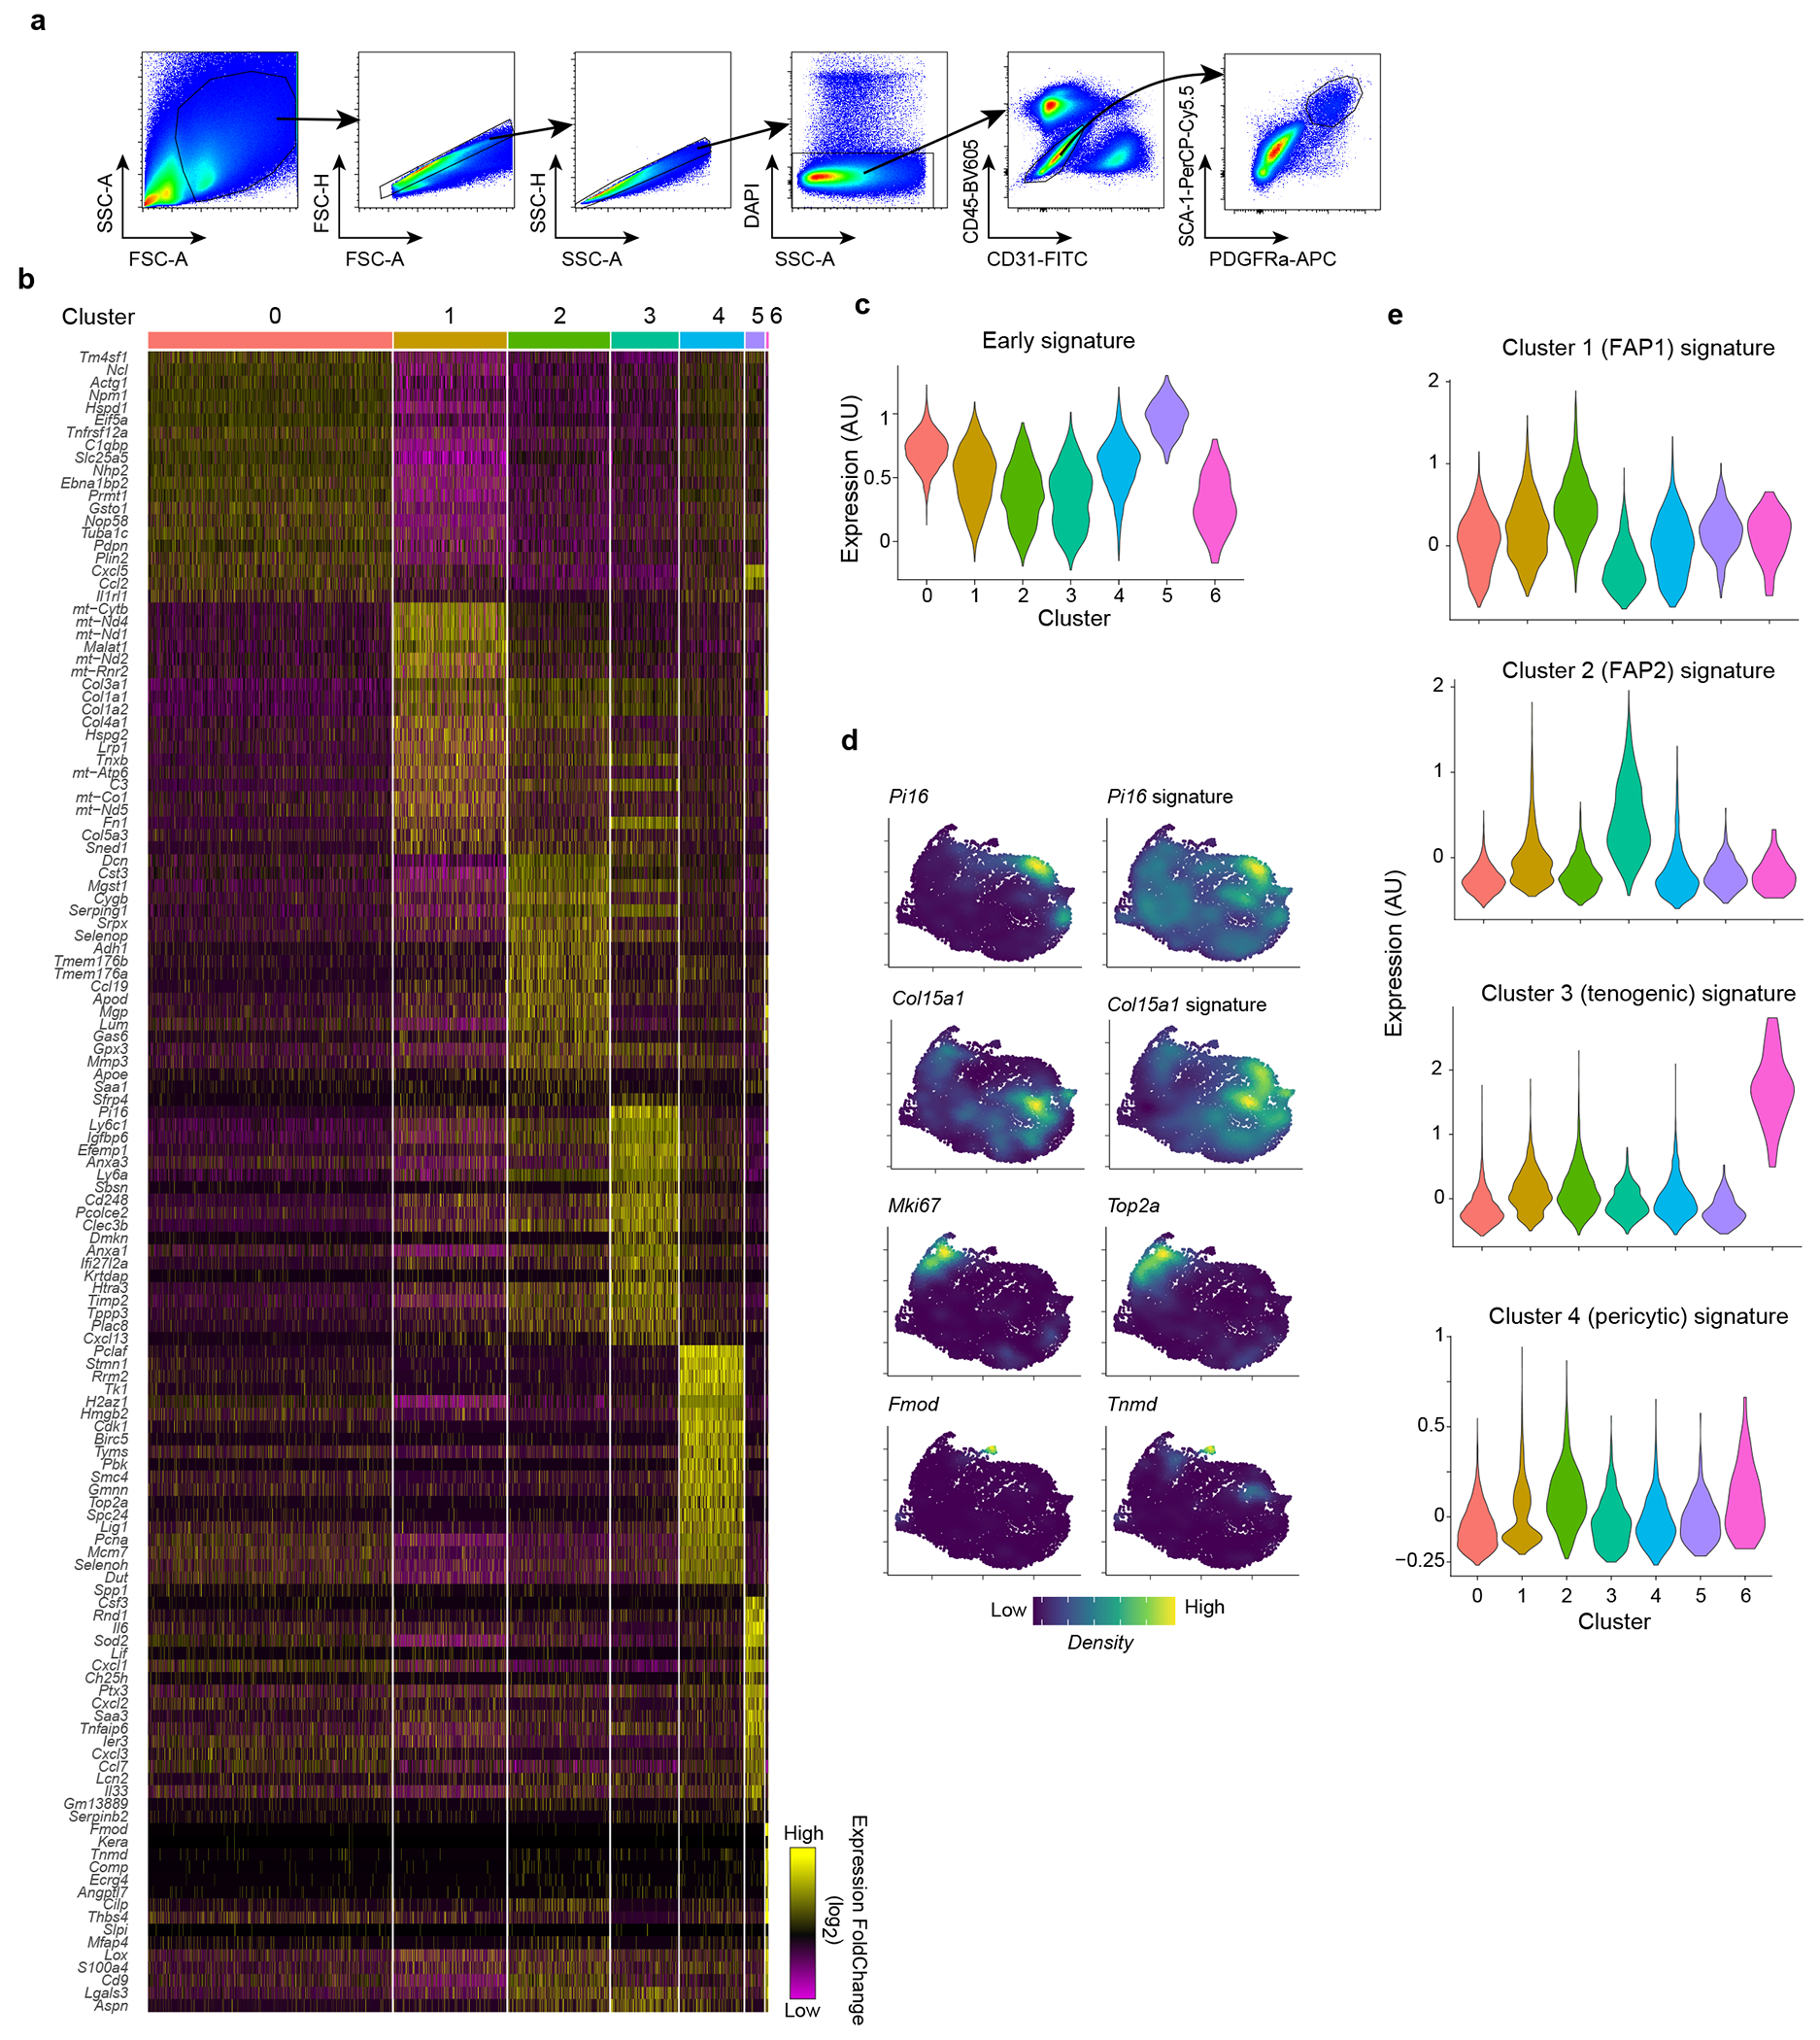
a, Gating strategy for the cytofluorimetric sorting of MmSCs from hindlimb muscles. b, Heatmap of the top 20 differentially expressed genes in MmSCs from D1 following CTX-induced injury comparing each cluster vis-à-vis all other clusters. c, Violin plot of the expression of the early signature (top 100 transcripts distinguishing early time-points from the rest) across all MmSCs clusters on D1 following CTX-induced injury. d, Density plot of the expression of the indicated genes and gene signatures in MmSCs from D1 following CTX-induced injury. e, Violin plots of the expression of the signatures differentiating the four muscle stromal subtypes from Scott et al.44 across all MmSCs clusters on D1 following CTX-induced injury.
Extended Data Fig. 2: Role of IL-1β, TNFα, Osm in inducing MmSC inflammatory program.
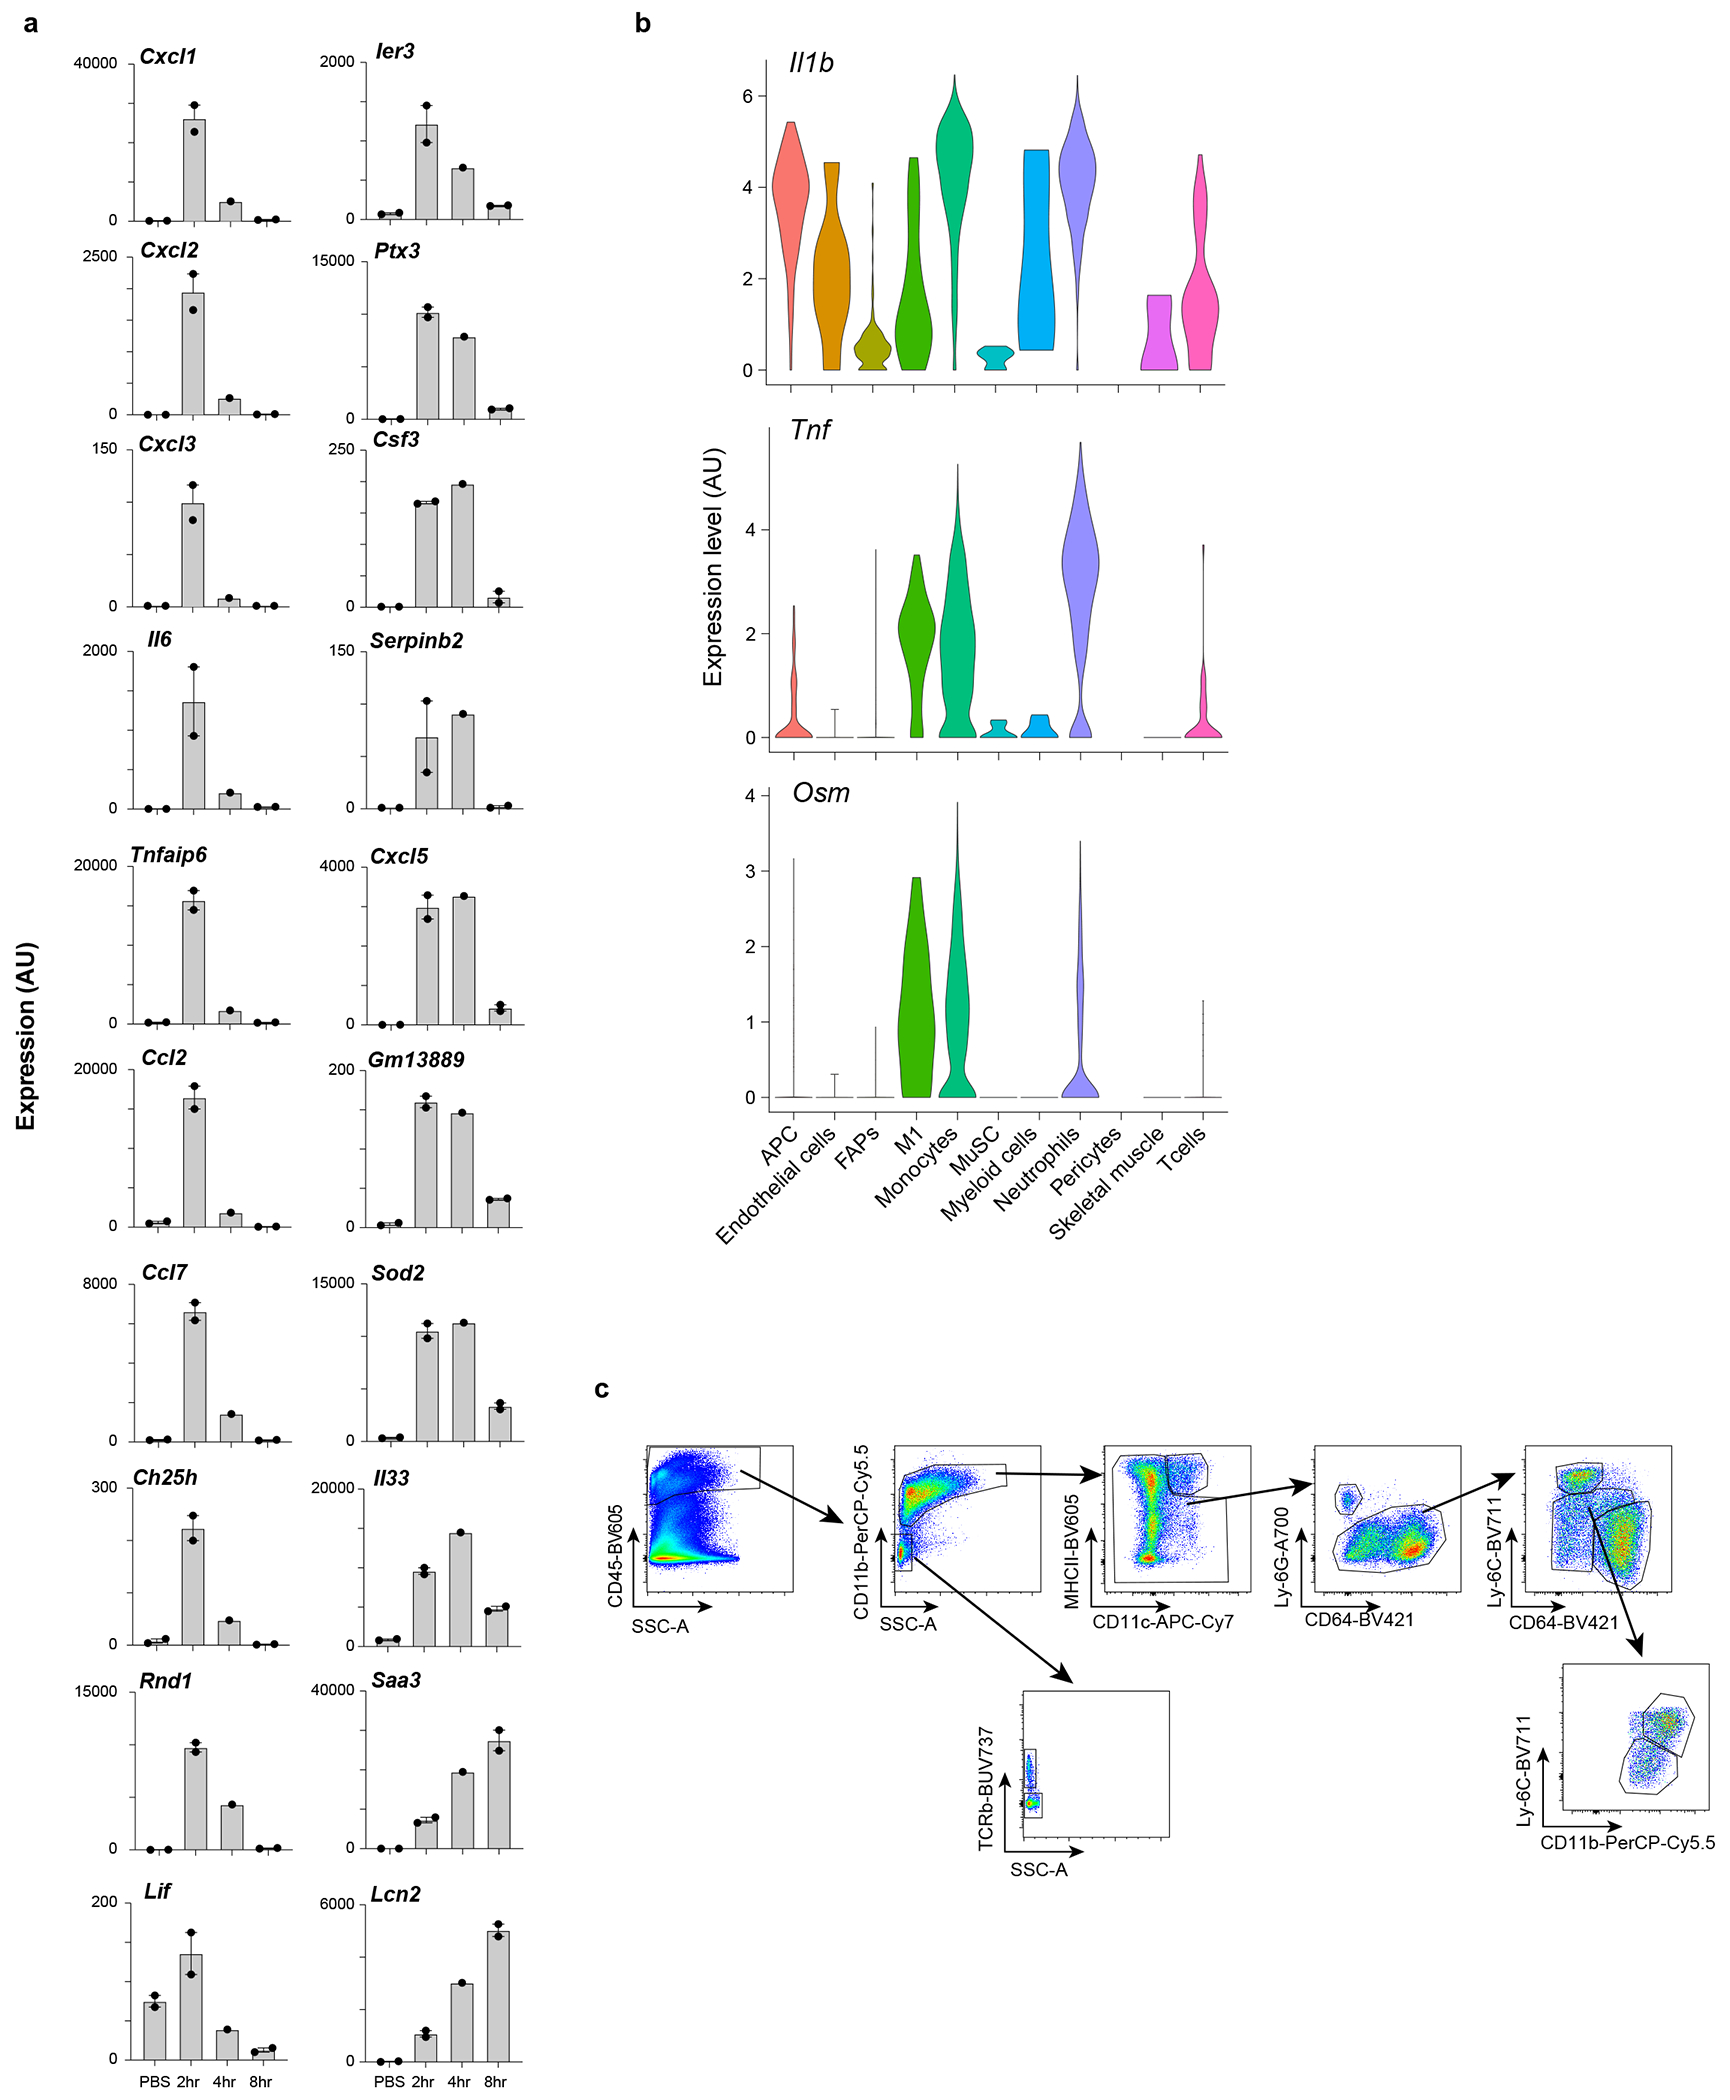
a, Population-level RNAseq of MmSCs isolated at 2 (n = 2), 4 (n = 1) or 8 (n = 2) hrs after ip co-injection of IL-1β, TNFα, OSM and IL-17A vs after PBS injection (n = 2). Expression levels across time-points of the top 20 transcripts from the 100-gene inflammatory signature most differentially expressed. Y-axes plot values in arbitrary units. Each data point represents an individual mouse. b, Violin plots of Il1b, Tnf and Osm expression across cell populations in skeletal muscle on D0.5 after CTX-induced injury. scRNA-seq dataset as per16. Cell nomenclature as per original dataset. c, Gating strategy for the cytofluorimetric analysis of diverse immunocyte populations from hindlimb muscles. AU, arbitrary units; APC, antigen-presenting cells; FAPs, fibro/adipogenic progenitors; M1, inflammatory MFs; MuSC, muscle stem cells; PBS, phosphate-buffered saline; FC, fold-change.
Extended Data Fig. 3: Impact of the loss of IL-1β, TNFα and OSM on MmSC inflammatory phenotypes.
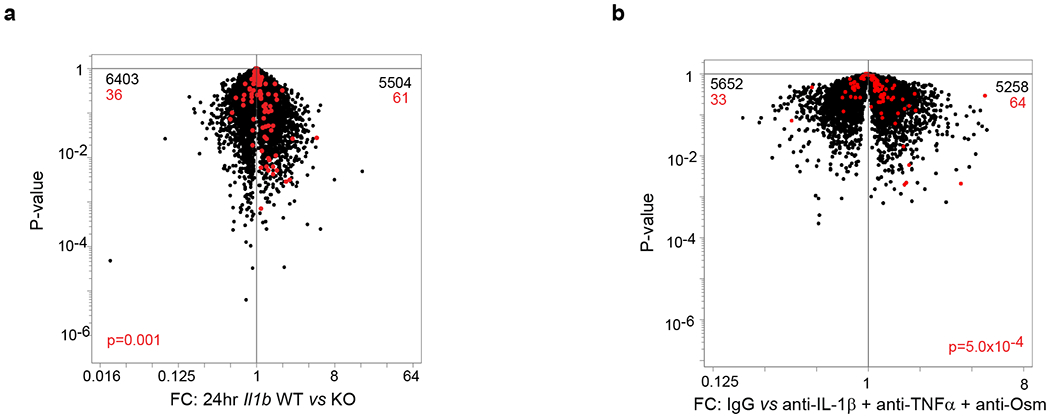
a, Population-level RNAseq of MmSCs isolated from Il1b knock-out (KO) (n = 3) and wild-type (WT) (n = 2) littermates at D1 following CTX-induced injury. Volcano-plot comparison of the different conditions. The 100-gene inflammatory signature is shown in red, with numbers at the top indicating up- and down-regulated transcripts (in comparison with total transcript numbers in black). b, Same as (a) except B6 mice were treated with a combination of IL-1β, TNFα and OSM neutralizing antibodies or IgG isotype controls. P determined by Chi-squared test.
Extended Data Fig. 4: Il6 and Cxcl5 expression in MmSCs at D1 and across skeletal muscle cell populations at homeostasis and various time-points after injury.
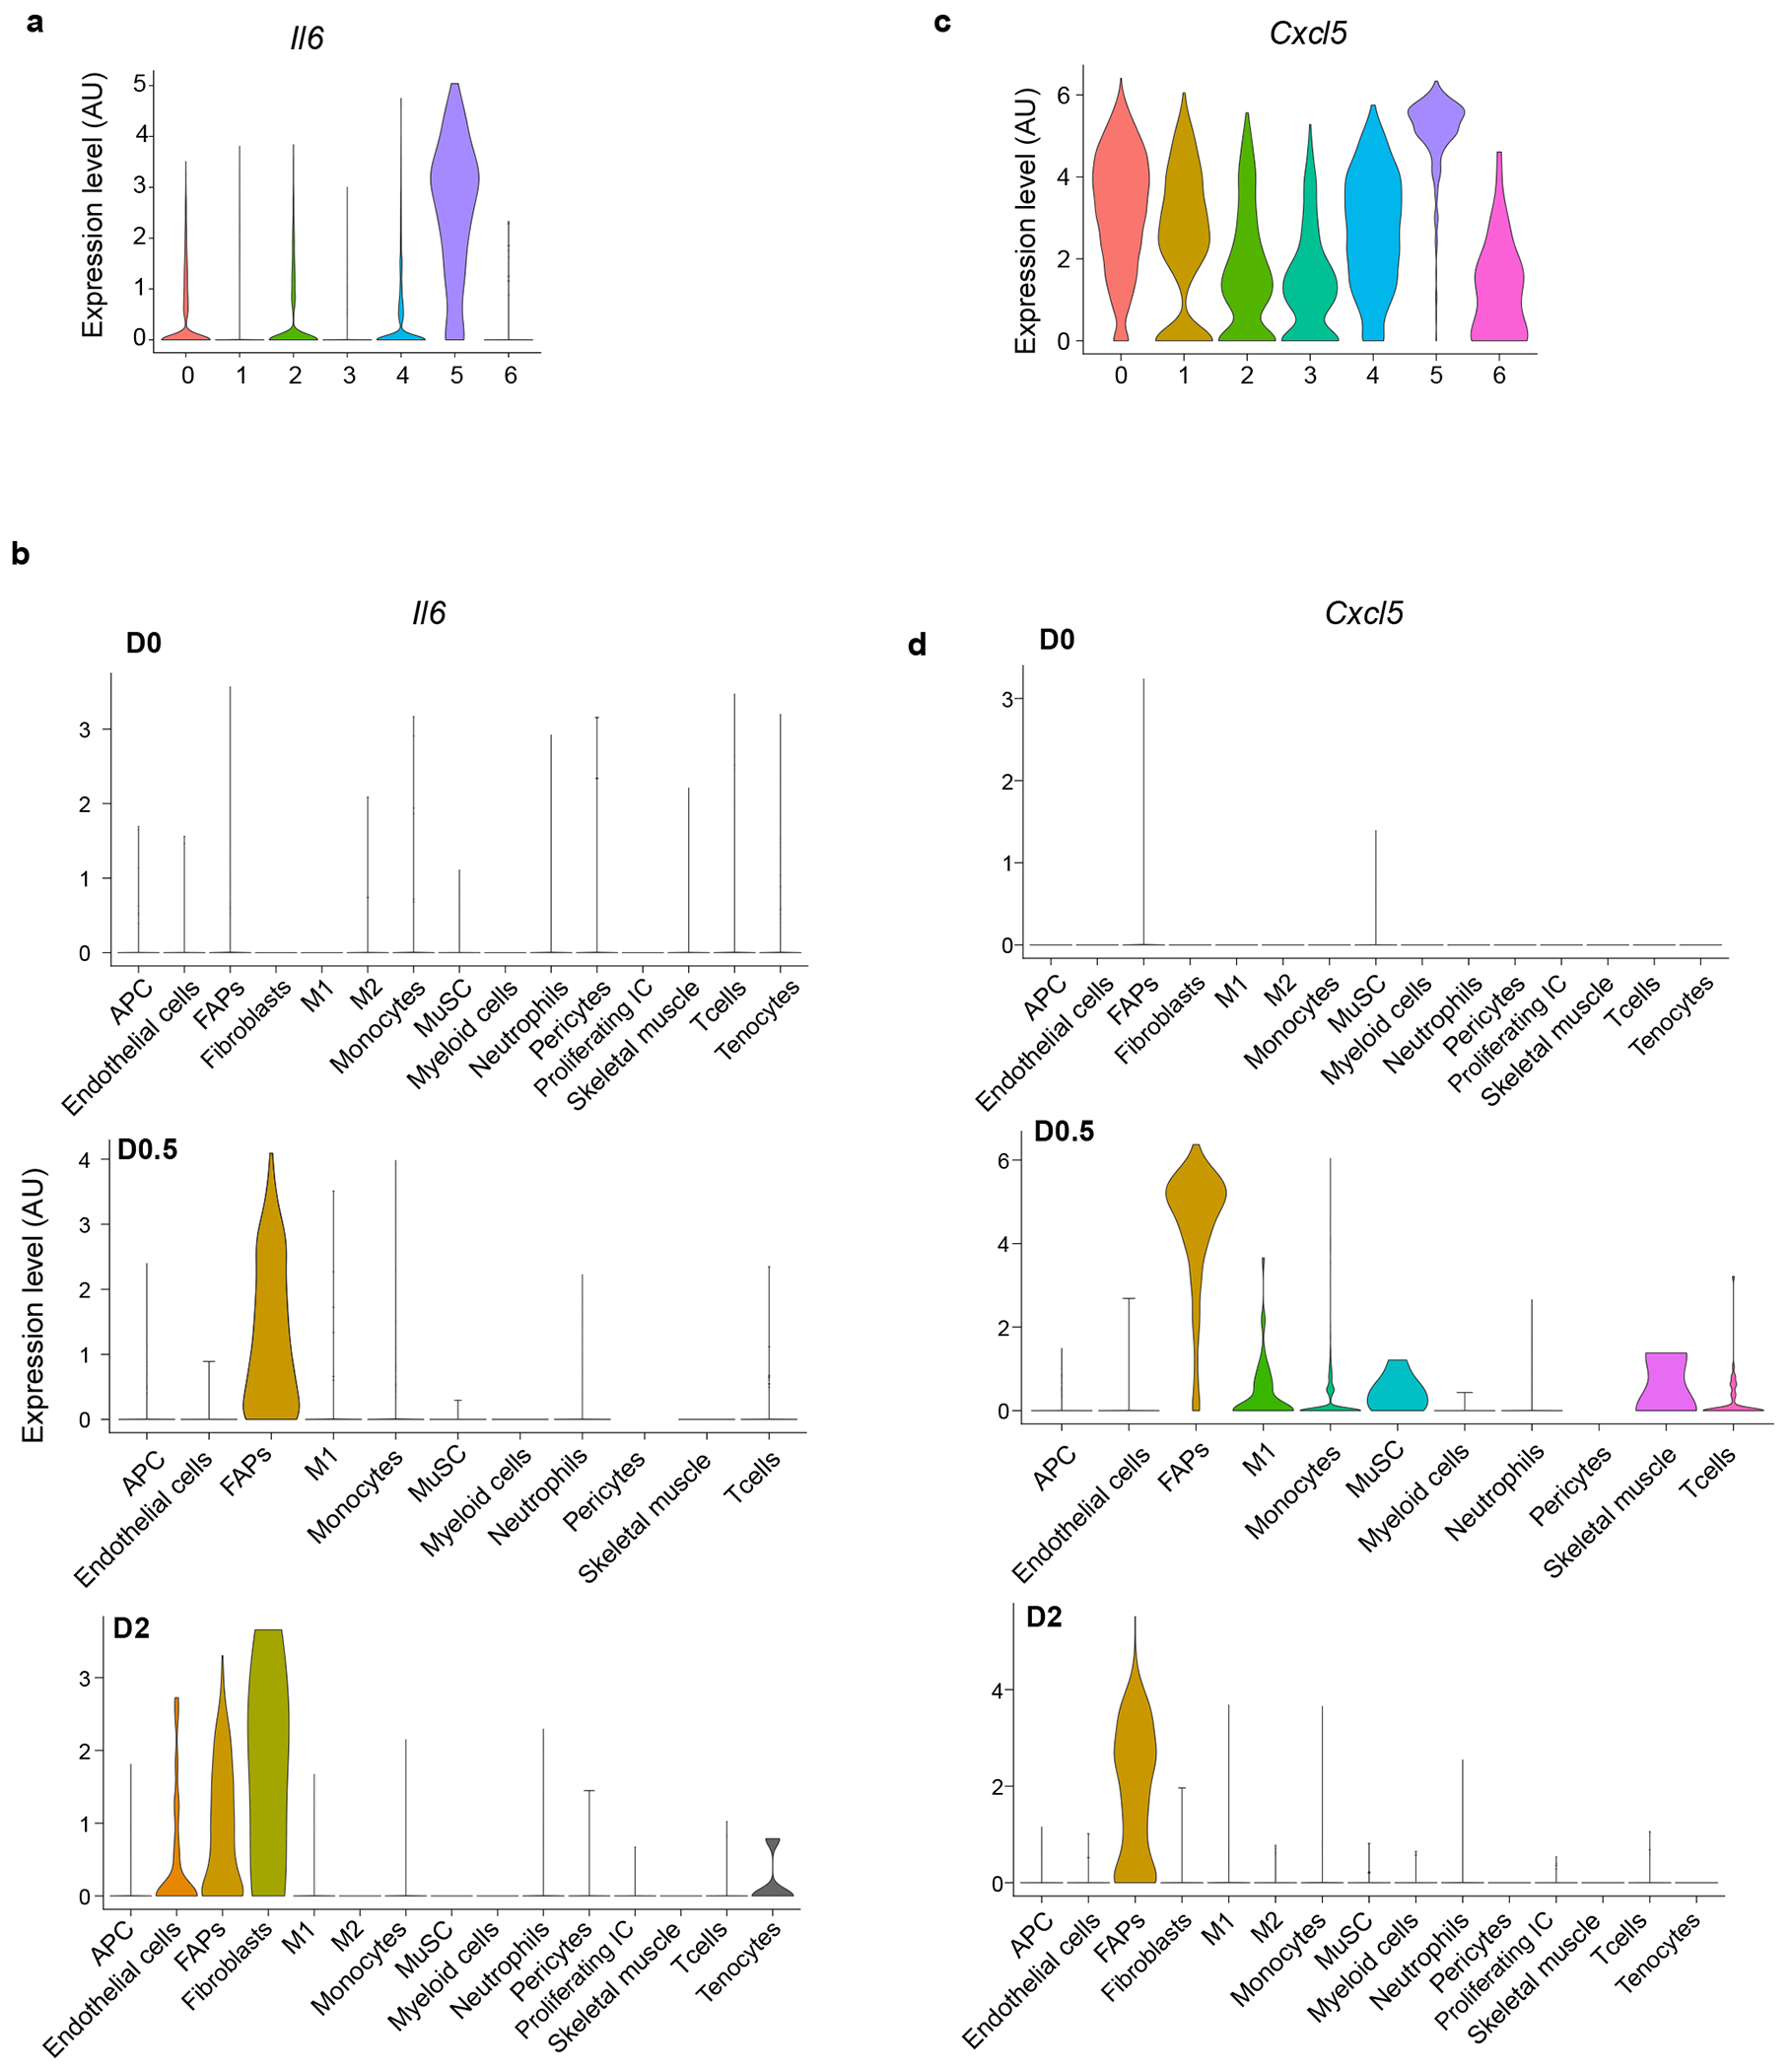
a, Violin plot of Il6 expression across all MmSCs clusters on D1 following CTX-induced injury. b, Violin plot of Il6 expression across cell populations in skeletal muscle at homeostasis, as per16. c, Violin plot of Cxcl5 expression across all MmSCs clusters on D1 following CTX-induced injury. d, Violin plot of Cxcl5 expression across cell populations in skeletal muscle at homeostasis, as per16. M2, reparative MFs; Proliferating IC, proliferating immune cells; other abbreviations as per Extended Data Fig 2. Cell nomenclature as per original dataset.
Extended Data Fig. 5: Expression of 100-gene inflammatory signature in immunocytes and MmSCs at homeostasis and upon acute injury.
Fold-change vs fold-change plot of population-level RNAseq of CD45+ cells and MmSCs at D0 and D1 following CTX-induced injury (n = 3 per group). The 100-gene inflammatory signature is shown in red. Abbreviations as per Extended Data Fig 1.
Extended Data Table 1:
CTX-induced inflammatory signatures
| Gene | Fold change (FC) | Cluster 5 - Pct cells gene is detected | Rest of clusters - Pct of cells gene is detected | P-value | Adjusted p-value | avg_log2FC | |
|---|---|---|---|---|---|---|---|
| 1 | Saa3 | 19.00 | 0.80 | 0.39 | 6.5E-98 | 1.7E-93 | 4.25 |
| 2 | Csf3 | 11.69 | 0.55 | 0.04 | 0.0E+00 | 0.0E+00 | 3.55 |
| 3 | II6 | 11.46 | 0.89 | 0.27 | 5.2E-195 | 1.3E-190 | 3.52 |
| 4 | Cxcl2 | 9.76 | 0.67 | 0.20 | 5.2E-110 | 1.3E-105 | 3.29 |
| 5 | Cxcl1 | 6.60 | 0.99 | 0.78 | 4.9E-141 | 1.3E-136 | 2.72 |
| 6 | Ptx3 | 6.55 | 0.98 | 0.75 | 9.3E-122 | 2.4E-117 | 2.71 |
| 7 | Cxcl5 | 5.54 | 1.00 | 0.86 | 7.5E-145 | 1.9E-140 | 2.47 |
| 8 | Rnd1 | 5.41 | 0.78 | 0.13 | 6.6E-264 | 1.7E-259 | 2.44 |
| 9 | Cxcl3 | 5.02 | 0.51 | 0.16 | 3.5E-71 | 9.1E-67 | 2.33 |
| 10 | Tnfaip6 | 4.62 | 0.91 | 0.57 | 1.6E-85 | 4.2E-81 | 2.21 |
| 11 | Sod2 | 4.39 | 1.00 | 0.80 | 2.6E-170 | 6.7E-166 | 2.14 |
| 12 | Serpinb2 | 3.75 | 0.17 | 0.07 | 1.7E-11 | 4.5E-07 | 1.91 |
| 13 | Ccl2 | 3.11 | 0.99 | 0.86 | 7.1E-65 | 1.8E-60 | 1.64 |
| 14 | Ier3 | 3.01 | 0.86 | 0.44 | 6.8E-81 | 1.8E-76 | 1.59 |
| 15 | Lcn2 | 2.97 | 0.47 | 0.15 | 4.2E-56 | 1.1E-51 | 1.57 |
| 16 | Gm13889 | 2.86 | 0.27 | 0.07 | 4.3E-43 | 1.1E-38 | 1.51 |
| 17 | II33 | 2.85 | 0.85 | 0.58 | 1.9E-53 | 5.0E-49 | 1.51 |
| 18 | Ch25h | 2.80 | 0.42 | 0.06 | 7.7E-138 | 2.0E-133 | 1.48 |
| 19 | Ccl7 | 2.57 | 1.00 | 0.94 | 4.4E-59 | 1.1E-54 | 1.36 |
| 20 | Lif | 2.53 | 0.41 | 0.05 | 5.7E-169 | 1.5E-164 | 1.34 |
| 21 | Mt2 | 2.51 | 1.00 | 1.00 | 6.9E-120 | 1.8E-115 | 1.33 |
| 22 | Mt1 | 2.35 | 1.00 | 1.00 | 1.7E-99 | 4.4E-95 | 1.23 |
| 23 | Timp1 | 2.34 | 1.00 | 0.98 | 2.1E-72 | 5.3E-68 | 1.23 |
| 24 | Uap1 | 2.32 | 0.95 | 0.78 | 7.7E-50 | 2.0E-45 | 1.22 |
| 25 | Nfkbia | 2.27 | 0.98 | 0.76 | 1.2E-74 | 3.1E-70 | 1.18 |
| 26 | Cebpb | 2.23 | 0.99 | 0.90 | 5.2E-95 | 1.3E-90 | 1.16 |
| 27 | Ddit4 | 2.16 | 0.61 | 0.20 | 2.5E-79 | 6.4E-75 | 1.11 |
| 28 | Fst | 2.15 | 0.82 | 0.48 | 4.6E-51 | 1.2E-46 | 1.10 |
| 29 | Fth1 | 2.09 | 1.00 | 1.00 | 7.0E-63 | 1.8E-58 | 1.06 |
| 30 | Adamts1 | 2.01 | 0.79 | 0.41 | 1.2E-52 | 3.0E-48 | 1.01 |
| 31 | Has1 | 2.00 | 0.75 | 0.48 | 7.8E-24 | 2.0E-19 | 1.00 |
| 32 | Ptqs2 | 1.97 | 0.43 | 0.12 | 6.0E-63 | 1.6E-58 | 0.98 |
| 33 | Lmcd1 | 1.92 | 0.29 | 0.14 | 2.5E-14 | 6.4E-10 | 0.94 |
| 34 | Ass1 | 1.91 | 0.59 | 0.32 | 2.0E-30 | 5.1E-26 | 0.93 |
| 35 | Socs3 | 1.91 | 0.89 | 0.62 | 1.8E-49 | 4.7E-45 | 0.93 |
| 36 | Tnip1 | 1.89 | 0.60 | 0.18 | 8.8E-91 | 2.3E-86 | 0.92 |
| 37 | Hif1a | 1.86 | 0.92 | 0.56 | 1.6E-55 | 4.1E-51 | 0.89 |
| 38 | Ptqes | 1.82 | 0.64 | 0.30 | 9.5E-49 | 2.5E-44 | 0.86 |
| 39 | Smim3 | 1.80 | 0.75 | 0.30 | 3.4E-76 | 8.7E-72 | 0.85 |
| 40 | Zc3h12a | 1.79 | 0.56 | 0.12 | 1.4E-122 | 3.5E-118 | 0.84 |
| 41 | Nqf | 1.77 | 0.32 | 0.14 | 5.7E-20 | 1.5E-15 | 0.82 |
| 42 | Prq4 | 1.76 | 0.96 | 0.91 | 8.8E-17 | 2.3E-12 | 0.82 |
| 43 | Cyp7b1 | 1.74 | 0.51 | 0.18 | 1.8E-51 | 4.6E-47 | 0.80 |
| 44 | Tnc | 1.67 | 0.54 | 0.34 | 3.1E-13 | 8.1E-09 | 0.74 |
| 45 | Angptl4 | 1.66 | 0.94 | 0.82 | 3.6E-28 | 9.3E-24 | 0.73 |
| 46 | Slc39a14 | 1.66 | 0.89 | 0.56 | 3.8E-49 | 9.7E-45 | 0.73 |
| 47 | Phlda1 | 1.64 | 0.90 | 0.70 | 1.8E-28 | 4.6E-24 | 0.72 |
| 48 | Cxcl14 | 1.63 | 0.98 | 0.89 | 8.0E-25 | 2.1E-20 | 0.71 |
| 49 | Inhba | 1.63 | 0.32 | 0.14 | 8.0E-21 | 2.1E-16 | 0.70 |
| 50 | Glrx | 1.62 | 0.55 | 0.30 | 1.2E-27 | 3.1E-23 | 0.70 |
| 51 | Id3 | 1.62 | 0.92 | 0.77 | 9.7E-24 | 2.5E-19 | 0.70 |
| 52 | Serpine1 | 1.61 | 0.68 | 0.48 | 1.3E-12 | 3.4E-08 | 0.69 |
| 53 | Gch1 | 1.60 | 0.48 | 0.12 | 1.1E-76 | 2.8E-72 | 0.68 |
| 54 | Hspa5 | 1.59 | 0.99 | 0.95 | 6.5E-27 | 1.7E-22 | 0.66 |
| 55 | Icam1 | 1.55 | 0.59 | 0.31 | 9.0E-29 | 2.3E-24 | 0.63 |
| 56 | Adora2b | 1.53 | 0.51 | 0.24 | 2.5E-31 | 6.6E-27 | 0.61 |
| 57 | Gpm6b | 1.51 | 0.75 | 0.43 | 7.1E-37 | 1.8E-32 | 0.60 |
| 58 | Herpud1 | 1.51 | 0.68 | 0.50 | 1.0E-15 | 2.7E-11 | 0.59 |
| 59 | Slc16a1 | 1.50 | 0.57 | 0.27 | 2.8E-35 | 7.2E-31 | 0.58 |
| 60 | Golqa3 | 1.49 | 0.17 | 0.11 | 2.3E-03 | 1.0E+00 | 0.58 |
| 61 | Acsl4 | 1.49 | 0.59 | 0.26 | 2.1E-40 | 5.3E-36 | 0.57 |
| 62 | Tnfsf11 | 1.47 | 0.23 | 0.04 | 1.9E-52 | 4.9E-48 | 0.56 |
| 63 | Tm4sf1 | 1.47 | 0.88 | 0.75 | 3.3E-14 | 8.6E-10 | 0.56 |
| 64 | Pi15 | 1.46 | 0.30 | 0.12 | 1.9E-21 | 4.9E-17 | 0.55 |
| 65 | Tnfaip3 | 1.46 | 0.25 | 0.04 | 6.6E-73 | 1.7E-68 | 0.55 |
| 66 | Ell2 | 1.46 | 0.43 | 0.11 | 6.5E-70 | 1.7E-65 | 0.54 |
| 67 | Cfb | 1.45 | 0.40 | 0.16 | 3.3E-28 | 8.5E-24 | 0.54 |
| 68 | Znrf1 | 1.45 | 0.64 | 0.36 | 1.3E-28 | 3.4E-24 | 0.54 |
| 69 | Fgf7 | 1.44 | 0.46 | 0.23 | 6.6E-22 | 1.7E-17 | 0.53 |
| 70 | Cyp1b1 | 1.44 | 0.35 | 0.11 | 1.1E-39 | 2.7E-35 | 0.53 |
| 71 | Ctsc | 1.44 | 0.52 | 0.25 | 6.0E-26 | 1.6E-21 | 0.53 |
| 72 | Rdh10 | 1.44 | 0.69 | 0.48 | 4.1E-17 | 1.1E-12 | 0.52 |
| 73 | Rnf19b | 1.43 | 0.51 | 0.20 | 2.6E-40 | 6.6E-36 | 0.52 |
| 74 | Manf | 1.42 | 0.94 | 0.90 | 5.2E-23 | 1.4E-18 | 0.51 |
| 75 | Rqcc | 1.42 | 0.39 | 0.14 | 1.1E-35 | 2.8E-31 | 0.51 |
| 76 | Ldha | 1.42 | 0.98 | 0.92 | 3.7E-26 | 9.6E-22 | 0.51 |
| 77 | Cebpd | 1.42 | 0.96 | 0.80 | 1.3E-20 | 3.5E-16 | 0.50 |
| 78 | Sphk1 | 1.41 | 0.64 | 0.30 | 5.1E-37 | 1.3E-32 | 0.50 |
| 79 | Ptpn2 | 1.40 | 0.56 | 0.26 | 4.4E-34 | 1.1E-29 | 0.49 |
| 80 | Dnajb6 | 1.38 | 0.77 | 0.60 | 2.8E-17 | 7.1E-13 | 0.47 |
| 81 | Slc9a3r1 | 1.37 | 0.21 | 0.04 | 4.9E-46 | 1.3E-41 | 0.46 |
| 82 | Nfkb1 | 1.37 | 0.55 | 0.29 | 1.2E-22 | 3.1E-18 | 0.45 |
| 83 | Dnajb9 | 1.36 | 0.69 | 0.47 | 7.9E-19 | 2.0E-14 | 0.44 |
| 84 | Ehd1 | 1.35 | 0.68 | 0.46 | 1.4E-17 | 3.5E-13 | 0.44 |
| 85 | Trdc | 1.35 | 0.12 | 0.01 | 1.2E-68 | 3.2E-64 | 0.43 |
| 86 | Emb | 1.35 | 0.30 | 0.11 | 3.4E-23 | 8.8E-19 | 0.43 |
| 87 | Dbx2 | 1.35 | 0.20 | 0.04 | 1.2E-50 | 3.2E-46 | 0.43 |
| 88 | Zfp36l1 | 1.35 | 0.75 | 0.54 | 1.4E-16 | 3.6E-12 | 0.43 |
| 89 | Gm12840 | 1.35 | 0.27 | 0.18 | 3.6E-05 | 9.3E-01 | 0.43 |
| 90 | Prdx6 | 1.34 | 0.89 | 0.73 | 5.9E-14 | 1.5E-09 | 0.43 |
| 91 | Clmp | 1.34 | 0.67 | 0.47 | 6.4E-17 | 1.7E-12 | 0.43 |
| 92 | Il1r1 | 1.33 | 0.71 | 0.44 | 2.0E-20 | 5.0E-16 | 0.41 |
| 93 | Fosl2 | 1.33 | 0.54 | 0.27 | 4.4E-25 | 1.1E-20 | 0.41 |
| 94 | Mcoln2 | 1.33 | 0.35 | 0.11 | 1.3E-35 | 3.4E-31 | 0.41 |
| 95 | Mt4 | 1.33 | 0.14 | 0.03 | 6.4E-24 | 1.6E-19 | 0.41 |
| 96 | Slfn2 | 1.33 | 0.33 | 0.11 | 1.1E-33 | 2.9E-29 | 0.41 |
| 97 | Sox11 | 1.32 | 0.13 | 0.03 | 3.2E-21 | 8.3E-17 | 0.41 |
| 98 | Ccn4 | 1.32 | 0.40 | 0.15 | 2.6E-33 | 6.8E-29 | 0.40 |
| 99 | Alpl | 1.31 | 0.42 | 0.18 | 2.7E-26 | 7.1E-22 | 0.39 |
| 100 | Nfkbib | 1.31 | 0.58 | 0.33 | 7.3E-23 | 1.9E-18 | 0.39 |
ACKNOWLEDGMENTS:
We thank: T. Korn and S. Heink for the IL-6 reporter/depleter line; A. Muñoz-Rojas, G. Wang, T. Xiao, S. Galván-Peña, K. Hattori, A. Ortiz-Lopez, V. Piekarsa, N. Asinovski, F. Chen and S. Nepal for experimental assistance; K. Seddu, A. Baysoy, J. Lee, I. Magill and the Broad Genomics Platform for RNA-seq; A. Muñoz-Rojas, L. Yang, B. Vijaykumar and N. Patel for computational help; C. Laplace for graphics; the Harvard Medical School (HMS) Immunology Flow Core; the HMS MiCRoN Core; the HMS Rodent Histopathology Core; and R.G. Spallanzani, A. Muñoz-Rojas, A. Mann, D. Owen, J. Leon and G. Wang for insightful discussions. This work was funded by NIH grant R01 AR070334 (D.M.), the JPB Foundation (D.M.) and the NIH training grant T32GM007753 (O.K.Y., D.A.M. and T.J.). B.S.H. was partially supported by a Deutsche Forschungsgemeinschaft fellowship (HA 8510/1) and P.K.L. by F32 AG072874.
Footnotes
COMPETING INTERESTS:
The authors declare no competing financial interests.
Code Availability
No custom code was generated for this study. Algorithms used for data processing and analysis are referenced in the Methods section.
Data availability
New data generated in this paper were deposited in Gene Expression Omnibus (GEO) database under accession number GSE205738.
REFERENCES
- 1.Robertson TA, Grounds MD, Mitchell CA, & Papadimitriou JM Fusion between myogenic cells in vivo: an ultrastructural study in regenerating murine skeletal muscle. J Struct. Biol 105, 170–182 (1990). [DOI] [PubMed] [Google Scholar]
- 2.Kuang S, Kuroda K, Le GF, & Rudnicki MA Asymmetric self-renewal and commitment of satellite stem cells in muscle. Cell 129, 999–1010 (2007). [DOI] [PMC free article] [PubMed] [Google Scholar]
- 3.Sacco A et al. Self-renewal and expansion of single transplanted muscle stem cells. Nature 456, 502–506 (2008). [DOI] [PMC free article] [PubMed] [Google Scholar]
- 4.von Maltzahn J, Jones AE, Parks RJ, & Rudnicki MA Pax7 is critical for the normal function of satellite cells in adult skeletal muscle. Proc Natl Acad Sci U S A 110, 16474–16479 (2013). [DOI] [PMC free article] [PubMed] [Google Scholar]
- 5.Sambasivan R et al. Pax7-expressing satellite cells are indispensable for adult skeletal muscle regeneration. Development 138, 3647–3656 (2011). [DOI] [PubMed] [Google Scholar]
- 6.Lepper C, Partridge TA, & Fan CM An absolute requirement for Pax7-positive satellite cells in acute injury-induced skeletal muscle regeneration. Development 138, 3639–3646 (2011). [DOI] [PMC free article] [PubMed] [Google Scholar]
- 7.Murphy MM et al. Satellite cells, connective tissue fibroblasts and their interactions are crucial for muscle regeneration. Development 138, 3625–3637 (2011). [DOI] [PMC free article] [PubMed] [Google Scholar]
- 8.Belcastro AN, Arthur GD, Albisser TA, & Raj DA Heart, liver, and skeletal muscle myeloperoxidase activity during exercise. J Appl. Physiol 80, 1331–1335 (1996). [DOI] [PubMed] [Google Scholar]
- 9.Teixeira CF et al. Neutrophils do not contribute to local tissue damage, but play a key role in skeletal muscle regeneration, in mice injected with Bothrops asper snake venom. Muscle Nerve 28, 449–459 (2003). [DOI] [PubMed] [Google Scholar]
- 10.Brigitte M et al. Muscle resident macrophages control the immune cell reaction in a mouse model of notexin-induced myoinjury. Arthritis Rheum. 62, 268–279 (2010). [DOI] [PubMed] [Google Scholar]
- 11.St Pierre BA & Tidball JG Differential response of macrophage subpopulations to soleus muscle reloading after rat hindlimb suspension. J Appl. Physiol 77, 290–297 (1994). [DOI] [PubMed] [Google Scholar]
- 12.Saclier M et al. Differentially activated macrophages orchestrate myogenic precursor cell fate during human skeletal muscle regeneration. Stem Cells 31, 384–396 (2013). [DOI] [PubMed] [Google Scholar]
- 13.Tonkin J et al. Monocyte/macrophage-derived IGF-1 orchestrates murine skeletal muscle regeneration and modulates autocrine polarization. Mol Ther. 23, 1189–1200 (2015). [DOI] [PMC free article] [PubMed] [Google Scholar]
- 14.Deng B et al. IL-10 triggers changes in macrophage phenotype that promote muscle growth and regeneration. J Immunol 189, 3669–3680 (2012). [DOI] [PMC free article] [PubMed] [Google Scholar]
- 15.De Micheli AJ et al. Single-cell analysis of the muscle stem cell hierarchy identifies heterotypic communication signals involved in skeletal muscle regeneration. Cell Rep 30, 3583–3595 (2020). [DOI] [PMC free article] [PubMed] [Google Scholar]
- 16.Oprescu SN et al. Temporal dynamics and heterogeneity of cell populations during skeletal muscle regeneration. iScience. 23, 100993 (2020). [DOI] [PMC free article] [PubMed] [Google Scholar]
- 17.Arnold L et al. Inflammatory monocytes recruited after skeletal muscle injury switch into antiinflammatory macrophages to support myogenesis. J Exp. Med 204, 1057–1069 (2007). [DOI] [PMC free article] [PubMed] [Google Scholar]
- 18.Burzyn D et al. A special population of regulatory T cells potentiates muscle repair. Cell 155, 1282–1295 (2013). [DOI] [PMC free article] [PubMed] [Google Scholar]
- 19.Castiglioni A et al. FOXP3+ T cells recruited to sites of sterile skeletal muscle injury regulate the fate of satellite cells and guide effective tissue regeneration. PLoS. ONE 10, e0128094 (2015). [DOI] [PMC free article] [PubMed] [Google Scholar]
- 20.Panduro M, Benoist C, & Mathis D Treg cells limit IFN-γ production to control macrophage accrual and phenotype during skeletal muscle regeneration. Proc Natl Acad Sci U S A 115, E2585–E2593 (2018). [DOI] [PMC free article] [PubMed] [Google Scholar]
- 21.Wosczyna MN et al. Mesenchymal stromal cells are required for regeneration and homeostatic maintenance of skeletal muscle. Cell Rep 27, 2029–2035 (2019). [DOI] [PMC free article] [PubMed] [Google Scholar]
- 22.Uezumi A et al. Mesenchymal Bmp3b expression maintains skeletal muscle integrity and decreases in age-related sarcopenia. J Clin Invest 131, (2021). [DOI] [PMC free article] [PubMed] [Google Scholar]
- 23.Joe AW et al. Muscle injury activates resident fibro/adipogenic progenitors that facilitate myogenesis. Nat Cell Biol. 12, 153–163 (2010). [DOI] [PMC free article] [PubMed] [Google Scholar]
- 24.Uezumi A et al. Mesenchymal progenitors distinct from satellite cells contribute to ectopic fat cell formation in skeletal muscle. Nat Cell Biol. 12, 143–152 (2010). [DOI] [PubMed] [Google Scholar]
- 25.Uezumi A et al. Fibrosis and adipogenesis originate from a common mesenchymal progenitor in skeletal muscle. J. Cell Sci 124, 3654–3664 (2011). [DOI] [PubMed] [Google Scholar]
- 26.Oishi T et al. Osteogenic differentiation capacity of human skeletal muscle-derived progenitor cells. PLoS One 8, e56641 (2013). [DOI] [PMC free article] [PubMed] [Google Scholar]
- 27.Wosczyna MN, Biswas AA, Cogswell CA, & Goldhamer DJ Multipotent progenitors resident in the skeletal muscle interstitium exhibit robust BMP-dependent osteogenic activity and mediate heterotopic ossification. J Bone Miner. Res 27, 1004–1017 (2012). [DOI] [PMC free article] [PubMed] [Google Scholar]
- 28.Lemos DR et al. Nilotinib reduces muscle fibrosis in chronic muscle injury by promoting TNF-mediated apoptosis of fibro/adipogenic progenitors. Nat Med 21, 786–794 (2015). [DOI] [PubMed] [Google Scholar]
- 29.Kopinke D, Roberson EC, & Reiter JF Ciliary hedgehog signaling restricts injury-induced adipogenesis. Cell 170, 340–351 (2017). [DOI] [PMC free article] [PubMed] [Google Scholar]
- 30.Mozzetta C et al. Fibroadipogenic progenitors mediate the ability of HDAC inhibitors to promote regeneration in dystrophic muscles of young, but not old Mdx mice. EMBO Mol. Med 5, 626–639 (2013). [DOI] [PMC free article] [PubMed] [Google Scholar]
- 31.Hogarth MW et al. Fibroadipogenic progenitors are responsible for muscle loss in limb girdle muscular dystrophy 2B. Nat Commun 10, 2430 (2019). [DOI] [PMC free article] [PubMed] [Google Scholar]
- 32.Contreras O et al. Connective tissue cells expressing fibro/adipogenic progenitor markers increase under chronic damage: relevance in fibroblast-myofibroblast differentiation and skeletal muscle fibrosis. Cell Tissue Res. 364, 647–660 (2016). [DOI] [PubMed] [Google Scholar]
- 33.Ieronimakis N et al. PDGFRα signalling promotes fibrogenic responses in collagen-producing cells in Duchenne muscular dystrophy. J Pathol. 240, 410–424 (2016). [DOI] [PMC free article] [PubMed] [Google Scholar]
- 34.Mazala DA et al. TGF-β-driven muscle degeneration and failed regeneration underlie disease onset in a DMD mouse model. JCI. Insight 5, (2020). [DOI] [PMC free article] [PubMed] [Google Scholar]
- 35.Lukjanenko L et al. Aging disrupts muscle stem cell function by impairing matricellular WISP1 secretion from fibro-adipogenic progenitors. Cell Stem Cell 24, 433–446 (2019). [DOI] [PMC free article] [PubMed] [Google Scholar]
- 36.Iezzi S et al. Deacetylase inhibitors increase muscle cell size by promoting myoblast recruitment and fusion through induction of follistatin. Dev. Cell 6, 673–684 (2004). [DOI] [PubMed] [Google Scholar]
- 37.Reggio A et al. Adipogenesis of skeletal muscle fibro/adipogenic progenitors is affected by the WNT5a/GSK3/β-catenin axis. Cell Death. Differ 27, 2921–2941 (2020). [DOI] [PMC free article] [PubMed] [Google Scholar]
- 38.Fiore D et al. Pharmacological blockage of fibro/adipogenic progenitor expansion and suppression of regenerative fibrogenesis is associated with impaired skeletal muscle regeneration. Stem Cell Res. 17, 161–169 (2016). [DOI] [PubMed] [Google Scholar]
- 39.Calve S, Odelberg SJ, & Simon HG A transitional extracellular matrix instructs cell behavior during muscle regeneration. Dev. Biol 344, 259–271 (2010). [DOI] [PMC free article] [PubMed] [Google Scholar]
- 40.Pisconti A et al. Syndecan-3 and notch cooperate in regulating adult myogenesis. J Cell Biol 190, 427–441 (2010). [DOI] [PMC free article] [PubMed] [Google Scholar]
- 41.Silver JS et al. Injury-mediated stiffening persistently activates muscle stem cells through YAP and TAZ mechanotransduction. Sci Adv. 7, (2021). [DOI] [PMC free article] [PubMed] [Google Scholar]
- 42.Gilbert PM et al. Substrate elasticity regulates skeletal muscle stem cell self-renewal in culture. Science 329, 1078–1081 (2010). [DOI] [PMC free article] [PubMed] [Google Scholar]
- 43.Buechler MB et al. Cross-tissue organization of the fibroblast lineage. Nature 593, 575–579 (2021). [DOI] [PubMed] [Google Scholar]
- 44.Scott RW et al. Hic1 defines quiescent mesenchymal progenitor subpopulations with distinct functions and fates in skeletal muscle regeneration. Cell Stem Cell 25, 797–813 (2019). [DOI] [PMC free article] [PubMed] [Google Scholar]
- 45.Tidball JG Regulation of muscle growth and regeneration by the immune system. Nat Rev Immunol 17, 165–178 (2017). [DOI] [PMC free article] [PubMed] [Google Scholar]
- 46.Buechler MB, Fu W, & Turley SJ Fibroblast-macrophage reciprocal interactions in health, fibrosis, and cancer. Immunity 54, 903–915 (2021). [DOI] [PubMed] [Google Scholar]
- 47.Schreiber HA et al. Intestinal monocytes and macrophages are required for T cell polarization in response to Citrobacter rodentium. J Exp Med 210, 2025–2039 (2013). [DOI] [PMC free article] [PubMed] [Google Scholar]
- 48.Heink S et al. Trans-presentation of IL-6 by dendritic cells is required for the priming of pathogenic TH17 cells. Nat Immunol 18, 74–85 (2017). [DOI] [PMC free article] [PubMed] [Google Scholar]
- 49.Mei J et al. CXCL5 regulates chemokine scavenging and pulmonary host defense to bacterial infection. Immunity 33, 106–117 (2010). [DOI] [PMC free article] [PubMed] [Google Scholar]
- 50.Mann AO et al. IL-17A-producing γδT cells promote muscle regeneration in a microbiota-dependent manner. J Exp Med 219, e20211504 (2022). [DOI] [PMC free article] [PubMed] [Google Scholar]
- 51.Seo BR et al. Skeletal muscle regeneration with robotic actuation-mediated clearance of neutrophils. Sci Transl. Med 13, eabe8868 (2021). [DOI] [PMC free article] [PubMed] [Google Scholar]
- 52.Horckmans M et al. Neutrophils orchestrate post-myocardial infarction healing by polarizing macrophages towards a reparative phenotype. Eur. Heart J 38, 187–197 (2017). [DOI] [PubMed] [Google Scholar]
- 53.Aguilar CA et al. In vivo monitoring of transcriptional dynamics after lower-limb muscle injury enables quantitative classification of healing. Sci Rep 5, 13885 (2015). [DOI] [PMC free article] [PubMed] [Google Scholar]
- 54.Forte E et al. Dynamic interstitial cell response during myocardial infarction predicts resilience to rupture in genetically diverse mice. Cell Rep 30, 3149–3163 (2020). [DOI] [PMC free article] [PubMed] [Google Scholar]
- 55.Dominguez CX et al. Single-cell RNA sequencing reveals stromal evolution into LRRC15+ myofibroblasts as a determinant of patient response to cancer immunotherapy. Cancer Discov. 10, 232–253 (2020). [DOI] [PubMed] [Google Scholar]
- 56.Croft AP et al. Distinct fibroblast subsets drive inflammation and damage in arthritis. Nature 570, 246–251 (2019). [DOI] [PMC free article] [PubMed] [Google Scholar]
- 57.Kinchen J et al. Structural remodeling of the human colonic mesenchyme in inflammatory bowel disease. Cell 175, 372–386 (2018). [DOI] [PMC free article] [PubMed] [Google Scholar]
- 58.Zhang F et al. Defining inflammatory cell states in rheumatoid arthritis joint synovial tissues by integrating single-cell transcriptomics and mass cytometry. Nat Immunol 20, 928–942 (2019). [DOI] [PMC free article] [PubMed] [Google Scholar]
- 59.Warren GL et al. Chemokine receptor CCR2 involvement in skeletal muscle regeneration. FASEB J 19, 413–415 (2005). [DOI] [PubMed] [Google Scholar]
- 60.Contreras-Shannon V et al. Fat accumulation with altered inflammation and regeneration in skeletal muscle of CCR2−/− mice following ischemic injury. Am. J Physiol Cell Physiol 292, C953–C967 (2007). [DOI] [PubMed] [Google Scholar]
- 61.Shireman PK et al. MCP-1 deficiency causes altered inflammation with impaired skeletal muscle regeneration. J Leukoc. Biol 81, 775–785 (2007). [DOI] [PubMed] [Google Scholar]
- 62.Martinez CO et al. Regulation of skeletal muscle regeneration by CCR2-activating chemokines is directly related to macrophage recruitment. Am. J Physiol Regul. Integr. Comp Physiol 299, R832–R842 (2010). [DOI] [PMC free article] [PubMed] [Google Scholar]
- 63.Blanc RS et al. Inhibition of inflammatory CCR2 signaling promotes aged muscle regeneration and strength recovery after injury. Nat Commun 11, 4167 (2020). [DOI] [PMC free article] [PubMed] [Google Scholar]
ONLINE REFERENCES
- 64.Bettelli E et al. Reciprocal developmental pathways for the generation of pathogenic effector TH17 and regulatory T cells. Nature 441, 235–238 (2006). [DOI] [PubMed] [Google Scholar]
- 65.Tomura M et al. Monitoring cellular movement in vivo with photoconvertible fluorescence protein “Kaede” transgenic mice. Proc Natl Acad Sci U S A 105, 10871–10876 (2008). [DOI] [PMC free article] [PubMed] [Google Scholar]
- 66.Wang K et al. Neuronal, stromal, and T-regulatory cell crosstalk in murine skeletal muscle. Proc. Natl. Acad. Sci. U. S. A 117, 5402–5408 (2020). [DOI] [PMC free article] [PubMed] [Google Scholar]
- 67.Liu L, Cheung TH, Charville GW, & Rando TA Isolation of skeletal muscle stem cells by fluorescence-activated cell sorting. Nat. Protoc 10, 1612–1624 (2015). [DOI] [PMC free article] [PubMed] [Google Scholar]
- 68.Hao Y et al. Integrated analysis of multimodal single-cell data. Cell 184, 3573–3587 (2021). [DOI] [PMC free article] [PubMed] [Google Scholar]
- 69.Stoeckius M et al. Simultaneous epitope and transcriptome measurement in single cells. Nat Methods 14, 865–868 (2017). [DOI] [PMC free article] [PubMed] [Google Scholar]
- 70.Fang R et al. Comprehensive analysis of single cell ATAC-seq data with snapATAC. Nat Commun 12, 1337 (2021). [DOI] [PMC free article] [PubMed] [Google Scholar]
- 71.Michelson DA et al. Thymic epithelial cells co-opt lineage-defining transcription factors to eliminate autoreactive T cells. Cell 185, 2542–2558 (2022). [DOI] [PMC free article] [PubMed] [Google Scholar]
- 72.Schindelin J et al. Fiji: an open-source platform for biological-image analysis. Nat Methods 9, 676–682 (2012). [DOI] [PMC free article] [PubMed] [Google Scholar]
- 73.Picelli S et al. Smart-seq2 for sensitive full-length transcriptome profiling in single cells. Nat Methods 10, 1096–1098 (2013). [DOI] [PubMed] [Google Scholar]
- 74.Picelli S et al. Full-length RNA-seq from single cells using Smart-seq2. Nat Protoc. 9, 171–181 (2014). [DOI] [PubMed] [Google Scholar]
- 75.Chen EY et al. Enrichr: interactive and collaborative HTML5 gene list enrichment analysis tool. BMC. Bioinformatics. 14, 128 (2013). [DOI] [PMC free article] [PubMed] [Google Scholar]
- 76.Kuleshov MV et al. Enrichr: a comprehensive gene set enrichment analysis web server 2016 update. Nucleic Acids Res. 44, W90–W97 (2016). [DOI] [PMC free article] [PubMed] [Google Scholar]
- 77.Xie Z et al. Gene set knowledge eiscovery with enrichr. Curr. Protoc 1, e90 (2021). [DOI] [PMC free article] [PubMed] [Google Scholar]
Associated Data
This section collects any data citations, data availability statements, or supplementary materials included in this article.
Data Availability Statement
New data generated in this paper were deposited in Gene Expression Omnibus (GEO) database under accession number GSE205738.