

Abstract
Constraining knee flexion of non-disabled individuals could further our understanding regarding the importance of knee joint during gait, which is a common disturbance in individuals with gait impairment. In this study we investigated whether a mechanical constraint of knee flexion in non-disabled adults would lead to compensatory strategies. Eleven non-disabled male adults walked without and with an orthosis that permitted full extension and limited knee flexion up to either 45° or 30°. We analyzed the temporal organization of lower limb kinematics and electromyograms of the rectus femoris, vastus medialis and lateralis, tibialis anterior, semitendinosus, biceps femoris, and gastrocnemius medialis and lateralis. Non-disabled adults compensated for the reduced knee flexion by increasing hip and ankle joint excursions and ankle flexor activation amplitude. Also, these adults shortened pre-swing and lengthened swing duration in the constrained limb and increased the activity of bifunctional hip extensor and knee flexor muscles in the constrained limb in relation to the unconstrained limb. The use of an orthosis that limited knee flexion in non-disabled adults leaded to compensatory strategies in the temporal organization of joint excursions and muscle activations in the constrained limb. The compensatory effects were correlated with the extent of knee flexion constraint.
Keywords: locomotion, myography, kinematics
Introduction
Walking is a complex action of nearly all body segments that are coordinated efficiently (Winter, 1991) within and across limbs, yet, allowing substantial flexibility to adapt to the diverse locomotor contexts (Morton & Bastian, 2006). As such, walking is a result of complex neural and mechanical interactions to provide stability, support, and propulsion of the whole body to efficiently accomplish the locomotor task (Perry, 1992; Winter, 1991).
Although all lower limb joints plays an important role throughout gait and could be compromised by gait abnormalities, the knee contributes mainly to limb mobility and shortening during the swing period (Perry, 1992). The knee muscle activity is then optimized for the whole limb control, which can be exerted through the direct action of biarticular muscles (Zajac, 1993) and through their sensory contribution (Herter et al., 2021). The emphasis of the present study is the reduction of knee flexion during the swing period of gait, which is frequently observed in the paretic limb of individuals with stroke (Boudarham et al., 2014). It is important to note that limited knee flexion during the swing period may reduce toe clearance causing tripping and increasing the risk of falls, as observed in individuals with stroke (Burpee & Lewek, 2015). Thus, the control of knee kinematics in the context of intra- and inter-limb coordination is of significant interest.
The use of wearable passive orthosis that limits knee flexion offers a non-invasive method of causing adaptations in the non-disabled individuals. For example, Cook et al.(1997) investigated the stance period of gait of non-disabled individuals walking with the orthosis that limited knee flexion to either 10° or 25° of the full range. By analysing the vertical ground reaction force component from constrained and unconstrained limbs in non-disabled individuals walking at multiple speeds, they found that the knee flexion constraint increased loading rate, peak, and average forces in the constrained limb, but not the unconstrained limb, which was affected only by the walking speed (Cook et al., 1997). Alternatively, Hutin et al. (2011) compared the knee movement of individuals with stroke (paretic limb) to that of non-disabled adults walking with the constrained to 30° knee flexion orthosis. They found similarities between both groups for gait velocity, stride length, and thigh-shank coordination pattern during the swing period.
The previous studies demonstrated the potential utility of the knee flexion mechanical constraint as a method to provide insights into the gait impairments and their rehabilitation. The understanding of compensatory mechanisms evoked by restraining knee flexion in non-disabled adults may provide further guidance for the locomotor rehabilitation in individuals with gait impairment. For example, knee flexion in the pre-swing phase is critical to accomplish the forward propulsion and swing initiation (Peterson et al., 2010). The details of intra- and inter-limb pattern of kinematic and dynamic adaptations in individuals with limited knee flexion could be uncovered by employing the knee orthosis strategy.
The aim of this study was to investigate whether a mechanical constraint of knee flexion in one limb of non-disabled adults would lead to compensatory strategies expressed in the muscle activity of both constrained and unconstrained limbs. Specifically, the temporal organization of lower limb joint excursions and muscle activations were investigated during the pre-swing phase and swing period of gait as non-disabled adults walked freely and with two different levels of mechanical constraint of a knee flexion (up of 45° and 30°). We hypothesized that non-disabled adults walking with a constrained knee would present (1) the increase in the hip flexion and ankle dorsiflexion to attain toe-clearance and prevent tripping; (2) the increased activation of rectus femoris and tibialis anterior muscles in the constrained limb compared to the unconstrained limb, in order to increase hip and ankle joints’ excursion, and the decreased activation of knee flexors in the constrained limb compared to the unconstrained limb, as the knee flexion will be diminished in the constrained limb; (3) the compensatory effects would increase as the degree of constraint increased.
Methods
Participants
Eleven non-disabled male adults participated in this observational cross-sectional study. Their age, body mass, height, and body mass index were, 26.6±6.5 yrs., 78.3±10.3 kg, 1.77±0.06 m, and 24.9±2.9 kg/m2, respectively. The inclusion criteria were the absence of any known neurological or musculoskeletal injuries that could alter their walking performance. Participants were informed about all study procedures and consented to participate. The Institutional Review Board of Cruzeiro do Sul University approved all procedures and provided study oversight.
Procedures
The motion of lower limbs was tracked using reflective markers placed bilaterally on the anterior and posterior superior iliac crest, lateral and medial femoral epicondyle, tibialis tuberosity, lateral and medial malleolus, inter malleolus, calcaneus, and first and fifth metatarsal head. Additionally, rigid clusters with non-collinear reflective markers were placed on the sacrum, thighs, and shanks. Passive disposable dual Ag/AgCl electrodes, each with circular conductive area having a 1-cm diameter and a 2-cm center-to-center distance, were placed bilaterally on the belly of the following muscles: rectus femoris (RF), vastus medialis (VM), vastus lateralis (VL), tibialis anterior (TA), semitendinosus (ST), biceps femoris long head (BF), gastrocnemius medialis (GM), and gastrocnemius lateralis (GL) and connected to double-differential preamplifiers (dual electrode, Noraxon, Inc.). The placement of electrodes followed the guidelines of the Surface Electromyographic for Non-Invasive Assessment of Muscles (SENIAM) (Hermens et al., 2000). Electrode and wire leads were secured with elastic bands to diminish the motion artifacts.
Prior to data acquisition, participants tried each experimental condition and provided t-pose kinematic calibration trial with all reflective markers to register marker clusters relative to the anatomical landmarks. Afterwards, most of the anatomical landmark single markers were removed and only the cluster, calcaneus, and first and fifth metatarsal head markers remained.
All participants walked shoed at self-selected comfortable speeds on a 10-m walkway (“free condition”). The walkway was instrumented with two embedded force plates (Kistler, model 9286BA) covered with a thin rubber carpet. In addition, all participants walked wearing an orthosis (Knee Ranger Lite-Endurance, DJO) that limited the range of flexion of their right knee to 45° and 30° from full extension in the constrained conditions (i.e., “45° constrained condition” and “30° constrained condition”). The free condition preceded the two randomized constrained conditions.
All signals were digitized and synchronized using a computerized gait analysis with 8 infrared cameras (VICON, Inc.) and a wireless electromiographic (EMG) system with 16 channels (Ultium EMG, Noraxon, Inc.). Kinematics and ground reaction forces were sampled at 100 Hz, and EMG signals were sampled at 2 kHz.
Data analysis
We analysed two consecutive and steady state strides (right and left) per trial for a total of 5 trials in each experimental condition for each participant. Foot contact and toe-off events were identified in each stride using force plate signals and foot vertical velocity.(O’Connor et al., 2007) These events determined pre-swing (from contralateral initial contact to ipsilateral toe-off) and swing (period that ipsilateral limb has no contact to the ground)(Perry, 1992) phases in the subsequent analyses.
The hip, knee, and ankle joint angles were calculated with a commercial algorithm (TheMotionMonitor, Innovative Sports Training, Inc.) and further analysed with custom algorithms (MATLAB, MathWorks, Inc.). Joint kinematics was digitally filtered using a low-pass 4th order and zero-lag Butterworth filter with 6 Hz cut off. EMG signals were band-pass filtered (20–400 Hz) and full-wave rectified. The amplitude of EMG data was obtained by calculating the root mean square (RMS) of the signal over a 50-ms window with 20-ms overlap (Bonato et al., 1998). The amplitude was calculated for the pre-swing and swing phases of gait cycle. Values from each muscle were normalized by their maximum obtained across all free walking trials (Burden et al., 2003). Additionally, EMG signals were low-pass filtered at 5 Hz to obtain the linear envelope. Gait cycle durations were time normalized and averaged to obtain the mean cycle for each participant in each condition.
The following variables were selected for analysis: mean walking speed (calculated as the ratio between the distance covered by two strides and its duration, determined by the position of the sacrum marker); the duration of both pre-swing and swing phases; hip, knee, and ankle joint angles at toe-off; maximum flexion (hip and knee) and dorsiflexion (ankle) during the swing phase; RMS of RF, VM, VL, TA, ST, BF, GM, and GL muscles during the pre-swing and swing phases. Since the hip and ankle joint angles present negative values indicating extension and plantar flexion, respectively, we used the absolute angles for all joints in the statistical analyses. Thus, the neutral position was represented by the planar posture with hip and knee joints at 180° and ankle joint at 90° degrees.
Statistical analysis
We used the repeated measures analysis of variance (ANOVA) with the condition (free, 45°, and 30°) as the factor and mean walking speed as the dependent variable. The remaining variables were analyzed with ANOVA and multivariate analysis of variance (MANOVA) for repeated measures with condition and limb (right/constrained and left/unconstrained) as factors. These variables were: the pre-swing and swing durations for the first MANOVA; hip, knee, and ankle angles at toe-off for the second MANOVA; maximum hip and knee flexion, and ankle dorsiflexion for the third MANOVA; RMS of RF, VM, and VL during pre-swing and swing for the fourth and fifth MANOVAs, respectively; RMS of ST and BF during pre-swing and swing for the sixth and seventh MANOVAs, respectively; RMS of GM and GL during pre-swing and swing for the eighth and ninth MANOVAs, respectively; RMS of TA muscle during pre-swing phase and during swing duration, for the two ANOVAs, respectively.
Univariate analyses and Tukey’s test for post hoc analysis were employed when necessary. An alpha level of 0.05 was set for all the statistical tests, which were performed using SPSS software.
Results
All participants completed the experimental sessions and were included in the final analysis. Figure 1 depict the mean (±SD) time series of the hip, knee, and ankle joint angles in the three conditions during the full gait cycle. Overall, the kinematic patterns were similar for both limbs and across all conditions. The knee flexion of constrained limb was reduced in the constrained trials during the swing phase, as expected. The hip (flexion) and ankle (dorsiflexion) excursion of the constrained limb seem to increase, and no compensations were apparent in the unconstrained limb.
Figure 1.

Joint Kinematics. Mean (±SD) of hip, knee, and ankle joint angles for the non-disabled adults walking in the three experimental conditions (free, 45°, and 30° of knee flexion constraint) is plotted for the normalized full gait cycle starting with the onset of foot contact. Note: right/constrained limb is represented by a line and left/non-constrained limb is represented by the grey area. Vertical lines indicate onset of pré-swing (doted) and swing (straight) phases.
Table 1 shows the mean (±SE) values of the mean walking speed, and duration of pre-swing and swing phases. The ANOVA showed condition effect for the mean walking speed (F2,20=4.46, p=0.025). Post hoc tests indicated that the participants walked slower in the 30° constrained condition compared to the free condition. The MANOVA for the pre-swing and swing durations revealed limb effect (Wilks’ Lambda=0.46, F2,9=5.17, p=0.032) and limb and condition interaction (Wilks’ Lambda=0.15, F4,7=10.04, p=0.005). The univariate analysis revealed limb effect for both pre-swing and swing durations (F1,10=5.63, p=0.039, F1,10=6.41, p=0.030, respectively), and interaction between limb and condition also for both pre-swing and swing durations (F2,20=5.07, p=0.017, F2,20=32.73, p<0.001, respectively). Post hoc tests showed that the pre-swing phase decreased and swing phase increased in the constrained limb in both constrained conditions in relation to the free condition. Additionally, in both constrained conditions, the swing phase in the constrained limb increased in relation to the constrained limb and free condition (Table 1).
Table 1.
Spatial-temporal variables. Mean (± SE) values of mean walking speed and duration of pre-swing and swing phases of right/constrained and left/unconstrained limbs in the three experimental conditions.
| Variable | Condition |
||
|---|---|---|---|
| Free | 45° constraint | 30° constraint | |
| Walking speed (m/s) | 1.28±0.04a | 1.25±0.03 | 1.19±0.03a |
| Pre-swing duration (%) | |||
| Right/constrained | 11.3±0.4a,b | 10.2±0.4a,* | 10.4±0.4b,* |
| Left/unconstrained | 11.5±0.4 | 11.1±0.3* | 11.3±0.2* |
| Swing duration (%) | |||
| Right/constrained | 38.4±0.3a,b | 40.1±0.5a,* | 40.5±0.5b,* |
| Left/unconstrained | 38.9±0.4a | 38.6±0.3* | 37.9±0.4a,* |
Note: same letter indicates difference between conditions
indicates difference between limbs.
The pattern of kinematic changes in the joint angles in response to the knee constraint is depicted in Figure 3. The MANOVA for joint angles at toe-off (Figure 2A) revealed limb (Wilks’ Lambda=0.04, F3,8=57.51, p<0.001) and condition (Wilks’ Lambda=0.11, F6,36=12.42, p<0.001) effects, and limb and condition interaction (Wilks’ Lambda=0.03, F6,36=31.10, p<0.001). The univariate analysis revealed limb effect for the hip (F1,10=30.43, p<0.001) and knee (F1,10=147.82, p<0.001) joints, condition effect for the knee joint (F2,20=76.12, p<0.001), and limb and condition interactions for the hip (F2,20=45.85, p<0.001) and knee (F2,20=193.29, p<0.001) joints. Post hoc tests revealed that both hips were similar in the free condition at toe-off event; however, in both constrained conditions, the hip of constrained limb was more flexed than that of the unconstrained limb. The decrease in the knee flexion range increased the hip flexion of constrained limb in the constrained conditions in relation to the free condition. Both knees were also similar in the free condition at toe-off event; though only in the 30° constrained condition the knee of constrained limb was more flexed than that of the unconstrained limb.
Figure 3.


Muscle activity patterns of muscles located anteriorly (A) and posteriorly in (B) in lower limb. Mean (±SD) of rectus femoris (RF), vastus medialis (VM), vastus lateralis (VL), tibialis anterior (TA), semitendinosus (ST), biceps femoris (BF), gastrocnemius medialis (GM), and gastrocnemius lateralis (GL) muscle activity is plotted in the three experimental conditions (free, 45°, and 30° of knee flexion constraint) for the normalized full gait cycle starting with the onset of foot contact. Note: right/constrained limb is represented by a line and left/non-constrained limb is represented by the grey area. Vertical lines indicate onset of pré-swing (doted) and swing (straight) phases.
Figure 2.
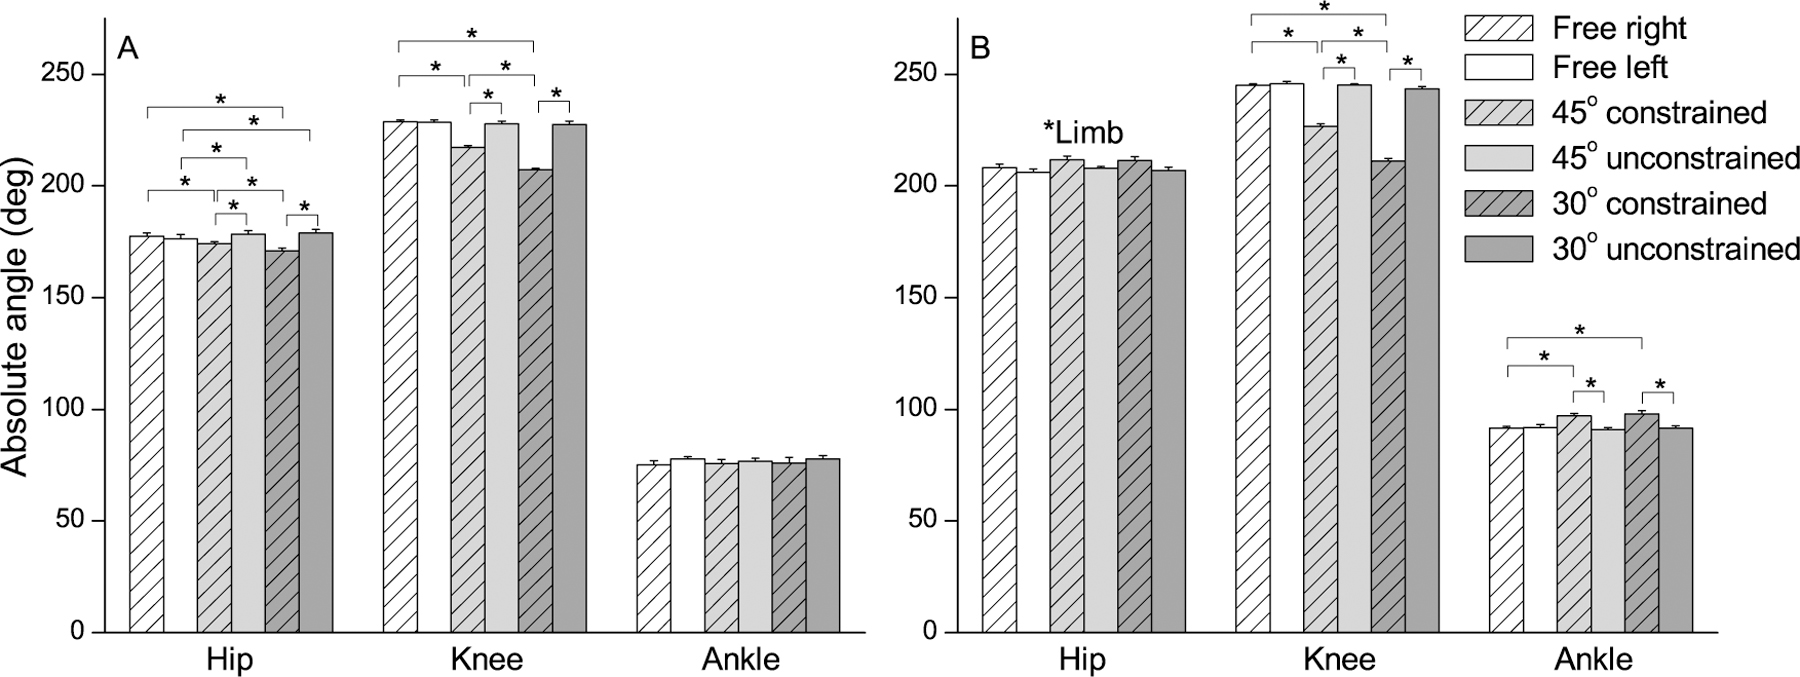
Statistical analysis of kinematics. Mean (±SE) values of hip, knee, and ankle absolute angles at toe-off (A) and during swing phase (B) in the three experimental conditions (free, 45°, and 30° of knee flexion constraint).
The MANOVA for joint angles during swing phase (Figure 2B) revealed limb (Wilks’ Lambda=0.01, F3,8=365.17, p<0.001) and condition (Wilks’ Lambda=0.05, F6,36=21.59, p<0.001) effects, and limb and condition interaction (Wilks’ Lambda=0.01, F6,36=49.36, p<0.001). The univariate analysis indicated limb effect for the hip (F1,10=7.40, p=0.022), knee (F1,10=1288.42, p<0.001), and ankle (F1,10=13.29, p=0.004) joints, condition effect for the knee (F2,20=108.44, p<0.001) and ankle (F2,20=12.35, p<0.001) joints, limb and condition interaction for the knee (F2,20=308.19, p<0.001) and ankle (F2,20=39.09, p<0.001) joints. The hip flexion was higher in the constrained limb than in the unconstrained one. The most constraining knee flexion range (i.e., 30°) led to the expected decrease in the knee flexion of the constrained limb and no changes in the unconstrained limb. This pattern of differences was similar for the ankle angle, except that there was no kinematic difference across both constrained conditions in the constrained limb.
Figures 3 shows the mean (±SD) time series of muscle activity patterns, in the three conditions. Overall, the activation patterns of the RF, VM, VL, and TA muscles (Figure 3A) were qualitatively similar in both limbs and across all conditions. The second RF burst during the period between pre-swing to swing transition may have had lower amplitude in the constrained limb compared to the corresponding burst in the unconstrained limb. The second TA burst was higher for the constrained limb compared to that of the unconstrained limb. RF and TA activity was also more variable in both constrained conditions and in both limbs compared to the free condition. ST, BF, GM, and GL profiles were similar between limbs and across all conditions with distinct activation peaks and silent periods, except for ST and BF in the constrained conditions (Figure 3B). ST activity may have increased in the constrained limb compared to unconstrained limb in both constrained conditions, and both ST and BF activity decreased in early stance of the constrained limb. Moreover, ST and BF bursting was also more variable (represented by the vertical bars ±SD) in both limbs compared to the free condition.
The relationship of muscle amplitude changes (RMS values) in response to the knee constraint is shown in Figure 4. TA was the only muscle that changed its amplitude during the pre-swing phase. The ANOVA for this muscle revealed condition effect (F2,20=5.03, p=0.017) and limb and condition interaction (F2,20=15.46, p<0.001). According to the post hoc tests, constraining the knee flexion range led to the increase in TA amplitude in the constrained limb and showed no difference in the unconstrained one (Figure 4A).
Figure 4.

Statistical analysis of muscle amplitudes. Mean (±SE) values of rectus femoris (RF), vastus medialis (VM), vastus lateralis (VL), tibialis anterior (TA), semitendinosus (ST), biceps femoris (BF), gastrocnemius medialis (GM), and gastrocnemius lateralis (GL) during pre-swing (A, B) and swing period (C, D) in the three experimental conditions (free, 45°, and 30° of knee flexion constraint).
The MANOVA for the RMS of ST and BF muscles during pre-swing phase (Figure 4B) revealed limb (Wilks’ Lambda=0.48, F2,9=4.78, p<0.001) and condition (Wilks’ Lambda=0.36, F4,38=6.34, p=0.001) effects, and limb and condition interaction (Wilks’ Lambda=0.41, F4,38=5.29, p=0.002). The univariate analysis indicated limb effect for RMS of ST muscle (F1,10=10.62, p=0.009), condition effect for RMS of ST (F2,20=14.34, p<0.001) and BF (F2,20=9.35, p=0.002) muscles, and limb and condition interaction for RMS of ST (F2,20=13.19, p<0.001) and BF (F2,20=8.40, p=0.002) muscles. Post hoc tests revealed similar results for both ST and BF amplitudes. In the free condition, their amplitudes were similar between both limbs, and in both constrained conditions, they were higher in the constrained limb than in the unconstrained limb.
Finally, only ST and BF amplitudes changed due to the knee constraint during the swing phase. The MANOVA for these muscles revealed limb and condition interaction (Wilks’ Lambda=0.59, F4,38=2.89, p=0.035). The univariate analysis revealed limb and condition interaction for ST amplitude (F2,20=6.75, p=0.006). Post hoc tests revealed that in the free condition, the muscle activation was similar between both limbs, and in both constrained conditions, this activation was higher in the constrained limb than in the unconstrained one (Figure 4D).
Discussion
We investigated whether a mechanical constraint of knee flexion in non-disabled adults would lead to compensatory strategies reflected in the temporal coordination of lower limb kinematics and muscle activation patterns during the pre-swing and swing phases of gait. Overall, reducing knee flexion led to the consistent pattern of compensatory strategies across non-disabled human participants. The reduction of a knee flexion correlated to the increased hip and ankle angle excursions and the increased TA amplitude. Even though RF amplitude did not change across conditions, other hip flexors were likely involved in the compensation observed at the hip joint, e.g., ilia-psoas. Furthermore, the temporal coordination changes reflected in the decreased pre-swing phase and increased swing phase in the constrained limb, caused by the increased amplitude of hip extensor and knee flexor bifunctional muscles (ST and BF) in the constrained limb in relation to the unconstrained limb. Finally, the extent of compensatory adjustments corresponded to the extent of reduced knee flexion (from 45° to 30°). The constrained condition decreased walking speed and knee flexion at toe-off event and increased hip excursion. All together, these results confirmed our first (except for the RF amplitude) and third hypotheses and contradicted our second hypothesis.
Interestingly, the participants of this study shortened the pre-swing phase and prolonged the swing phase in the constrained limb, leading to the asymmetric temporal organization of gait. This type of temporal asymmetry is a signature and critical characteristic of hemiparetic gait (Chen et al., 2005; Rozanski et al., 2020). Usually, the asymmetric temporal organization observed post-stroke is attributed to ankle spasticity, muscle strength (Lin et al., 2006), and dynamic balance control (Patterson et al., 2008). However, the present study supports the novel target associated with the limited knee flexion as the cause of asymmetry. The therapeutic use of this target in the rehabilitation of pathological gait could be tested in future studies aiming to improve knee range of motion in post-stroke individuals.
The consequences of knee excursion range were observed in kinematics and leg muscle activations associated with both hip and ankle joints. In disagreement with our prediction, the activation of knee flexor muscles increased in the constrained limb across both constrained conditions. ST and BF activity increased in the constrained limb during the pre-swing phase. This could be explained by the higher hip extension in the constrained limb compared to that in the unconstrained one. The increased hip extension has been previously suggested as an important strategy to increase hip flexion moment during pre-swing and increase the gait velocity (Balasubramanian et al., 2007; Olney et al., 1994). Despite the fact that ST and BF muscles are more active around heel strike (i.e., beginning and end of gait cycle) (Neptune et al., 2009), our results suggest that non-disabled adults adopted a compensatory strategy to increase hip joint moment and propelling the limb forward (Prilutsky & Gregor, 2001). Other than that, this increased muscle activation during the swing transition might be induced by reflexes from sensory feedback (Duysens et al., 1998), possibly triggered by the contact of the orthosis straps with the skin. However, this speculative explanation requires further study. During the swing period, only ST activity increased in the constrained limb. Possibly, the central nervous system could not modify its “regular” control strategy to achieve original knee function for locomotion (Perret & Cabelguen, 1980), and ST activity increased to overcome the consequences of using knee flexion mechanical constraint. No changes were found for the RF, probably due to the high variability in the compensatory strategies adopted by the participants, who may have used different strategies (Clark et al., 2010) due to the mechanical constraint.
In ankle, TA activity increased during the pre-swing phase as the knee constraint was increased. Usually, TA is activated prior to the onset of swing phase (Byrne et al., 2007). As the participants tried to plantarflex the ankle in preparation to the toe-off event, possibly the use of the orthosis did not allow this movement. Then, TA activity increased in the pre-swing phase to prevent tripping by increasing swing dorsiflexion that compensated for the diminished knee flexion. Further investigation should analyse the foot and shank movements individually instead of ankle joint angle to confirm such suggestion.
Finally, it is important to note that the participants walked slower only in the 30° constrained condition compared to the free condition, which corroborates previous investigation that compared non-disabled adults walking with an orthosis that constrained knee flexion to 30° to individuals with stroke (Hutin et al., 2011). If we take into account that the participants of this study reached approximately 65° (245° in absolute angle, Figure 3) of knee flexion in the free condition versus 30° (211° in absolute angle, Figure 3) in the constrained condition, this supports the idea that the limited knee flexion during swing leads to slower walking, which is another common impairment observed in post-stroke gait (Boudarham et al., 2014).
Although this study presents significant findings with potential clinical utility, we had several limitations. First, the recruitment was limited to male adults with no known gait impairment to minimize possible inter-subject effects. Future studies could broaden age range selection across both genders. Second, we limited our analyses to a selection of kinematic and EMG measurements limited by the study design considerations. Mechanistic analyses of limb dynamics could further expand our understanding integrating the multiple current measures with other biomechanical measures (e.g., force, moment, power) in the full description of locomotor tasks. Third, we analysed only the planar motion (sagittal) in this study. Future efforts could include three dimensional analyses. Lastly, we analysed only the pre-swing and swing phases, and future studies could include the whole gait cycle with its subdivisions.
Conclusion
The passive mechanical orthosis restricting knee flexion causes robust compensatory strategies in spatiotemporal organization of joint kinematics and muscle activity patterns. In the constrained limb, the observed changes were predominantly in the pre-swing phase; however, bilateral changes were observed including overall speed. These changes were related to the extent of knee flexion constraint suggesting that knee excursion may be critical for the rehabilitation of gait in post-stroke individuals.
Acknowledgments
This study was supported by the São Paulo Research Foundation - FAPESP [grant #2018/04964-8 for AMFB; and fellowship #2019/10801-7 for AJSL], and by NIH award [1 R03 HD099426-01A1 for SY]. This study was also financed in part by the Coordenação de Aperfeiçoamento de Pessoal de Nível Superior – Brasil (CAPES) – Finance Code 001 for OB.
Footnotes
Declaration of interest statement
The authors declare no conflicts of interest.
Data availability statement:
Data will be available upon request.
References
- Balasubramanian CK, Bowden MG, Neptune RR, & Kautz SA (2007). Relationship between step length asymmetry and walking performance in subjects with chronic hemiparesis. Archives of Physical Medicine and Rehabilitation, 88(1), 43–49. http://www.ncbi.nlm.nih.gov/entrez/query.fcgi?cmd=Retrieve&db=PubMed&dopt=Citation&list_uids=17207674 [DOI] [PubMed] [Google Scholar]
- Bonato P, D’Alessio T, & Knaflitz M (1998). A statistical method for the measurement of muscle activation intervals from surface myoelectric signal during gait. IIEEE Transactions on Bio-medical Engineering, 45(3), 287–299. 10.1109/10.661154 [DOI] [PubMed] [Google Scholar]
- Boudarham J, Roche N, Pradon D, Delouf E, Bensmail D, & Zory R (2014). Effects of quadriceps muscle fatigue on stiff-knee gait in patients with hemiparesis. PloS One, 9(4), e94138. 10.1371/journal.pone.0094138 [DOI] [PMC free article] [PubMed] [Google Scholar]
- Burden AM, Trew M, & Baltzopoulos V (2003). Normalisation of gait EMGs: a re-examination. Journal of Electromyography and Kinesiology, 13(6), 519–532. http://www.ncbi.nlm.nih.gov/entrez/query.fcgi?cmd=Retrieve&db=PubMed&dopt=Citation&list_uids=14573367 [DOI] [PubMed] [Google Scholar]
- Burpee JL, & Lewek MD (2015). Biomechanical gait characteristics of naturally occurring unsuccessful foot clearance during swing in individuals with chronic stroke. Clinical Biomechanics, 30(10), 1102–1107. 10.1016/j.clinbiomech.2015.08.018 [DOI] [PubMed] [Google Scholar]
- Byrne CA, O’Keeffe DT, Donnelly AE, & Lyons GM (2007). Effect of walking speed changes on tibialis anterior EMG during healthy gait for FES envelope design in drop foot correction. Journal of Electromyography and Kinesiology, 17(5), 605–616. 10.1016/j.jelekin.2006.07.008 [DOI] [PubMed] [Google Scholar]
- Chen G, Patten C, Kothari DH, & Zajac FE (2005). Gait deviations associated with post-stroke hemiparesis: improvement during treadmill walking using weight support, speed, support stiffness, and handtrail hold. Gait and Posture, 22, 57–62. [DOI] [PubMed] [Google Scholar]
- Clark DJ, Ting LH, Zajac FE, Neptune RR, & Kautz SA (2010). Merging of healthy motor modules predicts reduced locomotor performance and muscle coordination complexity post-stroke. Journal of Neurophysiology, 103(2), 844–857. 10.1152/jn.00825.2009 [DOI] [PMC free article] [PubMed] [Google Scholar]
- Cook TM, Farrell KP, Carey IA, Gibbs JM, & Wiger GE (1997). Effects of restricted knee flexion and walking speed on the vertical ground reaction force during gait. Journal of Orthopaedic and Sports Physical Therapy, 25(4), 236–244. 10.2519/jospt.1997.25.4.236 [DOI] [PubMed] [Google Scholar]
- Duysens J, van Wezel BM, van de Crommert HW, Faist M, & Kooloos JG (1998). The role of afferent feedback in the control of hamstrings activity during human gait. European Journal of Morphology, 36(4–5), 293–299. 10.1076/ejom.36.4.293.5820 [DOI] [PubMed] [Google Scholar]
- Hermens HJ, Freriks B, Disselhorst-Klug C, & Rau G (2000). Development of recommendations for SEMG sensors and sensor placement procedures. Journal of Electromyography and Kinesiology, 10(5), 361–374. http://www.ncbi.nlm.nih.gov/pubmed/11018445 [DOI] [PubMed] [Google Scholar]
- Herter TM, Kurtzer IL, Granat LM, Crevecoeur F, Dukelow SP, & Scott SH (2021). Inter-joint coupling of position sense reflects sensory contributions of biarticular muscles. Journal of Neurophysiology 10.1152/jn.00317.2019 [DOI] [PubMed] [Google Scholar]
- Hutin E, Pradon D, Barbier F, Gracies JM, Bussel B, & Roche N (2011). Lower limb coordination patterns in hemiparetic gait: factors of knee flexion impairment. Clinical Biomechanics, 26(3), 304–311. 10.1016/j.clinbiomech.2010.10.007 [DOI] [PubMed] [Google Scholar]
- Lin PY, Yang YR, Cheng SJ, & Wang RY (2006). The relation between ankle impairments and gait velocity and symmetry in people with stroke. Arch Phys Med Rehabil, 87(4), 562–568. 10.1016/j.apmr.2005.12.042 [DOI] [PubMed] [Google Scholar]
- Morton SM, & Bastian AJ (2006). Cerebellar contributions to locomotor adaptations during splitbelt treadmill walking. Journal of Neuroscience, 26(36), 9107–9116. 10.1523/JNEUROSCI.2622-06.2006 [DOI] [PMC free article] [PubMed] [Google Scholar]
- Neptune RR, Clark DJ, & Kautz SA (2009). Modular control of human walking: a simulation study. Journal of Biomechanics, 42(9), 1282–1287. 10.1016/j.jbiomech.2009.03.009 [DOI] [PMC free article] [PubMed] [Google Scholar]
- O’Connor CM, Thorpe SK, O’Malley MJ, & Vaughan CL (2007). Automatic detection of gait events using kinematic data. Gait and Posture, 25(3), 469–474. 10.1016/j.gaitpost.2006.05.016 [DOI] [PubMed] [Google Scholar]
- Olney SJ, Griffin MP, & McBride ID (1994). Temporal, kinematic, and kinetic variables related to gait speed in subjects with hemiplegia: a regression approach. Physical Therapy, 74(9), 872–885. 10.1093/ptj/74.9.872 [DOI] [PubMed] [Google Scholar]
- Patterson KK, Parafianowicz I, Danells CJ, Closson V, Verrier MC, Staines WR, Black SE, & McIlroy WE (2008). Gait asymmetry in community-ambulating stroke survivors. Archives of Physical Medicine and Rehabilitation, 89(2), 304–310. 10.1016/j.apmr.2007.08.142 [DOI] [PubMed] [Google Scholar]
- Perret C, & Cabelguen JM (1980). Main characteristics of the hindlimb locomotor cycle in the decorticate cat with special reference to bifunctional muscles. Brain Research, 187(2), 333–352. 10.1016/0006-8993(80)90207-3 [DOI] [PubMed] [Google Scholar]
- Perry J (1992). Gait analysis. Slack
- Peterson CL, Hall AL, Kautz SA, & Neptune RR (2010). Pre-swing deficits in forward propulsion, swing initiation and power generation by individual muscles during hemiparetic walking. Journal of Biomechanics, 43(12), 2348–2355. 10.1016/j.jbiomech.2010.04.027 [DOI] [PMC free article] [PubMed] [Google Scholar]
- Prilutsky BI, & Gregor RJ (2001). Swing- and support-related muscle actions differentially trigger human walk-run and run-walk transitions. Journal of Experimental Biology, 204(Pt 13), 2277–2287. https://www.ncbi.nlm.nih.gov/pubmed/11507111 [DOI] [PubMed] [Google Scholar]
- Rozanski GM, Huntley AH, Crosby LD, Schinkel-Ivy A, Mansfield A, & Patterson KK (2020). Lower limb muscle activity underlying temporal gait asymmetry post-stroke. Clinical Neurophysiology, 131(8), 1848–1858. 10.1016/j.clinph.2020.04.171 [DOI] [PubMed] [Google Scholar]
- Winter DA (1991). The biomechanics and motor control of human gait: normal, elderly, and pathological (2nd ed.). University of Waterloo Press. [Google Scholar]
- Zajac FE (1993). Muscle coordination of movement: a perspective. Journal of Biomechanics, 26 Suppl 1, 109–124. 10.1016/0021-9290(93)90083-q [DOI] [PubMed] [Google Scholar]
Associated Data
This section collects any data citations, data availability statements, or supplementary materials included in this article.
Data Availability Statement
Data will be available upon request.