In the past decade teenage pregnancy has become a key policy area in several industrialized countries. During the 1990s, both Britain and the USA identified teenage pregnancy as a national public health issue, alongside cardiovascular disease, cancer and mental health, requiring targeted interventions.1,2 A reason for this concern was that rates of teenage pregnancy were perceived to be higher than those in other developed countries2,3—a notion that has been taken up and inflated by the media. For example:
`Britain... has a sky-high level of teenage pregnancies.' [Daily Mail, 8 March 2001]
`The sexual behaviour of our children and teenagers has now reached such unprecedented levels of recklessness and damage that it is becoming a horror story running out of control.' [Daily Mail 28 June 2002]
In our opinion, such claims are based on selective comparisons. Here we argue that, contrary to the way in which it is frequently presented, the teenage pregnancy rate in Britain is neither high nor dramatically increasing.
GEOGRAPHICAL COMPARISONS
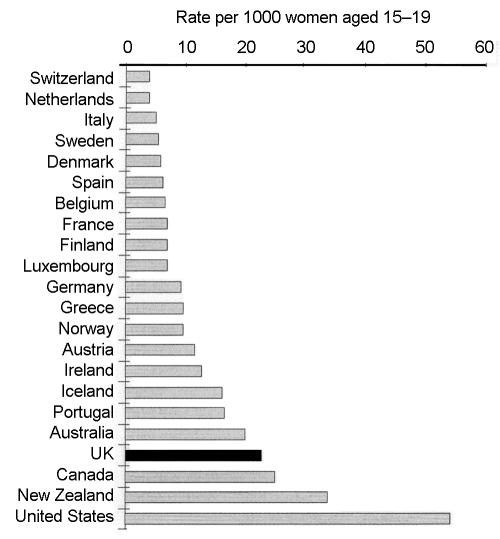
When rates of teenage pregnancy are judged `high' in England, the comparison is usually with our European neighbours. Figure 1 comes from the Teenage Pregnancy Unit report of 19993 and shows the live birth rate to women aged 15–19. The rate in the UK is indeed higher than that in many other countries. However, it is also substantially lower than those in New Zealand and the USA. Further, despite the fact that current policy in the UK aims to halve teenage pregnancy rates (defined as conception rates) for under 18s by 2010,3 these figures are for live births. A country with a rate similar to or higher than that of Britain might seem to do `better' because pregnant teenagers have greater access to termination services (or use them more).4
Figure 1.
Live birth rate to women aged 15–19, 1999 figures (Ref. 3) [Source: Eurostat & Centre for Sexual Health Research, Southampton]
A closer look at international comparisons reveals a more complex picture. Singh and Darroch looked at rates of `adolescent pregnancy' (again the rates examined by these workers are in fact live births) in 46 industrialized countries over the period 1970–1995, using the UN system of classification of level of development.5 As can be seen in Table 1, the birth rate to those aged 15–19 (per 1000) varies considerably between countries—from 3.9, 5.7 and 6.9 in Japan, Switzerland and Italy, to 54.3, 54.4 and 56.2 in Ukraine, the USA and Armenia. Although it is often stated that Britain has the highest teenage birth rate in Europe (see for example the Teenage Pregnancy Unit report from which Figure 1 is abstracted), this applies only to western European countries. Singh and Darroch further categorize these rates into five groups—very low (<10.0); low (10.0–19.9); moderate (20.0–34.9); high (35.0–49.9); and very high (≥50.0). In this full international comparison the England and Wales rate comes into the `moderate' category.5
Table 1.
Birth rate per 1000 to women aged 15–19 and percentage change 1970–95: percentage of births to 15–19-year-olds (of all births), 1995 and percentage change 1980–1995
| Birth rate per 1000 at 15-19, c 1995 | % change 1970-1995 | % of births to adolescents 1995 | % change, 1980-1995 | |
|---|---|---|---|---|
| Albania (1990) | 15.4 | U | 2.9 | U |
| Armenia | 56.2 | 36 | 18.3 | U |
| Australia (1994) | 19.8 | -61 | 4.8 | 13 |
| Austria (1996) | 15.6 | -73 | 3.9 | U |
| Belarus | 39.0 | 99 | 14.3 | U |
| Belgium | 9.1 | -71 | 2.4 | |
| Bosnia & Herzegovina (1990) | 38.0 | U | 11.0 | U |
| Bulgaria (1996) | 49.6 | -31 | 20.5 | 37 |
| Canada | 24.2 | -43 | 12.4 | -55 |
| Croatia (1996) | 19.9 | -58 | 6.3 | U |
| Czech Republic (1996) | 20.1 | -59 | 9.0 | 39 |
| Denmark | 8.3 | -74 | 2.0 | -43 |
| England & Wales | 28.4 | -43 | 6.4 | -56 |
| Estonia (1996) | 33.4 | 2 | 12.9 | U |
| Finland (1996) | 9.8 | -70 | 2.6 | -60 |
| France | 10.0 | -73 | 2.6 | -19 |
| Georgia (1994) | 53.0 | 48 | 21.0 | U |
| Germany | 12.5 | U | 3.4 | -81 |
| Greece | 13.0 | -65 | 4.7 | U |
| Hungary (1996) | 29.5 | -41 | 10.8 | 31 |
| Iceland (1996) | 22.1 | -70 | 5.3 | 22 |
| Ireland | 15.0 | - 8 | 5.1 | U |
| Israel | 18.0 | -64 | 3.8 | 13 |
| Italy | 6.9 | -74 | 2.9 | - 18 |
| Japan | 3.9 | - 12 | 1.4 | 58 |
| Latvia (1996) | 25.5 | - 8 | 10.5 | U |
| Lithuania (1996) | 36.7 | 56 | 12.1 | U |
| Macedonia | 44.1 | 7 | 10.8 | U |
| Moldova (1996) | 53.2 | U | 18.6 | U |
| Netherlands (1992)* | 8.2 | -74 | 1.9 | -76 |
| New Zealand | 34.0 | -47 | 7.6 | -46 |
| Northern Ireland* | 23.7 | U | 6.0 | -24 |
| Norway (1996) | 13.5 | -70 | 2.9 | -52 |
| Poland (1996) | 21.1 | -30 | 7.8 | U |
| Portugal (1996) | 20.9 | -30 | 7.1 | U |
| Romania | 42.0 | -36 | 17.0 | U |
| Russian Federation | 45.6 | 54 | 17.2 | U |
| Scotland | 27.1 | -43 | 6.9 | -50 |
| Slovak Republic | 32.3 | - 18 | 12.2 | 54 |
| Slovenia (1996) | 9.3 | -78 | 3.6 | U |
| Spain | 7.8 | -45 | 3.3 | U |
| Sweden (1996) | 7.7 | -77 | 2.0 | -35 |
| Switzerland (1991) | 5.7 | -74 | 1.3 | U |
| Ukraine | 54.3 | 55 | 19.5 | U |
| United States (1996) | 54.4 | -20 | 12.6 | -51 |
| Yugoslavia (Fed. Rep.) | 32.1 | U | 9.0 | U |
Under 20 years except where indicated.
Data from 1995, except where indicated.
U=comparative data not available. [Source: adapted from Singh and Darroch (Ref 5)]
Singh and Darroch also calculate changes in the birth rate to 15–19-year-olds between 1970 and 1995, where data were available. Substantial increases in the rate are seen for some countries of the former Soviet Union (Belarus, Lithuania, Ukraine, Russian Federation, Georgia and Armenia). In most countries, however, the rate has declined, often substantially (see Table 1). In England and Wales, the birth rate to 15–19-year-olds fell by 43% between 1970 and 1995. Moreover, the percentage of all births which were births to 15–19-year-olds also fell in England and Wales over the time period 1980–1995 by 56%. Singh and Darroch suggest that this trend can be seen as part of the overall decline in childbearing in all age groups across industrialized countries.5
SECULAR COMPARISONS
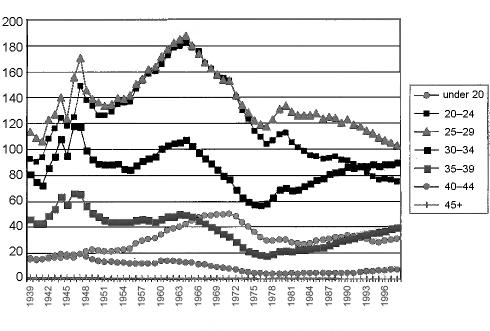
When considering changes in teenage birth rates over time, policy documents tend to be selective in the time period examined and, more importantly, seldom make comparisons with secular trends in other age groups. Any changes (either up or down) in teenage rates may simply reflect overall patterns of fertility among all women of reproductive age. Figure 2 shows the live birth rates for women in England and Wales, by age, from the beginning of World War II to the late 1990s. For the entire time period, the highest birth rates are found among women in their 20s and early 30s, with rates in the latter age group taking over those among women in their 20s. Throughout the time period, birth rates for women under the age of 20 are relatively low. Moreover, at any one time the birth rates for women aged under 20 tend to reflect the overall pattern of changing birth rates for women of all ages in the country. Over the six decades, rates of births to teenage mothers followed patterns similar to those for the general reproductive population; there has been no explosion in the rate of births to women under the age of 20 in recent years.
Figure 2.
Age-specific fertility (live births per 1000 women), England and Wales 1939–1998 (from Ref. 6)
DISCUSSION
Health professionals and the general public should be wary of claims that the rate of teenage pregnancy in Britain is `high' and increasing in an alarming way. International comparisons suggest that the rate is moderate and that the past six decades have seen a decline rather than a rise. Over the same three to six decades the number of adolescents having sex has increased greatly7 and the age at menarche has decreased.8 The fact that birth rates have not risen in a time when the at-risk population rose sharply, suggests that (again contrary to popular opinion) teenagers are reasonably competent at preventing unwanted pregnancies.7 We believe that the selective reporting of international and time comparisons by policy makers results in a `manufactured risk'9 and has more to do with moral panic than with public health.10
Acknowledgments
DAL is funded by a Department of Health Career Scientist Award; MS is funded by the South West Public Health Observatory.
References
- 1.Department of Health. The Health of the Nation: a Strategy for Health in England. London: Stationery Office, 1992
- 2.Felice ME, Feinstein RA, Fisher MM, et al. Adolescent pregnancy— current trends and issues: 1998 American Academy of Pediatrics Committee on Adolescence, 1998–1999. Pediatrics 1999;103: 516–20 [DOI] [PubMed] [Google Scholar]
- 3.Social Exclusion Unit. Teenage Pregnancy. London: Stationery Office, 1999
- 4.Kane R, Wellings K, Free C, Goodrich J. Uses of routine data sets in the evaluation of health promotion intervention: opportunities and limitations. Health Education 2000;100: 33–41 [Google Scholar]
- 5.Singh S, Darroch J. Adolescent pregnancy and childbearing: levels and trends in developing countries. Family Plann Perspect 2000;32: 14–23 [PubMed] [Google Scholar]
- 6.Macfarlane A, Mugford M. Birth Counts: Statistics of Pregnancy & Childbirth, Vol. I, London: Stationery Office, 2000
- 7.Wellings K, Kane R. Trends in teenage pregnancy in England and Wales: how can we explain them? J R Soc Med 1999;92: 277–82 [DOI] [PMC free article] [PubMed] [Google Scholar]
- 8.Whincup PH, Gilg JA, Odoki K, Taylor SJC, Cook DC. Age of menarche in contemporary Britain teenagers: survey of girls born between 1982–1986. BMJ 2001;322: 1095–6 [DOI] [PMC free article] [PubMed] [Google Scholar]
- 9.Bullen E, Kenway J, Hay V. New Labour, social exclusion and educational risk management: the case of `gymslip' mums. Br Ed Res J 2000;26: 441–56 [Google Scholar]
- 10.Lawlor DA, Shaw M. Too much too young? Teenage pregnancy is not a public health problem. Int J Epidemiol 2002;31: 552–4 [DOI] [PubMed] [Google Scholar]


