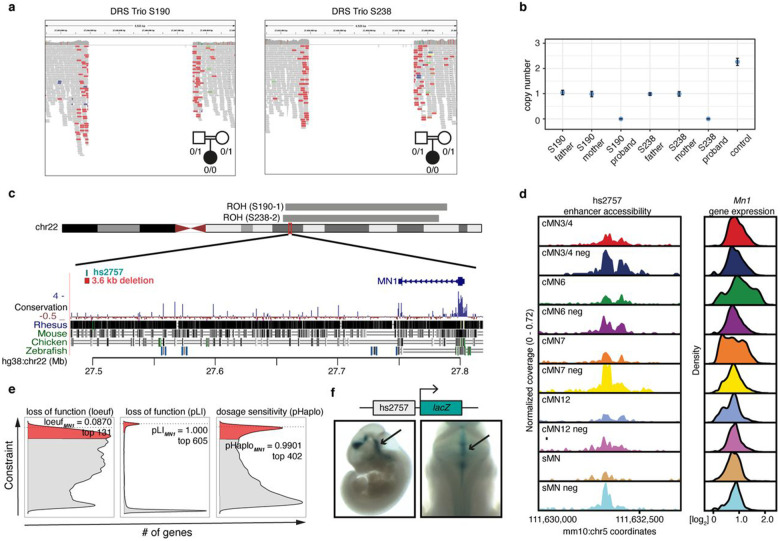
Figure 6. MN1 enhancer deletions across multiple CCDD pedigrees.
a. IGV screenshot depicting 3.6 kb non-coding deletions in two probands with DRS from separate consanguineous pedigrees (S190, S238).
b. ddPCR copy number estimates of deletions. For each pedigree, the affected proband is homozygous recessive for the deletion with one heterozygous allele inherited from each parent. Error bars denote 95% confidence intervals.
c. Genomic context of the non-coding deletions. The deletions (red bar below chr 22 ideogram) fall within extended runs of homozygosity (grey bars above ideogram, 19.5 Mb, 18.8 Mb, respectively, of which 16 kb surrounding the deletion is shared between the probands) and eliminates putative enhancer hs2757 (green bar below ideogram) located 307 kb from nearest gene MN1.
d. hs2757 chromatin accessibility (left) and Mn1 imputed gene expression (right) profiles in the cMNs and surrounding cell types. Mn1 is widely expressed across multiple midbrain/hindbrain cell types, and hs2757 is accessible across multiple cell types, including cMN6.
e. Density plots depicting genome-wide distribution of loss-of-function constraint (“loeuf”, “pLI”)82,125, and probability of haploinsufficiency (“pHaplo”)101 metrics. Respective scores exceeding thresholds of 0.35, 0.9, 0.84, and 2.0 are colored red. MN1 (dotted lines) ranks as the 131rd, 605th, and 402nd most constrained gene in the genome, respectively. Distributions are rescaled for consistent sign and ease of visualization.
f. In vivo reporter assay testing hs2757 enhancer activity (humanized sequence). Lateral (left) and dorsal (right) whole mount lacZ staining reveals hs2757 consistently drives expression in midbrain and hindbrain tissue, including the anatomic territory of cMN6.

