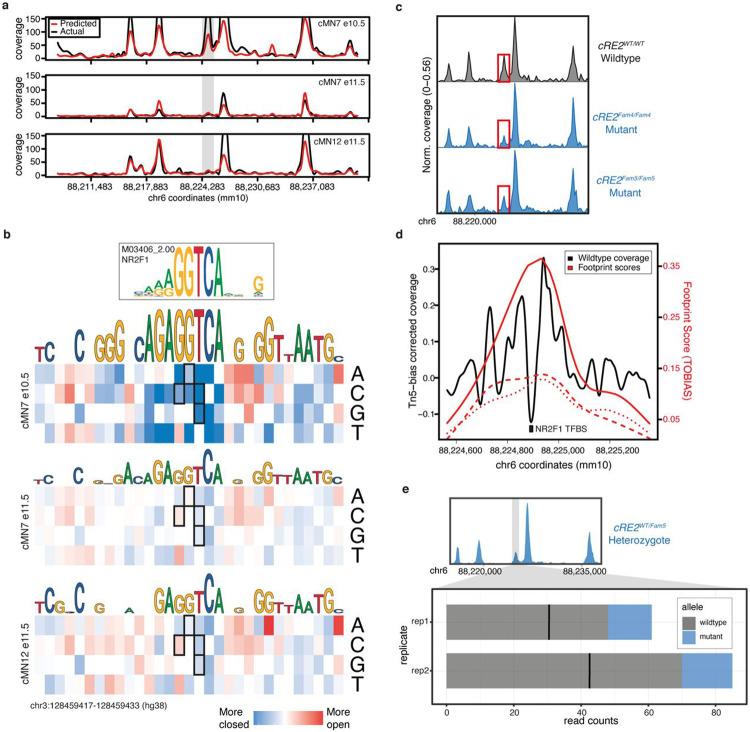
Figure 7. scATAC-trained convolutional neural network accurately predicts cell type specific accessibility status and human mutation effects in a transiently developing cell type.
a. Neural net predicted chromatin accessibility profiles (red) compared to actual scATAC sequencing coverage (black) for a region of mouse chromosome 6 in three cell types (cMN7 e10.5, cMN7 e11.5, and cMN12 e11.5). The grey box highlights a transient 678 bp peak (cRE2) that is accessible in cMN7 e10.5, but not cMN7 e11.5 or cMN12 e11.5. SNVs within the human orthologous peak cRE2 cause congenital facial weakness, a disorder of cMN7.
b. Neural net-trained in silico saturation mutagenesis predictions for specific nucleotide changes in human cRE2 for cMN7 e10.5, cMN7 e11.5, and cMN12 e11.5. Predicted loss-of-function nucleotide changes are colored in blue and gain-of-function in red. Predictions for four known loss-of-function pathogenic variants (chr3:128178260 G>C, chr3:128178261 G>A, chr3:128178262 T>C, chr3:128178262 T>G) are boxed. All four pathogenic variants are predicted loss-of-function for cMN7 e10.5, but not cMN7 e11.5 or cMN12 e11.5.
c. Pseudobulk accessibility profiles of cRE2 (red box) CN7 e10.5 for wildtype and two CRISPR-mutagenized mouse lines ( and ) show a qualitative reduction in cRE2 scATAC sequencing coverage, consistent with in silico saturation mutagenesis predictions. Each pseudobulk profile represents normalized sequencing coverage across two biological replicates.
d. Locus-specific footprinting evidence overlapping cRE2. A 792 bp window showing sequencing coverage for cMN7 e10.5 after correcting for Tn5 insertion bias. The NR2F1 transcription factor binding site is mutated in individuals with HCFP1-CFP and overlaps a local minimum in scATAC coverage. TOBIAS footprinting scores for cRE2 wildtype, , and are depicted in solid, dashed, and dotted lines, respectively. Wildtype footprinting scores are higher than mutant scores.
e. Stacked barplot depicting wildtype versus mutant scATAC read counts over a 7.7 kb window for cMN7 e10.5 in heterozygote embryos. cRE2 mutant alleles are consistently depleted across two biological replicates (; p-value = 2.4 x 10⁻¹⁴, binomial test).

