

Abstract
We utilized motion-corrected diffusion tensor imaging (DTI) to evaluate microstructural changes in healthy fetal brains during the late second and third trimesters. Data were derived from fetal magnetic resonance imaging scans conducted as part of a prospective study spanning from 2013 March to 2019 May. The study included 44 fetuses between the gestational ages (GAs) of 23 and 36 weeks. We reconstructed fetal brain DTI using a motion-tracked slice-to-volume registration framework. Images were segmented into 14 regions of interest (ROIs) through label propagation using a fetal DTI atlas, with expert refinement. Statistical analysis involved assessing changes in fractional anisotropy (FA) and mean diffusivity (MD) throughout gestation using mixed-effects models, and identifying points of change in trajectory for ROIs with nonlinear trends. Results showed significant GA-related changes in FA and MD in all ROIs except in the thalamus’ FA and corpus callosum’s MD. Hemispheric asymmetries were found in the FA of the periventricular white matter (pvWM), intermediate zone, and subplate and in the MD of the ganglionic eminence and pvWM. This study provides valuable insight into the normal patterns of development of MD and FA in the fetal brain. These changes are closely linked with cytoarchitectonic changes and display indications of early functional specialization.
Keywords: fetal brain, in vivo imaging, diffusion tensor imaging, normal development
Introduction
Fetal life arguably represents the most dynamic and critical period of brain development within the human lifespan. The advent of fetal magnetic resonance imaging (MRI) has revolutionized our capacity to examine brain development during this unique phase and to diagnose congenital brain disorders (Machado-Rivas et al. 2023). To overcome the challenges of fetal and maternal motion, most centers resort to T2-weighted single-shot fast spin echo (SSFSE) and balanced steady-state free precession images (bSSFP). While these sequences offer satisfactory depiction of fetal anatomy, the low tissue contrast of SSFSE, the mixed weighting of bSSFP, and the absence of quantitative information from both sequences are inadequate for capturing the complexity of microstructural changes occurring in the fetal brain.
Diffusion MRI has emerged as a valuable modality in fetal imaging to identify acute brain injuries and to evaluate the integrity of white matter (WM) bundles using tractography (Mitter et al. 2015; Song et al. 2018; Jaimes et al. 2022). The lack of normative in vivo data on diffusion metrics of the various histologic zones of the fetal brain remains an impediment to leveraging the quantitative nature of diffusion MRI. The majority of available data consist of ex vivo studies, which have vastly different spatial resolution and introduce biases related to preparation of the specimens (Gupta et al. 2005; Huang et al. 2009; Trivedi et al. 2009; Widjaja et al. 2010; Feng et al. 2019). Recent computational neuroimaging pipelines devised specifically for fetal diffusion data have emerged as valuable alternatives to fill this gap by correcting motion artifacts, reconstructing data with high spatial resolution (Marami et al. 2016, 2017), and providing robust segmentations of fetal brain structures (Karimi et al. 2022; Calixto et al. 2023). These novel technologies offer an unprecedented opportunity to study normal fetal brain development using diffusion MRI in vivo.
The purpose of this study was to evaluate the microstructural changes in the brains of healthy fetuses in the late second and third trimesters using diffusion MRI. We hypothesized that the complex cytoarchitectonic changes that take place in late gestation, such as cortical lamination, the resolution of the subplate, and the onset of myelination, result in rapid changes in diffusivity and anisotropy in the fetal brain. Further, we posited that the trajectories would vary between the individual anatomical regions of the fetal brain.
Materials and methods
Subjects
Data used in this study were obtained from in utero fetal MRI scans conducted as part of a prospective Fetal MRI research study at Boston Children’s Hospital, Boston, MA, from 2013 March to 2019 May. The research adhered to the Health Insurance Portability and Accountability Act and was approved by the Institutional Review Board. Participants were recruited in advance, and written informed consent was obtained before each fetal MRI examination. The study was publicized via brochures at outpatient obstetrics and gynecology clinics at our institution and banners on the hospital’s intranet. All women were imaged without sedation. Inclusion criteria were normal pregnancy between 23 and 36 weeks of gestational age (GA) and mother’s age between 18 and 45 years. Exclusion criteria were any form of high-risk pregnancy, fetal anomalies, contraindications to MRI, and maternal comorbidities such as diabetes, hypertension, or substance abuse.
MRI data acquisition protocol
Images were obtained using 3.0 T MRI scanners (Skyra and Prisma, Siemens Medical Solutions) with 16-channel body matrix and spine coils. The field of view and number of slices varied based on maternal and fetal dimensions.
Structural sequences: we obtained multiple T2-weighted Half-Fourier Single Shot Turbo Spin Echo fetal brain images orthogonal plane. The acquisition parameters were TR = 1400–2000 ms, TE of 100–120 ms, in-plane resolution of 0.9–1.1 mm, 2 mm slice thickness with no inter-slice space, and an acquisition matrix size of 256 x 204, 256 x 256, or 320 x 320 with 2- or 4-slice interleaved acquisition.
Diffusion-weighted imaging (DWI): 2–8 scans were obtained, each along orthogonal planes with respect to the fetal head. We acquired 1 or 2 b = 0 s/mm2 images and 12 diffusion-sensitized images at b = 500 s/mm2 in each scan. The acquisition parameters were TR = 3000–4000 ms, TE = 60 ms, in-plane resolution of 2 mm, and slice thickness of 2–4 mm.
Image processing
Studies were screened for the availability of at least 2 DWI scans that were free of motion-induced artifacts, distortion, and signal loss, which could impede successful motion correction and registration between DWI and structural T2-weighted scans. To process diffusion and structural data of each subject, we utilized a previously validated framework described by Khan et al. (2019). Briefly, the pipeline consists of structural and DWI image reconstruction in an iterative model-based super-resolution framework (Marami et al. 2016) and then diffusion tensor imaging (DTI) calculation using the Constrained Weighted Linear Least Squares method (Koay et al. 2006; Veraart et al. 2013; Marami et al. 2017). Finally, DTI-derived scalars—fractional anisotropy (FA) and mean diffusivity (MD)—are calculated. We excluded images with gross errors in reconstruction, inadequate direction of the principal eigenvectors, or insufficient visibility of brain structures.
Image segmentation
We utilized existing segmentations performed on a fetal brain DTI atlas (Calixto et al. 2023) plus 14 additional manually segmented individual subjects (described below). The labels in the diffusion atlas and individual subjects consisted of 13 structures + a whole-brain mask for a total of 14 regions of interest (ROIs), as detailed in Table 1.
Table 1.
Segmented fetal structures.
| Structure | Notes |
|---|---|
| Whole Brain | Unique segmentation |
| Telencephalic wall | |
| Cortical Plate | Bilateral segmentation |
| Ganglionic Eminence | Bilateral segmentation |
| Periventricular White Matter | Bilateral segmentation |
| Fetal white matter transient zones | Subdivision of hemispheric white matter (<31 weeks of gestational age) |
| Subplate | Bilateral segmentation |
| Intermediate Zone | Bilateral segmentation |
| Deep White Matter | |
| Internal Capsule | Bilateral segmentation |
| Corpus Callosum | Unique segmentation |
| Deep Gray Nuclei | |
| Lentiform | Bilateral segmentation |
| Thalamus | Bilateral segmentation |
| Other Supratentorial | |
| Hippocampus | Bilateral segmentation |
| Amygdala | Bilateral segmentation |
| Posterior Fossa | |
| Brainstem | Unique segmentation |
| Cerebellum | Bilateral segmentation |
Note—For structures with bilateral segmentation, each side’s median intensity was measured separately.
Two research fellows (C.C., MD and F.M.R., MD) performed segmentations on 14 individual subjects—evenly distributed across the same range of GAs of the study, with 1 subject per week of postconceptional age—which were then reviewed and revised as necessary by a board-certified neuroradiologist with fellowship training in pediatric neuroradiology (C.J., MD, who has 5 years of experience in fetal imaging). The segmentations were performed on high-resolution (1080p) Wacom ® Cintiq tablets using ITKSNAP (version 3.8.0) following parameters described by Calixto et al. (2023).
Label propagation
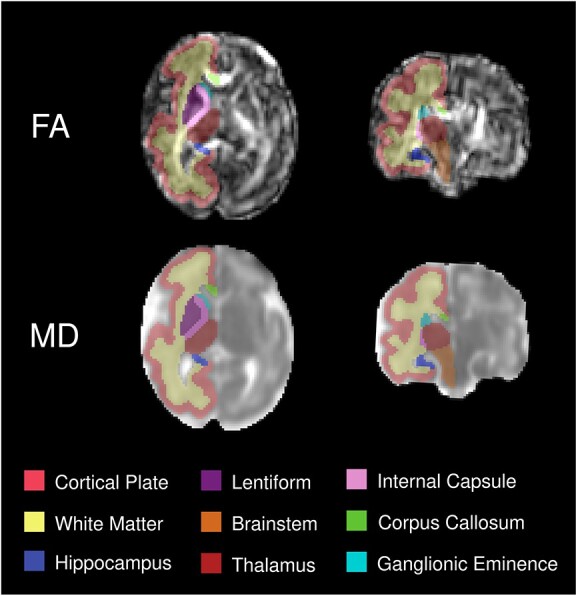
For label propagation, an initial set of segmentations were generated for each research subject by registering the atlases and the additional manually segmented subjects that were within 1 week of the subject’s GA (t-1, t, and t + 1)—following a similar approach by Gholipour et al. (2017) We used the tensor-based deformable registration algorithm in DTI-TK (Zhang et al. 2007). This approach ensured that each subject had between 4 and 6 prior segmentations. Then, we used probabilistic STAPLE (Akhondi-Asl and Warfield 2013) for label fusion. We excluded automatic segmentations with significant errors and ensured the accuracy of the remaining segmentations through manual refinement by an expert. Figure 1 presents an example of the output of our reconstruction and segmentation pipeline.
Fig. 1.

3D reconstructed diffusion tensor image of a 31 week-old fetus. The top panel displays FA and the bottom one MD. Structural labels are overlaid on the right side of the brain.
Statistical analysis
For each subject, we calculated median FA and MD values for each ROI. If an ROI was present on both cerebral hemispheres (e.g. Thalamus), we calculated the median value for each side separately.
To assess changes in FA and MD throughout gestation, we analyzed each ROI individually and also analyzed asymmetry for ROIs present in both hemispheres. We used mixed-effects models with subject ID as a random effect to account for repeated measurements for ROIs present in both hemispheres. We evaluated 3 different models for each combination of ROI and diffusion metric:
linear (Feng et al. 2019; Machado-Rivas et al. 2021; Calixto et al. 2023):
 |
quadratic (McKinstry 2002; Trivedi et al. 2009; Machado-Rivas et al. 2021):
 |
and exponential (Mukherjee and McKinstry 2006; Sotardi et al. 2021):
 |
where  = intercept,
  = week coefficient,
  = coefficient of the quadratic week term,
  = horizontal asymptote on the right side,
  = response when
  , and
, and  = natural logarithm of the rate constant. After fitting the 3 models, Akaike Information Criteria was used for model selection. Selected models for each ROI can be found in Table S1.
When linear models were used, we log-transformed the dependent variable (FA or MD), and the coefficients and confidence intervals were converted using  to report the age-related change as a percentage. For nonlinear models (quadratic and exponential), we calculated the rate of change of the diffusion metric across gestation by calculating the first-order derivative of the fitted model.
Point of change in trajectory
To better understand the trajectories of ROIs with nonlinear trends, we identified a “point of change in trajectory.” This point marked a change in the trend direction or rate of change. For the quadratic models, we defined this point as the vertex of the parabola, and for the exponential models, we defined a point of “slow decrease” as the time when FA values showed a rate of decrease of less than 2% over 2 consecutive weeks, with a sampling interval of 1 week. We arbitrarily chose these parameters to emulate the approach described by Sotardi et al. (2021).
To calculate confidence intervals for these “points of change,” we used a wild bootstrapping scheme. First, we fitted a model (quadratic or exponential), and then, for each bootstrap sample, we computed a new  based on
  , where
  is the predicted value,
  is the estimated residual, and
  is a random variable which comes from a Rademacher distribution. We then used the newly computed
  to fit a new model, and the respective estimate of interest was computed (vertex of the parabola or point of slow decrease). We performed this resampling 10,000 times, and the resulting distribution of estimates was used to calculate 95% confidence intervals.
Hemispheric asymmetries
For structures with linear trends, we examined hemispheric asymmetries with the following model:
 |
where  = intercept,
  = week coefficient,
  = intercept for “Right hemisphere ROI,” and
  = interaction term between GA and “Right hemisphere ROI”. We calculated the slopes for each side and reported the age-related change as a percentage using the same method mentioned earlier. Asymmetry was assessed based on the significance of the interaction term.
To examine asymmetry in structures with nonlinear trends, we fitted separate models for each hemisphere and generated 10,000 bootstrap samples using the wild bootstrap scheme mentioned earlier. We then calculated the estimate of interest (vertex of the parabola or point of slow decrease), and performed a 2-tailed Student t-test on these bootstrapped “points of change” samples.
All calculations were performed in R (version 4.2.3) using a significance level of 0.05. We performed Holm–Bonferroni correction for multiple comparisons at an ⍺ of 0.05 for each diffusion metric (MD and FA) and model type to control the family-wise error rate when conducting multiple statistical tests.
Results
Participant characteristics
In total, 44 of 230 fetal diffusion MRI examinations (19%) in 198 pregnant women were analyzed. Of the 230 fetal examinations, 53 (23%) were excluded because of poor-quality diffusion data. The remaining 177 scans were reconstructed and of those, 76 (43%) were excluded due to failed reconstruction, 37 (20%) because of poor post-reconstructed data, and 20 (11%) because of gross errors in automatic segmentation (Fig. 2). In the 44 fetuses included in the final analysis, the median GA was 32.1 weeks (IQR, 30.1–34.4) (Table 2).
Fig. 2.
Flowchart depicting the study design and methodology. Pregnant study participants between 23 and 36 weeks of gestation were scanned, and poor-quality images were excluded. Scans were then motion corrected, 3D-reconstructed, and tensors were calculated. Failed or poor-quality reconstructions were excluded. Eligible reconstructions were automatically segmented with an in-house pipeline with posterior manual revision by an expert to ensure accuracy. Automatic segmentations with gross errors were finally excluded.
Table 2.
Study sample characteristics.
| Group and characteristic | Number of individuals (%) |
|---|---|
| Pregnant volunteers | 44 |
| Age* in years | 32.1 [30.1–34.4] |
| No. of volunteers with data for self-described race | 35 |
| Asian | 3 (6.8%) |
| Black or African American | 2 (4.5%) |
| White | 30 (68%) |
| No. of volunteers with data for self-described ethnicity | 35 |
| Hispanic | 2 (4.5%) |
| Non-Hispanic | 33 (75%) |
| No. of fetuses | 44 |
| Gestational age* in weeks | 29.1 [26.6–32.3] |
| No. of MRI examinations corresponding to fetuses < 31 weeks of gestational age | 29 (65.9%) |
| Sex | |
| Female | 15 (34%) |
| Male | 29 (66%) |
Note—*Data are median [Interquartile Range].
Diffusion analysis
FA trends
Age-related changes in FA were found to be significant in all ROIs except for the thalamus, amygdala, brainstem, and cerebellum (Table 3). The cortical plate, periventricular WM (including fetal WM transient zones when GA < 31), and the whole brain (when used as ROI) exhibited exponential decay trends in FA (Fig. 3). By contrast, the remaining structures had linear trends, with the internal capsule showing the greatest increase in FA and the ganglionic eminence exhibiting the greatest decrease in FA.
Table 3.
FA changes with gestational age.
| Structure | Grouped | Asymmetry analysis | ||
|---|---|---|---|---|
| Left | Right | P | ||
| Linear models | % change of FA per week (95% CI) | |||
| Ganglionic Eminence | −4.04 (−5.05 to −3.02) | −3.76 (−4.89 to −2.61) | −4.32 (−5.88 to −2.75) | .34 |
| Internal Capsule | 1.13 (0.43–1.83) | 1.03 (0.18–1.88) | 1.23 (−0.09–2.57) | .67 |
| Corpus Callosum | −1.13 (−2.07 to −0.18) | … | … | … |
| Lentiform | −2.04 (−2.86 to −1.21) | −2.06 (−2.96 to −1.14) | −2.02 (−3.24 to −0.79) | .93 |
| Thalamus | 0.5 (−0.28–1.29) | 0.37 (−0.54–1.3) | 0.63 (−0.73–2.01) | .62 |
| Hippocampus | −1.4 (−2.31 to −0.48) | −1.09 (−2.11 to −0.06) | −1.71 (−3.11 to −0.29) | .21 |
| Amygdala | 1.32 (−0.01–2.67) | 0.31 (−1.28–1.93) | 2.34 (−0.16–4.89) | .06 |
| Brainstem | 0.59 (−0.57–1.75) | … | … | … |
| Cerebellum | 0.92 (−0.43–2.28) | 0.69 (−0.69–2.1) | 1.14 (−0.45–2.76) | .16 |
| Exponential decay models | Cut-off point (weeks) at which the rate of decrease in FA becomes slow† (95% CI) | |||
| Whole Brain | 30.2 (28.7–32.4) | … | … | … |
| Cortical Plate | 42.9 (41.2–44.7) | 55.1 (38.4–87.9) | 57.8 (41.7–88.5) | <0.001* |
| Periventricular White Matter | 28.6 (28.2–29) | 28.4 (27.2–29.8) | 28.9 (27.7–30.3) | <0.001* |
| Subplate | 29 (28.4–29.6) | 28.7 (27.2–30.8) | 29.5 (27.6–32.2) | <0.001* |
| Intermediate Zone | 29.2 (28.3–30.3) | 31.3 (26.8–58.8) | 30.4 (27.3–40.4) | .006* |
Note—For the “Grouped” analyses, mixed-effects models were used for bilateral structures. In the linear models, asymmetry was determined by including laterality as a covariate and an interaction with gestational age. Coefficients for the exponential models were determined using wild bootstrapping, and asymmetry was determined with a t-test. Cut-off points > 36 weeks in the exponential decay models indicate a hypothetical projection.
Abbreviations: FA: Fractional Anisotropy; CI: Confidence Intervals.
*P < 0.050 after Holm-Bonferroni correction, †Defined as less than a 2% decrease in 2 consecutive weeks.
Fig. 3.

FA changes between 23 and 36 weeks of gestation. ROI’s median FA value is the dependent variable, and gestational age (in weeks) is the independent variable. (A) Linear regressions for selected ROIs; (B) fitted exponential decay curves (blue line) and rate of change in FA units/week (red line) for selected ROIs. The rate of change was derived from the fitted blue curve of the same ROI. The dotted lines indicate the cutoff point (in weeks) at which the rate of decrease in FA becomes slow (defined as when there is less than a 2% decrease in FA in 2 consecutive weeks). The blue and red curves share the same x-axis for each ROI. Note— For bilateral structures, each side is depicted as a separate dot for each subject in the same plot, and mixed-effects models were used.
For all structures with exponential trends in FA, the rate of FA decrease slowed down between 28.2 and 32.4 weeks, except for the cortical plate, where age-related changes did not decelerate in the studied period.
MD trends
Significant age-related changes in MD were observed in all ROIs except for the corpus callosum (Table 4). The whole brain (when used as ROI), ganglionic eminence, periventricular WM, and amygdala showed quadratic trends in MD, whereas the remaining structures displayed linear trends (Fig. 4). In structures with linear trends, the greatest increase in MD was seen in the intermediate zone, while the greatest decrease was seen in the cerebellum. In contrast, all structures with quadratic trends exhibited a downward opened parabolic trend. The point of change in trajectory (vertex of parabola) occurred at around 25.78 to 31.2 weeks of GA in these structures.
Table 4.
MD changes with gestational age.
| Structure | Grouped | Asymmetry analysis | ||
|---|---|---|---|---|
| Left hemisphere | Right hemisphere | P | ||
| Linear models | % change of MD per week† (95% CI) | |||
| Cortical Plate | −0.64 (−1.25 to −0.03) | −0.67 (−1.29 to −0.04) | −0.62 (−1.32–0.09) | .77 |
| Subplate | 1.03 (0.13–1.93) | 1.15 (0.18–2.13) | 0.9 (−0.37–2.19) | .58 |
| Intermediate Zone | 2.26 (1.31–3.21) | 2.37 (1.31–3.43) | 2.15 (0.68–3.63) | .69 |
| Internal Capsule | −0.6 (−1.13 to −0.08) | −0.6 (−1.15 to −0.05) | −0.6 (−1.27–0.06) | 1.00 |
| Corpus Callosum | 0.2 (−0.42–0.83) | … | … | … |
| Lentiform | −0.69 (−1.2 to −0.18) | −0.7 (−1.25 to −0.15) | −0.68 (−1.39–0.04) | .97 |
| Thalamus | −0.93 (−1.44 to −0.41) | −0.95 (−1.48 to −0.41) | −0.9 (−1.54 to −0.27) | .81 |
| Hippocampus | −0.87 (−1.44 to −0.29) | −0.91 (−1.53 to −0.29) | −0.82 (−1.62 to −0.01) | .78 |
| Brainstem | −1.29 (−1.87 to −0.71) | … | … | … |
| Cerebellum | −1.47 (−2.16 to −0.79) | −1.39 (−2.08 to −0.68) | −1.56 (−2.33 to −0.79) | .20 |
| Quadratic models | Point of change (vertex) in weeks (95% CI) | |||
| Whole Brain | 28.1 (25.8–29.5) | … | … | … |
| Ganglionic Eminence | 30.9 (30.7–31.2) | 30.9 (29.7–32.5) | 31.2 (30–33) | < 0.001* |
| Periventricular White Matter | 29.3 (29–29.6) | 29.4 (28.3–30.5) | 29.3 (27.9–31) | < 0.001* |
| Amygdala | 27.7 (26.2–28.7) | 27.5 (23–29.8) | 25.4 (5.7–46.5) | .38 |
Note—For the “Grouped” analyses, mixed-effects models were used for bilateral structures. In the linear models, asymmetry was determined by including laterality as a covariate and an interaction with gestational age. Inflection points for the quadratic models were determined using wild bootstrapping, and asymmetry was determined with a t-test.
Abbreviations: MD: Mean Diffusivity; CI: Confidence Intervals.
*P < 0.050 after Holm-Bonferroni correction, †% change of MD is in x10−3 mm2/s/week.
Fig. 4.

MD changes between 23 and 36 weeks of gestation. Median MD values are x10–3 mm2/s. ROI’s median MD value is the dependent variable, and gestational age (in weeks) is the independent variable. (A) Linear regressions for selected ROIs; (B) fitted quadratic curves (blue line) and rate of change in x10–3 mm2/s/week (red line) for selected ROIs. The rate of change was derived from the fitted blue curve of the same ROI. The dotted lines indicate the inflection point. The blue and red curves share the same x-axis for each ROI. Note—For bilateral structures, each side is depicted as a separate dot for each subject in the same plot, and mixed-effects models were used.
Hemispheric asymmetries
In ROIs with linear trends in FA or MD, we found no evidence of differences in the rates of change between hemispheres (Table 3 and 4). In contrast, we observed hemispheric asymmetry in some structures with exponential trends in FA. The left periventricular WM and subplate reached slow decrease earlier than the right side, while the right intermediate zone reached this point earlier than the left. In addition, there were significant asymmetries in MD in structures that followed a quadratic model. The left ganglionic eminence peaked earlier on the right, while the right periventricular WM peaked earlier than on the left side.
Discussion
Our study employed state-of-the-art retrospective motion correction and automated segmentation to reconstruct DTI data of normally developing fetuses in the late second and third trimesters and analyzed regional and gestational-age-related changes. These anatomically specific estimates of diffusivity, anisotropy, developmental trajectories, and emerging asymmetries provide fundamental information for understanding normal brain development and interpreting changes in MD and FA values over this critical developmental period.
Diffusion MRI is an established technique for studying postnatal brain development and microstructure. The introduction of motion correction methods for diffusion MRI from live fetuses has enabled the extension of these analyses to prenatal life (Machado-Rivas et al. 2021). Our fetal brain DTI reconstruction method involves 2 key innovations: robust inter-slice motion estimation and a robust DTI model reconstruction by detecting and discarding motion-corrupted data and using weighted linear least squares estimation. It utilizes a state space model to model motion dynamics, and estimates temporal motion trajectories with a Kalman filter (Marami et al. 2016). This approach effectively addresses signal loss caused by intra-slice motion, ensuring highly accurate results.
This work addresses significant gaps in the understanding of diffusion MRI patterns of change in the fetal brain. Previous reports of regional MD and FA changes in individual fetuses were limited to 2-dimensional image analyses with manually placed ROIs (Widjaja et al. 2010; Berman et al. 2011; Schneider et al. 2016). However, our work surpasses prior studies by integrating robust 3D segmentation of the fetal brain, including its transient zones. The absolute median MD and FA values from our 3D ROIs are similar to those reported in existing literature (McKinstry 2002; Trivedi et al. 2009; Yu et al. 2016). While ex vivo data are foundational to understanding the biological processes driving the diffusion signal, they are harder to utilize in a clinical setting due to tissue changes that arise from specimen preparation. Our data are consistent with and complement the results of studies that utilized tractography in individual fetuses and in groupwise analyses (Mitter et al. 2015; Song et al. 2018; Wilson et al. 2021, 2023). These reports described changes along the developing WM bundles, which bear functional and anatomic significance but are not immediately apparent on diffusion parameter maps. The trends reported in these studies reflect the values of MD and FA as tracts traverse various zones, while our analysis presents the values within each specific zone.
Our results closely approximate the timing and location of the major histologic milestones that occur in late gestation (Kostović et al. 2019). The cerebral WM showed a quadratic (inverted U-shaped) trajectory in MD and an exponential decay in FA. The change in trajectory for both functions occurred around the 29th week of GA, which coincides with the involution of the radial-glial scaffolding that facilitates neuronal migration and precedes the dissolution of the subplate, as seen histologically. Both these processes also account for the GA-related decrease in FA and increase in MD in the subplate and intermediate zone. The collective effects of pre-myelination, myelination, and axonal ensheathment in the early third trimester drive the decrease in MD, and increase in FA observed in the internal capsule and brainstem (Wimberger et al. 1995; Back et al. 2002). Our results also showed leftward asymmetry in the entire periventricular WM and the subplate. These observations are consistent with the strong leftward WM asymmetries described in infancy by Sotardi et al. (2021) and confirm the presence of functional specialization at the microstructural level dating back to prenatal life.
There are various factors that may account for the decline in FA in the corpus callosum with increasing GA. Between 20 and 26 weeks, a group of specialized cells organize into septa within the corpus callosum, serving as markers for developing callosal axons (Culjat and Milošević 2019). We hypothesize that these cellular septa, which are rich in glial fibrillary acid protein, lead to anisotropic diffusion in a manner analogous to the supratentorial radial-glial fibers (Xu et al. 2014). The number and thickness of the septa peak at around 22 weeks and gradually decreases thereafter, possibly causing the observed decrease in FA (Culjat and Milošević 2019). The constant number of axons and water content probably contributes to the consistent MD estimates. It is unlikely that processes such as pre-myelination and myelination significantly impact our estimations since they begin later in gestation and only initially involve the posterior aspect of the corpus callosum (Yakovlev and Lecours 1967). Moreover, our methodology involved examining the entire corpus callosum using a single ROI, which may not capture regional differences, such as early myelination in the splenium (Machado-Rivas et al. 2021; Wilson et al. 2021).
GA-related changes in MD and FA also capture the changing cytoarchitectonic landscape in the fetal cortex. Early in the second trimester, while neuronal migration is still active, radial glia hinder water diffusion, resulting in high anisotropy and low diffusivity. Later in gestation, neuronal migration halts, the scaffold involutes, and the inflow of thalamic axons increases the space between neurons, elevating diffusivity and facilitating a more uniform (isotropic) diffusion of water (McKinstry 2002). Analyses performed in preterm newborns reflect these trends and are consistent with our results (McKinstry 2002; Maas et al. 2004). Recently, more sophisticated diffusion models have been utilized to characterize perinatal cortical maturation, such as diffusion compartment imaging in neonates born preterm and multi-shell multi-tissue constrained spherical deconvolution in fetuses (Eaton-Rosen et al. 2017; Wilson et al. 2023); these studies demonstrated the advantages of models other than DTI to characterize cortical maturation. Furthermore, Eaton-Rosen et al. (2017) highlighted in preterm newborns the somewhat underrecognized vulnerability of the cortex in these early periods.
Previous works from our group entailed the creation of a spatiotemporal atlas of fetal brain DTI (Khan et al. 2019), analyzing trajectories of diffusion metrics in this atlas, and introducing an automatic segmentation pipeline (Calixto et al. 2023). In this study, we utilized these tools to analyze a cohort of normally developing fetuses instead of atlases and expanded the analysis period to the late third trimester with dense sampling over a 13-week span. This approach allows us to study normal development in greater granularity, exploring the effect of sex on brain development. Moreover, being able to analyze individual fetuses will enable us to compare different groups and evaluate the effect of various exposures (maternal conditions, fetal conditions, environmental exposures) on brain development.
Our study has several limitations. First, we have a limited sample size of 44 fetuses. This reflects the difficulty of recruiting normal fetuses and the moderate success rate of our pipeline. Fetal echo planar imaging can be challenging due to its inherent sensitivity to susceptibility artifacts, interslice motion, and signal loss due to transmit and receive RF field inhomogeneities, which can create significant artifacts (Afacan et al. 2019). We used stringent quality criteria to evaluate reconstructions and segmentations to avoid bias. While the sample is relatively small, it suffices for evaluating developmental changes over the short period that we studied. Second, there is a selection bias in recruiting fetuses whose parents have a high socioeconomic status (SES). Lu et al. (2021) have shown that SES is associated with larger brain volumes, potentially affecting microstructure. However, since we are not performing groupwise comparisons, it is unlikely that this effect will have an impact on our results. Third, the sophisticated methods utilized in this study limit their immediate application in the clinic. Some of the normative values can still inform 2D ROIs measurements from individual clinical subjects. We also hope that the use of artificial intelligence methods and the dissemination of existing atlases of fetal brain development (Gholipour et al. 2017; Khan et al. 2019; Karimi et al. 2021, 2022; Wilson et al. 2023) will facilitate these translations. Finally, there is no direct histologic data to validate the putative biological changes driving the changes in MD and FA that we observed.
This comprehensive analysis of motion-corrected fetal brain DTI addresses prior lack of knowledge regarding the evolution of MD and FA in vivo in prenatal life. Future studies are needed to evaluate the effect of various maternal and fetal diseases on brain microstructure and their significance in understanding the vulnerability of various diseases, the effectiveness of therapies, and the potential to predict long-term neurodevelopmental outcomes.
Author contributions
Camilo Calixto (Conceptualization, Data curation, Formal analysis, Investigation, Methodology, Software, Writing—original draft, Writing—review & editing), Fedel Machado-Rivas (Conceptualization, Data curation, Formal analysis, Investigation, Methodology, Validation, Visualization, Writing—original draft, Writing—review & editing), Maria C. Cortes-Albornoz (Data curation, Investigation, Methodology, Visualization, Writing—original draft, Writing—review & editing), Davood Karimi (Conceptualization, Formal analysis, Funding acquisition, Investigation, Supervision, Validation, Writing—review & editing), Clemente Velasco-Annis (Investigation, Resources, Software, Validation, Writing—review & editing), Onur Afacan (Conceptualization, Funding acquisition, Investigation, Resources, Supervision, Validation, Writing—review & editing), Simon. K. Warfield (Conceptualization, Funding acquisition, Investigation, Supervision, Validation, Visualization, Writing—review & editing), Ali Gholipour (Conceptualization, Formal analysis, Funding acquisition, Investigation, Methodology, Resources, Software, Validation, Writing—review & editing), Camilo Jaimes (Conceptualization, Funding acquisition, Investigation, Methodology, Project administration, Resources, Validation, Writing—original draft, Writing—review & editing)
Abbreviations
bSSFP = balanced steady-state free precession images, DTI = diffusion tensor imaging, FA = fractional anisotropy, GA = gestational age, MD = mean diffusivity, ROI = region of interest, SES = socio economic status, SSFSE = weighted single-shot fast spin echo, WM = white matter.
Supplementary Material
Contributor Information
Camilo Calixto, Computational Radiology Laboratory, Department of Radiology, Boston Children’s Hospital, Boston, MA 02115, United States; Department of Radiology, Harvard Medical School, Boston, MA 02115, United States.
Fedel Machado-Rivas, Department of Radiology, Harvard Medical School, Boston, MA 02115, United States; Department of Radiology, Massachusetts General Hospital, Boston, MA 02114, United States.
Maria C Cortes-Albornoz, Department of Radiology, Harvard Medical School, Boston, MA 02115, United States; Department of Radiology, Massachusetts General Hospital, Boston, MA 02114, United States.
Davood Karimi, Computational Radiology Laboratory, Department of Radiology, Boston Children’s Hospital, Boston, MA 02115, United States; Department of Radiology, Harvard Medical School, Boston, MA 02115, United States.
Clemente Velasco-Annis, Computational Radiology Laboratory, Department of Radiology, Boston Children’s Hospital, Boston, MA 02115, United States; Department of Radiology, Harvard Medical School, Boston, MA 02115, United States.
Onur Afacan, Computational Radiology Laboratory, Department of Radiology, Boston Children’s Hospital, Boston, MA 02115, United States; Department of Radiology, Harvard Medical School, Boston, MA 02115, United States.
Simon K Warfield, Computational Radiology Laboratory, Department of Radiology, Boston Children’s Hospital, Boston, MA 02115, United States; Department of Radiology, Harvard Medical School, Boston, MA 02115, United States.
Ali Gholipour, Computational Radiology Laboratory, Department of Radiology, Boston Children’s Hospital, Boston, MA 02115, United States; Department of Radiology, Harvard Medical School, Boston, MA 02115, United States.
Camilo Jaimes, Department of Radiology, Harvard Medical School, Boston, MA 02115, United States; Department of Radiology, Massachusetts General Hospital, Boston, MA 02114, United States.
Funding
This work was supported in part by the National Institute of Biomedical Imaging and Bioengineering (grant numbers R01 EB018988, R01 EB031849, R01 EB032366, R01 EB019483); the National Institute of Neurological Disorders and Stroke (grant numbers R01 NS106030, R01 NS121657); the U.S. National Library of Medicine (grant number R01 LM013608); Eunice Kennedy Shriver National Institute of Child Health and Human Development of the National Institutes of Health (NIH) (grant number R01 HD1093950); NIH Office of the Director (grant number S10 OD25111); National Science Foundation (NSF) (grant number 212306); support from the Rosamund Stone Zander Translational Neuroscience Center, Boston Children’s Hospital. C.J. was partly supported by the American Roentgen Ray Society scholarship and a career development award from the Office of Faculty Development at Boston Children’s Hospital. The content of this publication is solely the responsibility of the authors and does not necessarily represent the official views of the NIH, the NSF, the American Roentgen Ray Society, or Boston Children’s Hospital.
Conflict of interest statement: C.C. No relevant relationships. F.M.R. No relevant relationships. M.C.A. No relevant relationships. D.K. No relevant relationships. C.V.A. No relevant relationships. O.A. No relevant relationships. S.K.W. No relevant relationships. A.G. No relevant relationships. C.J. No relevant relationships..
Data availability
The data supporting this study's findings are available from the corresponding author, Camilo Jaimes, MD, upon reasonable request.
References
- Afacan O, Estroff JA, Yang E, Barnewolt CE, Connolly SA, Parad RB, Mulkern RV, Warfield SK, Gholipour A. Fetal Echoplanar imaging: promises and challenges. Top Magn Reson Imaging TMRI. 2019:28:245–254. [DOI] [PMC free article] [PubMed] [Google Scholar]
- Akhondi-Asl A, Warfield SK. Simultaneous truth and performance level estimation through fusion of probabilistic segmentations. IEEE Trans Med Imaging. 2013:32:1840–1852. [DOI] [PMC free article] [PubMed] [Google Scholar]
- Back SA, Luo NL, Borenstein NS, Volpe JJ, Kinney HC. Arrested oligodendrocyte lineage progression during human cerebral white matter development: dissociation between the timing of progenitor differentiation and myelinogenesis. J Neuropathol Exp Neurol. 2002:61:197–211. [DOI] [PubMed] [Google Scholar]
- Berman JI, Hamrick SEG, McQuillen PS, Studholme C, Xu D, Henry RG, Hornberger LK, Glenn OA. Diffusion-weighted imaging in fetuses with severe congenital heart defects. AJNR Am J Neuroradiol. 2011:32:E21–E22. [DOI] [PMC free article] [PubMed] [Google Scholar]
- Calixto C, Machado-Rivas F, Karimi D, Cortes-Albornoz MC, Acosta-Buitrago LM, Gallo-Bernal S, Afacan O, Warfield SK, Gholipour A, Jaimes C. Detailed anatomic segmentations of a fetal brain diffusion tensor imaging atlas between 23 and 30 weeks of gestation. Hum Brain Mapp. 2023:44:1593–1602. [DOI] [PMC free article] [PubMed] [Google Scholar]
- Culjat M, Milošević NJ. Callosal septa express guidance cues and are paramedian guideposts for human corpus callosum development. J Anat. 2019:235:670–686. [DOI] [PMC free article] [PubMed] [Google Scholar]
- Eaton-Rosen Z, Scherrer B, Melbourne A, Ourselin S, Neil JJ, Warfield SK. Investigating the maturation of microstructure and radial orientation in the preterm human cortex with diffusion MRI. NeuroImage. 2017:162:65–72. [DOI] [PubMed] [Google Scholar]
- Feng L, Li H, Oishi K, Mishra V, Song L, Peng Q, Ouyang M, Wang J, Slinger M, Jeon T, et al. Age-specific gray and white matter DTI atlas for human brain at 33, 36 and 39 postmenstrual weeks. NeuroImage. 2019:185:685–698. [DOI] [PMC free article] [PubMed] [Google Scholar]
- Gholipour A, Rollins CK, Velasco-Annis C, Ouaalam A, Akhondi-Asl A, Afacan O, Ortinau CM, Clancy S, Limperopoulos C, Yang E, et al. A normative spatiotemporal MRI atlas of the fetal brain for automatic segmentation and analysis of early brain growth. Sci Rep. 2017:7:476. [DOI] [PMC free article] [PubMed] [Google Scholar]
- Gupta RK, Hasan KM, Trivedi R, Pradhan M, Das V, Parikh NA, Narayana PA. Diffusion tensor imaging of the developing human cerebrum. J Neurosci Res. 2005:81:172–178. [DOI] [PubMed] [Google Scholar]
- Huang H, Xue R, Zhang J, Ren T, Richards LJ, Yarowsky P, Miller MI, Mori S. Anatomical characterization of human Fetal brain development with diffusion tensor magnetic resonance imaging. J Neurosci. 2009:29:4263–4273. [DOI] [PMC free article] [PubMed] [Google Scholar]
- Jaimes C, Machado-Rivas F, Chen K, Bedoya MA, Yang E, Orbach DB. Brain injury in Fetuses with vein of Galen malformation and Nongalenic arteriovenous fistulas: static snapshot or a portent of more? AJNR Am J Neuroradiol. 2022:43:1036–1041. [DOI] [PMC free article] [PubMed] [Google Scholar]
- Karimi D, Jaimes C, Machado-Rivas F, Vasung L, Khan S, Warfield SK, Gholipour A. Deep learning-based parameter estimation in fetal diffusion-weighted MRI. NeuroImage. 2021:243:118482. [DOI] [PMC free article] [PubMed] [Google Scholar]
- Karimi D, Rollins CK, Velasco-Annis C, Ouaalam A, Gholipour A. Learning to segment fetal brain tissue from noisy annotations; Medical Image Analysis. 2023:85:102731. [DOI] [PMC free article] [PubMed] [Google Scholar]
- Khan S, Vasung L, Marami B, Rollins CK, Afacan O, Ortinau CM, Yang E, Warfield SK, Gholipour A. Fetal brain growth portrayed by a spatiotemporal diffusion tensor MRI atlas computed from in utero images. NeuroImage. 2019:185:593–608. [DOI] [PMC free article] [PubMed] [Google Scholar]
- Koay CG, Chang L-C, Carew JD, Pierpaoli C, Basser PJ. A unifying theoretical and algorithmic framework for least squares methods of estimation in diffusion tensor imaging. J Magn Reson. 2006:182:115–125. [DOI] [PubMed] [Google Scholar]
- Kostović I, Sedmak G, Judaš M. Neural histology and neurogenesis of the human fetal and infant brain. NeuroImage. 2019:188:743–773. [DOI] [PubMed] [Google Scholar]
- Lu Y-C, Kapse K, Andersen N, Quistorff J, Lopez C, Fry A, Cheng J, Andescavage N, Wu Y, Espinosa K, et al. Association between socioeconomic status and in utero Fetal brain development. JAMA Netw Open. 2021:4:e213526. [DOI] [PMC free article] [PubMed] [Google Scholar]
- Maas LC, Mukherjee P, Carballido-Gamio J, Veeraraghavan S, Miller SP, Partridge SC, Henry RG, Barkovich AJ, Vigneron DB. Early laminar organization of the human cerebrum demonstrated with diffusion tensor imaging in extremely premature infants. NeuroImage. 2004:22:1134–1140. [DOI] [PubMed] [Google Scholar]
- Machado-Rivas F, Afacan O, Khan S, Marami B, Velasco-Annis C, Lidov H, Warfield SK, Gholipour A, Jaimes C. Spatiotemporal changes in diffusivity and anisotropy in fetal brain tractography. Hum Brain Mapp. 2021:42:5771–5784. [DOI] [PMC free article] [PubMed] [Google Scholar]
- Machado-Rivas F, Cortes-Albornoz MC, Afacan O, Bedoya MA, Calixto C, Choi JJ, Ruggiero M, Gholipour A, Jaimes C. Fetal MRI at 3T: principles to optimize success. Radiographics. 2023:43:e220141. [DOI] [PMC free article] [PubMed] [Google Scholar]
- Marami B, Scherrer B, Afacan O, Erem B, Warfield SK, Gholipour A. Motion-robust diffusion-weighted brain MRI reconstruction through slice-level registration-based motion tracking. IEEE Trans Med Imaging. 2016:35:2258–2269. [DOI] [PMC free article] [PubMed] [Google Scholar]
- Marami B, Mohseni Salehi SS, Afacan O, Scherrer B, Rollins CK, Yang E, Estroff JA, Warfield SK, Gholipour A. Temporal slice registration and robust diffusion-tensor reconstruction for improved fetal brain structural connectivity analysis. NeuroImage. 2017:156:475–488. [DOI] [PMC free article] [PubMed] [Google Scholar]
- McKinstry RC. Radial Organization of Developing Preterm Human Cerebral Cortex Revealed by non-invasive water diffusion anisotropy MRI. Cereb Cortex. 2002:12:1237–1243. [DOI] [PubMed] [Google Scholar]
- Mitter C, Prayer D, Brugger PC, Weber M, Kasprian G. In vivo Tractography of Fetal association Fibers. PLoS One. 2015:10:e0119536. [DOI] [PMC free article] [PubMed] [Google Scholar]
- Mukherjee P, McKinstry RC. Diffusion tensor imaging and Tractography of human brain development. Neuroimaging Clin N Am. 2006:16:19–43. [DOI] [PubMed] [Google Scholar]
- Schneider J, Kober T, Bickle Graz M, Meuli R, Hüppi PS, Hagmann P, Truttmann AC. Evolution of T1 relaxation, ADC, and fractional anisotropy during early brain maturation: a serial imaging study on preterm infants. Am J Neuroradiol. 2016:37:155–162. [DOI] [PMC free article] [PubMed] [Google Scholar]
- Song JW, Gruber GM, Patsch JM, Seidl R, Prayer D, Kasprian G. How accurate are prenatal tractography results? A postnatal in vivo follow-up study using diffusion tensor imaging. Pediatr Radiol. 2018:48:486–498. [DOI] [PMC free article] [PubMed] [Google Scholar]
- Sotardi S, Gollub RL, Bates SV, Weiss R, Murphy SN, Grant PE, Ou Y. Voxelwise and regional brain apparent diffusion coefficient changes on MRI from birth to 6 years of age. Radiology. 2021:298:415–424. [DOI] [PMC free article] [PubMed] [Google Scholar]
- Trivedi R, Gupta RK, Husain N, Rathore RKS, Saksena S, Srivastava S, Malik GK, Das V, Pradhan M, Sarma MK, et al. Region-specific maturation of cerebral cortex in human fetal brain: diffusion tensor imaging and histology. Neuroradiology. 2009:51:567–576. [DOI] [PubMed] [Google Scholar]
- Veraart J, Sijbers J, Sunaert S, Leemans A, Jeurissen B. Weighted linear least squares estimation of diffusion MRI parameters: strengths, limitations, and pitfalls. NeuroImage. 2013:81:335–346. [DOI] [PubMed] [Google Scholar]
- Widjaja E, Geibprasert S, Mahmoodabadi SZ, Blaser S, Brown NE, Shannon P. Alteration of human Fetal subplate layer and intermediate zone during normal development on MR and diffusion tensor imaging. Am J Neuroradiol. 2010:31:1091–1099. [DOI] [PMC free article] [PubMed] [Google Scholar]
- Wilson S, Pietsch M, Cordero-Grande L, Price AN, Hutter J, Xiao J, McCabe L, Rutherford MA, Hughes EJ, Counsell SJ, et al. Development of human white matter pathways in utero over the second and third trimester. Proc Natl Acad Sci. 2021:118:e2023598118. [DOI] [PMC free article] [PubMed] [Google Scholar]
- Wilson S, Pietsch M, Cordero-Grande L, Christiaens D, Uus A, Karolis VR, Kyriakopoulou V, Colford K, Price AN, Hutter J, et al. Spatiotemporal tissue maturation of thalamocortical pathways in the human fetal brain. elife. 2023:12:e83727. [DOI] [PMC free article] [PubMed] [Google Scholar]
- Wimberger DM, Roberts TP, Barkovich AJ, Prayer LM, Moseley ME, Kucharczyk J. Identification of “premyelination” by diffusion-weighted MRI. J Comput Assist Tomogr. 1995:19:28–33. [DOI] [PubMed] [Google Scholar]
- Xu G, Takahashi E, Folkerth RD, Haynes RL, Volpe JJ, Grant PE, Kinney HC. Radial coherence of diffusion tractography in the cerebral white matter of the human fetus: neuroanatomic insights. Cereb Cortex. 2014:24:579–592. [DOI] [PMC free article] [PubMed] [Google Scholar]
- Yakovlev PI, Lecours A. The myelogenetic cycles of regional maturation of the brain. In Regional development of the brain in early life. F.A. Davis Company. 1967. p. 3–70.
- Yu Q, Ouyang A, Chalak L, Jeon T, Chia J, Mishra V, Sivarajan M, Jackson G, Rollins N, Liu S, et al. Structural development of human Fetal and preterm brain cortical plate based on population-averaged templates. Cereb Cortex. 2016:26:4381–4391. [DOI] [PMC free article] [PubMed] [Google Scholar]
- Zhang H, Avants BB, Yushkevich PA, Woo JH, Wang S, McCluskey LF, Elman LB, Melhem ER, Gee JC. High-dimensional spatial normalization of diffusion tensor images improves the detection of white matter differences: an example study using amyotrophic lateral sclerosis. IEEE Trans Med Imaging. 2007:26:1585–1597. [DOI] [PubMed] [Google Scholar]
Associated Data
This section collects any data citations, data availability statements, or supplementary materials included in this article.
Supplementary Materials
Data Availability Statement
The data supporting this study's findings are available from the corresponding author, Camilo Jaimes, MD, upon reasonable request.