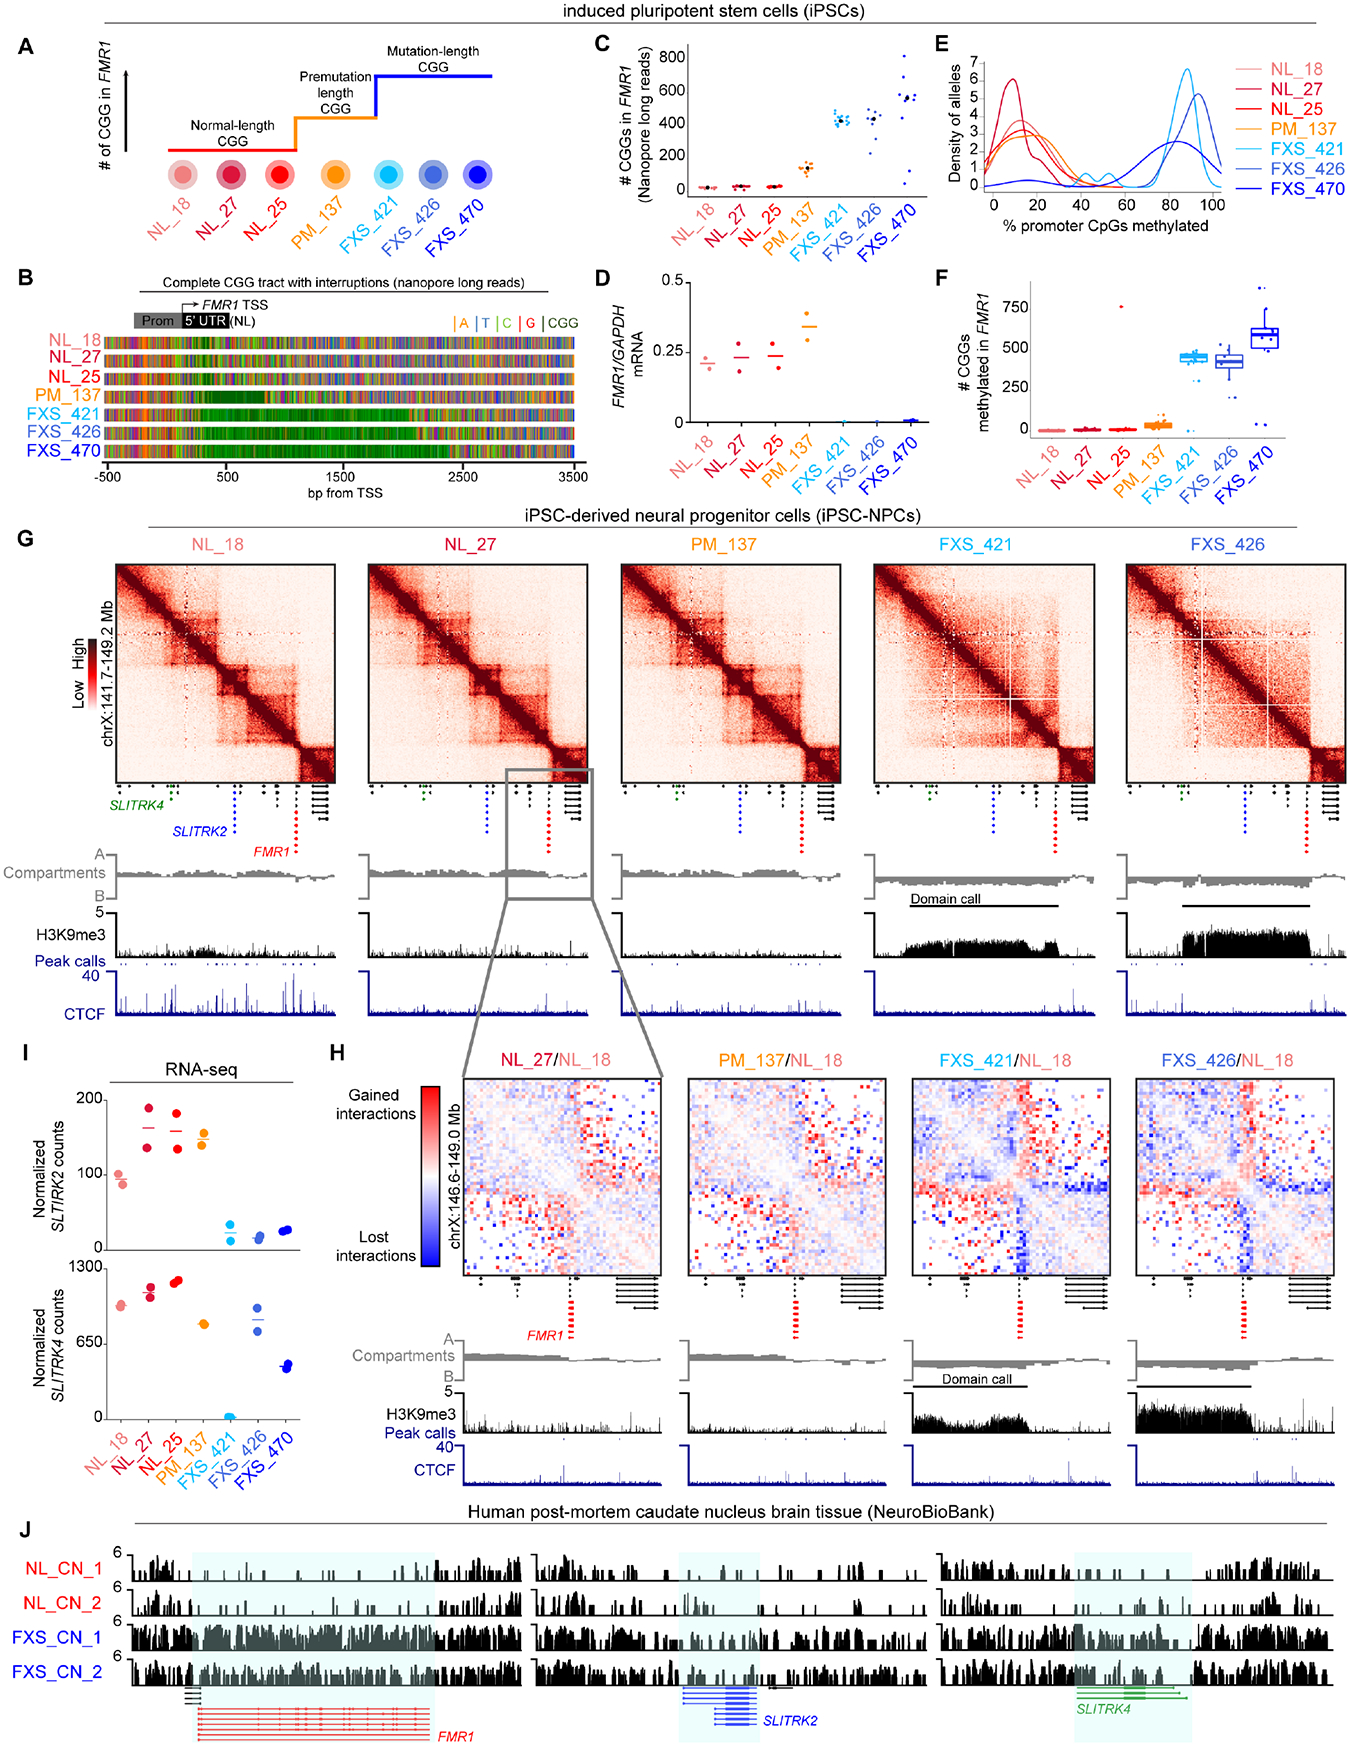
Figure 1. A Megabase-sized H3K9me3 domain spreads upstream of the FMR1 locus in iPSC-derived NPCs and post-mortem caudate nucleus brain tissue from FXS patients.

(A) Schematic of iPSC lines used to model FMR1 CGG expansion in FXS, including normal-length (NL), premutation-length (PM), and mutation-length (FXS). (B) Representative Nanopore long-reads across the FMR1 5’UTR. Colors reflect nucleotides (orange: A, blue: T, green: C, red: G, dark green: CGG). (C) Number of CGG triplets in the FMR1 5’UTR from Nanopore long-reads. (D) FMR1 mRNA levels normalized to GAPDH via qRT-PCR. Horizontal line, mean n=2 biological replicates. (E) Proportion of 19 CpG dinucleotides methylated in the 500 bp FMR1 promoter computed from Nanopore long-reads. (F) Proportion of CGG triplets methylated within the 5’ UTR STR using STRique. Each dot, one allele. (G) Hi-C and ChIP-seq in iPSC-NPCs across a 5Mb region around FMR1. (H) Hi-C fold-change interaction frequency maps. Gained and lost contacts compared to NL_18 highlighted in red and blue, respectively. (I) SLITRK2 and SLITRK4 mRNA levels via RNA-seq. Horizontal lines, mean n=2 biological replicates. (J) H3K9me3 CUT&RUN in brain tissue from N=2 FXS patients with sex- and age-matched N=2 normal-length individuals.
