

Abstract
With the recent advent of single-cell level biological understanding, a growing interest is in identifying cell states or subtypes that are homogeneous in terms of gene expression and are also enriched in certain biological conditions, including disease samples versus normal samples (condition-specific cell subtype). Despite the importance of identifying condition-specific cell subtypes, existing methods have the following limitations: since they train models separately between gene expression and the biological condition information, (1) they do not consider potential interactions between them, and (2) the weights from both types of information are not properly controlled. Also, (3) they do not consider non-linear relationships in the gene expression and the biological condition. To address the limitations and accurately identify such condition-specific cell subtypes, we develop scDeepJointClust, the first method that jointly trains both types of information via a deep neural network. scDeepJointClust incorporates results from the power of state-of-the-art gene-expression-based clustering methods as an input, incorporating their sophistication and accuracy. We evaluated scDeepJointClust on both simulation data in diverse scenarios and biological data of different diseases (melanoma and non-small-cell lung cancer) and showed that scDeepJointClust outperforms existing methods in terms of sensitivity and specificity. scDeepJointClust exhibits significant promise in advancing our understanding of cellular states and their implications in complex biological systems.
Keywords: single-cell transcriptomics, deep neural network, cell type clustering, joint learning
INTRODUCTION
The expansion of single-cell measurements, e.g. single-cell RNA-Seq (scRNA-Seq) data across multiple sources, allows researchers to identify cellular states or subtypes that exhibit a homogeneous molecular behavior in terms of gene expression. A growing interest in scRNA-seq analysis is in identifying cell states or subgroups enriched in specific biological conditions, such as cells distributed across different tissues [1], those from individuals of different phenotypes [2–4], across different biological contexts [5] or even across species [6]. Identifying such condition-specific cell subgroups is important from both biological and clinical standpoints. From a biological standpoint, even the same types of cells may exhibit distinct states based on their developmental stage, function and responses to external stimuli [7–9]. Thus, the identification of condition-specific cells helps comprehend the mechanisms of tissue development, immune responses and disease progression. Identifying cell states that are associated with certain biological conditions can help improve clinical outcomes under particular treatment regimens and further help to develop targeted therapies [10].
Despite the importance of identifying condition-specific cell subtypes, existing methods have not explicitly utilized biological condition information for cell subtype clustering. Instead, condition-specific cell subgroups have been defined in one of the three approaches. The first approach is to conduct clustering purely based on gene expression information and then utilize the biological condition information. To achieve this, several methods embed the gene expression information of cells into a graph structure, such as a k-nearest neighbor (KNN) graph, and detect dense regions in the graph through community detection algorithms. While two popular algorithms, Louvain [11] and Leiden [12], employed this approach, Leiden improves over the Louvain algorithm using an additional refinement step to make the community structure more stable and less dependent on the initial grouping. The identified cell clusters are further examined whether they are enriched in a certain biological condition compared to other condition(s) (e.g. tumor samples versus normal), which is called a differential abundance test. In the second approach, the two steps can be reversed in the analysis pipeline. Specifically, one could first conduct a differential abundance test based on a biological condition without identifying cell clusters and further perform clustering based on the result. For example, Milo [13] allows users to perform differential abundance analysis without defining the cell clusters by identifying sets of local cells similar in the gene expression profile called neighbors. Since the neighbors redundantly represent mixture of cells and not all the cells are sampled in the neighborhood representation, they cannot be directly used to define cell clusters. However, after clustering the cells separately, the neighbors can be overlaid on the same graph structure. Since a differential abundance test is conducted for each neighbor, condition-specific cell subgroups can be visually identified by aligning the cell clusters with the neighbors that are enriched in specific biological conditions. As a third approach, a few machine-learning methods have been proposed to analyze the multi-condition scRNA-Seq data sets. For example, scINSIGHT [14] and SR2 [15] utilize matrix factorization to identify condition-specific variations versus variations from other sources such as different batches. Although they demonstrated substantial performance in identifying certain cell states associated with specific biological conditions, their linear equation–based approach is not designed to understand non-linear relationships of cell identity.
To accurately identify condition-specific cell states or subtypes, we identified three limitations of existing methods. First, the first two approaches do not consider potential interactions between gene expression and the biological condition information. Since samples of a particular biological condition would render distinct biological functions represented in distinct molecular behavior, it is expected that the distinct molecular behavior is represented in the level of gene expression. Due to this interaction, optimizing one criterion after another would not be able to model the interactions and thus be a less integrated and holistic approach. Second, when all three approaches train the gene expression information and the biological information separately, the biological condition’s weight and influence can be effectively diluted and diminished during the optimization process. When identifying cell states based on both gene expression information and the biological condition, it is essential to explicitly control the weight of the two criteria. This is because while gene expression information typically represents tens of thousands of genes, we are interested in a particular type of biological condition at any given time. Thirdly, all three approaches do not fully consider the non-linear relationship of cell identity. For example, in the case of Milo, which relies on a simple KNN data structure, the ability to uncover the complex relationship among cells is limited. As a result, the method is likely to overlook critical non-linear associations between cell states and the biological condition of interest. However, cells undergo a series of differentiation events that lead to the formation of distinct cell types with specialized functions, rendering a unique set of molecular characteristics that non-linearly determine their identity and functional properties. Therefore, it is essential to learn the non-linear relationship in how the cell states are defined with respect to gene expression and the biological condition information.
In this manuscript, we present scDeepJointClust as the first solution to address the limitations altogether. Firstly, to enable simultaneous training on both gene expression and the biological condition information, scDeepJointClust adopts a joint-learning approach where the model is simultaneously trained on both information. Second, to effectively control the weights of both the gene expression and the biological condition in the joint learning process, scDeepJointClust takes the expression-based clustering result from existing methods as an input as well as the biological condition information. This feature enables scDeepJointClust to update the clustering results from the best existing method using gene expression to represent the molecular behavior more accurately since multiple methods have been developed for cell clustering based on gene expression only. Also, scDeepJointClust incorporates biological information to refine the cell clustering results via joint optimization process. Thirdly, to learn the complex and non-linear relationship in how cell states are defined with the input data, scDeepJointClust utilizes the DNN method that can model the non-linearity with a number of neuron layers.
Using scDeepJointClust on various simulation data of multiple scenarios and real biological data of different contexts, such as patients with advanced melanoma and non-small-cell lung cancer (NSCLC) undergoing immune checkpoint blockade (ICB) therapy, we demonstrate the advantage of using scDeepJointClust over existing methods in terms of sensitivity and specificity. Altogether, we develop a DNN-based joint-learning method that simultaneously optimizes the information of gene expression and the biological condition to successfully identify cellular states linked to a biological condition with the highest sensitivity and specificity.
METHODS
DL in computational biology
scDeepJointClust represents the first attempt, to the best of our knowledge, to explicitly identify cell states that are not only representative of gene expression but also associated with biological conditions using a deep neural network (DNN) model in a joint learning framework. Previously, DNN joint learning approaches have demonstrated successful applications across diverse scientific domains, effectively integrating multiple sources of information to solve complex problems. For instance, in the context of speech recognition where DNN models have been extensively utilized, a multi-feature and multi-task DNN method learns multiple acoustic features to successfully enhance language recognition performance [16]. Similarly, to classify images, a DNN method was proposed to consider both class label information and local spatial details, exhibiting remarkable accuracy on various benchmark datasets when compared to baseline methods [17]. Remarkably, the DNN method for image classification addresses a problem structure akin to ours where the class label and local information are replaced by the biological information and gene expression information. Due to this similarity, it underscores the potential of the DNN joint learning approach in effectively solving our specific problem. DNN approaches have been used in the context of scRNA-Seq data, albeit without the utilization of joint learning. For instance, a DNN model was proposed to correctly solve cell type–related problems, such as identifying new cell types and states, by integrating pathway knowledge [18] as prior knowledge. Also, a recent work selects genes whose expression pattern is shared by the cells of the same type by reducing representation in the output layer of denoising autoencoder [19] with neural approximator (DAWN) and pairing this reduced representation with the model-based EM clustering.
Model setting
The proposed method consists of an input layer, a dropout layer,  hidden layers, a cell type classification output layer and a responder–non-responder classification output layer. The first input data is a single-cell level gene expression matrix
  consisting of
  cells (in rows) and
  genes (in columns). The second input data is cell type matrix
  in which each row
  , where
  is the number of cell clusters defined using gene expression information, where
  if cell
  belongs to cluster
  and 0 otherwise. The third input data is cell origin label matrix
  in which each row
  , where
  is the number of biological conditions, where
  if cell
  belongs to condition
  and 0 otherwise. The input layer passes on its output to the dropout layer. The dropout layer randomly sets 5% of its neuron units to 0 at each step of the training procedure. As a result, only relevant genes would be selected as parts of the final representation layer. For each of the
  hidden layers
  , we use Glorot normal initializer (Xavier normal initializer) for initializing the layer weights and rectified linear units (ReLU) as its activation function. The output of
  can be described as follows:
 |
where  is the weight matrix,
  is the output of the previous layer and
  is the bias term for this layer.
As cell types are perceived as classes, we compute the loss between the cell-type output layer’s predictions and the true labels based on categorical cross-entropy and use softmax as the activation function for the cell-type output layer. The output of the cell-type output layer can be described as follows:
 |
where  is the weight matrix,
  is the output of the last hidden layer and
  is the bias term for the layer.
If there are multiple biological conditions, we use the same softmax function to optimize. However, since biological conditions are often binary (e.g. case versus control or responder versus non-responder), we provide an option of coding it as such and computing the loss between the responder–non-responder output layer’s predictions and the true labels based on cross-entropy and then using the sigmoid activation function for the output layer. The output of this layer can be described as follows:
 |
where  is the weight matrix,
  is the output of the last hidden layer and
  is the bias term for the layer. The hyperparameters are listed in Table 1. We used the usual dropout rate of 0.05 [20, 21]. Higher dropout rates have been used when the purpose is to select important features. However, since we are interested in clustering data points with all the features, we decided not to try higher dropout rates.
Table 1.
Model hyperparameters
| Hyperparameter | Value |
|---|---|
| Number of neurons in the first hidden layer | Number of input features +1024 |
| Number of neurons in the second hidden layer | Number of input features +512 |
| Number of neurons in the third hidden layer | Number of input features |
| Batch size | 32 |
| Number of epochs | 60 |
| Dropout rate after the input layer | 0.05 |
| Learning rate | 0.001 |
| Activation function for hidden layers | ReLU |
| Kernel initializer for hidden layers | Xavier normal initializer |
| Activation function for the cell-type output layer | Softmax |
| Activation function for the condition output layer | Sigmoid |
| Optimizer | Adam algorithm |
Objective function and optimization
Since our method is a joint learning algorithm, the objective function includes two loss functions, a classification loss from the cell type predictions and a classification loss from the biological condition predictions. The cell type prediction loss is calculated as follows:
 |
where  and
and  are two vectors in a one-hot representation,
  is the true value (0 or 1) of
  element in the one-hot vector
  and
and  is the predicted probability of
  being categorized as
  cell type.
The cell origin prediction is calculated as follows:
 |
where  is the true value of
  being a responder and
  is the predicted probability of
  being a responder.
With these two losses, the objective function for the proposed method can be described as follows:
 |
where  is a user-defined value for controlling how much emphasis should be put on cell type information and
  is a user-defined value for controlling how much emphasis should be put on responder–responder information. Currently, we are using 0.7 and 0.3 for λt and λr, respectively.
To minimize this objective function, we use the Adam optimization algorithm, which is a stochastic gradient descent method, to retrieve the optimal network parameters  .
.
The clustering module on the scDeepJointClust’s representation layer
For this work, we utilized the K-means clustering algorithm [22] in the clustering module [23], and the implementation of the algorithm is provided and maintained by scikit-learn [24].
The K-mean clustering algorithm aims to partition the input data X with N observations into K clusters. The algorithm works in the following fashion:
(i) Randomly selects K centroids as the beginning points for each cluster.
(ii) For each data point
 , calculate the distance between
  and centroid
  using a distance metric, and assign
  to its closest cluster centroid
  .
.(iii) For each cluster, calculate the average of all the data points in this cluster and re-initialize its centroid based on the average.
(iv) Keep repeating steps 2 and 3 until there is no change in the assignments of data points to clusters, meaning the centroids have stabilized.
Simulation data
We used the R package dyntoy [25] to generate simulated single-cell datasets with discrete clusters. For each simulated dataset with two simulated experimental conditions (C1 and C2), we generated 10 discrete clusters, and in each of these clusters, we assigned 90% of the cells to one of the two simulated experimental conditions and the rest 10% of the cells to the other condition. If 5 of these 10 clusters were dominated by condition C1 (90% of the cells belong to C1), then the other 5 clusters were populated with the other condition C2 (90% of the cells belong to C2) and vice versa.
We also simulated 10 clusters with three conditions experimental conditions (C1, C2 and C3). For each of the first three clusters, C1 is the dominant experimental condition where 80% of the samples were assigned as C1, 10% as C2 and the other 10% as C3. For the next three clusters, C2 is the main experimental condition, in which 80% of the samples are C2 and the rest of 20% are made of C1 and C3. The rest of the four discrete clusters consist of 80% of C3 samples, 10% of C1 samples and 10% of C2 samples.
This simulation procedure was introduced by Milo.
NSCLC scRNA-seq data
The NSCLC CITE-seq dataset was presented in Leader et al. [7]. We downloaded the NSCLC metadata from their GitHub repository: https://github.com/effiken/Leader_et_al. The scRNA-seq data pre-processing workflow in this work, e.g. the selection and filtration of cells based on QC metrics, data normalization and scaling and the detection of highly variable features, was performed using the R package Seurat [26], an R toolkit that is widely used in the field of computational biology to analyze scRNA-seq data.
Benchmarked clustering methods
We evaluated our method against three existing clustering methods. This section provides details on what packages were used and how they were run.
(i) Louvain [11]: The Louvain algorithm is a popular hierarchical clustering method used to identify communities within complex biological networks. This algorithm calculates a modularity score for each community to maximize the detection of communities. The modularity score is typically used to evaluate how well nodes are assigned to communities. All the Louvain clustering runs were performed using the Python package Scanpy [27], which is a scalable toolkit for analyzing single-cell gene expression data. We performed principal component analysis (PCA) on the data before running Louvain.
(ii) Leiden [12]: Leiden is also a hierarchical clustering algorithm, which is based on Louvain. The algorithm has been modified to address the issue of poorly connected communities. This is done by periodically breaking down the communities into smaller, more well-connected ones. The Leiden implementation used in this work is also supported by the Python package Scanpy [18]. PCA was also computed before Leiden was performed.
(iii) Milo [28]: Milo is developed to perform differential abundance testing by assigning cells to partially overlapping neighborhoods on a KNN graph. We used the Python implementation of Milo algorithm (https://github.com/emdann/milopy). As Milo requires a KNN graph before performing its downstream analysis, we used the KNN implementation from the Python package Scanpy [18] to build such graphs. Although Milo’s neighbors redundantly represent mixture of cells and not all the cells are sampled in the neighborhood representation and thus cannot be directly used to define cell clusters, Milo can also cluster cells based on the KNN algorithm without explicitly using the biological condition information. It presents a suitable choice for our comparison experiment.
scRNA-Seq annotation
The cell type annotation was performed using an R package called ‘SingleR’ [29], a novel computational method used for performing unbiased cell type annotation on scRNA-seq data. SingleR annotates each cell by leveraging a reference transcriptomic dataset of pure cell types. The reference transcriptomic dataset used in this work is generated and supplied by Blueprint and ENCODE [30].
RESULTS
Cell clustering optimization by jointly training on gene expression and the biological condition information
To accurately identify cell states linked to a biological condition (e.g. tumor versus normal samples), we present scDeepJointClust (Figure 1A) to address the limitations in existing approaches. To address the first limitation that the training is separated for gene expression and the biological condition information, scDeepJointClust simultaneously optimizes two cross-entropy loss functions,  for the gene-expression information and
  for the biological condition information of the cells (see Methods). To address the second limitation that the weight of the gene expression information versus that of the biological condition information is not controlled in the training, scDeepJointClust sets
  with the clustering results generated by a method of user’s choice. By optimizing
  this way, scDeepJointClust first embeds the cluster structure onto the deep learning model. During the embedding, scDeepJointClust also optimizes
  to enhance the identification of cell states with the biological condition information. By controlling the weights between
  and
and  , practitioners can control their contribution to the final clustering result. As illustrated in Figure 1B, cell clusters often exhibit overlapping gene expression patterns, such as cluster 3 overlapping with cluster 2 in the illustration. If the clusters convey valuable biological signals associated with a specific biological condition, they are expected to exhibit certain levels of enrichment or depletion based on the biological condition information. For example, in Figure 1C, clusters 1 and 3 show an enrichment of condition A while cluster 2 shows an enrichment of condition B. If condition A represents a disease state (e.g. tumor) and condition B represents a control state (e.g. normal), then clusters 1 and 3 would represent the cells associated with biological processes related to the tumors. To solve the third limitation of the complex relationship in cell identity with the input data, scDeepJointClust uses a DNN component to encapsulate the complex and non-linear relationships using multiple layers of non-linear activators called neurons (Figure 1A). Specifically, the neurons in the first layer learn to extract low-level representations from the input data, while neurons in the subsequent layers learn to extract higher-level features from the low-level representations. Each layer acts as a non-linear transformation of the input data, making the model more expressive and capable of capturing the complex relationships between the input data and the cell states.
Figure 1.

Overview of scDeepJointClust. (A) Given an input matrix of gene expression and the biological condition information (columns) over a set of cells (rows), the gene expression information is first used to produce the clustering result ( , step 1). Then, the clustering result is fed into the DNN component together with the biological information (
 , step 2). After training, the representation layer will transfer the training result to two output layers so the model can be optimized with two criteria
  and
and  . After the optimization, cells that were not confidently in a cluster based on the gene expression information may be clustered into a different cell type based on the enrichment information of the biological condition information. Using singleR, the updated clusters will be identified as cell types. (B) Anexample of three cell clusters on UMAP using the gene expression information. (C) The cells in the example clusters are presented with two biological conditions, A or B, where each cluster is characterized with one of either condition, cluster 1 and 3 with condition A and cluster 2 with condition B.
Concretely, scDeepJointClust employs several DNN techniques to accurately identify cell states linked to biological conditions from single-cell data. First, scDeepJointClust allows learning on biological conditions of with either binary or multiple values by adaptively designing the cell type output layer with either softmax (for multiple values) and sigmoid (for binary values). This adaptable design allows the analysis of single-cell data in both two-group and multi-group scenarios. As an example of the two-group scenarios, normal samples are compared with tumor samples to gain insight into tumor biological processes. An example of a multi-group comparison is the analysis of brain tissue samples collected at multiple developmental stages, such as early embryonic, mid-embryonic and late embryonic stages [31]. Second, scDeepJointClust utilizes dropout to prevent overfitting (see Methods). Overfitting is a serious problem in single-cell data analysis because single-cell data are high dimensional and noisy [32–35], and it is easy to fit a model that captures the noise additional to the underlying biological signal, leading to false discoveries and misinterpretation of the results [36–39]. By dropping out neurons, scDeepJointClust is forced to learn redundant representations and is less likely to rely on a few neurons to make decisions, encouraging a more robust and less overfitting estimation.
scDeepJointClust significantly improves existing methods for cell clustering by incorporating biological/clinical conditions
To show that scDeepJointClust improves cell clustering by incorporating biological conditions in addition to gene expression compared to the methods that incorporates gene expression only, we simulated 10 clusters of 10 000 cells with each cluster characterized by both types of information (see Methods). The gene expressions were simulated to reflect varying distances between cell clusters, representing different degrees of similarity among them, as is the case in biological data. The biological condition was simulated to exhibit differential enrichment degrees across the cell types. For example, we assigned a higher proportion (e.g. 80%) of a biological condition to several clusters while allocating a lower proportion (e.g. 20%) of the biological condition to the remaining clusters. With this experimental design, we conducted two simulation experiments with different scenarios. In the first scenario, we simulated two distinct biological conditions to simulate case–control sequencing experiments (e.g. tumor versus normal) (Figure 2A). On the simulated gene expression data, we ran existing clustering methods that take only gene expression information (Kmeans, Leiden, Louvain and Milo). Then, on each of the clustering results, we ran scDeepJointClust with the biological condition information to improve the clustering (Table 1 for the model hyperparameters). After repeating this experiment 100 times, we first investigated if the objective function converges as the training goes by epoch, showing that the objective functions are saturated well before the currently set epoch number (Supplementary Figure S1 available online at http://bib.oxfordjournals.org/). Then, we compared the clustering result to the ground truth definition of cell clusters in terms of Silhouette score. scDeepJointClust always significantly improves the existing methods (Figure 2B). Specifically, scDeepJointClust demonstrates over a 2-fold improvement compared to K-means-, Leiden- and Louvain-based clustering outcomes, while it also significantly improves the clustering result of Milo.
Figure 2.

Performance assessment using simulation data. (A) UMAP visualization of 10 simulated cell clusters using the gene expression information. On the visualization, the cells are colored by two simulated biological conditions, A or B. (B) Methods’ performance in silhouette score in 100 random trials for each experiment. While K-means, Leiden, Louvain and Milo represent the clustering result of the methods in terms of Silhouette score, DL-Kmeans, DL-Leiden, DL-Louvain, and DL-Milo represent the result of the refinement brought by scDeepJointClust. P-values were estimated using one-tailed paired t-test. (C) UMAP visualization of 10 simulated cell clusters using gene expression information. In the visualization, the cells are colored by three simulated biological conditions, A, B or C. (D) Methods’ performance in Silhouette score in 100 random trials for each experiment. P-values were estimated using one-tailed paired t-test. While Kmeans, Leiden, Louvain and Milo represent the clustering result of the methods in terms of Silhouette score, DL-Kmeans, DL-Leiden, DL-Louvain and DL-Milo represent the result of the refinement brought by scDeepJointClust.
Further, we simulated another scenario where three biological conditions, instead of two, are spread over 10 clusters of cells with varying distances from each other (Figure 2C). scDeepJointClust significantly improves the clustering results of the existing methods, similarly to the case of two biological conditions. Overall, the superior performance of scDeepJointClust illustrates how it takes advantage of the biological condition information to better identify cell types.
scDeepJointClust embeds pre-defined cell clustering results in a DNN model
One of the key features of scDeepJointClust is its utilization of a DNN structure to embed a gene-expression-based clustering outcome ( ), which is obtained using an existing method. Ensuring the high quality of this embedding is essential because the joint training with the biological condition information (
 ) will rely on this embedding. To test quality of the embedding, we trained scDeepJointClust’s DNN structure with only a gene-expression-based clustering outcome and evaluated if the training effectively incorporates the clustering outcome by separating the clusters. For this, we downloaded a scRNA-Seq data set of 16 291 immune cells from 48 tumor samples of melanoma patients treated with immune checkpoint therapy (pembrolizumab, anti-PD1) [40]. From the data, the original study identified 11 cell types, such as B, plasma, monocyte/macrophages and dendritic cells, using the k-means clustering algorithm and a manual review process based on a list of known marker genes [23]. We visualized the cell types on a t-SNE plot based on gene expression data (Figure 3A) to show that the cell types are not perfectly separated from each other by their gene expression, although a rough separation is still observed. However, when we embedded the clustering result using scDeepJointClust, the representation layer of scDeepJointClust further separates the clusters (Figure 3B). Further, we measured how the cell types are separated on the t-SNE plot based on gene expression data and based on the scDeepJointClust embedding using sample silhouette coefficient. Since sample silhouette coefficient quantifies how well data points are grouped based on the difference between the intra-cluster distances and the nearest-cluster distances [41], a higher coefficient value indicates a better separation performance of cell clusters. In that sense, scDeepJointClust embedding returns significantly higher coefficient values for all cell clusters (Figure 3C), demonstrating that it improves the separation for all clusters in the melanoma data.
Figure 3.
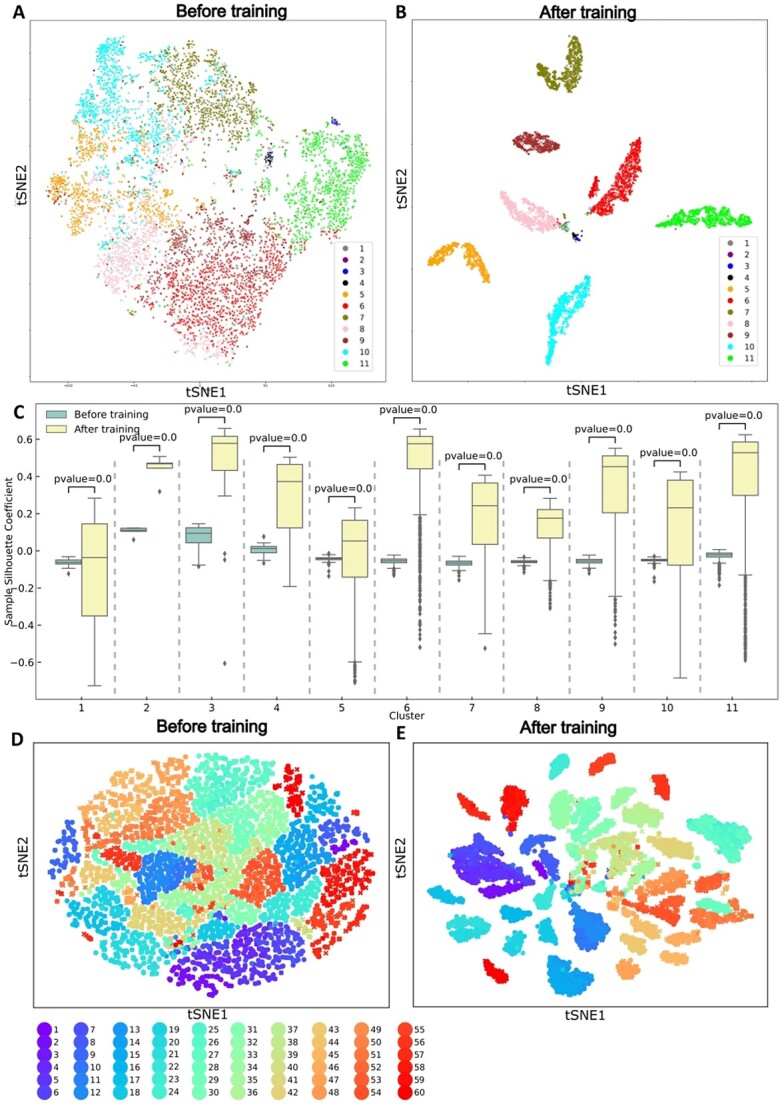
Evaluation of embedding performance. (A) t-SNE of the melanoma single-cell data using the gene expression profile. (B) t-SNE of the melanoma single-cell data after training on  in accordance with 11 input clustering result. (C) Sample Silhouette coefficient calculated in the t-SNE using the gene expression profile and scDeepJointClust embedding for each cell cluster of the melanoma data. P-value is estimated from Student’s t-test to compare the gene expression and the scDeepJointClust embedding. (D) t-SNE of the NSCLC single-cell data using the gene expression profile. (E) t-SNE of the NSCLC single-cell data after training on
  in accordance with 60 input clustering result.
To ensure the generalizability, we analyzed another scRNA-Seq data set of 361 929 cells from 35 early-stage NSCLC lesions [42]. By running a batch-aware EM-like clustering method on the data, Martin et al. derived 60 cell clusters, such as natural killer (NK), T, mononuclear phagocyte (MNP), plasmacytoid dendritic cell (pDC), B, plasma and MAST cells. The t-SNE visualization of the cells solely based on the original clustering outcome from the method demonstrates unclear separations among the cell types (Figure 3D). However, when we embedded the clustering result using scDeepJointClust via DNN, the scDeepJointClust representation layer better segregates the cell types (Figure 3E). This outperformance is again validated by the sample silhouette coefficient analysis in the NSCLC data (Supplementary Figure S2 available online at http://bib.oxfordjournals.org/). With the melanoma data and the NSCLC data using different clustering methods on the gene expression information, scDeepJointClust consistently improved separations of cell clusters when trained on scDeepJointClust’s DNN model even only using gene expression without biological condition information.
scDeepJointClust identifies cell clusters correlated with enhanced response to immunotherapy
To evaluate how scDeepJointClust refines the result of existing clustering method using both gene expression and the biological condition information, we analyzed the NSCLC tumor samples and patient-matched healthy (non-involved) lung samples (nLung) with a CITE-Seq data from two experimental conditions (tumor and nLung samples). CITE-Seq data consist of gene expression and antibody information where the antibodies represent cell epitopes that play important roles in identifying the true cell types. Thus, we measured the true-positive rate (TPR) and false-positive rate (FPR) by comparing cluster results with the cell cluster IDs that were based on the gene expression and antibody information. Since scDeepJointClust is designed to identify cell types that are enriched with a particular condition (tumor or nLung), we selected four cell subtypes that showed an enrichment to either tumor samples or nLung samples in the original paper and its replication data set [43, 44], which are NK, B, T, monocyte and macrophage (momac) cells. For targeted analysis, we focused on two patients with higher counts of the cells of interest out of seven patients in the data, namely, 695 and 703. For evaluation, we first clustered the cells based only on the scRNA-Seq data using existing clustering methods (Leiden, Louvain and Milo). After annotating the clusters into cell types based on the Human Primary Cell Atlas reference dataset [20], we assessed how well the identified NK, B and T cells match with those identified in the original publication that we deemed true. Then, we ran scDeepJointClust on the clustering results with the biological condition information (tumor versus nLung) and compared the results. scDeepJointClust improves 21 TPRs out of 24 in all the tested methods for all four cell types in both patients (Figure 4A and B, Supplementary Table S1 available online at http://bib.oxfordjournals.org/). Furthermore, scDeepJointClust also significantly reduces 23 FPRs out of 24 using all the tested methods across all cell types (Figure 4C and D, Supplementary Table S1 available online at http://bib.oxfordjournals.org/).
Figure 4.

Demonstration of scDeepJointClust in NSCLC data. TPR difference of scDeepJointClust versus existing methods (Leiden, Louvain and Milo) in identifying B, NK, T or momac cells in (A) patient 695 and (B) patient 706. Since the difference was calculated in reference to the performance of existing methods, positive values represent superiority of scDeepJointClust over existing methods. FPR difference of scDeepJointClust versus existing methods (Leiden, Louvain and Milo) in identifying B, NK, T, or momac cells in (C) patient 695 and (D) patient 706. Since the difference was calculated in reference to the performance of existing methods, negative values represent superiority of scDeepJointClust over existing methods. (E) Average TRP values between Milo and scDeepJointClust on 60 runs of 70% sampled B, NK, T and momac cells. P-values were estimated using one-tailed paired t-test. (F) Average FPR values between Milo and scDeepJointClust on 60 runs of 70% sampled B, NK, T and momac cells. P-values were estimated using a one-tailed paired t-test.
To further assess scDeepJointClust’s performance, especially in comparison to Milo, we selected two additional patients, 626 and 630, in whom sufficient numbers (60) of the same surface markers were assayed as patients 695 and 703. Then, we merged their single-cell data with those of the previous two patients and sub-sampled 70% of the merged data 60 times. Running scDeepJointClust and Milo on the sampled data sets, we found that scDeepJointClust significantly increases TPRs and decreases FPRs compared to Milo in three cell types except for momac cell types in TPR and B cell types in FPR (Figure 4E and F).
Given the uncertainty in choosing a gene-expression-based clustering algorithm, it is worth emphasizing that the improvement provided by scDeepJointClust remains substantial across all clustering algorithms tested. It is interesting to note that, when there is little gain in either TPR or FPR, scDeepJointClust substantially improves the result in the other criteria, refining the overall results of cell state identification. For example, although scDeepJointClust does not improve TPR of momac identification for patient 695 from any existing algorithms, scDeepJointClust makes drastic improvements from all the methods in terms of FPR. Similarly, for patient 695, while scDeepJointClust does not improve false positive rate of B, NK and T cell identification, it improves the true-positive rate of those cells.
CONCLUSIONS
Our novel method, scDeepJointClust—a DNN method with a novel joint optimization—enables us to incorporate not only gene expression but also biological conditions to improve cell-clustering results. scDeepJointClust incorporates results from the power of state-of-the-art gene-expression-based clustering methods as an input, incorporating their sophistication and accuracy. This ensures that scDeepJointClust stays at the cutting edge of performance by leveraging the advancements in gene-expression-based clustering techniques. scDeepJointClust significantly improved cell clustering results compared to existing methods in diverse scenarios and biological data of different diseases (melanoma and NSCLC). Also, by employing the DNN method to embed gene expression information, scDeepJointClust successfully improved the separations of cell clusters through its representation layer.
Our study also needs further investigation for a possible limitation. Since our approach capitalizes on enriched biological conditions to increase the accuracy of cell clustering, this approach may not be advantageous for the cell types that are not affected by biological conditions. However, since the primary focus of most human disease studies is to identify differentially abundant cell types between disease and normal conditions, we believe that scDeepJointClust effectively addresses this specific interest.
scDeepJointClust can be extended to incorporate other types of single-cell data or multi-omics single-cell data. First, while current scDeepJointClust incorporates scRNA-seq for cell clustering, scDeepJointClust can incorporate other types of single-cell data. For example, while single-cell assay for transposase-accessible chromatin with high-throughput sequencing (scATAC-Seq) data can be used to classify cell types based on the regulatory elements via open chromatin analysis of each cell type [45], scDeepJointClust can refine the cell clusters constructed from the scATAC-Seq data using the biological condition information. Second, scDeepJointClust can further improve cell clustering results by integrating multiple types of single-cell data. Recently, various omics layers have been measured from the same cells using several techniques such as Cellular Indexing of Transcriptomes and Epitopes by Sequencing (CITE-Seq), RNA expression and protein sequencing assay (REAP-seq), gDNA–mRNA sequencing (DR-seq) and single-cell methylome and transcriptome sequencing (scM&T-seq) [46–49]. Since the joint learning framework in scDeepJointClust is not limited to optimizing two loss functions, scDeepJointClust can be extended to jointly learn and integrate multiple types of data for clustering by extending to incorporate multiple loss functions.
In summary, we developed scDeepJointClust to identify cellular states that are differentially abundant between biological conditions. Identifying those cellular states is of utmost importance because it provides crucial insights into the functional and molecular diversity within a tissue or organism. scDeepJointClust tackles this problem by transforming it into a joint-learning problem and leveraging a DNN-based approach. This innovative methodology facilitates more accurate identification of cellular states, thus providing valuable insights into the underlying functional and molecular diversity associated with important pathobiology. By harnessing these advantages, the application of scDeepJointClust holds significant promise for advancing our understanding of cellular states and their implications in complex biological systems.
Key Points
It is important to identify cell subtypes that exhibit homogeneous gene expression patterns and are enriched in specific biological conditions.
Existing methods are limited in considering potential interactions between gene expression and biological condition information, controlling the weights between them and considering non-linear relationships in them.
To address the limitations and accurately identify such condition-specific cell subtypes, we develop scDeepJointClust, the first method that jointly trains both types of information via a deep neural network.
scDeepJointClust outperforms existing methods in terms of sensitivity and specificity.
scDeepJointClust exhibits significant promise in advancing our understanding of cellular states and their implications in complex biological systems.
Supplementary Material
ACKNOWLEDGEMENTS
This research was supported in part by the University of Pittsburgh Center for Research Computing, RRID:SCR_022735, through the resources provided. Specifically, this work used the HTC cluster, which is supported by NIH award number S10OD028483.
Author Biographies
Zhenjiang Fan is a PhD student in the Department of Computer Science at the University of Pittsburgh. He develops deep learning models to address complex biological questions.
Jie Sun is a PhD student in the Department of Human Genetics at the University of Pittsburgh. She develops machine learning models to help analyze single-cell transcriptomics data.
Henry Thorpe is a Master’s student in the Department of Biostatistics at the University of Pittsburgh. He works to develop pipelines of deep learning methods to solve biological questions.
Stephen Lee is an Assistant Professor in the Department of Computer Science at the University of Pittsburgh. He is developing techniques for emerging systems with an interest in human systems.
Soyeon Kim is a Research Assistant Professor in the Department of Pediatrics, University of Pittsburgh Medical Center and in Division of Pulmonary Medicine, Children’s Hospital of Pittsburgh of UPMC. She develops statistical methods to identify molecular interactions in various human diseases.
Hyun Jung Park is an Assistant Professor in the Department of Human Genetics, Graduate School of Public Health, University of Pittsburgh. He studies computational and statistical aspects of single-cell transcriptomics in cancer.
Contributor Information
Zhenjiang Fan, Department of Computer Science, University of Pittsburgh, Pittsburgh, Pennsylvania 15213, United States.
Jie Sun, Department of Human Genetics, University of Pittsburgh, Pittsburgh, Pennsylvania 15213, United States.
Henry Thorpe, Department of Biostatistics, University of Pittsburgh, Pittsburgh, Pennsylvania 15213, United States.
Stephen Lee, Department of Computer Science, University of Pittsburgh, Pittsburgh, Pennsylvania 15213, United States.
Soyeon Kim, Division of Pulmonary Medicine, Department of Pediatrics, UPMC Children’s Hospital of Pittsburgh, University of Pittsburgh, Pittsburgh, PA, USA; Department of Pediatrics, School of Medicine, University of Pittsburgh, Pittsburgh, PA, USA.
Hyun Jung Park, Department of Human Genetics, University of Pittsburgh, Pittsburgh, Pennsylvania 15213, United States.
AVAILABILITY OF SUPPORTING SOURCE CODE AND REQUIREMENTS
Project name: scDeepJointClust.
Project home page: https://github.com/ZhenjiangFan/scDeepJointClust
Operating system(s): Platform independent.
Programming language: Python, R.
FUNDING
H.J.P. was supported by the UPMC Hillman Cancer Center Biostatistics Shared Resource that is supported in part by award P30CA047904 and R01GM108618 at the NIH. H.J.P. is also supported by the Hillman Cancer Center Career Enhancement Program Award (P50 CA254865-01).
AUTHOR CONTRIBUTIONS
H.J.P. conceived the project, designed the experiments, and wrote the manuscript. S.K. interpreted results and wrote the manuscript. H.T. wrote the manuscript. Z.F. and J.S. implemented the method and interpreted the results. S.L. discussed and conceived the project.
References
- 1. Domínguez Conde C, Xu C, Jarvis LB, et al. Cross-tissue immune cell analysis reveals tissue-specific features in humans. Science 2022;376:eabl5197. [DOI] [PMC free article] [PubMed] [Google Scholar]
- 2. Fang Z, Weng C, Li H, et al. Single-cell heterogeneity analysis and CRISPR screen identify key β-cell-specific disease genes. Cell Rep 2019;26:3132–3144.e7. [DOI] [PMC free article] [PubMed] [Google Scholar]
- 3. Silvin A, Chapuis N, Dunsmore G, et al. Elevated calprotectin and abnormal myeloid cell subsets discriminate severe from mild COVID-19. Cell 2020;182:1401–1418.e18. [DOI] [PMC free article] [PubMed] [Google Scholar]
- 4. Abdelfattah N, Kumar P, Wang C, et al. Single-cell analysis of human glioma and immune cells identifies S100A4 as an immunotherapy target. Nat Commun 2022;13:767. [DOI] [PMC free article] [PubMed] [Google Scholar]
- 5. Goldfarbmuren KC, Jackson ND, Sajuthi SP, et al. Dissecting the cellular specificity of smoking effects and reconstructing lineages in the human airway epithelium. Nat Commun 2020;11:2485. [DOI] [PMC free article] [PubMed] [Google Scholar]
- 6. Baron M, Veres A, Wolock Samuel L, et al. A single-cell transcriptomic map of the human and mouse pancreas reveals inter- and intra-cell population structure. Cell Syst 2016;3:346–60. [DOI] [PMC free article] [PubMed] [Google Scholar]
- 7. Alberti-Servera L, von Muenchow L, Tsapogas P, et al. Single-cell RNA sequencing reveals developmental heterogeneity among early lymphoid progenitors. EMBO J 2017;36:3619–33. [DOI] [PMC free article] [PubMed] [Google Scholar]
- 8. Kreisel T, Frank MG, Licht T, et al. Dynamic microglial alterations underlie stress-induced depressive-like behavior and suppressed neurogenesis. Mol Psychiatry 2014;19:699–709. [DOI] [PubMed] [Google Scholar]
- 9. Mahata B, Zhang X, Kolodziejczyk AA, et al. Single-cell RNA sequencing reveals T helper cells synthesizing steroids de novo to contribute to immune homeostasis. Cell Rep 2014;7:1130–42. [DOI] [PMC free article] [PubMed] [Google Scholar]
- 10. Davidson S, Efremova M, Riedel A, et al. Single-cell RNA sequencing reveals a dynamic stromal niche that supports tumor growth. Cell Rep 2020;31:107628. [DOI] [PMC free article] [PubMed] [Google Scholar]
- 11. Blondel VD, Guillaume J-L, Lambiotte R, Lefebvre E. Fast unfolding of communities in large networks. J Stat Mech Theory Exp 2008;2008:P10008. [Google Scholar]
- 12. Traag VA, Waltman L, van Eck NJ. From Louvain to Leiden: Guaranteeing Well-connected Communities, 2019; arXiv:1810.08473. [DOI] [PMC free article] [PubMed]
- 13. Dann E, Henderson NC, Teichmann SA, et al. Differential abundance testing on single-cell data using k-nearest neighbor graphs. Nat Biotechnol 2022;40:245–253. 10.1038/s41587-021-01033-z. [DOI] [PMC free article] [PubMed] [Google Scholar]
- 14. Qian K, Fu S, Li H, Li WV. scINSIGHT for interpreting single-cell gene expression from biologically heterogeneous data. Genome Biol 2022;23:82. [DOI] [PMC free article] [PubMed] [Google Scholar]
- 15. Zhao K, So H-C, Lin Z. SR2: sparse representation learning for scalable single-cell RNA sequencing data analysis. 2023;9. 10.1101/2023.07.31.551228. [DOI] [Google Scholar]
- 16. Li L, Li Z, Liu Y, Hong Q. Deep joint learning for language recognition. Neural Netw 2021;141:72–86. [DOI] [PubMed] [Google Scholar]
- 17. Li Y, Tian X, Shen X et al. Classification and Representation Joint Learning via Deep Networks. In: Proceedings of the Twenty-Sixth International Joint Conference on Artificial Intelligence, {IJCAI-17}. 2017, 2215–21.
- 18. Gundogdu P, Loucera C, Alamo-Alvarez I, et al. Integrating pathway knowledge with deep neural networks to reduce the dimensionality in single-cell RNA-seq data. BioData Mining 2022;15:1. [DOI] [PMC free article] [PubMed] [Google Scholar]
- 19. Srinivasan S, Leshchyk A, Johnson NT, et al. A hybrid deep clustering approach for robust cell type profiling using single-cell RNA-seq data. RNA 2020;26:1303–19. [DOI] [PMC free article] [PubMed] [Google Scholar]
- 20. Mendenhall J, Meiler J. Improving quantitative structure-activity relationship models using artificial neural networks trained with dropout. J Comput Aided Mol Des 2016;30:177–89. [DOI] [PMC free article] [PubMed] [Google Scholar]
- 21. Wang S, Zhou T, Bilmes J. Jumpout: improved dropout for deep neural networks with ReLUs. In: Kamalika C., Ruslan S. eds). Proceedings of the 36th International Conference on Machine Learning. Proceedings of Machine Learning Research: PMLR, 2019, 6668–76.
- 22. Lloyd S. Least squares quantization in PCM. IEEE Trans Inf Theory 1982;28:129–37. [Google Scholar]
- 23. Gong W, Wee J, Wu MC et al. Persistent spectral simplicial complex-based machine learning for chromosomal structural analysis in cellular differentiation. LID—bbac168 [pii] LID. Brief Bioinform 2022;23(4):bbac168. 10.1093/bib/bbac168. [DOI] [PubMed] [Google Scholar]
- 24. Pedregosa F, Varoquaux G, Gramfort A, et al. Scikit-learn: machine learning in python. J Mach Learn Res 2011;2825–30. [Google Scholar]
- 25. Cannoodt R, Saelens W, Deconinck L, Saeys Y. Spearheading future omics analyses using dyngen, a multi-modal simulator of single cells. Nat Commun 2021;12:3942. [DOI] [PMC free article] [PubMed] [Google Scholar]
- 26. Hao Y, Hao S, Andersen-Nissen E, et al. Integrated analysis of multimodal single-cell data. Cell 2021;184:3573–3587.e29. [DOI] [PMC free article] [PubMed] [Google Scholar]
- 27. Wolf FA, Angerer P, Theis FJ. SCANPY: large-scale single-cell gene expression data analysis. Genome Biol 2018;19(1):15. [DOI] [PMC free article] [PubMed] [Google Scholar]
- 28. Dann E, Henderson NC, Teichmann SA, et al. Differential abundance testing on single-cell data using k-nearest neighbor graphs. Nat Biotechnol 2022;40:245–53. [DOI] [PMC free article] [PubMed] [Google Scholar]
- 29. Aran D, Looney AP, Liu L, et al. Reference-based analysis of lung single-cell sequencing reveals a transitional profibrotic macrophage. Nat Immunol 2019;20:163–72. [DOI] [PMC free article] [PubMed] [Google Scholar]
- 30. Martens JHA, Stunnenberg HG. BLUEPRINT: mapping human blood cell epigenomes. Haematologica 2013;98:1487–9. [DOI] [PMC free article] [PubMed] [Google Scholar]
- 31. Hattori Y. The behavior and functions of embryonic microglia. Anat Sci Int 2022;97:1–14. [DOI] [PMC free article] [PubMed] [Google Scholar]
- 32. Tirosh I, Venteicher AS, Hebert C, et al. Single-cell RNA-seq supports a developmental hierarchy in human oligodendroglioma. Nature 2016;539:309–13. [DOI] [PMC free article] [PubMed] [Google Scholar]
- 33. Brennecke P, Anders S, Kim JK, et al. Accounting for technical noise in single-cell RNA-seq experiments. Nat Methods 2013;10:1093–5. [DOI] [PubMed] [Google Scholar]
- 34. Stuart T, Butler A, Hoffman P, et al. Comprehensive integration of single-cell data. Cell 2019;177:1888–1902.e21. [DOI] [PMC free article] [PubMed] [Google Scholar]
- 35. Kiselev VY, Kirschner K, Schaub MT, et al. SC3: consensus clustering of single-cell RNA-seq data. Nat Methods 2017;14:483–6. [DOI] [PMC free article] [PubMed] [Google Scholar]
- 36. Tibshirani R, Hastie T, Friedman JH. The Elements of Statistical Learning: Data Mining, Inference, and Prediction. 2nd Edn. (Springer Science & Business Media; 2009). [Google Scholar]
- 37. Gelman A, Loken E. The statistical crisis in science. Am Sci 2014;102:460. [Google Scholar]
- 38. Ioannidis JPA. Correction: Why Most Published Research Findings Are False, Vol. 19. PLOS Medicine. Public Library of Science, 2022;1:"e1004085. 10.1371/journal.pmed.1004085. [DOI] [PMC free article] [PubMed] [Google Scholar]
- 39. Vapnik VN. Statistical Learning Theory. Wiley-Interscience, 1998; pp. 768, John Wiley, NY. [Google Scholar]
- 40. Sade-Feldman M, Yizhak K, Bjorgaard SL, et al. Defining T cell states associated with response to checkpoint immunotherapy in melanoma. Cell Elsevier 2018;175:998–1013.e20. [DOI] [PMC free article] [PubMed] [Google Scholar]
- 41. Rousseeuw PJ. Silhouettes: a graphical aid to the interpretation and validation of cluster analysis. J Comput Appl Math 1987;20:53–65. [Google Scholar]
- 42. Martin JC, Chang C, Boschetti G, et al. Single-cell analysis of Crohn's disease lesions identifies a pathogenic cellular module associated with resistance to anti-TNF therapy. Cell 2019;178:1493–1508.e20. [DOI] [PMC free article] [PubMed] [Google Scholar]
- 43. Lambrechts D, Wauters E, Boeckx B, et al. Phenotype molding of stromal cells in the lung tumor microenvironment. Nat Med United States 2018;24:1277–89. [DOI] [PubMed] [Google Scholar]
- 44. Zilionis R, Engblom C, Pfirschke C, et al. Single-cell transcriptomics of human and mouse lung cancers reveals conserved myeloid populations across individuals and species. Immunity 2019;50:1317–1334.e10. [DOI] [PMC free article] [PubMed] [Google Scholar]
- 45. Fang R, Preissl S, Li Y, et al. Comprehensive analysis of single cell ATAC-seq data with SnapATAC. Nat Commun 2021;12:1337. [DOI] [PMC free article] [PubMed] [Google Scholar]
- 46. Dey SS, Kester L, Spanjaard B, et al. Integrated genome and transcriptome sequencing of the same cell. Nat Biotechnol 2015;33:285–9. [DOI] [PMC free article] [PubMed] [Google Scholar]
- 47. Angermueller C, Clark SJ, Lee HJ, et al. Parallel single-cell sequencing links transcriptional and epigenetic heterogeneity. Nat Methods 2016;13:229–32. [DOI] [PMC free article] [PubMed] [Google Scholar]
- 48. Peterson VM, Zhang KX, Kumar N, et al. Multiplexed quantification of proteins and transcripts in single cells. Nat Biotechnol 2017;35:936–9. [DOI] [PubMed] [Google Scholar]
- 49. Stoeckius M, Hafemeister C, Stephenson W, et al. Simultaneous epitope and transcriptome measurement in single cells. Nat Methods 2017;14:865–8. [DOI] [PMC free article] [PubMed] [Google Scholar]
Associated Data
This section collects any data citations, data availability statements, or supplementary materials included in this article.