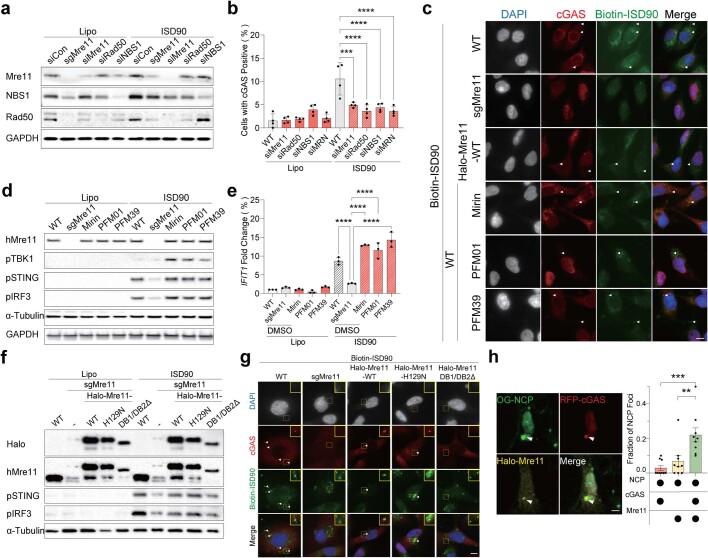
Extended Data Fig. 6. The DNA binding domain, but not the nuclease activity, of Mre11 is required to facilitate cGAS-dsDNA interaction.
a, b, MDA-MB-231 cells were transfected with the indicated siRNA and incubated for 48 h. Subsequently, cells were harvested 6 h (a) or 1 h (b) after transfection with 4 μg/mL ISD90. a, Western blot analysis of each cell line with the indicated antibodies. Mre11, Nbs1, Rad50 and GAPDH (a loading control). b, Quantification of cells positive for cGAS foci. (a) and (b) were double-checked using a blinded experiment. n = 2 independent biological experiments; 400 cells for each cell lines. WT + ISD90 vssiMRE11 + ISD90; p < 0.0001, siRad50, siNBS1 and siMRN; p = 0.0002. c, d, e, MDA-MB-231 cells were transfected with dsDNA, following treatment with indicated nuclease inhibitors (Mirin, PFM01 and PFM39) for 30 min. c, Representative images showing the localization of cGAS and Biotin-ISD90 were obtained 2 h after transfection with Biotin-ISD90. Scale bar, 10 μm. Image quantification is shown in Fig. 3f. d, Western blot analysis for cGAS-STING pathways. Cells were obtained 3 h after transfection of ISD90. e, Cells were obtained 6 h after transfection of ISD90. qRT-PCR normalized gene expression for human interferon-stimulated genes IFIT1. mRNA levels were normalized to human β-actin RNA levels. n = 3 independent biological experiments; 3 samples for each cell lines. p < 0.0001. f, g, sgMRE11 MDA-MB-231 stable cell lines were generated via retroviral infection, with each line expressing human Mre11 WT, H129N (nuclease dead mutant), and DB1/DB2 deletion (DNA binding mutant) in sgMRE11 MDA-MB-231 cells. These cell lines were then transfected with dsDNA. f, Western blot analysis of Halo, human Mre11, pSTING, pIRF3 and α-tubulin in each MDA-MB-231 cell lines, demonstrating consistent findings across three independent replicates. g, Representative images showing the localization of cGAS and Biotin-ISD90 were obtained 2 h after transfection with Biotin-ISD90. Scale bar, 10 μm. Image quantification is shown in Fig. 3g. h, ICC 30 min after transfection with Oregon Green (OG)-NCP in MDA-MB-231 cells expressing RFP-cGAS and HaloTag-Mre11. Right panel, quantification of Mre11 and cGAS colocalization at cytoplasmic NCP foci. Scale bar, 10 μm. n = 3 independent biological experiments; 474 cells were analyzed for Fraction of NCP foci. NCP+cGAS vs NCP + cGAS+Mre11; p = 0.0006, NCP+Mre11 vs NCP+cGAS+Mre11; p = 0.0055. Data are mean ± SEM. Unless otherwise specified, statistical analyses were determined by one-way ANOVA followed by Sidak’s multiple comparison post-test using a two-tailed test: *, p < 0.05; **, p < 0.01; ***, p < 0.001; ****, p < 0.0001.

