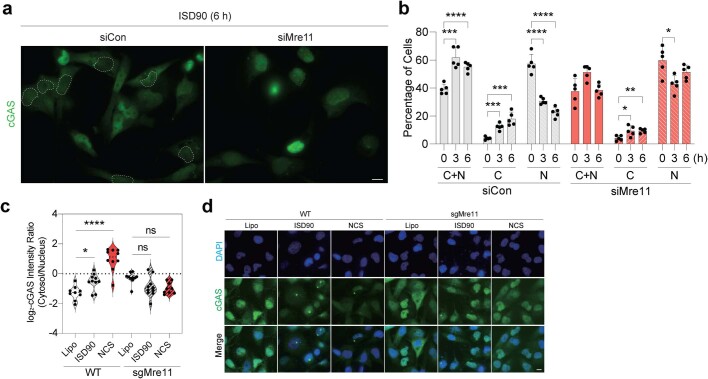
Extended Data Fig. 8. Mre11 facilitates cGAS cytoplasmic translocation in response to cytosolic DNA and DNA damage induction.
a, b, ICC of cGAS re-localization to cytoplasmic ISD90 in a subset of cells, a, 6 h after transfection in siControl versus siMRE11 BJ-5ta cells (72 h after siRNA transfection). b, Percentage of cells with cGAS localization in both cytosol and nucleus (C + N; Cytosol + Nucleus [0.4 </= C/N ratio </= 1.25]), predominantly cytosolic (C:cytosol [C/N ratio > 1.25]), and predominantly nuclear (N: Nucleus [C/N ratio <0.4]) 0, 3, and 6 h after 4 µg/mL ISD90 transfection in a series of images containing at least 10 evaluable cells each. n = 2 independent experiments; n = 500 cells for each cell condition. siControl (C + N) 0 h vs 3 h: p = 0.0002, 0 h vs 6 h: p < 0.0001; (C) 0 h vs 3 h: p = 0.0001, 0 h vs 6 h: p = 0.0002; (N) 0 h vs 3 h: p < 0.0001, 0 h vs 6 h: p < 0.0001. siMRE11 (C) 0 h vs 3 h: p = 0.0234, 0 h vs 6 h: p = 0.0012; (N) 0 h vs 3 h: p = 0.0116. c, d, Indicated MDA-MB-231 cells were either transfected with dsDNA or treated with NCS for 6 h. c, The Log2-transformed cGAS localization ratio (Cytosol/Nucleus). N = 2 independent experiments; 10 (WT and sgMRE11) cells. WT + Lipo vs WT + ISD90; p = 0.034, WT + Lipo vs WT + NCS; p < 0.0001. d, Representative images of cGAS staining, demonstrating consistent findings across three independent replicates. Scale bar, 10μm. Data are mean ± SEM. Unless otherwise specified, statistical analyses were determined by one-way ANOVA followed by Sidak’s multiple comparison post-test using a two-tailed test: *, p < 0.05; **, p < 0.01; ***, p < 0.001; ****, p < 0.0001.

