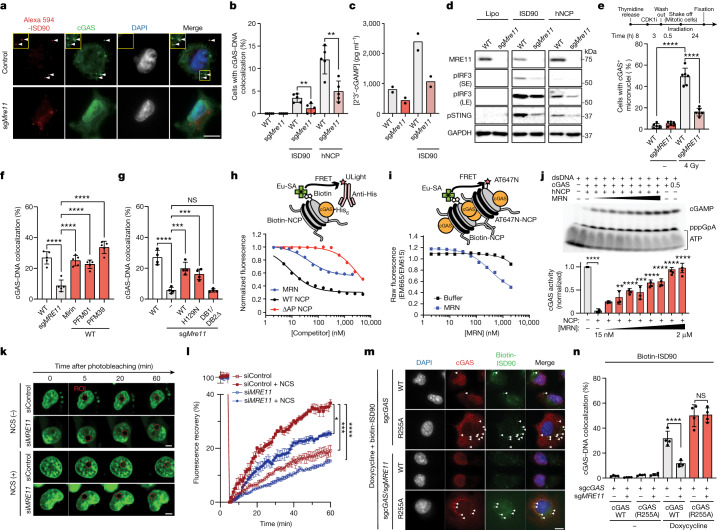
Fig. 3. MRN stimulates cGAS activation by antagonizing nucleosome sequestration.
a,b, Images (a) and quantification (b) of cGAS and ISD90, or cGAS and human nucleosomal core particles (hNCP) colocalization in control cells and sgMRE11 MDA-MB-231 cells. Left to right, n = 344, 312, 491, 405, 366 and 243 independent cells. White arrowheads indicate colocalization of cGAS and ISD90 foci. WT versus sgMRE11, ISD90, P = 0.007; hNCP, P = 0.0038. c, 2′3′-cGAMP ELISA after ISD90 transfection in sgControl versus sgMRE11 cells. Two independent biological replicates for WT, sgMRE11, WT + ISD90 and sgMRE11 + ISD90. CDK1i refers to the CDK1 inhibitor (Ro-3306). Representative of two independent biological experiments. d, Top, schematic of the experiment. Bottom, western blot for the STING pathway in WT versus sgMRE11 cells after Lipofectamine (Lipo) only, ISD90 or hNCP transfection. e, cGAS+ micronuclei after 24 h of irradiation in WT or sgMRE11 mitotic cells. n = 404 (WT), 441 (sgMRE11), 419 (WT + 4 Gy) and 438 (sgMRE11 + 4 Gy) independent cells. Representative of two independent biological experiments. f,g, cGAS–ISD90 colocalization. f, In the presence of MRE11 nuclease inhibitors, n = 500 independent cells per cell line per condition, ****P < 0.0001, representative of two independent biological experiments. g, sgMRE11 cells expressing different MRE11 constructs. n = 1,200 independent cells per cell line; WT versus sgMRE11, P = 0.0001; sgMRE11 versus sgMRE11 + WT, P = 0.0002; sgMRE11 versus sgMRE11 + H129N, P = 0.0004; sgMRE11 versus sgMRE11 + DB1/DB2Δ, P = NS. Representative of two independent biological experiments. h,i, Schematic (top) and quantification (bottom) of TR-FRET fluorescence assays using europium–streptavidin (Eu–SA)-labelled hNCP and an anti-His antibody conjugated to the FRET acceptor ULight to measure cGAS–NCP interaction (h) and FRET acceptor AT647N conjugated hNCP to measure nucleosome stacking (i). Results representative of three independent experiments. j, Top, cGAMP accumulation in the presence of 1 µM cGAS, 5 µM dsDNA, 0.5 µM NCP and a 2-fold gradient of MRN concentrations (0.0156–2 µM). Bottom, quantified cGAS activity from triplicate experiments. Left to right, including comparisons to +NCP/–MRN: P < 0.0001, P = 0.0693 (NS), P = 0.0042, P < 0.0001, P = 0.0002, P < 0.0001, P < 0.0001, P < 0.0001 and P < 0.0001, by two-tailed one-way ANOVA. Representative of three independent experiments. k,l, Images (k) and quantification (l) FRAP assays in sgControl versus siMRE11 cells stably expressing GFP–cGAS. Images taken at 1-min intervals before and after photobleaching an arbitrary nuclear region of interest (ROI) for 60 min. Neocarzinostatin (NCS; 0.1 mg ml–1) was added immediately after photobleaching as indicated. n = 3 independent cells for each condition. Two-tailed two-way ANOVA: siControl + NCS versus siMRE11 + NCS, P = 0.041; siControl versus siControl + NCS, P = 0.0003; siControl + NCS versus siMRE11, P < 0.0001. m,n, Images (m) and quantification (n) of colocalization of cGAS-ISD90 in cGAS-deficient control or sgMRE11 cells reconstituted with cGAS WT or cGAS(R255A). White arrowheads indicate colocalization of cGAS and ISD90 foci. Data are mean ± s.e.m., n = 1,200 independent cells per condition. sgcGAS + cGAS WT + doxycycline versus sgcGAS/sgMRE11 + cGAS WT + doxycycline, P < 0.0001; sgcGAS + cGAS(R255A) + doxycycline versus sgcGAS/sgMRE11 + cGAS(R255A) + doxycycline, P > 0.99 (NS). Unless otherwise specified, grouped analyses performed with a two-tailed t-test. Scale bars, 10 µm (k,m), 20 µm (a).

