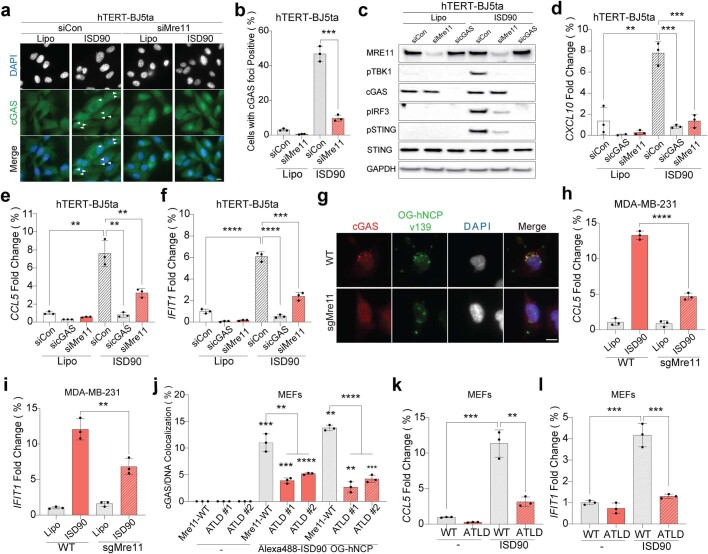
Extended Data Fig. 3. Mre11 is essential for activation of the cGAS-STING pathway by cytosolic DNA or nucleosomal core particles (NCPs).
a, b, ICC of cGAS localization to cytoplasmic interferon stimulating dsDNA 90 bp (ISD90) a, 1 h after transfection in siControl vs siMRE11 BJ-5ta cells (72 h after siRNA transfection). b, Percentage of cells with cGAS foci. Scale bar, 10 µm. n = 900 cells for each cell lines. siControl+ISD90 vs siMRE11+ ISD90; p = 0.0001. n = 3 independent biological experiments; c, Western blot was performed on innate immune signaling pathways in siControl, siMRE11, and sicGAS BJ-5ta cells, 3 h post transfection with 4 μg/mL dsDNA 90 bp (ISD90), demonstrating consistent findings across three independent replicates. d, e, and f, Quantitative RT-PCR was used to analyze normalized gene expression for human interferon-stimulated genes (ISGs), namely CXCL10, CCL5, and IFIT1 in BJ-5ta cells. n = 2 independent biological experiments; 3 samples for each cell lines. (d) siControl (Lipo vs ISD90); p = 0.0027. siControl+ISD90 vs sicGAS+ISD90; p = 0.0004 and siMre11 + ISD90; p = 0.0009. (e)siControl (Lipo vs ISD90); p = 0.0014. siControl+ISD90 vs sicGAS+ISD90; p = 0.0013 and siMRE11 + ISD90; p = 0.0076. (f) siControl (Lipo vs ISD90); p < 0.0001. siControl+ISD90 vs sicGAS+ISD90; p < 0.0001 andsiMRE11 + ISD90; p = 0.0003. g, Representative immunocytochemistry analysis of cGAS (Red) localization to cytoplasmic Oregon Green conjugated human NCP (OG-hNCP) (Green), 60 min after transfection with 72 nM OG-hNCP in siControl or siMRE11 human MDA-MB-231 cells. Cell nuclei stained by 4′,6-diamidino-2-phenylindole (DAPI; Blue). Scale bar, 10 µm. Image quantification is shown in Fig. 3b, right panel. h, i, qRT-PCR normalized gene expression for human interferon-stimulated genes (ISG) IFIT1 and CCL5. Cells were transfected with Lipo only or 4 μg/mL ISD90 for 6 h. mRNA levels were normalized to β-actin mRNA levels. n = 3 independent biological experiments; 3 samples for each cell lines. (h) ISD90 (WT vs sgMRE11); p < 0.0001. (i) p = 0.0008. j, WT or two different Mre11ATLD/ATLD MEF cell lines were transfected with 4 μg/mL Alexa488-ISD90 or 72 nM OG-hNCP for 60 min. Quantification of cells with colocalization for cGAS foci and cytosol DNA (ISD90 or OG-hNCP) is shown. Alexa488-ISD90 (WT vs ATLD #1; p = 0.0021, ATLD#2; p = 0.004). OG-hNCP (WT vs ATLD #1; p < 0.0001, ATLD#2; p < 0.0001). n = 3 independent biological experiments; 900 cells for each cell lines. k, l, qRT-PCR normalized gene expression for mouse ISG IFIT1 and CCL5. (k) WT vs WT + ISD90; p = 0.0007, WT + ISD90 vs ATLD + ISD90; p = 0.0022. (l) WT vs WT + ISD90; p = 0. 0006, WT + ISD90 vs ATLD + ISD90; p = 0.0009. n = 3 independent biological experiments; 3 samples for each cell lines. Data are mean ± SEM. Unless otherwise specified, P values estimated using a two-tailed t-test. *, p < 0.05; **, p < 0.01; ***, p < 0.001; ****, p < 0.0001.

