
Fig. 1. Structure of the PfRCR complex.
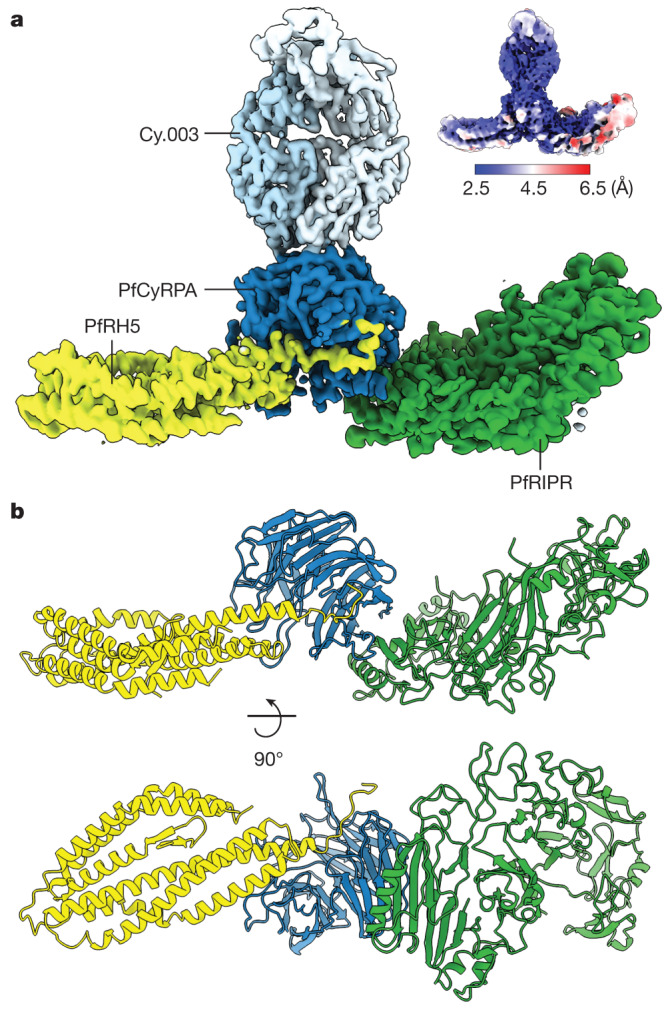
a, Composite map of the PfRCR–Cy.003 complex, following local refinement of the consensus map and postprocessing with DeepEMhancer. Densities corresponding to PfRH5 (yellow), PfCyRPA (dark blue), PfRIPR (green) and Cy.003 (light blue) are highlighted. Inset at top right is the unsharpened consensus map before local refinement, coloured by local resolution. b, Structure of the PfRCR complex in cartoon representation, coloured as in a. Cy.003 is omitted for clarity.