

Summary
Epigenetics underpins the regulation of genes known to play a key role in the adaptive and innate immune system (AIIS). We developed a method, EpiNN, that leverages epigenetic data to detect AIIS-relevant genomic regions and used it to detect 2,765 putative AIIS loci. Experimental validation of one of these loci, DNMT1, provided evidence for a novel AIIS-specific transcription start site. We built a genome-wide AIIS annotation and used linkage disequilibrium (LD) score regression to test whether it predicts regional heritability using association statistics for 176 traits. We detected significant heritability effects (average ) for 20 out of 26 immune-relevant traits. In a meta-analysis, immune-relevant traits and diseases were 4.45× more enriched for heritability than other traits. The EpiNN annotation was also depleted of trans-ancestry genetic correlation, indicating ancestry-specific effects. These results underscore the effectiveness of leveraging supervised learning algorithms and epigenetic data to detect loci implicated in specific classes of traits and diseases.
Keywords: heritability, immune system, machine learning, epigenetics
Graphical abstract
Highlights
-
•
EpiNN detects immune-system-relevant genomic regions using epigenetic activity data
-
•
Detected regions include an immune-specific transcription start site in DNMT1
-
•
Regions of high EpiNN signal are enriched for heritability in immune-related traits
-
•
Reduced genetic correlation in these regions suggests population-specific effects
EpiNN is a method that uses epigenetic data to detect genomic regions that are relevant for immune-system function. Regions detected using EpiNN have a high concentration of variants associated with immune-related heritable traits, such as autoimmune diseases. The effects of the associations in these regions tend to vary across populations.
Introduction
Adaptive- and innate-immune-system-relevant genes (AIIS-relevant genes) are at the core of the human immune system and dictate the course and therapeutic opportunities of many traits and diseases such as rheumatoid arthritis,1,2 Crohn’s disease,3 and cancer.4 The availability of increasingly large genomic datasets has enabled association analyses of complex autoimmune traits (e.g., Okada et al.,1 Momozawa et al.,5 and Jostins et al.1,5,6), shedding light on their genetic architecture. But despite this progress, currently known common susceptibility loci, including the human leukocyte antigen (HLA) region,7 explain only between 15%6,8 and 36%9 of the observed phenotypic variance in autoimmune traits. Although these efforts have in some cases led to the fine-mapping of underlying causal variation,10 the genetic mechanisms that trigger autoimmunity remain largely unknown.11 Notably, of the detected candidate causal variants for autoimmune diseases, % are estimated to be non-protein coding10 Furthermore, only a fraction of these alter recognizable transcription factor sequence motifs,10 highlighting the likely importance of regulatory variation in the genetic architecture of immune-related traits.
Current methods for gene classification are predominantly based on messenger RNA (mRNA) data. Abbas et al.12 identified immune-system-relevant genes based on expression data, resulting in a list of 2,272 genes, which we refer to as “IRIS.” Giallourakis et al.13 used expressed sequence tag profiling based on transcriptional data, resulting in a second list of 2,232 potential immune-system-relevant genes, hereafter called “ImmunoGenes.” While expression data are cost effective, they may be affected by temporal changes during the cell cycle or due to environmental stimuli.14 It is also not uncommon for mRNA levels to differ significantly from the actual protein levels, with mRNA not always being translated or mRNA no longer being present for long-lasting proteins.15 Moreover, proteins that are highly impactful but numerically few per cell, such as many transcription factors, have very few mRNA transcripts, which often fall below detection threshold.16 Proteome analysis overcomes some of these limitations but is more expensive and reliant on antibody binding, which is not always sufficiently specific or effective.17
Epigenetic data also provide cell-type-specific information and are additionally informative about the regulation of genes involved in several biological mechanisms. Epigenetic signal has been used to narrow down and validate genetic targets derived from expression data (e.g., Finucane et al.18) and has proven to reflect cell identity better than expression data.19 Specifically, the study of epigenetic mechanisms has shed light on the regulation of genes important for the human immune system,20 has been linked to susceptibility for autoimmune diseases,21 and has provided insights into macrophage diversity and plasticity.20 Thus, epigenetic data may be used to complement transcription-based data in several analyses involving cell-type-specific processes and are likely to provide an alternative route for the identification of AIIS-relevant genes.
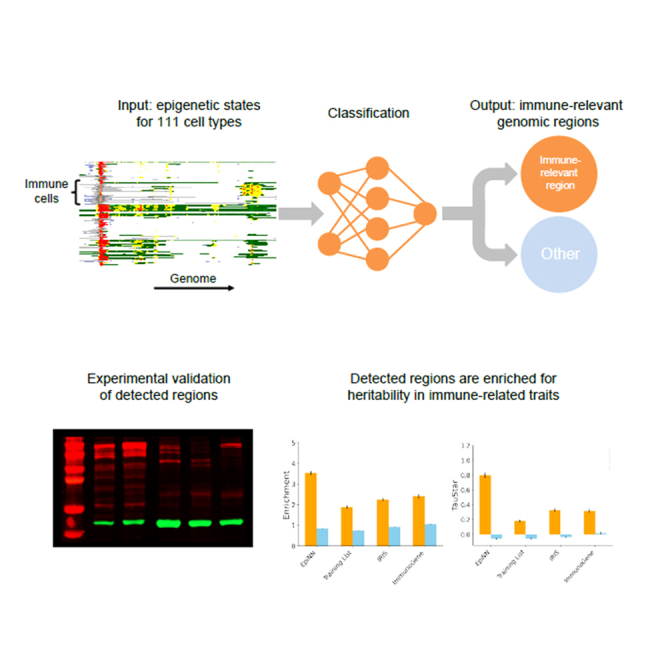
We developed an approach, called EpiNN, that leverages epigenetic data to detect novel AIIS-relevant genomic regions. EpiNN uses a neural network that takes in input an encoding of publicly available epigenetic data22 and is trained to recognize genomic regions that are likely to have AIIS-relevant functionality (see Figure 1). Applied to a genomic region, a trained EpiNN model outputs a score representing the estimated likelihood of the region being AIIS relevant. We used EpiNN to identify novel AIIS-relevant regions along the genome, detecting regions that are highly enriched for Gene Ontology terms23 with immune system function. We performed experimental validation for a newly discovered AIIS region, confirming its AIIS relevance as a putative novel immune-system-specific transcription start site in the DNMT1 gene. We evaluated EpiNN’s efficacy in detecting genomic regions enriched for heritability in immune-relevant traits using stratified linkage disequilibrium (LD) score regression (S-LDSC)24,25,26 applied to association summary statistics for 176 traits (average n = 262,000). In these analyses, a genome-wide EpiNN annotation resulted in heritability enrichments that were specific to immune-relevant traits and remained significant after conditioning on 97 other functional and evolutionary annotations. Finally, we used S-LDXR27 to test whether heritability enrichments detected using EpiNN are shared across ancestries. EpiNN-detected regions were significantly depleted for squared trans-ancestry genetic correlation in European and East Asian association summary statistics, indicating ancestry-specific effects that may be driven by gene-environment interactions at immune-relevant loci impacted by recent adaptation.
Figure 1.

Overview of the EpiNN algorithm
EpiNN takes in input epigenetic data from the Roadmap dataset22 encoded as a human-readable RGB image where colors encode 15 epigenetic states output by ChromHMM,28 rows represent 111 different cell and tissue types, and columns represent base pair positions along the genome. A set of known AIIS-relevant regions are used to train a CNN, which outputs a score reflecting the likelihood of a region being AIIS relevant. This score is used to perform binary classification of a gene/region or to build genome-wide annotations of AIIS-relevance.
Design
The EpiNN model uses a convolutional neural network (CNN) that is trained on epigenetic data to identify genomic regions that belong to a specific class, such as AIIS genes. The model takes in input of ChromHMM data28 from the Epigenome Roadmap project,22 which combines 5 chromatin markers (H3K4me3, H3K4me1, H3K36me3, H3K27me3, and H3K9me3) into 15 epigenetic states (see Table S1) for 111 different cell and tissue types. To facilitate human readability during the selection of training examples and in following analyses, epigenetic data are represented using an image-like format, which is provided in input to the CNN. Each image contains 111 rows representing 111 different cell and tissue types22; rows encode ChromHMM data28 from the Epigenome Roadmap, while columns represent the epigenetic state of 200 base pairs (bp). The CNN comprises 3 stacked modules of a convolutional layer, rectified linear unit (ReLU) activation, and a max pooling layer. We trained the model using a handcrafted list of 888 AIIS genes, which were selected for their relevance to immune cell identity (e.g., leukocyte signature matrix29 or cancer immunity cycle genes30) and exhibited a distinctive pattern in the Epigenome Roadmap 15 state model visualization. Additional details on data processing and the EpiNN model are provided in the STAR Methods.
Results
EpiNN optimization and genome-wide prediction
We used cross-validation to tune EpiNN’s hyperparameters and to select the model architecture that performed best in the prediction of held-out AIIS-relevant loci (see Star Methods). For further validation and as a sanity check in a simpler classification setting, we also repeated this procedure using a set of labeled housekeeping genes. The hyperparameters of the optimized models are detailed in Table S3. Our main EpiNN model achieved higher validation area under the precision-recall curve (AUPRC) compared to model variations, which included EpiNN-1D, EpiNN-binary, and EpiNN-logistic (see Star Methods). We applied the optimized EpiNN models to held-out testing sets, obtaining AUPRCs of 0.951 for AIIS-relevant genes and of 0.962 for housekeeping genes. We further measured several accuracy metrics extracted from the confusion matrix obtained for EpiNN predictions, corresponding to several cutoff thresholds (see Table S6). We did not observe changes in threshold values to strongly affect these metrics, as EpiNN annotation values were concentrated around 0 and 1 (see Figure S2). We next performed analyses to gain insights into which features among transcription start sites, enhancers, or transcription states contributed the most to the predictions output by the EpiNN model (see Star Methods; results shown in Table S7). In these analyses, we found that omitting information on transcription states when training the model had the strongest effect on prediction performance, followed by enhancer and transcription start site states. Note that these observations may also reflect the relative proportion of training data that each of these categories represents. We finally applied the trained EpiNN model to perform a genome-wide scan for novel AIIS-relevant genomic regions using a sliding window approach and processed the output to create a genome-wide annotation predicting potentially AIIS-relevant regions (see Star Methods). We refer to the resulting genome-wide scores of predicted AIIS relevance as the EpiNN annotation.
GO term analysis of identified AIIS regions
We used the EpiNN annotation to identify putatively novel AIIS genes, focusing on genes for which a HUGO gene name31 is available (∼33,000 in total; see Star Methods). We identified 2,765 candidate AIIS-relevant genes with EpiNN score greater than 0.5 (see Table S8 for a full list), which we used to perform a Gene Ontology (GO) term analysis23 (see Star Methods). Of the 2,765 detected genes, 1,413 could not be mapped, and 158 did not have a GO term, leaving 1,194 genes. The GO terms with the highest fold enrichment or p value are shown in Table S9. All GO terms were linked to immune system function, including, e.g., defense response (GO: 0006952) with a 2.04× enrichment (Bonferroni-corrected p ) and immune response (GO: 0006955) with a 2× enrichment (p = ). Noticeably, most of the unmapped genes were either LOC (uncharacterized genes, 860 of ), MIR (mircoRNA, 158 of ), or long intergenic non-protein coding (LINC) genes (120 of ). LINC genes have been found to play a role in autoimmune diseases32; Linc00402, for instance, was recently validated to have an immune function33 and was independently implicated by EpiNN.
DNMT1 contains a novel immune-cell-specific transcription start site
To gain additional insights into EpiNN’s predictions, we inspected the set of putative AIIS-relevant genes and noticed the presence of a novel transcription start site (TSS) in the DNMT1 (human DNA methyltransferase 1) gene. The high immune relevance predicted by EpiNN for DNMT1 is unexpected, as this gene encodes a constitutively expressed epigenetic agent that transfers methyl groups to cytosine nucleotides of genomic DNA.34 This region exhibits a distinct pattern of epigenetic regulation, specific to immune cells. Epigenome Roadmap data show homogeneous epigenetic states across the gene body of DNMT1 in other cell types, as well as a previously unreported immune-cell-specific, promoter-like signature in intron 28 (see Figure 2). Assuming the locus in intron 28 would lead to alternative transcription start, the resulting DNMT1 isoform could lose its autoinhibitory functions since the isoform would lack the RFTS, CXXC, and BAH1,2 domains. Such a shorter isoform of DNMT1 could perform unchecked methylation, with ramifications for the negative epigenetic regulation of methylated promoters in immune cells (see Figure 2E).
Figure 2.

Evidence of AIIS relevance for the DNMT1 gene
(A) Epigenetic signal of alternative transcription start site predicted by EpiNN.
(B) Sequence analysis and schematic diagram of the observed CAGE tags in immune cells (raw data in Table S10). The DNMT1 intron shows a peak of CAGE tags in immune cells, as well as three incomplete but telltale promoter sequence motifs: initiator, downstream promoter element (DPE), and TATA box.35
(C) Western blot from primary human CD8+ cells shows both the full-length 190 kDa DNMT1 protein, as well as a truncated 60 kDa protein, with size matching that of the predicted new isoform. We show one out of the 2 performed technical repeats from one out of the 3 donors tested; the band was visible in all donors and technical repeats.
(D) PCR of CD8+ and CD8+-depleted PBMCs show bands of expected sizes for truncated DNMT1 transcript. We show one out of the 2 performed technical repeats from one out of the 3 donors tested; the band was visible in all donors and technical repeats.
(E) Proposed mechanism: removal of both autoinhibitory domains (RFTS and CXXC) may lead to unchecked DNA methylation by the truncated protein isoform.
We performed further analyses to assess the immune-related role of DNMT1. Using FANTOM5 cap analysis of gene expression sequencing (CAGE-seq) data,36,37 we observed a moderate signal at the new TSS in CD8+ T cells, CD4+/CD25−/CD45RA− memory T cells and a weaker one in CD4+/CD25+/CD45RA+ naive regulatory T cells (see Figures 2B and S3; Table S10). After estimating the location of the candidate TSS from the peak in the CAGE data, we observed that the primary sequence shows a TATA box at position −41..−35, an initiator consensus sequence at −1..+4, and a downstream promoter element (DPE) site at +26..+35 with respect to the hypothesized TSS (see Figure 2B). Additionally, a comparative genomics analysis shows that the domain structure of the predicted short DNMT1 isoform would be similar to homologous proteins seen in bacteria38 (see Figure S4). We compared this structure to the bacterial DNMT1 structure in the Protein Data Bank (PDB: 5LOD; chain A), observing high structural alignment: root-mean-square deviation (RMSD) 3.03, template modeling score (TM-score) 0.5, sequence identity 22%, equivalent residues 296, reference coverage 92%, and target coverage 55%. These observations point to possible transcription and translation of the novel DNMT1 isoform.
We therefore performed a western blot, seeking to identify a putative 60 kDa DNMT1 isoform in human immune system cells (see Star Methods; Figure 2C). We compared HEK and JURKAT cell lines, as well as primary CD14+ monocytes, primary CD8+ T cells, and peripheral blood mononuclear cells (PBMCs) depleted of primary monocytes and CD8+ T cells from one blood donor. The western blot showed both the constitutive, full-length 190 kDa DNMT1 protein as well as a band indicative of a shorter 60 kDa protein, with a length matching that of the new isoform implied by EpiNN. Note that while the western blot shows multiple additional bands around 140, 120, 110, ∼80, and ∼50 kDa, such bands could arise from, e.g., noise incurred by post-translational modifications of DNMT1 that regulate protein stability.39 Importantly, the putative novel isoform band at ∼60 kDa was not visible in HEK cells, indicating that it might be immune cell specific. We also performed PCR of CD8+ and CD8+-depleted PBMCs and observed bands of the expected size for a truncated DNMT1 transcript (see Figure 2D).
The EpiNN annotation is enriched for heritability in immune-related traits
We next analyzed EpiNN’s genome-wide predictions to test whether, as a whole, these putative AIIS-relevant regions are enriched for phenotypic effects in immune-related traits and diseases. To this end, we tested whether our AIIS annotation is predictive of regional heritability based on the EpiNN genome annotation, leveraging S-LDSC24,25,26,40 coupled with genome-wide association summary statistics for 176 traits (average n = 262,000; see Star Methods). We measured the informativeness of the EpiNN annotations using two standard metrics: heritability enrichment and the standardized effect and on heritability, denoted as 25,26 (see Star Methods). A key difference between the enrichment and metrics is that conditions on other annotations that are present in the model,26 thus quantifying the unique contribution of a tested annotation. We annotated 26 of the 176 traits as being immune related (see Table S4). For 20 of these, including, e.g., Crohn’s disease, multiple sclerosis, and hypothyroidism, we detected a significant (Z-test p ) heritability enrichment (average over 26 traits: 3.97, SE 0.05) and effect size ( average over 26 traits: 0.987, SE 0.015) for the EpiNN annotation (see Figure 3; numerical values are in Tables S4 and S5). These significant effect sizes imply that the EpiNN annotation captures a signal that is not detected using the 97 other functional and evolutionary annotations present in the baseline LD model. The 26 immune-system-relevant phenotypes include 21 autoimmune diseases such as type 1 diabetes (, SE 0.7), multiple sclerosis (, SE 1.3), and ulcerative colitis (, SE 0.29), as well as immune-related biomarkers, e.g., eosinophils count (, SE 0.21) and lymphocyte count (, SE 0.2). For effect sizes, see Figure 3B. Analysis of an additional 150 traits that were not directly labeled as immune relevant revealed a small set of additional traits with heritability enrichments/depletions for the EpiNN annotations (see Table S5). In particular, these included respiratory diseases (, SE 0.2) and dermatological diseases (, SE 0.3), for which immune function is likely to play a role.
Figure 3.

S-LDSC analysis of EpiNN heritability enrichment and effect size
Results are shown for all immune system traits and a selection of 9 (out of 176) non-immune system traits (see Table S5 for numerical values and additional results). Traits are labeled as immune system related (IS) or non-immune system related (nIS). For all analyses, S-LDSC was run including EpiNN together with 96 baseline LD annotations. Error bars represent standard errors (SEs).
(A) 18 out of 26 immune system traits were significantly enriched (p).
(B) 20 out of 26 had significant (p) effect sizes, .
(C) Enrichment analysis for the EpiNN annotation, divided into 50 quantiles. Meta-analysis for 5 IS and 58 nIS traits and diseases.
To confirm the specificity of the detected enrichments for immune-relevant phenotypes, we performed a meta-analysis of 63 independent traits, which included 4 autoimmune diseases: inflammatory bowel disease (IBD), hypothyroidism, eczema, and rheumatoid arthritis (see Star Methods, Figures 4 and S5, and Table S4). These autoimmune diseases also exhibited large effect sizes (; Z-test p ), again conditioned on 97 other functional and evolutionary annotations (hypothyroidism , SE 0.42; IBD , SE 0.23; eczema , SE 0.22; rheumatoid arthritis , SE 0.28; white blood cell count , SE 0.11). In addition, for EpiNN, we observed a 4.45× (SE 0.09) higher enrichment in autoimmune diseases (3.53×, SE 0.10) compared to non-immune system traits (0.80×, SE 0.03) (see Figure 3 for details), suggesting that EpiNN’s predictions are specific to immune-related traits and diseases.
Figure 4.

Joint S-LDSC analysis
Meta-analysis for 5 IS and 58 nIS traits and diseases. See Table S13 for a description of individual annotations. Error bars represent standard errors (SEs).
(A) Enrichment meta-analysis for EpiNN training and testing annotations and for the IRIS12 and ImmunoGene13 expression-based annotations.
(B) Effect size meta-analysis. Each annotation is separately conditioned on 96 other baseline LD annotations.
(C) Effect size meta-analysis. All three annotations were jointly added into the model and also conditioned on 96 other baseline LD annotations. Gray bars represent effect sizes obtained when only conditioning on 96 other baseline LD annotations.
(D) Effect size for an S-LDSC analysis where EpiNN were jointly analyzed with 96 other baseline LD annotations as well as annotations for IS-specific annotations related to EpiNN’s input.
Joint S-LDSC analysis of EpiNN and other immune-specific annotations
We used the same S-LDSC setup to test two other existing AIIS gene lists and compare them to EpiNN: Abbas et al.12 identified immune-system-relevant genes based on expression data, resulting in a list of genes, which we refer to as “IRIS,” and Giallourakis et al.13 used expressed sequence tag profiling based on transcriptional data, resulting in potential immune system relevant genes, called “ImmunoGenes.” We observed that, while significantly greater than 0, the marginal effect size of these annotations, meta-analyzed across immune system traits, was smaller than those observed for the EpiNN models (see Figure 4). To test whether the EpiNN annotation provides orthogonal information to that contained in these expression-based annotations, we performed a joint S-LDSC analysis, including EpiNN, IRIS, and ImmunoGenes in the same model. In this joint analysis, the heritability effect size of each annotation, conditional on the other two annotations, was slightly reduced but remained significant (see Figure 4C). The effect of the EpiNN annotation, in particular, remained large and significant (, SE 0.03), indicating that EpiNN provides novel information when conditioned on these expression-based models. We additionally performed joint S-LDSC analyses of immune-system-specific variants of the epigenetic annotations that are leveraged by EpiNN to verify that EpiNN captures a novel signal compared to these annotations. We created (see Star Methods) immune-system-specific annotations of the 5 histone marks that are used in ChromHMM (, , , , ), an immune-system-specific ChromHMM annotation (), and an immune-system-specific annotation of the histone marker H3K27ac (), which has been shown to harbor immune-related causal variation.10 Several of these annotations were highly correlated with each other (e.g., for and ; see Table S11 and Figure S6), while the strongest correlation for EpiNN was observed for the annotation (). We also built binarized versions of these annotations and computed the amount of overlap with the EpiNN annotation (see Table S12). The EpiNN annotation was found to overlap with all of these binarized annotations, suggesting that EpiNN does not closely reflect a single underlying annotation but rather learns to combine signals from these diverse functional elements.
In a joint S-LDSC analysis including these 7 annotations (see Figure 4D and Table S13), EpiNN retained a significant heritability effect (, SE 0.036, Z-test p), indicating that EpiNN’s combined signal is complementary to that provided by the other immune-specific functional annotations we considered. and also had significant and large effects. This was expected, as these annotations mark enhancers, which have been shown to harbor a large fraction of fine-mapped variants in autoimmune diseases.10 The immune-specific , which also should capture multiple functional elements, did not yield a significant effect, indicating that EpiNN and the other annotations present in the model better represent the signal provided by this annotation. Finally, to verify that these heritability effects were not significantly affected by the presence of highly correlated annotations in the joint model, we repeated this analysis, this time following a forward-stepwise elimination procedure26,41 (see Star Methods). In this analysis, the EpiNN, , , , , and annotations were again retained as significant, with heritability effects similar to those observed in Figure 4D.
Comparison to a CASAVA annotation
We also compared EpiNN to another machine learning approach, CASAVA,42,43 which uses several genomic features with the goal of annotating non-coding sequence variants in terms of risk for several disease categories. Although both CASAVA and EpiNN are trained on epigenetic data, the two models differ in several ways. EpiNN is specifically trained using epigenetic states produced by ChromHMM as features, using immune-system relevance labels based on patterns of differentiation between cell types (see Star Methods). CASAVA is trained using several epigenetic, RNA sequencing (RNA-seq), and gene expression data sources as features, using disease risk labels based on genome-wide association study (GWAS)-derived associated risk alleles across disease categories. Therefore, while the EpiNN annotation is specific to chromatin state information, the CASAVA annotation compounds genetic, epigenetic, and transcriptomic information.
We observed the correlation between the EpiNN and CASAVA immune-specific annotations (r = 0.137) to be comparable to that between EpiNN and the IRIS (r = 0.102) and ImmunoGene (r = 0.0957) expression-based annotations. Compared to EpiNN, CASAVA was more strongly correlated with raw epigenetic annotations (H3K9me3, H3K27me3, H3K4me3, H3K36me3, H3K4me1), which are utilized for training the model (CASAVA average r = 0.264, EpiNN average r = 0.088). These correlations reflect similarities but also substantial complementarities across these annotations (see Table S11). For instance, CASAVA did not report an elevated annotation value for the DNMT1 gene (EpiNN score = 0.95, CASAVA score = 0.452, suggested CASAVA cutoff = 0.7).
We further compared CASAVA and EpiNN using stratified LD score regression (see Figure S7). Unlike EpiNN, however, CASAVA is trained using labels obtained from GWAS data contained in the PheGenI database. Because S-LDSC also utilizes GWAS summary statistics to estimate heritability effects, we caution that the effect estimates for the CASAVA annotation in this analysis may be inflated due to overfitting and should therefore be interpreted with care. Jointly analyzed with the 96 annotations of the baseline LD model, the CASAVA immune-specific annotation yielded large heritability effect estimates (, SE 0.048). These effects remained large but decreased (, SE 0.043) in a model that also included the EpiNN, IRIS, and ImmunoGene annotations. In these analyses, the effect of the EpiNN annotation remained large and was more modestly decreased by the addition of the CASAVA annotation in the model (, SE 0.033 for EpiNN + IRIS + ImmunoGene and , SE 0.032 for EpiNN + IRIS + ImmunoGene + CASAVA), further suggesting that the EpiNN and CASAVA immune-specific annotations capture complementary information.
Additional enrichments of predicted AIIS-relevant regions
Next, we tested whether regions predicted by EpiNN to be immune relevant (EpiNN score ) are enriched for genomic variants associated with specific traits, using the trait-associated SNP enrichment (TraseR) software.44 This analysis is related to the analysis of heritability we performed using S-LDSC but focuses on trait-associated genomic variants that are found in curated dbGaP and NHGRI databases. Using this approach, we detected 18 significantly enriched traits for the EpiNN predictions, which are reported in Table S14. The 8 most enriched traits were immune related or autoimmune diseases (e.g., celiac disease: p , type 1 diabetes: p , or Crohn’s disease: p ). Other traits include conditions, such as alcoholism (p ), that are linked to systemic inflammation and worsening of autoimmune conditions.45 To verify that these enrichments are not solely driven by the set of training genes, we repeated this analysis after labeling all training regions as non-AIIS relevant, obtaining 14 significantly enriched traits, again mostly immune related (see Table S14).
Finally, we sought to test whether, in addition to being enriched for heritability in complex immune-related traits and diseases, genomic regions predicted by EpiNN were also enriched for genes linked to monogenic diseases and known immune-related drug targets. Indeed, after excluding the training regions, the set of genes predicted by EpiNN was 2.2× enriched (permutation p; see Table S15 for additional details) for genes linked to monogenic immune diseases contained in a list compiled by the International Union of Immunological Societies Expert Committee.46 Genes predicted by EpiNN were also 1.7× enriched (permutation p for approved rheumatoid arthritis drug targets1). These observations suggest a potential use of EpiNN scores in clinical and drug prioritization settings.
S-LDXR indicates ancestry-specific effects for EpiNN regions
Regulatory effects and variant effect sizes might differ across human populations, especially for variants within genomic regions that are under stronger gene-environment interactions, such as immune-related annotations.27 We therefore tested whether immune-related regions implicated by EpiNN were depleted for trans-ancestry genetic correlation. To this end, we applied S-LDXR27 on 15 diseases and complex traits (see Table S16) with GWAS data from East Asian (mean n = 83,000) and European (mean n = 235,000) populations (see Star Methods, Figure 5, and Table S17). We found that variants within the EpiNN annotation were similarly enriched in both populations (East Asian population enrichment: 2.32×, SE 0.22; European population enrichment: 2.11×, SE 0.16), suggesting that the EpiNN annotation may be used to effectively predict AIIS-relevant regions in non-European ancestries. At the same time, the EpiNN annotation was the second most significantly depleted for squared trans-ancestry genetic correlation among 54 tested annotations (0.67×, SE 0.05, p =). This depletion indicates the presence of underlying population-specific causal effect sizes, which are likely due to stronger gene-environment interactions at immune related loci with large EpiNN scores.
Figure 5.

S-LDXR analysis results
S-LDXR results for 54 functional annotations across 15 immune diseases and complex traits. Error bars represent standard errors (SEs).
(A). Enrichment/depletion of squared trans-ethnic genetic correlation for annotation C (, C).
(B and C) Population-specific estimates of heritability enrichment for each annotation.
Discussion
We developed a supervised classification algorithm, called EpiNN, that leverages a low-dimensional encoding of genome-wide epigenetic data produced by the ChromHMM model28 to detect AIIS-relevant regions. We trained EpiNN using a handcrafted list of 888 immune-system-related (IS) loci and applied the model to scan the human genome for new IS regions. We built a genome-wide annotation of predicted IS relevance, detecting loci with high () EpiNN scores. A large fraction of these loci did not have an associated GO term, while the remaining were enriched for immune-related function. We performed PCR and western blot analyses for a constitutively expressed gene, DNMT1, which was flagged as AIIS relevant by EpiNN, obtaining evidence for the presence of a novel immune-system-specific TSS. To evaluate EpiNN’s efficacy in detecting genomic regions enriched for heritability in IS traits, we built a genome-wide EpiNN annotation and performed stratified LD score regression analysis using association summary statistics for 176 traits (average n = 262,000). We observed a significant enrichment and heritability effect size for IS traits, which remained significant after conditioning on 97 other functional and evolutionary annotations. To confirm the specificity of the detected enrichments for IS phenotypes, we performed a meta-analysis of 63 independent traits, finding that IS-related traits were 4.45× (SE 0.09) more enriched for heritability than non-IS traits. We also found the EpiNN annotation to be enriched for loci associated with both complex and monogenic immune-related traits and with approved drug targets. Finally, we used S-LDXR27 to test for depletion of squared trans-ancestry genetic correlation in European and East Asian association summary statistics for 15 IS traits (average = 83,000, = 235,000). The EpiNN annotation was among the most significantly depleted annotations, indicating ancestry-specific effects that may be driven by gene-environment interactions at IS loci impacted by recent adaptation.
Machine learning algorithms trained on regulatory annotations across tissues and cell types have recently shown great promise in predicting chromatin data and SNPs associated to a trait (e.g., Alipanahi et al.,47 Zhou and Troyanskaya,48 Zhou et al.,49 and Kelley et al.50). However, when conditioned on currently available coding, evolutionary, and regulatory data, these annotations were observed to only contain limited novel information for complex traits and diseases.41 Our analyses suggest that supervised classification algorithms trained on handcrafted sets of genes with known functional roles may be used to obtain insights into the architecture of a specific class of traits or diseases. In our analysis of 176 complex traits and diseases, we found heritability effects for the EpiNN annotation to be specific to known immune traits or respiratory and dermatological traits for which an immune component is likely to exist. This suggests that this approach may allow the identification of traits that would not be otherwise known to have an immune-related component. In addition, our observation of decreased cross-ancestry genetic correlation in regions predicted to be AIIS relevant provides further evidence for selection acting on immune-related regions and may inform approaches that aim to maximize portability of polygenic scores across ancestries.51,52
Evidence for a novel TSS in DNMT1 and heritability effects observed for EpiNN in conditional S-LDSC analyses also highlight the potential of methods that utilize epigenetic information to complement transcription-based approaches. This complementarity might be driven by the presence of a larger fraction of non-coding or microRNA genes being predicted by EpiNN to be AIIS relevant. This is likely due to many microRNAs losing their poly-A tail very early on in their lifespan and therefore not being detected using transcription-based approaches, which rely on the poly-A tail for detection. The prediction of many long non-coding RNAs (lncRNAs) by EpiNN is consistent with their newly recognized roles in inflammatory diseases.53 lncRNAs play an important role in the dynamic changes in the expression of genes in immune cells, which are necessary to react to infections. The functional consequences of disease-causing SNPs in lncRNAs and their biological pathways are not fully understood, but approaches such as EpiNN provide an avenue to future analyses of lncRNAs with potential immune system relevance.
Finally, understanding the molecular makeup of target proteins underpins successful drug development. For example, DNMT1 is a medically viable target via binding to marketed therapeutics like 5-azacytidine and decitabine54 or via inhibition by oxysterol sulfates,55 including larsucosterol, which is undergoing a phase 2 clinical trial for treatment of acute renal failure.56 Notably, oxysterols have a fundamental role in the regulation of lymphocytes,57 so larsucosterol could have potential use cases in immunology indications.58 The binding site of oxysterol sulfate in DNMT1 remains unknown and could reside at the C-terminal regulatory domains, which are omitted by the putative novel isoform we have identified; this observation may inform pre-clinical study plans in future investigations on the repurposing of larsucosterol.
Limitations of the study
We note several limitations of our EpiNN approach as well as directions of future work. First, EpiNN uses a supervised training procedure that relies on a small set of handcrafted genomic regions related to a specific class of well-studied genes. This inevitably leads to predicting genes exhibiting similar epigenetic profiles, potentially excluding AIIS-relevant genes with different activation patterns from the resulting EpiNN predictions. Reassuringly, however, we observed that EpiNN also flagged a variety of genes that are active in different subcultures of immune system cells and are exclusively immune system relevant or only immune-system-specific splicing variants. Interestingly, EpiNN obtained larger conditional heritability effects compared to the training list. Second, while the experimental results of DNMT1 suggest the existence of a novel isoform in immune cells, as we see a new isoform of the predicted size in the western blot, some of the other bands are still unexplained, suggesting the need for further validation. Third, although our analyses primarily leveraged ChromHMM data, the EpiNN model may be extended to consider additional sources of information, such as Hi-C59 or chromatin accessibility data.60 Fourth, to work well in other functional categories, this approach needs representation of relevant cell types in the ChromHMM data provided as input, as well as careful selection of a training set. For instance, repeating this analysis with brain or epithelial genes did not yield similarly accurate results (, ). However, epigenetic datasets are rapidly expanding (e.g., EpiMap61), suggesting that this strategy will become more broadly applicable in the near future.
Despite these limitations and avenues of future work, we believe that the EpiNN model and genome-wide annotation provide useful tools for the analysis of genomic regions involved in regulatory mechanisms of the immune system.
STAR★Methods
Key resources table
| REAGENT or RESOURCE | SOURCE | IDENTIFIER |
|---|---|---|
| Antibodies | ||
| anti-actin (clone C4) | Millipore | MAB1501; RRID: AB_2223041 |
| anti-DNMT1 (clone JF09-89) | Novus Biologicals | NBP2-66805; RRID: AB_2809824 |
| Biological samples | ||
| Peripheral blood samples | Oxford BioBank | https://www.ncbi.nlm.nih.gov/pmc/articles/PMC5837504/ |
| Chemicals, peptides, and recombinant proteins | ||
| Lymphoprep | Axis-Shield | 1115758 |
| Critical commercial assays | ||
| CD8+ MicroBeads | Miltenyi | 130-094-412 |
| NEBNext® High-Fidelity 2X PCR Master Mix (NEB) | NEB | NEB #M0544 |
| Deposited data | ||
| Epigenome Roadmap | Roadmap Epigenomics Consortium et al.22 | https://www.ncbi.nlm.nih.gov/geo/roadmap/epigenomics/ |
| ChromHMM | Ernst et al.28 | https://egg2.wustl.edu/roadmap/web_portal/chr_state_learning.html |
| HUGO Gene names | Gene Nomenclature Committee | https://genenames.org |
| FANTOM CAGE data | Kanamori et al. 36 and Lizio et al.37 | https://fantom.gsc.riken.jp/5/datafiles/latest/basic/human.primarycell.LQhCAGE/ |
| S-LDSC Baseline models | Various | https://alkesgroup.broadinstitute.org/LDSCORE/ |
| EpiNN annotations | This paper | https://doi.org/10.5281/zenodo.10009211 |
| Oligonucleotides | ||
| RNA sequence: Primers against the DNMT1 transcript with the alternative start site: 5′-GCATAAGCTCACCAC AAAGGA-3′ and 5′-GGCCTCGAGGA AGTAGAAGC-3′) |
This paper | N/A |
| RNA sequence: Positive control primers: against TYK2, 5′-GTACTGCTACGATCC GACCA-3′ and 5′-GCAGCCCTTGTACT TGATGA-3′ |
This paper | N/A |
| Software and algorithms | ||
| EpiNN | This paper | https://doi.org/10.5281/zenodo.10009211 |
| Stratified LD-score regression (S-LDSC) | Bulik-Sullivan et al. 24 and Finucane et al.25 | https://github.com/bulik/ldsc |
| S-LDXR | Shi et al.27 | https://pubmed.ncbi.nlm.nih.gov/33597505/ |
| traseR | Chen et al.44 | https://www.bioconductor.org/packages/release/bioc/html/traseR.html |
| PANTHER | Thomas et al.23 | https://pantherdb.org/ |
Resource availability
Lead contact
Further information and requests for resources and reagents should be directed to and will be fulfilled by the lead contact, Pier Francesco Palamara (palamara@stats.ox.ac.uk).
Materials availability
This study did not generate new unique reagents.
Data and code availability
-
•
The data used to train the EpiNN model and the annotations produced by EpiNN can be downloaded at https://doi.org/10.5281/zenodo.10009211 or https://palamaralab.github.io/software/epinn_data/ and are publicly available as of the date of publication. The experimental DNMT1 data reported in this paper will be shared by the lead contact upon request.
-
•
All original code can be downloaded at https://doi.org/10.5281/zenodo.10009211 or https://palamaralab.github.io/software/epinn/ and is publicly available as of the date of publication. DOIs are listed in the key resources table.
-
•
Any additional information required to reanalyze the data reported in this paper is available from the lead contact upon request.
-
•
Additional data and code used in this work include: S-LDSC Baseline models https://alkesgroup.broadinstitute.org/LDSCORE/; S-LDSC software https://github.com/bulik/ldsc; The 63 independent traits used in S-LDSC analyses: https://zenodo.org/record/7796478/files/sumstats.tgz?download=1; The 176 traits used in S-LDSC analyses: https://alkesgroup.broadinstitute.org/; HUGO gene annotations https://genenames.org retrieved on 15-01-2020; FANTOM CAGE data https://fantom.gsc.riken.jp/5/datafiles/latest/basic/human.primary_cell.LQhCAGE/; Scipy62; Matplotlib63; NumPy64,65; Pandas66,67; Keras68; Tensorflow.69
Method details
The EpiNN model uses a convolutional neural network (CNN) that is trained on epigenetic data to identify genomic regions that belong to a specific class, such as AIIS genes. We provide additional details on the input encoding of epigenetic data, the EpiNN model, its training and deployment, and the experimental setup used in downstream analyses.
Encoding of epigenetic data
We downloaded the data of the 15-state model of ChromHMM28 from the epigenome roadmap project.22 ChromHMM combines 5 chromatin markers (H3K4me3, H3K4me1, H3K36me3, H3K27me3, and H3K9me3) into 15 epigenetic states (see Table S1) for 111 different cell and tissue types. The chromatin marker tracks and ChromHMM output are both freely available at https://www.ncbi.nlm.nih.gov/geo/roadmap/epigenomics/ and https://egg2.wustl.edu/roadmap/web_portal/chr_state_learning.html. The data comes from 183 biological samples, which have been consolidated into 111 and preprocessed.22 We adopted this dataset for downstream analyses, without further preprocessing. To facilitate human readability during the labeling of training examples and in downstream analyses, we represented epigenetic data for a given genomic region in the EpiNN model using an image-like format. We encoded each epigenetic state using a red-green-blue (RGB) color scheme, adopting the scheme used in Kundaje et al., with a few modifications (see Table S1). Each image contains 111 rows representing 111 different cell and tissue types.22 Each row encodes ChromHMM28 data from the Epigenome Roadmap,22 and each column represents the epigenetic state of 200 base pairs (bp). Images were set to have a fixed size spanning 100 kilobases (kbp).
To standardize the reading direction of the genes, we horizontally mirrored all the epigenomes on the minus strand of the genome. When sets of genes were analyzed during training, each image contained a single gene. When a gene did not fit into a single image, we found that only including the start of each gene, which contains the most diverse and relevant epigenetic signal, resulted in slightly better performance measured using the area under the precision-recall curve (AUPRC = 0.968) than alternative arrangements of the image (e.g., including the center, AUPRC = 0.938, or the end of the gene, AUPRC = 0.929).
Because the CNN learns epigenetic patterns that are localized within regions of the training images, the ordering of rows (cell/tissue types) has an impact on the model’s performance. When training and deploying the model, we adopted the ordering used in Kundaje et al., but changed the position of the two thymus datasets to be placed underneath the T cell datasets, as the thymus is where the T cells reside during their maturation, leading to related signal. This slightly increased the validation AUPRC value (0.968 vs. 0.942) of the model. To facilitate comparison with existing literature, however, we chose to display all images in this paper using the color scheme and row order of Kundaje et al.
EpiNN model
The main EpiNN model consists of a CNN comprising 3 stacked modules of a convolutional layer, ReLU activation, and a max pooling layer. The convolutions operate on windows and the max pooling layers operate on windows. The first convolution employs 16 filters, the following one employs 32 filters, and the last one employs 64 filters. After these 3 modules, we added two fully-connected layers, separated by a dropout layer. The network output uses a sigmoid activation producing a score ranging between 0 and 1, which reflects the predicted confidence that the input image contains an AIIS gene.
Variations of data encoding and model architecture
We tested variations of the input encoding and model architecture, including one-dimensional and binary encodings of the epigenetic states (referred to as the EpiNN-1D and EpiNN-binary models, see Table S1), as well as a simpler logistic regression model (EpiNN-logistic).
The EpiNN-1D model was created by ranking the fifteen states based on the strength of their association with active transcription and encoding this order with values ranging between 0 and 1. This ranking was devised to approximately reflect the biological relationships across these states (for a recent approach quantifying these relationships see70). For the EpiNN-binary model, we assigned the eight states with highest one-dimensional scores to a "transcription-associated" state and the remaining seven states to a "non-transcription-associated/transcription-agnostic" state.
EpiNN training
The training data for the EpiNN model consisted of a hand-crafted list of AIIS genes. These were selected to be loci relevant for immune cell identity, such as most leukocyte signature matrix29 or cancer immunity cycle genes,30 which exhibited a distinctive pattern in the Epigenome Roadmap 15 state model visualization. Specifically, upon visual inspection, most primary immune cells displayed a highly activated promoter, elongation, and/or enhancer signals in stark contrast to other cell types, where either quiescent or repressed epigenetic states were typically dominating. We thus iteratively inspected 15-state model profiles of genes from the Metacore Database71 and labeled 888 genomic loci where we observed such a discrepancy between the epigenetic markers of immune cells and those of other cell types (see Supplementary Information for a list of training genes).
The selection of positive and negative examples was performed by visual inspection, using selection criteria based on the above features; examples of positive and negative training genes are shown in Figure S1. We also extracted a stricter set of 477 genomic loci (see Table S3), where the signal difference between the immune cell block and other cell types was more pronounced, e.g., where no single other cell type showed similar patterns or where all immune cell types showed the same signal rather than only certain blocks like T-cells or B-cells. However, we found this stricter set to yield slightly lower prediction performance (AUPRC = 0.911), so we used the broader set of 888 training genes in all downstream analyses.
This hand-crafted gene set was used as the training data of the EpiNN model, together with an equal number of randomly sampled genes to represent non-AIIS regions, which were manually inspected to verify they do not harbor immune system-specific signatures. For further validation and to perform a sanity check in a less complex scenario, we also repeated this procedure using a dataset containing housekeeping genes72 together with an equal number of genes labeled as non-housekeeping.
We performed a grid search to optimize hyper-parameters in each of the models used to analyze AIIS or housekeeping genes. These included image size in bps (10, 25, 50, 100, 200, or 400 kbp), image size in pixel (100, 500, or pixels), dropout rate (0.1, 0.3), and number of epochs (10, 50). Batch size (64) and learning rate (0.001) were held constant. We divided the data into 10 random subsets of approximately equal size and used cross-validation to optimize hyperparameters and perform model selection. We adopted binary cross-entropy to evaluate the performance of each model configuration and measured the area under the precision-recall curve (AUPRC) as an additional metric.
Contribution of individual features to EpiNN predictions
We performed analyses to understand which epigenetic feature primarily drives the prediction made by the EpiNN model. To this end, we grouped all transcription start site (TssA, TssAFlnk, TssBiv, BivFlnk), enhancer (EnhG, Enh, EnhBiv), and transcription (TxFlnk, Tx, TxWk) states and performed analyses in which the EpiNN model was retrained after setting each of these groups to the Quiescent state (state 15). The Quiescent state indicates absence of any of the underlying markers (see the emission parameters of the five chromatin markers in Figure 4A in,22 and we thus use it in these experiments to represent missing information. We then trained and optimized the EpiNN model as described above and compared the performance of the full EpiNN model with models where either transcription start site, enhancer, or transcription features have been set to Quiescent.
Prediction of novel AIIS regions and genome-wide EpiNN annotation
We applied the trained and optimized EpiNN model to perform prediction of novel AIIS relevant regions along the genome, using a sliding window approach. To this end, we divided the genome into overlapping windows of 100 kbp, using intervals of 10 kbp as a step size. Due to the resulting overlap between windows, this approach yields 10 EpiNN predictions for each 10 kbp window. To combine these into a single score we computed a rolling average with Gaussian weights (SD = 0.5), so that predictions where the 10 kbp window is in the center of the image have the highest weight in the final score for the region. Finally, we produced a genome-wide annotation with these EpiNN predictions by taking the maximum predicted value between the forward and backward strand directions. To reduce noise in several downstream analyses, we clipped all annotation values below 0.75, setting them to 0.
Panther GO term analysis
We tested regions corresponding to high EpiNN annotation values for functional enrichment, using gene ontology (GO) term analysis. We first used HUGO identifiers to match annotated genomic regions to known genes. For every gene, we then computed the average EpiNN annotation value. To reduce noise, we set the score of genes with average EpiNN value lower than 0.5 to 0 (selecting 7.8% of all genes). We used the PANTHER23 tool to perform a GO term analysis of the biological process (“GO biological process complete”), the cellular components (“GO cellular component complete”), and the molecular function (“GO molecular function complete”) assignments. The analysis was run using the following settings: analysis type: PANTHER overrepresentation test (released 20200407); annotation GO ontology database (https://doi.org/10.5281/zenodo.3727280) released on 2020-03-23; reference list: Homo Sapiens (all genes in database); test type: FISHER; correction: Bonferroni. We report results satisfying Bonferroni-corrected . To verify that the results of these analyses are not driven by the set of genes used in training, we also repeated these analyses after excluding the set of training genes.
traseR analysis
We performed trait-associated SNP enrichment analysis in genomic intervals (traseR) of the SNPs in the EpiNN annotation.44 We binarized the EpiNN annotation at a threshold of 0.75, as in other analyses, and used the resulting regions as input for traseR (version 1.30.0, 2021) using default settings (genome-wide testing, excluding LD SNPs, using a binomial test). There were bp in the query region, accounting for 3.6% of the genome. The analysis involved 573 traits, leading to a significance threshold of .
Human peripheral blood samples
To perform experimental validation for the DNMT1 gene, which was predicted to be AIIS-relevant by EpiNN, we performed PCR and Western Blot analysis on immune system and non-immune system cells. Peripheral blood samples were obtained by venesection of volunteers from the Oxford BioBank, which is a random, population-based cohort of healthy adults. Samples were obtained with informed consent, under CUREC R45381/RE001 approval. Peripheral blood mononuclear cells were separated by density gradient centrifugation using Lymphoprep (Axis-Shield), and specific cell subsets were isolated by positive selection using MicroBeads (Miltenyi). Cell viability was estimated to be .
Immunoblotting
Cells were lysed with lysis buffer containing 20 mM HEPES pH mM sodium chloride, Triton X-100 and 1 mM dithiothreitol (all Sigma-Aldrich, UK). Lysis buffer was supplemented with protease inhibitors (Roche Mini Complete from Roche Diagnostics, UK) immediately prior to use. Protein concentration was determined using a Nanodrop One spectrophotometer (Thermo Fisher, UK) with the BCA kit (Thermo Fisher, USA). Lysates were mixed with Laemmli sample buffer (BioRad, UK) and denatured at 95°C for 10 min. The denatured lysates were then loaded onto a polyacrylamide gel made using the TGX FastCast Acrylamide Kit (BioRad, UK), with 20 g of protein loaded per lane. Following blotting onto nitrocellulose membrane, anti-actin (clone C4, Millipore) and anti-DNMT1 (clone JF09-89, Novus Biologicals) were used for protein detection, with staining with IRDye 680LT- and 800CW-conjugated secondary antibodies and visualization using an Odyssey Infrared Imaging System (LI-COR Biosciences). Analyses were performed with n = 3 individuals in technical duplicate.
Polymerase chain reaction (PCR)
Cells were lysed with buffer RLT and RNA isolation, genomic DNA removal and cDNA synthesis were performed with Qiagen kits, according to the manufacturers’ protocols. PCR was performed using the NEBNext High-Fidelity 2X PCR Master Mix (NEB) with primers against the DNMT1 transcript with the alternative start site (5′-GCATAAGCTCACCACAAAGGA-3′ and 5′-GGCCTCGAGGAAGTAGAAGC-3′) and positive control primers (against TYK2, 5′-GTACTGCTACGATCCGACCA-3′ and 5′-GCAGCCCTTGTACTTGATGA-3′). The PCR program used was 98°C for 30s, and 30 cycles of 98°C for 10s, 66°C for 30s, and 72°C for 20s, followed by a further 2 min at 72°C. PCR products were resolved by gel electrophoresis and visualized with a UV transilluminator. Analyses were performed with n = 3 individuals in technical duplicate.
LDSC analysis
We tested whether regions predicted to be AIIS-relevant by EpiNN are enriched for complex trait heritability using stratified LD-score regression (S-LDSC).24,25,26 We assessed the informativeness of an annotation c using two metrics. The first metric, enrichment E, is defined as follows (for binary and probabilistic annotations):
| (Equation 1) |
where is the heritability explained by the SNPs in annotation c, weighted by the annotation values. This compares the heritability per SNP within the annotation to the genome-wide average heritability per SNP.
The second metric, standardized effect size (), is defined as follows (for binary, probabilistic, and continuous-valued annotations):
| (Equation 2) |
where is the standard error of annotation c, the total SNP heritability and M is the total number of SNPs on which this heritability is computed. represents the proportionate change in per-SNP heritability associated to a 1 standard deviation increase in the value of the annotation. The main difference between enrichment and is that enrichment does not account for other annotations that may be already present in the model, whereas quantifies effects that are unique to the focal annotation c (after conditioning on all other annotations by testing whether differs from zero in multiple regression). We computed the statistical significance of the enrichment and of each annotation via block-jackknife over 200 blocks.25
To increase statistical power, we performed a random-effects meta-analysis73 of heritability using summary association statistics from 63 studies for 57 unique heritable traits. Of these, 57 studies involved traits with negligible genetic correlation to all other traits (r ) and 7 more involved duplicate traits (genetic correlation with another trait) but disjoint samples.74 For simplicity, we refer to this set of 63 studies as “63 independent traits” throughout. A subset of 5 studies involved immune system-relevant traits. We performed meta-analyses including either all studies or the subset of immune-relevant and non immune-relevant traits. The list of traits we analyzed is reported in Supplementary Information for Stricker et al. “Genome-wide classification of epigenetic activity reveals regions of enriched heritability in immune-related traits”.
In addition to these 63 studies used for meta-analysis, we performed further heritability analyses for the EpiNN annotation using a wider list of 176 publicly available summary association statistics from several diseases and complex traits, reported in Supplementary Information, corresponding to traits with an S-LDSC SNP heritability Z score of at least 626 that can be downloaded from https://alkesgroup.broadinstitute.org/. These are not necessarily independent, but contain a broader set of 26 immune system-relevant traits and diseases. To test whether the EpiNN annotation had a significant heritability effect size when conditioned on other annotations, such as IRIS and ImmunoGene, we performed joint S-LDSC analyses where all tested annotations were jointly included in addition to the baseline-LD model. To account for effects of highly-correlated annotations in the joint S-LDSC analysis, we performed forward stepwise elimination.26,41 In this procedure, we iteratively added one annotation at a time to an existing set of annotations, starting from the baseline-LD model, and only retained annotations that remained Bonferroni-significant at each iteration. Because the set of annotations retained by this heuristic procedure may vary depending on the order in which annotations are considered, we repeated this analysis using all possible orders, but pruned specific combinations that were unlikely to be jointly significant. Specifically, whenever annotation A became non-significant after adding annotation B, we only included annotation B in any combination of annotations that would have otherwise have contained both A and B.
Histone mark and immune system-specific ChromHMM annotations
To build histone mark S-LDSC annotations, we downloaded all available immune system cell tracks for each H3K27me3, H3K36me3, H3K9me3, H3K4me1, H3K4me3, and H3K27ac from the Epigenome Roadmap database.22 We averaged the signal over all cell types to obtain a genome-wide annotation for each individual chromatin mark, resulting in 6 annotations: , , , , , and .
We also built S-LDSC immune system-specific ChromHMM annotations. To this end, we applied the same binarization as EpiNN-binary to the 15 states with the goal of differenting between activating and repressing states (see Table S1). We averaged the ChromHMM data28 over all immune system cells and non-immune system cells separately. Transcription-associated states were encoded as 1 and non-transcription-associated states as 0. We subtracted the non-immune system average from the immune system average to create an immune-specific annotation, labeled .
S-LDXR
We used the S-LDXR algorithm27 to estimate enrichment of stratified squared multi-ancestry genetic correlation across functional categories of SNPs. S-LDXR relies on GWAS summary statistics and population-matched linkage disequilibrium (LD) reference panels. S-LDXR first estimates the genome-wide squared multi-ancestry genetic correlation , which is defined as the squared correlation between per-allele effect sizes across two ancestries. Note that, unlike in the S-LDSC analyses, S-LDXR analyses focus on per-allele effect sizes, rather than per-SNP , to account for differences in allele frequencies across populations. Then, S-LDXR estimates the enrichment/depletion of squared multi-ancestry genetic correlation within an annotation c, which is defined as , where is the squared multi-ancestry genetic correlation of variants within annotation c. We applied the S-LDXR method using recommended settings, reference files (i.e., 481 East Asian and 489 European samples in the Genomes Project), and a background set of functional annotations (i.e., the baseline-LD-X model, a set of 62 functional SNP-annotations known to impact per-allele effect sizes). We analyzed 15 immune traits from the total of 31 traits analyzed in Shi et al.; GWAS summary statistics were obtained for both ASI and EUR ancestries using Biobank Japan, UK Biobank, and other sources (see Table S2 in27).
Acknowledgments
We thank Sasha Gusev for helpful discussions and for comments on an early draft and Simon Myers’s research group for helpful discussions. This work was supported by the Engineering and Physical Sciences Research Council (EPSRC) and the Medical Research Council (MRC) (grant number EP/L016044/1 to M.S.), Wellcome Trust ISSF grant 204826/Z/16/Z (to P.F.P.), and European Research Council (ERC) Starting Grant 850869 (to P.F.P.). Computation used the Oxford Biomedical Research Computing (BMRC) facility, a joint development between the Wellcome Centre for Human Genetics and the Big Data Institute supported by Health Data Research UK and the NIHR Oxford Biomedical Research Centre. Financial support was provided by the Wellcome Trust Core Award grant number 203141/Z/16/Z. The views expressed are those of the author(s) and not necessarily those of the NHS, the NIHR, or the Department of Health.
Author contributions
Conceptualization, M.S., S.N., and P.F.P.; methodology, M.S., S.N., and P.F.P.; software, M.S.; investigation, M.S., W.Z., S.G., C.D., S.N., and P.F.P.; resources, M.S., W.Z., W.-Y.C., C.D., S.G., S.N., and P.F.P.; writing – original draft, M.S. and P.F.P.; writing – review & editing, M.S., S.N., and P.F.P.; visualization, M.S.; supervision, S.N. and P.F.P.; funding acquisition, C.D., S.N., and P.F.P.
Declaration of interests
S.N. is an employee of Roche. W.-Y.C. is an employee of Regeneron and a former employee of Roche.
Published: December 28, 2023
Footnotes
Supplemental information can be found online at https://doi.org/10.1016/j.xgen.2023.100469.
Contributor Information
Satu Nahkuri, Email: satu.nahkuri@roche.com.
Pier Francesco Palamara, Email: palamara@stats.ox.ac.uk.
Supplemental information
References
- 1.Okada Y., Wu D., Trynka G., Raj T., Terao C., Ikari K., Kochi Y., Ohmura K., Suzuki A., Yoshida S., et al. Genetics of rheumatoid arthritis contributes to biology and drug discovery. Nature. 2014;506:376–381. doi: 10.1038/nature12873. [DOI] [PMC free article] [PubMed] [Google Scholar]
- 2.Dendrou C.A., Cortes A., Shipman L., Evans H.G., Attfield K.E., Jostins L., Barber T., Kaur G., Kuttikkatte S.B., Leach O.A., et al. Resolving TYK2 locus genotype-to-phenotype differences in autoimmunity. Sci. Transl. Med. 2016;8:363ra149. doi: 10.1126/scitranslmed.aag1974. [DOI] [PMC free article] [PubMed] [Google Scholar]
- 3.Chen W., Xu H., Wang X., Gu J., Xiong H., Shi Y. The tumor necrosis factor receptor superfamily member 1B polymorphisms predict response to anti-TNF therapy in patients with autoimmune disease: A meta-analysis. Int. Immunopharm. 2015;28:146–153. doi: 10.1016/j.intimp.2015.05.049. [DOI] [PubMed] [Google Scholar]
- 4.Villanueva L., Álvarez-Errico D., Esteller M. The Contribution of Epigenetics to Cancer Immunotherapy. Trends Immunol. 2020;41:676–691. doi: 10.1016/j.it.2020.06.002. [DOI] [PubMed] [Google Scholar]
- 5.Momozawa Y., Dmitrieva J., Théâtre E., Deffontaine V., Rahmouni S., Charloteaux B., Crins F., Docampo E., Elansary M., Gori A.-S., et al. Nat. Commun. 2018;9:1–18. [Google Scholar]
- 6.Jostins L., Ripke S., Weersma R.K., Duerr R.H., McGovern D.P., Hui K.Y., Lee J.C., Schumm L.P., Sharma Y., Anderson C.A., et al. Host-microbe interactions have shaped the genetic architecture of inflammatory bowel disease. Nature. 2012;491:119–124. doi: 10.1038/nature11582. [DOI] [PMC free article] [PubMed] [Google Scholar]
- 7.Seldin M.F. The genetics of human autoimmune disease: A perspective on progress in the field and future directions. J. Autoimmun. 2015;64:1–12. doi: 10.1016/j.jaut.2015.08.015. [DOI] [PMC free article] [PubMed] [Google Scholar]
- 8.Liu J.Z., Van Sommeren S., Huang H., Ng S.C., Alberts R., Takahashi A., Ripke S., Lee J.C., Jostins L., Shah T., et al. Association analyses identify 38 susceptibility loci for inflammatory bowel disease and highlight shared genetic risk across populations. Nat. Genet. 2015;47:979–986. doi: 10.1038/ng.3359. [DOI] [PMC free article] [PubMed] [Google Scholar]
- 9.Roederer M., Quaye L., Mangino M., Beddall M.H., Mahnke Y., Chattopadhyay P., Tosi I., Napolitano L., Terranova Barberio M., Menni C., et al. The genetic architecture of the human immune system: a bioresource for autoimmunity and disease pathogenesis. Cell. 2015;161:387–403. doi: 10.1016/j.cell.2015.02.046. [DOI] [PMC free article] [PubMed] [Google Scholar]
- 10.Farh K.K.-H., Marson A., Zhu J., Kleinewietfeld M., Housley W.J., Beik S., Shoresh N., Whitton H., Ryan R.J.H., Shishkin A.A., et al. Genetic and epigenetic fine mapping of causal autoimmune disease variants. Nature. 2015;518:337–343. doi: 10.1038/nature13835. [DOI] [PMC free article] [PubMed] [Google Scholar]
- 11.Gutierrez-Arcelus M., Rich S.S., Raychaudhuri S. Autoimmune diseases - connecting risk alleles with molecular traits of the immune system. Nat. Rev. Genet. 2016;17:160–174. doi: 10.1038/nrg.2015.33. [DOI] [PMC free article] [PubMed] [Google Scholar]
- 12.Abbas A.R., Baldwin D., Ma Y., Ouyang W., Gurney A., Martin F., Fong S., van Lookeren Campagne M., Godowski P., Williams P.M., et al. Immune response in silico (IRIS): immune-specific genes identified from a compendium of microarray expression data. Gene Immun. 2005;6:319–331. doi: 10.1038/sj.gene.6364173. [DOI] [PubMed] [Google Scholar]
- 13.Giallourakis C.C., Benita Y., Molinie B., Cao Z., Despo O., Pratt H.E., Zukerberg L.R., Daly M.J., Rioux J.D., Xavier R.J. Genome-wide analysis of immune system genes by expressed sequence Tag profiling. J. Immunol. 2013;190:5578–5587. doi: 10.4049/jimmunol.1203471. [DOI] [PMC free article] [PubMed] [Google Scholar]
- 14.Zopf C.J., Quinn K., Zeidman J., Maheshri N. Cell-cycle dependence of transcription dominates noise in gene expression. PLoS Comput. Biol. 2013;9 doi: 10.1371/journal.pcbi.1003161. [DOI] [PMC free article] [PubMed] [Google Scholar]
- 15.Bryan J. Problems in gene clustering based on gene expression data. J. Multivariate Anal. 2004;90:44–66. [Google Scholar]
- 16.Vaquerizas J.M., Kummerfeld S.K., Teichmann S.A., Luscombe N.M. A census of human transcription factors: function, expression and evolution. Nat. Rev. Genet. 2009;10:252–263. doi: 10.1038/nrg2538. [DOI] [PubMed] [Google Scholar]
- 17.Chandramouli K., Qian P.-Y. 2009. Human Genomics and Proteomics: HGP 2009. [DOI] [PMC free article] [PubMed] [Google Scholar]
- 18.Finucane H.K., Reshef Y.A., Anttila V., Slowikowski K., Gusev A., Byrnes A., Gazal S., Loh P.-R., Lareau C., Shoresh N., et al. Heritability enrichment of specifically expressed genes identifies disease-relevant tissues and cell types. Nat. Genet. 2018;50:621–629. doi: 10.1038/s41588-018-0081-4. [DOI] [PMC free article] [PubMed] [Google Scholar]
- 19.Corces M.R., Buenrostro J.D., Wu B., Greenside P.G., Chan S.M., Koenig J.L., Snyder M.P., Pritchard J.K., Kundaje A., Greenleaf W.J., et al. Lineage-specific and single-cell chromatin accessibility charts human hematopoiesis and leukemia evolution. Nat. Genet. 2016;48:1193–1203. doi: 10.1038/ng.3646. [DOI] [PMC free article] [PubMed] [Google Scholar]
- 20.Lau C.M., Adams N.M., Geary C.D., Weizman O.-E., Rapp M., Pritykin Y., Leslie C.S., Sun J.C. Epigenetic control of innate and adaptive immune memory. Nat. Immunol. 2018;19:963–972. doi: 10.1038/s41590-018-0176-1. [DOI] [PMC free article] [PubMed] [Google Scholar]
- 21.Meda F., Folci M., Baccarelli A., Selmi C. The epigenetics of autoimmunity. Cell. Mol. Immunol. 2011;8:226–236. doi: 10.1038/cmi.2010.78. [DOI] [PMC free article] [PubMed] [Google Scholar]
- 22.Roadmap Epigenomics Consortium. Kundaje A., Meuleman W., Ernst J., Bilenky M., Yen A., Heravi-Moussavi A., Kheradpour P., Zhang Z., Wang J., et al. Integrative analysis of 111 reference human epigenomes. Nature. 2015;518:317–330. doi: 10.1038/nature14248. [DOI] [PMC free article] [PubMed] [Google Scholar]
- 23.Thomas P.D., Campbell M.J., Kejariwal A., Mi H., Karlak B., Daverman R., Diemer K., Muruganujan A., Narechania A. PANTHER: a library of protein families and subfamilies indexed by function. Genome Res. 2003;13:2129–2141. doi: 10.1101/gr.772403. [DOI] [PMC free article] [PubMed] [Google Scholar]
- 24.Bulik-Sullivan B.K., Loh P.-R., Finucane H.K., Ripke S., Yang J., Schizophrenia Working Group of the Psychiatric Genomics Consortium. Patterson N., Daly M.J., Price A.L., Neale B.M., et al. LD Score regression distinguishes confounding from polygenicity in genome-wide association studies. Nat. Genet. 2015;47:291–295. doi: 10.1038/ng.3211. [DOI] [PMC free article] [PubMed] [Google Scholar]
- 25.Finucane H.K., Bulik-Sullivan B., Gusev A., Trynka G., Reshef Y., Loh P.-R., Anttila V., Xu H., Zang C., Farh K., et al. Partitioning heritability by functional annotation using genome-wide association summary statistics. Nat. Genet. 2015;47:1228–1235. doi: 10.1038/ng.3404. [DOI] [PMC free article] [PubMed] [Google Scholar]
- 26.Gazal S., Finucane H.K., Furlotte N.A., Loh P.-R., Palamara P.F., Liu X., Schoech A., Bulik-Sullivan B., Neale B.M., Gusev A., Price A.L. Linkage disequilibrium-dependent architecture of human complex traits shows action of negative selection. Nat. Genet. 2017;49:1421–1427. doi: 10.1038/ng.3954. [DOI] [PMC free article] [PubMed] [Google Scholar]
- 27.Shi H., Gazal S., Kanai M., Koch E.M., Schoech A.P., Siewert K.M., Kim S.S., Luo Y., Amariuta T., Huang H., et al. Nat. Commun. 2021;12:1–15. doi: 10.1038/s41467-021-21286-1. [DOI] [PMC free article] [PubMed] [Google Scholar]
- 28.Ernst J., Kellis M. ChromHMM: automating chromatin-state discovery and characterization. Nat. Methods. 2012;9:215–216. doi: 10.1038/nmeth.1906. [DOI] [PMC free article] [PubMed] [Google Scholar]
- 29.Newman A.M., Liu C.L., Green M.R., Gentles A.J., Feng W., Xu Y., Hoang C.D., Diehn M., Alizadeh A.A. Robust enumeration of cell subsets from tissue expression profiles. Nat. Methods. 2015;12:453–457. doi: 10.1038/nmeth.3337. [DOI] [PMC free article] [PubMed] [Google Scholar]
- 30.Chen D.S., Mellman I. Oncology meets immunology: the cancer-immunity cycle. Immunity. 2013;39:1–10. doi: 10.1016/j.immuni.2013.07.012. [DOI] [PubMed] [Google Scholar]
- 31.Seal R.L., Braschi B., Gray K., Jones T.E.M., Tweedie S., Haim-Vilmovsky L. Bruford E.A.Genenames.org: the HGNC resources in 2023. Nucleic Acids Res. 2023:D1003–D1009. doi: 10.1093/nar/gkac888. [DOI] [PMC free article] [PubMed] [Google Scholar]
- 32.Wu G.-C., Pan H.-F., Leng R.-X., Wang D.-G., Li X.-P., Li X.-M., Ye D.-Q. Emerging role of long noncoding RNAs in autoimmune diseases. Autoimmun. Rev. 2015;14:798–805. doi: 10.1016/j.autrev.2015.05.004. [DOI] [PubMed] [Google Scholar]
- 33.Peltier D., Radosevich M., Ravikumar V., Pitchiaya S., Decoville T., Wood S.C., Hou G., Zajac C., Oravecz-Wilson K., Sokol D., et al. RNA-seq of human T cells after hematopoietic stem cell transplantation identifies Linc00402 as a regulator of T cell alloimmunity. Sci. Transl. Med. 2021;13 doi: 10.1126/scitranslmed.aaz0316. [DOI] [PMC free article] [PubMed] [Google Scholar]
- 34.Stelzer G., Rosen N., Plaschkes I., Zimmerman S., Twik M., Fishilevich S., Stein T.I., Nudel R., Lieder I., Mazor Y., et al. The GeneCards Suite: From Gene Data Mining to Disease Genome Sequence Analyses. Curr. Protoc. Bioinformatics. 2016;54:1–30. doi: 10.1002/cpbi.5. [DOI] [PubMed] [Google Scholar]
- 35.Alberts B., Johnson A., Lewis J., Raff M., Roberts K. Walter P. Molecular biology of the cell. 4th edn. 2002. [Google Scholar]
- 36.Kanamori-Katayama M., Itoh M., Kawaji H., Lassmann T., Katayama S., Kojima M., Bertin N., Kaiho A., Ninomiya N., Daub C.O., et al. Unamplified cap analysis of gene expression on a single-molecule sequencer. Genome Res. 2011;21:1150–1159. doi: 10.1101/gr.115469.110. [DOI] [PMC free article] [PubMed] [Google Scholar]
- 37.Lizio M., Harshbarger J., Shimoji H., Severin J., Kasukawa T., Sahin S., Abugessaisa I., Fukuda S., Hori F., Ishikawa-Kato S., et al. Genome Biol. 2015;16:1–14. doi: 10.1186/s13059-014-0560-6. [DOI] [PMC free article] [PubMed] [Google Scholar]
- 38.Bestor T.H. The DNA methyltransferases of mammals. Hum. Mol. Genet. 2000;9:2395–2402. doi: 10.1093/hmg/9.16.2395. [DOI] [PubMed] [Google Scholar]
- 39.Scott A., Song J., Ewing R., Wang Z. Regulation of protein stability of DNA methyltransferase 1 by post-translational modifications. Acta Biochim. Biophys. Sin. 2014;46:199–203. doi: 10.1093/abbs/gmt146. [DOI] [PMC free article] [PubMed] [Google Scholar]
- 40.Gazal S., Marquez-Luna C., Finucane H.K., Price A.L. Reconciling S-LDSC and LDAK functional enrichment estimates. Nat. Genet. 2019;51:1202–1204. doi: 10.1038/s41588-019-0464-1. [DOI] [PMC free article] [PubMed] [Google Scholar]
- 41.Dey K.K., Van de Geijn B., Kim S.S., Hormozdiari F., Kelley D.R., Price A.L. Nat. Commun. 2020;11:1–9. doi: 10.1038/s41467-020-18515-4. [DOI] [PMC free article] [PubMed] [Google Scholar]
- 42.Cao Z., Huang Y., Duan R., Jin P., Qin Z.S., Zhang S. Disease category-specific annotation of variants using an ensemble learning framework. Briefings Bioinf. 2022;23:bbab438. doi: 10.1093/bib/bbab438. [DOI] [PubMed] [Google Scholar]
- 43.Chen L., Jin P., Qin Z.S. DIVAN accurate identification of non-coding disease-specific risk variants using multi-omics profiles. Genome Biol. 2016;17:1–21. doi: 10.1186/s13059-016-1112-z. [DOI] [PMC free article] [PubMed] [Google Scholar]
- 44.Chen L., Qin Z.S. traseR: an R package for performing trait-associated SNP enrichment analysis in genomic intervals. Bioinformatics. 2016;32:1214–1216. doi: 10.1093/bioinformatics/btv741. [DOI] [PMC free article] [PubMed] [Google Scholar]
- 45.Caslin B., Mohler K., Thiagarajan S., Melamed E. Alcohol as friend or foe in autoimmune diseases: a role for gut microbiome? Gut Microb. 2021;13:1916278. doi: 10.1080/19490976.2021.1916278. [DOI] [PMC free article] [PubMed] [Google Scholar]
- 46.Tangye S.G., Al-Herz W., Bousfiha A., Cunningham-Rundles C., Franco J.L., Holland S.M., Klein C., Morio T., Oksenhendler E., Picard C., et al. J. Clin. Immunol. 2022;42:1–35. doi: 10.1007/s10875-022-01289-3. [DOI] [PMC free article] [PubMed] [Google Scholar]
- 47.Alipanahi B., Delong A., Weirauch M.T., Frey B.J. Predicting the sequence specificities of DNA- and RNA-binding proteins by deep learning. Nat. Biotechnol. 2015;33:831–838. doi: 10.1038/nbt.3300. [DOI] [PubMed] [Google Scholar]
- 48.Zhou J., Troyanskaya O.G. Predicting effects of noncoding variants with deep learning-based sequence model. Nat. Methods. 2015;12:931–934. doi: 10.1038/nmeth.3547. [DOI] [PMC free article] [PubMed] [Google Scholar]
- 49.Zhou J., Theesfeld C.L., Yao K., Chen K.M., Wong A.K., Troyanskaya O.G. Deep learning sequence-based ab initio prediction of variant effects on expression and disease risk. Nat. Genet. 2018;50:1171–1179. doi: 10.1038/s41588-018-0160-6. [DOI] [PMC free article] [PubMed] [Google Scholar]
- 50.Kelley D.R., Reshef Y.A., Bileschi M., Belanger D., McLean C.Y., Snoek J. Sequential regulatory activity prediction across chromosomes with convolutional neural networks. Genome Res. 2018;28:739–750. doi: 10.1101/gr.227819.117. [DOI] [PMC free article] [PubMed] [Google Scholar]
- 51.Shultz A.J., Sackton T.B. Immune genes are hotspots of shared positive selection across birds and mammals. Elife. 2019;8 doi: 10.7554/eLife.41815. [DOI] [PMC free article] [PubMed] [Google Scholar]
- 52.Amariuta T., Ishigaki K., Sugishita H., Ohta T., Koido M., Dey K.K., Matsuda K., Murakami Y., Price A.L., Kawakami E., et al. Improving the trans-ancestry portability of polygenic risk scores by prioritizing variants in predicted cell-type-specific regulatory elements. Nat. Genet. 2020;52:1346–1354. doi: 10.1038/s41588-020-00740-8. [DOI] [PMC free article] [PubMed] [Google Scholar]
- 53.Atianand M.K., Caffrey D.R., Fitzgerald K.A. Immunobiology of Long Noncoding RNAs. Annu. Rev. Immunol. 2017;35:177–198. doi: 10.1146/annurev-immunol-041015-055459. [DOI] [PMC free article] [PubMed] [Google Scholar]
- 54.Gnyszka A., JASTRZEBSKI Z., Flis S. DNA methyltransferase inhibitors and their emerging role in epigenetic therapy of cancer. Anticancer Res. 2013;33:2989–2996. [PubMed] [Google Scholar]
- 55.Wang Y., Lin W., Brown J.E., Chen L., Pandak W.M., Hylemon P.B., Ren S. 25-Hydroxycholesterol 3-sulfate is an endogenous ligand of DNA methyltransferases in hepatocytes. J. Lipid Res. 2021;62:100063. doi: 10.1016/j.jlr.2021.100063. [DOI] [PMC free article] [PubMed] [Google Scholar]
- 56.Gordon R. 2020. https://clinicaltrials.gov/ct2/show/study/NCT04563026
- 57.Choi C., Finlay D.K. Diverse Immunoregulatory Roles of Oxysterols-The Oxidized Cholesterol Metabolites. Metabolites. 2020;10:384. doi: 10.3390/metabo10100384. [DOI] [PMC free article] [PubMed] [Google Scholar]
- 58.Reinmuth L., Hsiao C.-C., Hamann J., Rosenkilde M., Mackrill J. Multiple Targets for Oxysterols in Their Regulation of the Immune System. Cells. 2021;10:2078. doi: 10.3390/cells10082078. [DOI] [PMC free article] [PubMed] [Google Scholar]
- 59.Lieberman-Aiden E., Van Berkum N.L., Williams L., Imakaev M., Ragoczy T., Telling A., Amit I., Lajoie B.R., Sabo P.J., Dorschner M.O., et al. Comprehensive mapping of long-range interactions reveals folding principles of the human genome. Science. 2009;326:289–293. doi: 10.1126/science.1181369. [DOI] [PMC free article] [PubMed] [Google Scholar]
- 60.Boyle A.P., Davis S., Shulha H.P., Meltzer P., Margulies E.H., Weng Z., Furey T.S., Crawford G.E. High-resolution mapping and characterization of open chromatin across the genome. Cell. 2008;132:311–322. doi: 10.1016/j.cell.2007.12.014. [DOI] [PMC free article] [PubMed] [Google Scholar]
- 61.Boix C.A., James B.T., Park Y.P., Meuleman W., Kellis M. Regulatory genomic circuitry of human disease loci by integrative epigenomics. Nature. 2021;590:300–307. doi: 10.1038/s41586-020-03145-z. [DOI] [PMC free article] [PubMed] [Google Scholar]
- 62.Virtanen P., Gommers R., Oliphant T.E., Haberland M., Reddy T., Cournapeau D., Burovski E., Peterson P., Weckesser W., Bright J., et al. SciPy 1.0: fundamental algorithms for scientific computing in Python. Nat. Methods. 2020;17:261–272. doi: 10.1038/s41592-019-0686-2. [DOI] [PMC free article] [PubMed] [Google Scholar]
- 63.Hunter J.D. Matplotlib: A 2D Graphics Environment. Comput. Sci. Eng. 2007;9:90–95. [Google Scholar]
- 64.Oliphant T.E. Vol. 1. Trelgol Publishing USA; 2006. A Guide to NumPy. [Google Scholar]
- 65.Van Der Walt S., Colbert S.C., Varoquaux G. The NumPy Array: A Structure for Efficient Numerical Computation. Comput. Sci. Eng. 2011;13:22–30. [Google Scholar]
- 66.The pandas development team . Pandas; 2020. Pandas-Dev/Pandas. [Google Scholar]
- 67.McKinney W. Proceedings of the 9th Python in Science Conference. Stéfan van der Walt & Jarrod Millman; 2010. pp. 56–61. [Google Scholar]
- 68.Chollet F. 2015. https://github.com/fchollet/keras
- 69.Abadi M., Agarwal A., Barham P., Brevdo E., Chen Z., Citro C., Corrado G.S., Davis A., Dean J., Devin M., et al. 2015. Software Available from tensorflow.Org. [Google Scholar]
- 70.Jaroszewicz A., Ernst J. ChromGene: gene-based modeling of epigenomic data. Genome Biol. 2023;24:203. doi: 10.1186/s13059-023-03041-5. [DOI] [PMC free article] [PubMed] [Google Scholar]
- 71.Clarivate Metacore; 2021.
- 72.Eisenberg E., Levanon E.Y. Human housekeeping genes, revisited. Trends Genet. 2013;29:569–574. doi: 10.1016/j.tig.2013.05.010. [DOI] [PubMed] [Google Scholar]
- 73.Riley R.D., Higgins J.P., Deeks J.J. Interpretation of random effects meta-analyses. Bmj. 2011;342 doi: 10.1136/bmj.d549. [DOI] [PubMed] [Google Scholar]
- 74.Gazal S., Weissbrod O., Hormozdiari F., Dey K.K., Nasser J., Jagadeesh K.A., Weiner D.J., Shi H., Fulco C.P., O’Connor L.J., et al. Combining SNP-to-gene linking strategies to identify disease genes and assess disease omnigenicity. Nat. Genet. 2022;54:827–836. doi: 10.1038/s41588-022-01087-y. [DOI] [PMC free article] [PubMed] [Google Scholar]
Associated Data
This section collects any data citations, data availability statements, or supplementary materials included in this article.
Supplementary Materials
Data Availability Statement
-
•
The data used to train the EpiNN model and the annotations produced by EpiNN can be downloaded at https://doi.org/10.5281/zenodo.10009211 or https://palamaralab.github.io/software/epinn_data/ and are publicly available as of the date of publication. The experimental DNMT1 data reported in this paper will be shared by the lead contact upon request.
-
•
All original code can be downloaded at https://doi.org/10.5281/zenodo.10009211 or https://palamaralab.github.io/software/epinn/ and is publicly available as of the date of publication. DOIs are listed in the key resources table.
-
•
Any additional information required to reanalyze the data reported in this paper is available from the lead contact upon request.
-
•
Additional data and code used in this work include: S-LDSC Baseline models https://alkesgroup.broadinstitute.org/LDSCORE/; S-LDSC software https://github.com/bulik/ldsc; The 63 independent traits used in S-LDSC analyses: https://zenodo.org/record/7796478/files/sumstats.tgz?download=1; The 176 traits used in S-LDSC analyses: https://alkesgroup.broadinstitute.org/; HUGO gene annotations https://genenames.org retrieved on 15-01-2020; FANTOM CAGE data https://fantom.gsc.riken.jp/5/datafiles/latest/basic/human.primary_cell.LQhCAGE/; Scipy62; Matplotlib63; NumPy64,65; Pandas66,67; Keras68; Tensorflow.69