

Abstract
INTRODUCTION
We examined associations between the Clinical Dementia Rating Scale (CDR) and function (Functional Assessment Scale [FAS]), neuropsychiatric symptoms (Neuropsychiatric Inventory Questionnaire [NPI‐Q]), and cognitive impairment in Alzheimer's disease (AD).
METHODS
We used data from the National Alzheimer's Coordinating Center Uniform Data Set and defined cognitively unimpaired and AD stages using CDR‐global.
RESULTS
Functional and neuropsychiatric symptoms occur as early as the mild cognitive impairment (MCI) phase. The adjusted lest square mean FAS (95% confidence interval [CI]) was lowest in cognitively unimpaired (3.88 [3.66, 4.11] to 5.01 [4.76, 5.26]) and higher with more advanced AD (MCI: 8.17 [6.92, 9.43] to 20.87 [19.53, 22.20]; mild: 18.54 [17.57, 19.50] to 28.13 [27.14, 29.12]; moderate: 26.01 [25.31, 26.70] to 29.42 [28.73, 30.10]). FAS and NPI‐Q scores increased steeply with MCI (NPI‐Q: 5.55 [4.89, 6.20] to 7.11 [6.43, 7.78]) and mild AD dementia (NPI‐Q: 6.66 [5.72, 7.60] to 8.32 [7.32, 9.33]).
DISCUSSION
CDR‐global staged AD by capturing differences in relevant outcomes along AD progression.
Highlights
There were strong associations among CDR and the various outcomes relevant to healthcare providers, patients, and their care givers, such as activities of daily living.
Overall, activities of daily living, neuropsychiatric symptoms, and cognitive function outcomes deteriorated over time and can be observed in early stages of AD (MCI or mild dementia).
Our findings directly inform the current understanding of AD progression and can aid in care planning and benefit assessments of early AD interventions to delay the progression of AD to more advanced stages.
Keywords: activities of daily living, Alzheimer's disease, clinical dementia rating scale, cognitive impairment, dementia
1. BACKGROUND
Alzheimer's disease (AD), the most common cause of dementia, is a neurodegenerative disease that affects memory, thinking, language, and other cognitive skills resulting in impaired ability to perform daily activities. 1 AD progresses along a continuum of three phases: preclinical disease, in which beta‐amyloid is abnormal while cognition is normal; followed by mild cognitive impairment (MCI), which can progress to clinically apparent dementia. 2 It represents a major public health problem, and is estimated to have impacted approximately 55 million people ≥65 years old worldwide in 2019—imposing major burden on families and the healthcare system. 3
Proper diagnosis of cognitive impairment and dementia is essential for clinical management, caregiver support, and clinical trial recruitment. The Clinical Dementia Rating Scale (CDR) 4 , 5 , 6 , 7 is widely used to stage AD in research settings 8 and is used as the primary outcome measure in early‐stage AD (MCI due to AD and mild AD dementia) clinical trials; however, it is not used in clinical settings.
The CDR staging of AD has been linked to biological progression of AD, 8 more severe neuropsychiatric symptoms, 9 , 10 , 11 , 12 and reduced abilities of daily living (ADLs) and physical functioning. 13 , 14 However, there is a paucity of longitudinal studies describing the association between change over time in CDR scores and changes in relevant outcomes, such as ADLs, neuropsychiatric symptoms, and cognitive function. Information on the clinical significance of outcome measures is critical in evaluating clinical trials—and of paramount importance to the patients, care partners, clinicians, regulators, and payers. 15 Additionally, evidence is limited regarding whether the CDR can be translated into outcomes that are important to patients, care partners, clinicians, and payers, and if it is a good proxy for measuring differences in other clinical outcomes. As CDR‐global is primarily used as a research instrument, quantifying its relationship to other tools (e.g., tools that measure ADLs or psychiatric symptoms) can contextualize the CDR scores and transitions to more advanced severity.
This study examined the associations of AD staging (classified by CDR‐global scores) with cognition, function, and neuropsychiatric symptoms. Measures included ADLs measured by the National Alzheimer's Coordinating Center Functional Assessment Scale (NACC‐FAS), depression quantified by the Geriatric Depression Scale (GDS), behavioral changes assessed with the Neuropsychiatric Inventory Questionnaire (NPI‐Q), and cognition as primarily measured by the Mini‐Mental State Exam (MMSE), and the Montreal Cognitive Assessment (MoCA). For cognition, the results from neuropsychological tools, for example, processing speed, visuospatial ability, and category fluency tests, were also explored.
2. METHODS
2.1. Data source
Data originated from the NACC Uniform Data Set (UDS). The NACC was established in 1999 by the National Institute on Aging (NIA) to facilitate collaborative research at 40 NIA Alzheimer's Disease Research Centers (ADRCs) across the United States. 16 , 17 Study participants were generally recruited from ADRC‐affiliated university medical centers, with some additional community‐based recruitment. In each subject's annual UDS visit, 16 data collection forms were completed by the clinicians, covering such topics as subject demographic characteristics, neurological examination findings, and diagnoses. The specific outcomes presented here were collected at the participant visits.
2.2. Study design
This observational study included participants ≥18 years old who were cognitively unimpaired, diagnosed with MCI due to AD (AD as the likely etiology), or dementia due to AD of any severity, based on clinical and CDR‐global criteria. We excluded participants who were clinically diagnosed with MCI or dementia due to causes other than AD. To minimize misclassification of AD stages, those with extreme inconsistencies between CDR‐based staging of AD (based on CDR global score) and clinical staging were also excluded. Extreme inconsistency was defined as two levels of difference in the two staging methods. For example, those whose CDR‐global scores were at least one indicating AD dementia but were diagnosed as cognitively unimpaired as well as those whose CDR‐global scores were 0 (indicating cognitively unimpaired) but were diagnosed with AD dementia. The final analytical sample consisted of 28,220 participants, with an annual follow‐up of up to 5 years (visit 6) from initial enrollment (visit 1). CDR‐global scores were classified into normal (unimpaired) cognition (CDR‐global = 0), MCI due to AD (CDR‐global = 0.5), mild (CDR‐global = 1), moderate (CDR‐global = 2), and severe AD dementia (CDR‐global = 3).
2.3. Outcomes
The outcomes in this study were identified as important to patients, care partners, clinicians, and payers; 15 , 18 these included ADLs, depression, NPI‐Q, and cognitive status. ADLs were measured using the NACC‐FAS, a 10‐item scale evaluating functional activities. 19 The total score is the sum of 10 items and scores range from 0 to 30; higher scores represent more dependency. The GDS is a questionnaire completed by clinicians based on the subject's response, with total scores ranging from 0 to 15; higher scores indicate more answers consistent with depression. Neuropsychiatric symptoms are measured by NPI‐Q, which is a caregiver interview designed to provide a brief assessment of 12 neuropsychiatric symptoms. The total score is the sum of all 12 items, and ranges from 0 to 36; higher scores indicate more severity. Cognitive performance was measured using the MMSE and MoCA. The MMSE was used to measure cognitive performance with 11 questions in the domains of orientation, registration, attention and calculation, recall, and language and a total score ranging from 0 to 30. MoCA consists of 11 tests (e.g., memory, orientation, trail making, visuoconstructional skills) with a total score ranging from 0 to 30. Lower MMSE and MoCA scores indicate more cognitive impairment. The results from neuropsychological tools, for example, processing speed, visuospatial ability, and category fluency tests were also explored.
2.4. Statistical analyses
Descriptive statistics (mean, standard deviation [SD], proportion) were computed to characterize sociodemographic (i.e., age, sex, race/ethnicity, education, level of financial independence, and primary type of residence), comorbidities, and selected outcomes (i.e., NACC‐FAS, GDS, NPI‐Q scores, MMSE, and MoCA) at initial visit stratified by CDR stage.
To examine the relationships between CDR stage and the clinical outcomes, we used linear mixed models with random intercepts in combination with unstructured covariance matrices, which were stratified by initial AD stage. The models included visit number as a categorical variable, and are adjusted for patient characteristics (i.e., age, gender, race/ethnicity, education, primary type of residence) and clinical characteristics (i.e., cardiovascular disease, cerebrovascular disease, depression, and anxiety). Adjusted least square means and 95% confidence intervals (CIs) for each outcome were calculated using estimates derived from the linear mixed models.
RESEARCH IN CONTEXT
Systematic review: The Clinical Dementia Rating Scale (CDR) is widely used to stage Alzheimer's disease (AD) in research settings and is used as the primary outcome measure in early‐stage AD (mild cognitive impairment [MCI] due to AD and mild AD dementia) clinical trials; however, it is not used in clinical practice. There are limited longitudinal studies describing the association between change over time in CDR scores and changes in relevant outcomes, such as activities of daily living, neuropsychiatric symptoms, and cognitive function.
Interpretation: Participants with later stages of AD (measured by CDR) had worse outcomes when assessed by activities of daily living, cognitive function, and neuropsychiatric symptoms scores. This is consistent with the current knowledge of CDR and AD's clinical presentations.
Future directions: Understanding AD progression can aid in care planning and early AD interventions to delay the progression of AD to more advanced stages.
3. RESULTS
3.1. Sociodemographic and clinical characteristics at initial visit
A total of 39,098 persons met the initial inclusion criteria, of those 10,878 were excluded due to disease etiology not AD (n = 9228 [23.6%]), disease etiology not known/not specified (n = 1595 [4.1%]), or a high discrepancy between clinical diagnosis and CDR global staging (n = 55 [0.1%]). Therefore, 28,220 participants were included in the study: 13,692 (48.5%) were cognitively unimpaired; 7075 (25.1%) had MCI due to AD; and 4905 (17.4%), 1706 (6%), and 842 (3%) had mild, moderate, and severe AD dementia, respectively (Table 1). Table 1 shows the characteristics of the study population at inclusion in the study. These participants were mostly females (59.6%), white individuals (76.0%), and many held Master's or Doctorate degrees (33.5%). The proportion of participants with advanced degrees was lower in those with severe AD dementia than those in lower stages. Participants who were cognitively unimpaired were the youngest and mean age increased with AD stages. Additionally, the proportion of participants who were completely dependent increased from 0.09% in the cognitively unimpaired group to 0.3%, 1.7%, 17.1%, and 71.4% among those with MCI due to AD, mild, moderate, and severe AD dementia, respectively. The proportion of participants who were living independently (do not require assistance with daily activities) dropped from 98.1% among participants with unimpaired cognition to 58%, 15.2%, 2.3% and 0.4% among those with MCI, mild, moderate, and severe AD dementia, respectively. More than half of the participants with mild AD dementia (59%) required assistance with complex activities.
TABLE 1.
Baseline characteristics of participants included in the study stratified by CDR stage at initial visit
| Variables, n (%) | Cognitively unimpaired (N = 13,692) | MCI due to AD (N = 7075) | Mild AD dementia (N = 4905) | Moderate AD dementia (N = 1706) | Severe AD dementia (N = 842) |
|---|---|---|---|---|---|
| Sociodemographic characteristics | |||||
| Age (year) | |||||
| No. of non‐missing observations, n (%) | 13,692 (100.0) | 7075 (100.0) | 4905 (100.0) | 1706 (100.0) | 842 (100.0) |
| Mean (SD) | 69.3 (10.8) | 73.0 (8.9) | 74.0 (10.1) | 75.7 (10.6) | 76.3 (11.1) |
| Sex | |||||
| Male | 4716 (34.4) | 3471 (49.1) | 2207 (45.0) | 663 (38.9) | 340 (40.4) |
| Female | 8976 (65.6) | 3604 (50.9) | 2698 (55.0) | 1043 (61.1) | 502 (59.6) |
| Race/ethnicity | |||||
| White | 10,382 (75.8) | 5574 (78.8) | 3722 (75.9) | 1134 (66.5) | 608 (72.2) |
| Black/African American | 1880 (13.7) | 738 (10.4) | 497 (10.1) | 258 (15.1) | 82 (9.7) |
| Hispanic | 964 (7.0) | 503 (7.1) | 510 (10.4) | 254 (14.9) | 136 (16.2) |
| Asian | 354 (2.6) | 174 (2.5) | 108 (2.2) | 39 (2.3) | 10 (1.2) |
| Other (with American Indian or Alaska Native, and Native Hawaiian or other Pacific Islander) | 97 (0.7) | 73 (1.0) | 56 (1.1) | 18 (1.1) | 5 (0.6) |
| Unknown | 15 (0.1) | 13 (0.2) | 12 (0.2) | 3 (0.2) | 1 (0.1) |
| Level of education | |||||
| Less than high school | 506 (3.7) | 485 (6.9) | 623 (12.7) | 335 (19.6) | 161 (19.1) |
| High school or GED | 1737 (12.7) | 1404 (19.8) | 1210 (24.7) | 441 (25.8) | 206 (24.5) |
| Some college | 2544 (18.6) | 1202 (17.0) | 826 (16.8) | 283 (16.6) | 120 (14.3) |
| Bachelor's degree | 3360 (24.5) | 1646 (23.3) | 1020 (20.8) | 293 (17.2) | 177 (21.0) |
| Master's degree or Doctorate | 5461 (39.9) | 2297 (32.5) | 1183 (24.1) | 335 (19.6) | 157 (18.6) |
| Unknown | 84 (0.6) | 41 (0.6) | 43 (0.9) | 19 (1.1) | 21 (2.5) |
| Level of independence | |||||
| Able to live independently | 13,437 (98.1) | 4093 (57.9) | 745 (15.2) | 40 (2.3) | 3 (0.4) |
| Requires some assistance with complex activities | 156 (1.1) | 2612 (36.9) | 2883 (58.8) | 438 (25.7) | 35 (4.2) |
| Requires some assistance with basic activities | 62 (0.5) | 278 (3.9) | 1130 (23.0) | 925 (54.2) | 198 (23.5) |
| Completely dependent | 12 (0.09) | 18 (0.3) | 83 (1.7) | 291 (17.1) | 601 (71.4) |
| Unknown | 25 (0.2) | 74 (1.0) | 64 (1.3) | 12 (0.7) | 5 (0.6) |
| Primary type of residence | |||||
| Single‐ or multi‐family private residence (apartment, condo, house) | 12,835 (93.7) | 6555 (92.7) | 4417 (90.1) | 1478 (86.6) | 497 (59.0) |
| Retirement community or independent group living | 594 (4.3) | 295 (4.2) | 201 (4.1) | 49 (2.9) | 7 (0.8) |
| Assisted living, adult family home, or boarding home | 42 (0.3) | 56 (0.8) | 168 (3.4) | 100 (5.9) | 78 (9.3) |
| Skilled nursing facility, nursing home, hospital, or hospice | 4 (0.03) | 7 (0.10) | 25 (0.5) | 46 (2.7) | 240 (28.5) |
| Other/unknown | 217 (1.6) | 162 (2.3) | 94 (1.9) | 33 (1.9) | 20 (2.4) |
| Clinical characteristics | |||||
| BMI (kg/m2) | |||||
| Underweight: Below 18.5 | 143 (1.0) | 102 (1.4) | 93 (1.9) | 38 (2.2) | 21 (2.5) |
| Healthy weight: 18.5–24.9 | 4433 (32.4) | 2562 (36.2) | 1740 (35.5) | 572 (33.5) | 236 (28.0) |
| Overweight: 25.0–29.9 | 4813 (35.2) | 2482 (35.1) | 1608 (32.8) | 508 (29.8) | 200 (23.8) |
| Obese: 30.0–100.0 | 3409 (24.9) | 1338 (18.9) | 810 (16.5) | 290 (17.0) | 75 (8.9) |
| Unknown | 832 (6.1) | 556 (7.9) | 629 (12.8) | 271 (15.9) | 275 (32.7) |
| Not available or skipped | 62 (0.5) | 35 (0.5) | 25 (0.5) | 27 (1.6) | 35 (4.2) |
| Comorbidities | |||||
| Cardiovascular disease a | 1991 (14.5) | 1259 (17.8) | 846 (17.2) | 299 (17.5) | 126 (15.0) |
| Stroke | 63 (0.5) | 54 (0.8) | 64 (1.3) | 26 (1.5) | 29 (3.4) |
| TIA | 118 (0.9) | 106 (1.5) | 89 (1.8) | 36 (2.1) | 14 (1.7) |
| Type 2 diabetes mellitus | 512 (3.7) | 279 (3.9) | 137 (2.8) | 41 (2.4) | 11 (1.3) |
| Depression | 1121 (8.2) | 1375 (19.4) | 1147 (23.4) | 344 (20.2) | 159 (18.9) |
| Anxiety | 1542 (11.3) | 2340 (33.1) | 2148 (43.8) | 822 (48.2) | 333 (39.5) |
Note: Cell entries show number (%), unless otherwise specified.
Abbreviations: AD, Alzheimer's disease; BMI, body mass index; GED, General Education Development; MCI, mild cognitive impairment; SD, standard deviation; TIA, transient ischemic attack.
Cardiovascular disease included heart attack/cardiac arrest, atrial fibrillation, angioplasty, cardiac bypass procedure, pacemaker/defibrillator, congestive heart failure, angina, or heart valve replacement.
The prevalence of stroke was higher in participants with AD—and increased with advanced AD stages—compared with participants who were cognitively unimpaired. Similarly, cardiovascular diseases, anxiety, and depression were more prevalent in AD participants compared with those who were cognitively unimpaired; these were highest among mild and moderate AD dementia participants.
3.2. Measures on outcomes of interest at initial visit by stage
The mean (SD) total NACC‐FAS score was 0.2 (1.2) in the cognitively unimpaired group compared with 5.8 (5.9) for participants with MCI due to AD; and 17.9 (6.3), 26.0 (3.9), and 29.4 (1.8) for participants with mild, moderate, and severe AD dementia, respectively (Table 2). Figure 1 shows participants’ responses to each ADL item. The impact of cognitive impairment on ADLs started as early as MCI due to AD. For example, 0.4% of cognitively unimpaired participants were dependent on others when traveling out of the neighborhood, driving, or arranging to take public transportation compared with 8.0%, 47.4%, 85.5%, and 94.9% of participants with MCI due to AD, mild, moderate, and severe AD dementia, respectively. Similar responses were observed for other ADLs (Figure 1 and Appendix 1).
TABLE 2.
Unadjusted scores of selected meaningful outcomes at initial visit stratified by CDR stage
| Cognitive status | |||||
|---|---|---|---|---|---|
| Outcomes | Cognitively unimpaired (N = 13,692) | MCI due to AD (N = 7075) | Mild AD dementia (N = 4905) | Moderate AD dementia (N = 1706) | Severe AD dementia (N = 842) |
| Higher score indicates worse outcomes | |||||
| Total NACC‐FAS (0–30) | |||||
| Mean (SD) | 0.2 (1.2) | 5.8 (5.9) | 17.9 (6.3) | 26.0 (3.9) | 29.4 (1.8) |
| Median (IQR) | 0 (0–0) | 4 (1–9) | 18 (14–23) | 27 (24–29) | 30 (30–30) |
| Total GDS (0–15) | |||||
| Mean (SD) | 1.3 (1.9) | 2.5 (2.5) | 2.7 (2.7) | 2.7 (2.8) | 3.0 (3.1) |
| Median (IQR) | 1 (0–2) | 2 (1–3) | 2 (1–4) | 2 (1–4) | 2 (1–5) |
| Total NPI‐Q (0–36) | |||||
| Mean (SD) | 0.7 (1.7) | 3.1 (3.5) | 5.2 (4.7) | 7.1 (5.6) | 7.9 (6.4) |
| Median (IQR) | 0 (0–1) | 2 (0–5) | 4 (2–8) | 6 (3–1) | 6 (3–11) |
| Lower score indicates worse outcomes | |||||
| Total MMSE (0–30) | |||||
| Mean (SD) | 28.9 (1.4) | 25.3 (3.5) | 20.6 (4.7) | 14.1 (5.6) | 5.2 (5.3) |
| Median (IQR) | 29 (28–30) | 26 (23–28) | 21 (18–24) | 14 (10–18) | 4 (0–9) |
| Total MoCA (0–30) | |||||
| Mean (SD) | 26.1 (2.9) | 20.3 (4.5) | 13.9 (5.3) | 7.6 (4.6) | 4.3 (3.8) |
| Median (IQR) | 27 (25–28) | 21 (18–23) | 14 (10–18) | 7 (4–11) | 4 (2–6) |
Abbreviations: AD, Alzheimer's disease; CDR, Clinical Dementia Rating Scale; GDS, Geriatric Depression Scale; IQR, interquartile range; MCI, mild cognitive impairment; MMSE, Mini‐Mental State Examination; MoCA, Montreal Cognitive Assessment; NACC‐FAS, National Alzheimer's Coordinating Center Functional Assessment Scale; NPI‐Q, Neuropsychiatric Symptoms Questionnaire; SD, standard deviation.
FIGURE 1.
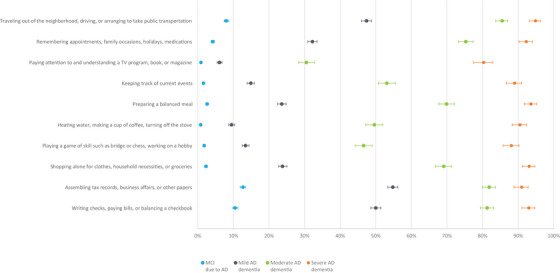
Percentage of participants who were “dependent” in each NACC‐FAS item at initial visit stratified by CDR stage. Figure 1 shows participants who responded being “dependent” in each ADL item measured by NACC‐FAS by AD stages at initial visit (i.e., MCI due to AD, mild, moderate, and severe AD dementia). The y axis shows each of the NACC‐FAS items. The x axis is the percent of participants who responded “dependent” to each of the item in the NACC‐FAS. Higher NACC‐FAS score indicates more impaired AD. AD, Alzheimer's disease; ADL, activities of daily living; CDR, Clinical Dementia Rating Scale; MCI, mild cognitive impairment; NACC‐FAS, National Alzheimer's Coordinating Center Functional Assessment Scale
The total NPI‐Q score was the lowest, with a mean (SD) of 0.7 (1.7) among participants who were cognitively unimpaired, compared with 3.1 (3.5), 5.2 (4.7), 7.1 (5.6), and 7.9 (6.4) among those with MCI due to AD, mild, moderate, and severe AD dementia, respectively (Table 2). The presence of neuropsychiatric symptoms was observed as early as MCI due to AD. For example, 0.3% of participants who were cognitively unimpaired reported severe anxiety, compared with 1.5%, 3.5%, 7.6%, and 7.5% of participants with MCI due to AD, mild, moderate, and severe AD dementia, respectively (Figure 2). Other symptoms (such as delusions) were observed in more advanced AD stage (Figure 2 and Appendix 2). Furthermore, higher GDS scores were observed with MCI due to AD or AD dementia, compared with those who were cognitively unimpaired (Table 2). The total MMSE and MoCA scores at initial visit were the highest among participants who were cognitively unimpaired and were lower for those with advanced AD severity (Table 2). Results of other neuropsychological tests are presented in Appendix 3.
FIGURE 2.
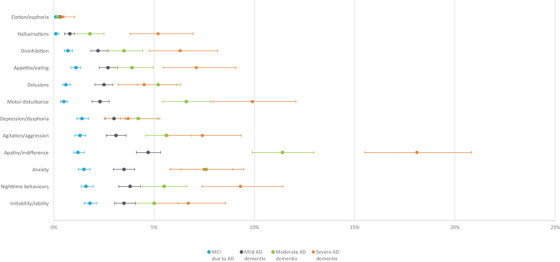
Percentage of participants who report having “severe” symptoms of each NPI‐Q item at initial visit stratified by CDR Stage. Figure 2 shows participants who responded having “severe” neuropsychiatric symptoms in each NPI‐Q item by AD stages at initial visit (i.e., MCI due to AD, mild, moderate, and severe AD dementia). The y axis shows each of the NPI‐Q items. The x axis is the percent of participants who responded “severe” to each of the item in the NPI‐Q. Higher NPI‐Q score indicates more impaired AD. AD, Alzheimer's disease; CDR, Clinical Dementia Rating Scale; MCI, mild cognitive impairment; NPI‐Q, Neuropsychiatric Symptoms Questionnaire
3.3. Trends of outcomes over time by stage
Longitudinal trends of outcomes by AD stages at initial visit are displayed in Figure 3. Overall, outcomes deteriorated over time, except for those who were cognitively unimpaired. NACC‐FAS scores increased steeply among participants diagnosed with MCI due to AD at initial visit (20.9 [95% CI 19.5, 22.2] at visit 6 [5 years from the initial visit] and 8.17 [95% CI 6.92, 9.43] at initial visit). Similarly, NPI‐Q scores had substantial changes from visit 1 to visit 6, with average scores increasing from 5.5 (95% CI 4.9, 6.2) to 7.1 (95% CI 6.4, 7.8), and from 6.7 (95% CI 5.7, 7.6) to 8.3 (95% CI 7.3, 9.3) among participants with MCI due to AD and mild AD dementia, respectively. In particular, the NACC‐FAS and NPI‐Q scores at visit 4 for participants with MCI due to AD were equivalent to those at initial visit among participants with mild AD dementia. By contrast, the GDS scores did not change during the follow‐up. MMSE and MoCA scores were consistently lower among participants with more advanced AD stages during the follow‐up.
FIGURE 3.
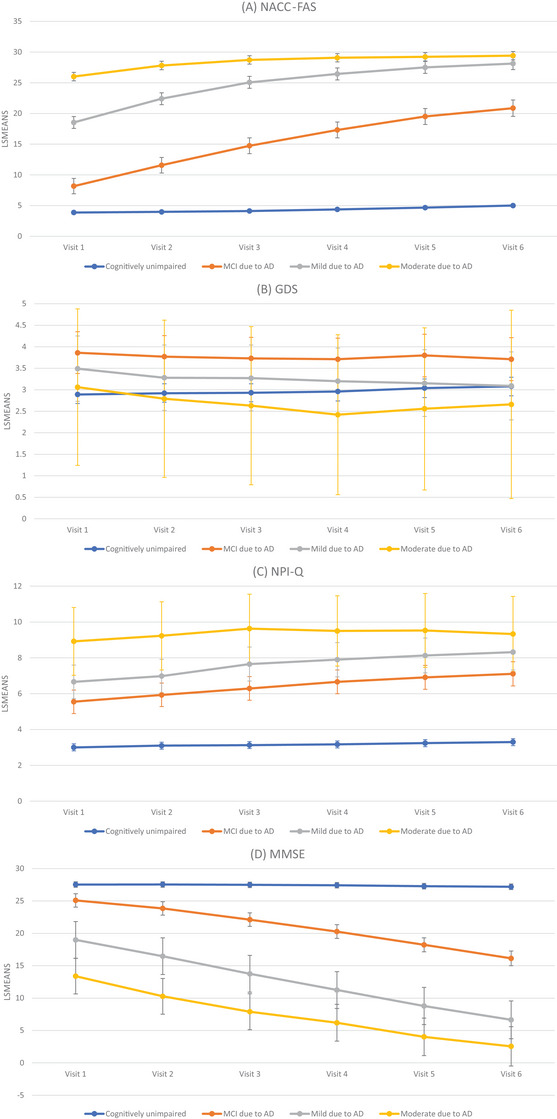
Adjusted mean scores of meaningful outcomes over time stratified by initial CDR stages. Note: The models were adjusted for age, race, sex, education, primary type of residence, and comorbidities (cardiovascular disease, cerebrovascular disease, diabetes, depression, and anxiety); results for severe AD dementia did not converge. Figure 3 shows adjusted mean scores of meaningful outcomes over time stratified by initial CDR stages. The x axis shows each of the visits from the initial visit (visit 1) to the fifth follow‐up (visit 6) for participants with cognitively unimpaired, MCI due to AD, mild AD dementia, and moderate AD dementia at the initial visit. The y axis is the average score of each meaningful outcome measured. Figures 3A–D present FAS, GDS, NPI‐Q, and MMSE, respectively. Higher FAS, GDS, and NPI‐Q and lower MMSE scores indicate more impaired AD. AD, Alzheimer's disease; CDR, Clinical Dementia Rating Scale; FAS, Functional Assessment Scale; GDS, Geriatric Depression Scale; MCI, mild cognitive impairment; MMSE, Mini‐Mental State Examination; NACC‐FAS, National Alzheimer's Coordinating Center; NPI‐Q, Neuropsychiatric Inventory Questionnaire
4. DISCUSSION
In this study, the NACC UDS sample was used to examine the associations among AD stages and clinically relevant outcomes including NACC‐FAS, GDS, NPI‐Q, MoCA, and MMSE scores. As anticipated, our analyses of the outcomes at each assessment revealed a significant association between more advanced AD stages and worse outcomes; these relationships have not been quantified previously for many of the outcomes used and the relationship of the outcomes in the same population have not previously been determined. The burden of illness was apparent at early stages of AD. This work directly informs the current understanding of symptoms along the disease continuum of AD health states, ranging from asymptomatic to MCI due to AD, mild, moderate, and severe AD dementia.
Our study found that only 58% of participants with MCI were able to live independently, and that 41% of participants reported requiring some assistance with complex or basic activities. Current evidence indicates mixed findings in terms of ADL dependency in individuals with MCI. One study reported that patients with MCI showed significantly more functional impairment relative to healthy controls in all functional domains. 20 Another study reported that participants with MCI were dependent on one or more instrumental ADL, and MCI was associated with significantly greater odds of dependence than those who were cognitively unimpaired on 7 of the 10 instrumental ADLs. 21 The standard clinical definition of MCI requires cognitive impairment that is out of proportion to that expected for their age in patients not meeting criteria for dementia or AD and without substantial ADL impairment, and are not cognitively impaired enough to require assistance with ADLs. 22 , 23 , 24 When patients meeting these criteria are assessed with standardized assessment, more evidence of ADL decline is documented.
There was a strong association between CDR stages and ADLs, as measured by the NACC‐FAS. We observed a significant increase in impact going from early to more advanced AD stages. Specifically, NACC‐FAS scores were higher in participants with MCI due to AD and more advanced AD severity compared with participants who were cognitively unimpaired. The increasing impairment in ability to perform ADLs is associated with an increasing economic and humanistic burden, such as increased costs of care as well as decreased patient's and care partner's quality of life. 25 , 26 Another study found that more decline in ADLs was related to greater caregiver burden, quality of life, and healthcare costs. 26
The observed associations between CDR stages and ADLs are in line with a recently published study that examined the association between CDR and ADLs in patients with AD living in nursing homes. 14 A study using the NACC database reported that the minimum clinically important difference (MCID) in FAS (specifically, a 3‐ to 5‐point increase between annual visits) indicated a meaningful decline in patient's ADL activities; MCID values were higher with more advanced AD severity. 13 Another study that examined the natural history of ADL decline reported that patients diagnosed with dementia experience impairment in their ADLs as early as 10 years prior to their initial dementia diagnosis. 27 The compromised ADLs included telephone use, transportation, managing medications, and managing finances, which were all prevalent at least 5 years prior to a dementia diagnosis. 27 Previous research suggested that patients with cognitive impairments in more than one domain had more difficulties in daily activities than those with impairment in a single domain, possibly due to the important relationship between cognition and function. 28
Neuropsychiatric symptoms (such as apathy, delusions, hallucinations, agitation, anxiety, and depression) are commonly associated with cognitive and functional decline in patients with AD. 29 Our findings suggest that these symptoms were observed in every stage and were more prevalent in those with greater AD severity. Such symptoms contribute to AD burden on patients and care partners. 30 Other studies have reported that experiencing such symptoms at the time of AD diagnosis is associated with more rapid disease progression 31 and higher likelihood of being institutionalized at the time of follow‐up. 32 Delusions and hallucinations, either independently or in combination, are associated with poor clinical outcomes. 33 In our study, we found that participants in all AD stages were more likely to report higher NPI‐Q scores than those who were cognitively unimpaired, which is indicative of worse neuropsychiatric symptoms.
As we expected, there was a clear association between more advanced AD stages and lower MMSE scores. This is consistent with a previous study that reported MMSE score ranges for patients with severe (0–10), moderate (11–20), and mild (21–25) AD dementia; as well as MCI (26–29) and normal cognition (30). 34 In the current study, the MMSE ranges tended to have lower bounds and greater range for each CDR stage. Total MoCA scores were significantly lower with more advanced AD severity over time. Our findings are consistent with other studies that reported an association between a clinical decline on the CDR scale and a significant deterioration in MoCA total scores. 35 The observations allow translation of CDR changes into expected ranges for MMSE and MoCA that are more familiar to practicing clinicians.
Caring for patients with AD is associated with greater burden for the care partner, including financial costs, social impact, health consequences, and negative quality of life for care partners; these increase as CDR stage increases. 36 , 37 , 38 , 39 , 40 , 41 , 42 , 43 In 2015, an estimated 40 million full time workers contributed to an estimated 85 billion hours of informal care to people with dementia living at home, which is equivalent to 2089 hours per year or 6 hours per day. This number is projected to increase to 65 million full time workers by 2030, and extends to family care partners’ increased risk for emotional distress, as well as negative mental and physical health outcomes. 44 Maintaining and improving outcomes for patients has an indirect benefit on care partners, while also improving quality of life and reduction in patients’ depressive symptoms and prolonging the time before institutionalization. With the data of this study, bridging the CDR data collected in trials to financial and care partner impact becomes more feasible.
Our study has several limitations. First, the study population may not be fully representative of the general AD population. The participating centers in the NACC database are mostly academic institutions, which recruited more affluent/highly educated patients than the general population. As such, this study included a high proportion of participants with advanced degrees (e.g., Master's or Doctorate), suggesting that participants in this study may have more resources than non‐participants with similar cognition, functioning, and neuropsychiatric symptoms. Additionally, patients with behavioral disturbances are less likely to cooperate with clinical exams or to return for scheduled follow‐up visits. Therefore, the available NPI‐Q scores likely under‐represent the true magnitude of behavioral changes in AD. People of racial/ethnic minorities are under‐represented in the study sample. Future studies are warranted to confirm our findings in other study populations. Moreover, each center enrolls its participants according to its own protocol, for example, clinician referral, self‐referral by participants or family members, and active recruitment in community organizations. Most centers enroll volunteers who were cognitively unimpaired and with higher education levels. Although each center has its own research focus and recruitment protocol, the centers are required to enroll their entire clinic of patients who provided informed consent in the UDS study and submit these data to NACC for quality assurance. There are inherent limitations in the scales used to measure the outcomes of interest. The patient diagnosis was based on clinical criteria without biomarker confirmation and some patients diagnosed with AD are likely to not have biologically defined AD. Patients with AD were included based on their etiology and diagnosis at the initial visit. Change of disease etiologies over time was not accounted for. Visit variable was used as a categorical variable in the models. Although follow‐up visits of participants can vary in interval, categorical variable is needed to calculate the least square means of the outcomes and to avoid forcing linear relationship with the outcomes.
The strengths of this study include the use of a large sample of patients with cognitive impairment due to AD in the United States. The NACC database is large and provides longitudinally collected data containing many clinically relevant outcomes, assessed through well‐established and validated instruments. The outcomes assessed were measured repeatedly over time, which provides a longitudinal picture of disease progression.
This study found clear relationships among CDR and many clinical outcomes (such as ADL, depression, neuropsychiatric symptoms, and cognition) using the NACC database. For most of the outcomes of interest examined, there was a relationship between more advanced AD stages and worse outcomes, starting from MCI‐AD stage. CDR global proved to be a good staging tool, capturing differences in a range of outcome measures along the clinical progression of AD.
5. CONCLUSION
Our findings directly inform the current understanding of AD progression and can aid in care planning and benefit assessments of AD interventions. The implementation of early intervention strategies or disease‐modifying therapies in these patient populations may confer substantial benefits by effectively delaying the progression of AD to more advanced stages.
CONFLICTS OF INTEREST STATEMENT
Author disclosures are available in the Supporting Information.
CONSENT STATEMENT
This study used a de‐identified secondary data source. Therefore, informed consent from human subjects was not necessary.
Supporting information
Supporting Information
Supporting Information
ACKNOWLEDGMENTS
The authors acknowledge Yuliya Halchenko of Evidera for providing statistical analysis support for the study and Ning (Nina) Ding of Evidera for preparation of this manuscript. This study was funded by Novo Nordisk Inc.
Lanctôt KL, Boada M, Tariot PN, et al. Association between clinical dementia rating and clinical outcomes in Alzheimer's disease. Alzheimer's Dement. 2024;16:e12522. 10.1002/dad2.12522
Lars Lau Raket was former employee of Novo Nordisk
REFERENCES
- 1. Alzheimer's Association . 2022 Alzheimer's disease facts and figures. Alzheimers Dement. 2022;18(4):700‐789. [DOI] [PubMed] [Google Scholar]
- 2. Dubois B, Feldman HH, Jacova C, et al. Revising the definition of Alzheimer's disease: a new lexicon. Lancet Neurol. 2010;9(11):1118‐1127. [DOI] [PubMed] [Google Scholar]
- 3. Gauthier SWC, Servaes S, Morais JA, Rosa‐Neto P. World Alzheimer Report 2022: Life After Diagnosis: Navigating Treatment, Care and Support. Alzheimer's Disease International; 2022. [Google Scholar]
- 4. ClinicalTrials.gov . A Research Study Investigating Semaglutide in People with Early Alzheimer's Disease (EVOKE). Published 2021. Accessed November 16, 2021. https://clinicaltrials.gov/study/NCT04777396
- 5. ClinicalTrials.gov . A Research Study Investigating Semaglutide in People With Early Alzheimer's Disease (EVOKE Plus). Published 2021. Accessed December 3, 2021. https://clinicaltrials.gov/ct2/show/NCT04777409
- 6. ClinicalTrials.gov . A Study to Evaluate the Safety and Efficacy of CT1812 in Early Alzheimer's Disease. Published 2022. Accessed September 15, 2022. https://clinicaltrials.gov/ct2/show/NCT05531656
- 7. ClinicalTrials.gov . A Study to Verify the Clinical Benefit of Aducanumab in Participants with Early Alzheimer's Disease (ENVISION). Published 2022. Accessed September 15, 2022. https://clinicaltrials.gov/ct2/show/NCT05310071
- 8. Yang YW, Hsu KC, Wei CY, Tzeng RC, Chiu PY. Operational determination of subjective cognitive decline, mild cognitive impairment, and dementia using sum of boxes of the clinical dementia rating scale. Front Aging Neurosci. 2021;13:705782. [DOI] [PMC free article] [PubMed] [Google Scholar]
- 9. Gilbert M, Snyder C, Corcoran C, Norton MC, Lyketsos CG, Tschanz JT. The association of traumatic brain injury with rate of progression of cognitive and functional impairment in a population‐based cohort of Alzheimer's disease: the cache county dementia progression study. Int Psychogeriatr. 2014;26(10):1593‐1601. [DOI] [PMC free article] [PubMed] [Google Scholar]
- 10. Barnes J, Bartlett JW, Wolk DA, van der Flier WM, Frost C. Disease course varies according to age and symptom length in Alzheimer's disease. J Alzheimers Dis. 2018;64(2):631‐642. [DOI] [PMC free article] [PubMed] [Google Scholar]
- 11. Helvik AS, Engedal K, Wu B, et al. Severity of neuropsychiatric symptoms in nursing home residents. Dement Geriatr Cogn Dis Extra. 2016;6(1):28‐42. [DOI] [PMC free article] [PubMed] [Google Scholar]
- 12. Suemoto CK, Ferretti‐Rebustini RE, Rodriguez RD, et al. Neuropathological diagnoses and clinical correlates in older adults in Brazil: a cross‐sectional study. PLoS Med. 2017;14(3):e1002267. [DOI] [PMC free article] [PubMed] [Google Scholar]
- 13. Andrews JS, Desai U, Kirson NY, Zichlin ML, Ball DE, Matthews BR. Disease severity and minimal clinically important differences in clinical outcome assessments for Alzheimer's disease clinical trials. Alzheimers Dement (N Y). 2019;5:354‐363. [DOI] [PMC free article] [PubMed] [Google Scholar]
- 14. Johansen RH, Olsen K, Bergh S, Benth JS, Selbaek G, Helvik AS. Course of activities of daily living in nursing home residents with dementia from admission to 36‐month follow‐up. BMC Geriatr. 2020;20(1):488. [DOI] [PMC free article] [PubMed] [Google Scholar]
- 15. Tochel C, Smith M, Baldwin H, et al. What outcomes are important to patients with mild cognitive impairment or Alzheimer's disease, their caregivers, and health‐care professionals? A systematic review. Alzheimers Dement (Amst). 2019;11:231‐247. [DOI] [PMC free article] [PubMed] [Google Scholar]
- 16. Beekly DL, Ramos EM, Lee WW, et al. The National Alzheimer's Coordinating Center (NACC) database: the uniform data set. Alzheimer Dis Assoc Disord. 2007;21(3):249‐258. [DOI] [PubMed] [Google Scholar]
- 17. Mock C, Teylan M, Beecham G, et al. The utility of the National Alzheimer's Coordinating Center's database for the rapid assessment of evolving neuropathologic conditions. Alzheimer Dis Assoc Disord. 2020;34(2):105‐111. [DOI] [PMC free article] [PubMed] [Google Scholar]
- 18. Rentz DM, Wessels AM, Annapragada AV, et al. Building clinically relevant outcomes across the Alzheimer's disease spectrum. Alzheimers Dement (N Y). 2021;7(1):e12181. [DOI] [PMC free article] [PubMed] [Google Scholar]
- 19. Pfeffer RI, Kurosaki TT, Harrah CH Jr, Chance JM, Filos S. Measurement of functional activities in older adults in the community. J Gerontol. 1982;37(3):323‐329. [DOI] [PubMed] [Google Scholar]
- 20. Farias ST, Mungas D, Reed BR, Harvey D, Cahn‐Weiner D, Decarli C. MCI is associated with deficits in everyday functioning. Alzheimer Dis Assoc Disord. 2006;20(4):217‐223. [DOI] [PMC free article] [PubMed] [Google Scholar]
- 21. Mansbach WE, Mace RA. Predicting functional dependence in mild cognitive impairment: differential contributions of memory and executive functions. The Gerontologist. 2018;59(5):925‐935. [DOI] [PubMed] [Google Scholar]
- 22. Grundman M, Petersen RC, Ferris SH, et al. Mild cognitive impairment can be distinguished from Alzheimer disease and normal aging for clinical trials. Arch Neurol. 2004;61(1):59‐66. [DOI] [PubMed] [Google Scholar]
- 23. Langa KM, Levine DA. The diagnosis and management of mild cognitive impairment: a clinical review. JAMA. 2014;312(23):2551‐2561. [DOI] [PMC free article] [PubMed] [Google Scholar]
- 24. Petersen RC, Smith GE, Waring SC, Ivnik RJ, Tangalos EG, Kokmen E. Mild cognitive impairment: clinical characterization and outcome. Arch Neurol. 1999;56(3):303‐308. [DOI] [PubMed] [Google Scholar]
- 25. Downer B, Al Snih S, Raji M, et al. Healthcare utilization of Mexican‐American Medicare beneficiaries with and without Alzheimer's disease and related dementias. PLoS One. 2020;15(1):e0227681. [DOI] [PMC free article] [PubMed] [Google Scholar]
- 26. Reed C, Belger M, Scott Andrews J, et al. Factors associated with long‐term impact on informal caregivers during Alzheimer's disease dementia progression: 36‐month results from GERAS. Int Psychogeriatr. 2020;32(2):267‐277. [DOI] [PubMed] [Google Scholar]
- 27. Pérès K, Helmer C, Amieva H, et al. Natural history of decline in instrumental activities of daily living performance over the 10 years preceding the clinical diagnosis of dementia: a prospective population‐based study. J Am Geriatr Soc. 2008;56(1):37‐44. [DOI] [PubMed] [Google Scholar]
- 28. Aretouli E, Brandt J. Everyday functioning in mild cognitive impairment and its relationship with executive cognition. Int J Geriatr Psychiatry. 2010;25(3):224‐233. [DOI] [PMC free article] [PubMed] [Google Scholar]
- 29. Kaufer DI, Cummings JL, Ketchel P, et al. Validation of the NPI‐Q, a brief clinical form of the Neuropsychiatric Inventory. J Neuropsychiatry Clin Neurosci. 2000;12(2):233‐239. [DOI] [PubMed] [Google Scholar]
- 30. Travis Seidl JN, Massman PJ. Cognitive and functional correlates of NPI‐Q scores and symptom clusters in mildly demented Alzheimer patients. Alzheimer Dis Assoc Disord. 2016;30(2):145‐151. [DOI] [PubMed] [Google Scholar]
- 31. Oh ES, Rosenberg PB, Rattinger GB, Stuart EA, Lyketsos CG, Leoutsakos JS. Psychotropic medication and cognitive, functional, and neuropsychiatric outcomes in Alzheimer's disease (AD). J Am Geriatr Soc. 2021;69(4):955‐963. [DOI] [PMC free article] [PubMed] [Google Scholar]
- 32. Brodaty H, Connors MH, Xu J, Woodward M, Ames D, group Ps. Predictors of institutionalization in dementia: a three year longitudinal study. J Alzheimers Dis. 2014;40(1):221‐226. [DOI] [PubMed] [Google Scholar]
- 33. Connors MH, Ames D, Woodward M, Brodaty H. Psychosis and clinical outcomes in Alzheimer disease: a longitudinal study. Am J Geriatr Psychiatry. 2018;26(3):304‐313. [DOI] [PubMed] [Google Scholar]
- 34. Perneczky R, Wagenpfeil S, Komossa K, Grimmer T, Diehl J, Kurz A. Mapping scores onto stages: mini‐mental state examination and clinical dementia rating. Am J Geriatr Psychiatry. 2006;14(2):139‐144. [DOI] [PubMed] [Google Scholar]
- 35. Costa AS, Reich A, Fimm B, Ketteler ST, Schulz JB, Reetz K. Evidence of the sensitivity of the MoCA alternate forms in monitoring cognitive change in early Alzheimer's disease. Dement Geriatr Cogn Disord. 2014;37(1‐2):95‐103. [DOI] [PubMed] [Google Scholar]
- 36. Beinart N, Weinman J, Wade D, Brady R. Caregiver burden and psychoeducational interventions in Alzheimer's disease: a review. Dement Geriatr Cogn Dis Extra. 2012;2(1):638‐648. [DOI] [PMC free article] [PubMed] [Google Scholar]
- 37. Bell CM, Araki SS, Neumann PJ. The association between caregiver burden and caregiver health‐related quality of life in Alzheimer disease. Alzheimer Dis Assoc Disord. 2001;15(3):129‐136. [DOI] [PubMed] [Google Scholar]
- 38. Bergvall N, Brinck P, Eek D, et al. Relative importance of patient disease indicators on informal care and caregiver burden in Alzheimer's disease. Int Psychogeriatr. 2011;23(1):73‐85. [DOI] [PubMed] [Google Scholar]
- 39. Conde‐Sala JL, Turro‐Garriga O, Calvo‐Perxas L, Vilalta‐Franch J, Lopez‐Pousa S, Garre‐Olmo J. Three‐year trajectories of caregiver burden in Alzheimer's disease. J Alzheimers Dis. 2014;42(2):623‐633. [DOI] [PubMed] [Google Scholar]
- 40. Fisher GG, Franks MM, Plassman BL, et al. Caring for individuals with dementia and cognitive impairment, not dementia: findings from the aging, demographics, and memory study. J Am Geriatr Soc. 2011;59(3):488‐494. [DOI] [PMC free article] [PubMed] [Google Scholar]
- 41. Pudelewicz A, Talarska D, Baczyk G. Burden of caregivers of patients with Alzheimer's disease. Scand J Caring Sci. 2019;33(2):336‐341. [DOI] [PubMed] [Google Scholar]
- 42. Richardson TJ, Lee SJ, Berg‐Weger M, Grossberg GT. Caregiver health: health of caregivers of Alzheimer's and other dementia patients. Curr Psychiatry Rep. 2013;15(7):367. [DOI] [PubMed] [Google Scholar]
- 43. Vellone E, Piras G, Talucci C, Cohen MZ. Quality of life for caregivers of people with Alzheimer's disease. J Adv Nurs. 2008;61(2):222‐231. [DOI] [PubMed] [Google Scholar]
- 44. Wimo A, Elmstahl S, Fratiglioni L, et al. Formal and informal care of community‐living older people: a population‐based study from the Swedish National study on aging and care. J Nutr Health Aging. 2017;21(1):17‐24. [DOI] [PubMed] [Google Scholar]
Associated Data
This section collects any data citations, data availability statements, or supplementary materials included in this article.
Supplementary Materials
Supporting Information
Supporting Information