

Abstract
Retinal cell death is the major cause of vision loss in many forms of blinding retinal disease. A plethora of research is focused on understanding the mechanisms of retinal cell death to identify potential neuroprotective strategies that prevent vision loss in these diseases. Traditionally, histological techniques have been used to determine the type and extent of cell death in the retina. These techniques, such as TUNEL labeling and immunohistochemistry, are laborious and time consuming, resulting in low throughput and variable results depending on the experimenter. To increase throughput and reduce variability, we developed several flow cytometry-based assays to detect and quantify retinal cell death. The methods and accompanying data presented demonstrate that flow cytometry can readily detect both retinal cell death and oxidative stress and importantly, the efficacy of neuroprotective agents. These methods will be of interest to investigators looking to increase throughput and efficiency without compromising sensitivity as the methods herein reduce analysis time from several months to less than a week. As such, the flow cytometry methods presented have the potential to expedite research efforts focused on developing novel strategies for retinal cell neuroprotection.
Keywords: Flow cytometry, retina, apoptosis, caspase, reactive oxygen species, retinal detachment
1. Introduction
Retinal cell death is the ultimate cause of vision loss in many forms of inherited or acquired retinal diseases. These diseases are varied and include retinitis pigmentosa, age-related macular degeneration, glaucoma, and retinal detachment. A dearth of successful treatment options to prevent retinal cell death currently exists, so there is an urgent unmet need for neuroprotective modalities that prevent loss of these cells. A tremendous amount of research is devoted to understanding retinal cell death mechanisms and various ways to prolong cell survival to prevent vision loss (Chinskey et al., 2014). Numerous cell death pathways have been found which contribute to retinal cell death, including apoptosis, necroptosis, ferroptosis, and parthanatos (Besirli et al., 2010; Chen et al., 2021; Dong et al., 2021; Murakami et al., 2011; Zacks et al., 2004), and multiple cell death pathways can be active simultaneously (Besirli et al., 2010; Chen et al., 2021; Dunaief et al., 2002; Lo et al., 2011; Newton and Megaw, 2020). In addition, oxidative stress is becoming more well recognized as a potent inducer of cell death in retinal disease, including diabetic retinopathy and age-related macular degeneration (Ruan et al., 2020; Zhao et al., 2021).
Detecting and quantifying markers of cell death pathways are critical for understanding the mechanisms of retinal cell death and assessing the effects of neuroprotective interventions. Traditionally, histology-based methods have been used to detect markers of retinal cell death, such as TUNEL, and/or oxidative damage in the retina using the immunohistochemistry-based markers 8-OHDG or 4-HNE (Besirli et al., 2010; Nag et al., 2017; Winkler, 1972; Wubben et al., 2017; Wubben et al., 2020). Histological methods for the detection and quantification of cell death markers pose challenging technical hurdles and require significant labor-intensive and time-consuming optimizations. Harvesting, fixing, sectioning, staining, and analyzing histological specimens can take weeks to months and intra-experimenter variation necessitates additional samples to be analyzed, further decreasing throughput of these traditional assays. Identifying methods that can more rapidly and reliably quantify these markers would drastically accelerate efforts to develop novel strategies for retinal cell neuroprotection. In addition to histological methods, early flow cytometric assays were developed to assess constitutive levels of apoptosis using TUNEL staining of murine retinal cell cultures (Carmody et al., 1998) as well as retinal detachment-induced apoptosis using Annexin-V-FITC/Propidium iodide staining (Tsoka and Tsilimbaris, 2010). While these assays were initially developed to circumvent the time-consuming histological methods described above, apoptosis was measured using only one methodology and one model of retinal cell death in each published study.
Here, we describe flow cytometric protocols for the detection and quantification of retinal cell stress and death in the mouse retina using multiple apoptosis and oxidative stress detection methodologies, multiple models of retinal cell death induction, and genetic and pharmacologic tools for retinal neuroprotection. We show that when mouse retinas are subjected to various, validated noxious stimuli, flow cytometry can robustly detect and quantify retinal cell death when applying 7 Amino Actinomycin D (7AAD), Annexin V, caspase antibodies, and TUNEL. These methods can also reliably detect and quantitate markers of oxidative stress, including CM-H2DFCDA, C11 BODIPY, and Calcein-AM. Importantly, we also provide evidence that flow cytometry has the ability to detect and to quantify a decrease in these markers using previously published neuroprotective strategies or anti-apoptotic tools.
2. Materials and Supplies
2.1. Animals
All animals were treated in accordance with the Association for Research in Vision and Ophthalmology (ARVO) Statement for the Use of Animals in Ophthalmic and Vision Research. The protocol was approved by the University Committee on Use and Care of Animals of the University of Michigan (Protocol numbers: PRO00011133 and PRO00011135). Animal experiments were conducted in accordance with ARRIVE guidelines. Both male and female animals were used. All animals were maintained at room temperature in a 12/12-hour light/dark cycle. Wild-type C57BL/6 mice were purchased from Charles River Laboratories (Wilmington, MA, USA). Mice harboring loxP sites flanking exon 10 of the pyruvate kinase muscle (Pkm) gene were purchased from Jackson Laboratories (Bar Harbor, ME, USA, Strain # 024048). These mice were crossed to mice carrying a Cre-recombinase transgene under the control of the Rhodopsin promoter (Le et al., 2006). All mice were maintained on a C57BL/6 background and were confirmed to not carry the rd8 mutation. Mice with rod photoreceptor-specific deletion of Pkm2 (Pkmfl/fl;Rho-Cre+, conditional knockout, cKO) and control animals (Pkmwt/wt;Rho-Cre+, wildtype, WT) were used.
2.2. Reagents
The following tables (Table 1 & 2) list all chemical reagents and antibodies/stains used in this study.
Table 1 –
List of reagents.
| Reagent | Company | Catalog number |
|---|---|---|
| 0.25% Trypsin-EDTA | Gibco | 25200-56 |
| DNase II | Worthington Biochem | LS002425 |
| 1X PBS | Gibco | 10010-023 |
| FBS | Gibco | 16000-044 |
| 16% Paraformaldehyde EM Grade | Electron Microscopy Sciences | 15710 |
| ZVAD-FMK | Selleckchem | S7023 |
| tert-butyl hydroperoxide (tBH) | MilliporeSigma | 458139 |
| Ferrous sulfate | MilliporeSigma | F8633 |
| 1% Sodium Hyaluronate (Healon) | Johnson & Johnson Vision | HEALON PRO |
| Genteal gel | Alcon | |
| 3 mm glass coverslip | Warner Instruments | 64-0720 CS-3R |
| 100 %Ethanol | Fisher Scientific | A4094 |
| Triton x 100 | MilliporeSigma | T8787 |
| DMSO | MilliporeSigma | 41640 |
| EDTA | Invitrogen | AM9260G |
DMSO – dimethylsulfoxide, EDTA – Ethylenediaminetetraacetic acid, FBS – fetal bovine serum, PBS – Phosphate Buffered Saline
Table 2 –
List of antibodies and fluorescent probes used for flow cytometric analysis.
| Antibody/Probe/Kit | Fluorochrome | Vendor/Catalog No./Clone |
|---|---|---|
| DeadEnd Fluorometric TUNEL assay | FITC | Promega #G3250 |
| Anti-cleaved Caspase 8 | unconjugated | Novus Biologicals #NB100-56116 |
| Anti-mouse Cleaved Caspase-8 (Asp387) | PE | Cell Signaling #8592 |
| Dead Cell Apoptosis kit with Annexin V | FITC | Thermo Fisher #V13242 |
| 7AAD | PerCP | BD Biosciences #559925 |
| PE-Mouse IgG1 (Isotype) | PE | BD Biosciences #554680 |
| Donkey Anti-Rabbit IgG | AF594 | Jackson ImmunoResearch lab #711-585-152 |
| C11 BODIPY | PE | Invitrogen #D3861 |
| Calcein-AM | FITC | Invitrogen #C3100 |
| CM-H2DCFDA | FITC | Invitrogen #C6827 |
7AAD – 7-Aminoactinomycin D, AF594 – Alexa Fluor 594, BODIPY – 4,4-difluoro-4-bora-3a,4a-diaza-s-indacene, FITC – Fluorescein isothiocyanate, CM-H2DCFDA – 6-chloromethyl-2’,7’-dichlorodihydrofluorescein diacetate, PercP – Peridinin chlorophyll protein, PE – phycoerythrin, TUNEL – Terminal dUTP Nick-End Labeling
2.3. Equipment:
The following tables (Table 3 & 4) list the equipment used and optical configurations of the flow cytometers.
Table 3 –
Equipment.
| Equipment | Company | Catalog Number |
|---|---|---|
| BD LSR II Flow cytometer | BD Biosciences | |
| Attune NXT Flow cytometer | Invitrogen | |
| Sorvall RC 6+ Ultracentrifuge | Thermo Scientific | |
| Automated Cell counter | BioRad | 1450102 |
| Microplate Shaker | VWR International | 12620-926 |
| Fixed speed vortex mixer | Fisher Scientific | 02-215-410 |
| Tabletop centrifuge 5424 | Eppendorf | 022620444 |
| Bead Bath | Lab Armor | 74309-706 |
| Surgical Microscope | Zeiss | Lumera 300 |
| UMP3 Microsyringe pump system | World Precision Instruments | UMP3-3 |
| Nanofil Needle (35 G blunt/beveled) | World Precision Instruments | NF35BL-2/NF35BV-2 |
| Nanofil Syringe (10 uL/100 uL) | World Precision Instruments | NANOFIL/NANOFIL-100 |
| 5 mL polystyrene tubes with 12 × 75 mm cell-strainer caps | Corning | 352235 |
Table 4 –
Optical configuration of flow cytometers.
| Instrument: BD LSR II | ||||
| Emission Filters | 530/30 nm | 576/26 nm | 610/20 nm | 695/40 nm |
| Fluorochromes | FITC | PE | TR | PerCP |
| Instrument: Attune Nxt | ||||
| Emission Filters | 530/30 nm | 590/40 nm | 695/40 nm | |
| Fluorochromes | FITC | PE, TR | PerCP | |
FITC – Fluorescein isothiocyanate, PercP – Peridinin chlorophyll protein, PE – phycoerythrin, TR - Texas Red
3. Detailed Methods
3.1. Retina collection, dissociation, staining, and gating strategy
An overview of the dissociation protocol is shown in Figure 1A. Whole retinas were harvested using the “cut and pick” method immediately following anesthetization and decapitation as previously described (Winkler, 1972). The iris and ciliary body were carefully dissected off the retina before processing the tissue further. Two retinas were pooled together and placed in 1 mL of ice-cold PBS in a 1.7 mL microcentrifuge tube on ice immediately after collection. Tissue samples were then centrifuged at 1000 RPM for 30 seconds on a tabletop centrifuge to pellet the retina. Excess PBS was removed from the microcentrifuge tube by carefully aspirating the supernatant, leaving enough PBS (~50 μL) to cover the retinal tissue pellet. Trypsin digestion solution was freshly prepared by mixing 4 μL/mL deoxyribonuclease II in 0.25% Trypsin-EDTA solution and warming to 37°C. 700 μL of trypsin digestion solution was then added to each microcentrifuge tube. Tubes were placed on a slow microplate shaker at 60 RPM for 20 minutes at room temperature and vortexed briefly every 5 minutes. After 20 minutes, the digestion mixture was gently triturated by passing through an 18-gauge (G) needle attached to a 1 mL TB syringe until the solution looked homogeneous and free of any clumped tissues. The digested tissue was then passed through a 12×75 mm cell-strainer cap into a 5 mL round-bottom polystyrene tube on ice to remove any remaining tissue pieces. Cell strainer caps were discarded and the digested tissue was diluted by adding 2 mL of ice cold FACS buffer (1% FBS in PBS) to inactivate the trypsin. Dissociated retinal cells were pelleted by centrifuging at 300xg for 6 minutes at 4°C. The supernatant was decanted without disturbing the cell pellet and cells were then resuspended in 1 mL of PBS. The number of cells per mL was determined using an automated cell counter. This process had a typical yield of approximately 5–7×10⁵ cells per 2 retinas. The general gating strategy for analysis of flow samples is presented in Figure 1B. All events are initially gated by forward scatter and side scatter area to remove debris and broken cells (red gate). These cells within the red gate are then further screened to select for singlets only based on forward scatter area and height (blue gate). The cells within the blue gate are then examined for fluorescent intensity of the marker being examined (green gate). Positive cells were determined by fixing these gates to their negative or isotype controls equal to or less than 1% of all events. expression. Gating controls are described in Table 5 and include unstained cells for 7AAD, Annexin V, CM-H2DCFDA, C11-BODIPY and Calcein-AM assays. For detection of Cleaved Caspase-8 and Cleaved Caspase-8 at Asp387, cells were stained with Isotype-AF594 or Isotype-PE, respectively. The negative control for TUNEL staining includes retinal cells in equilibration buffer with nucleotide mix only. Beyond the gating controls, experimental controls for each assay were included as either vehicle treated retinal cells or cells from attached retinas where appropriate. See troubleshooting 4.2 for a special note regarding Calcein-AM gating. Flow cytometry data analysis was performed using FCS Express version 7 (De Novo Software, Ontario, CA). Histograms for all gated cell counts are found in Supplementary Figures 1–5.
Figure 1 – Tissue processing and flow cytometry gating.
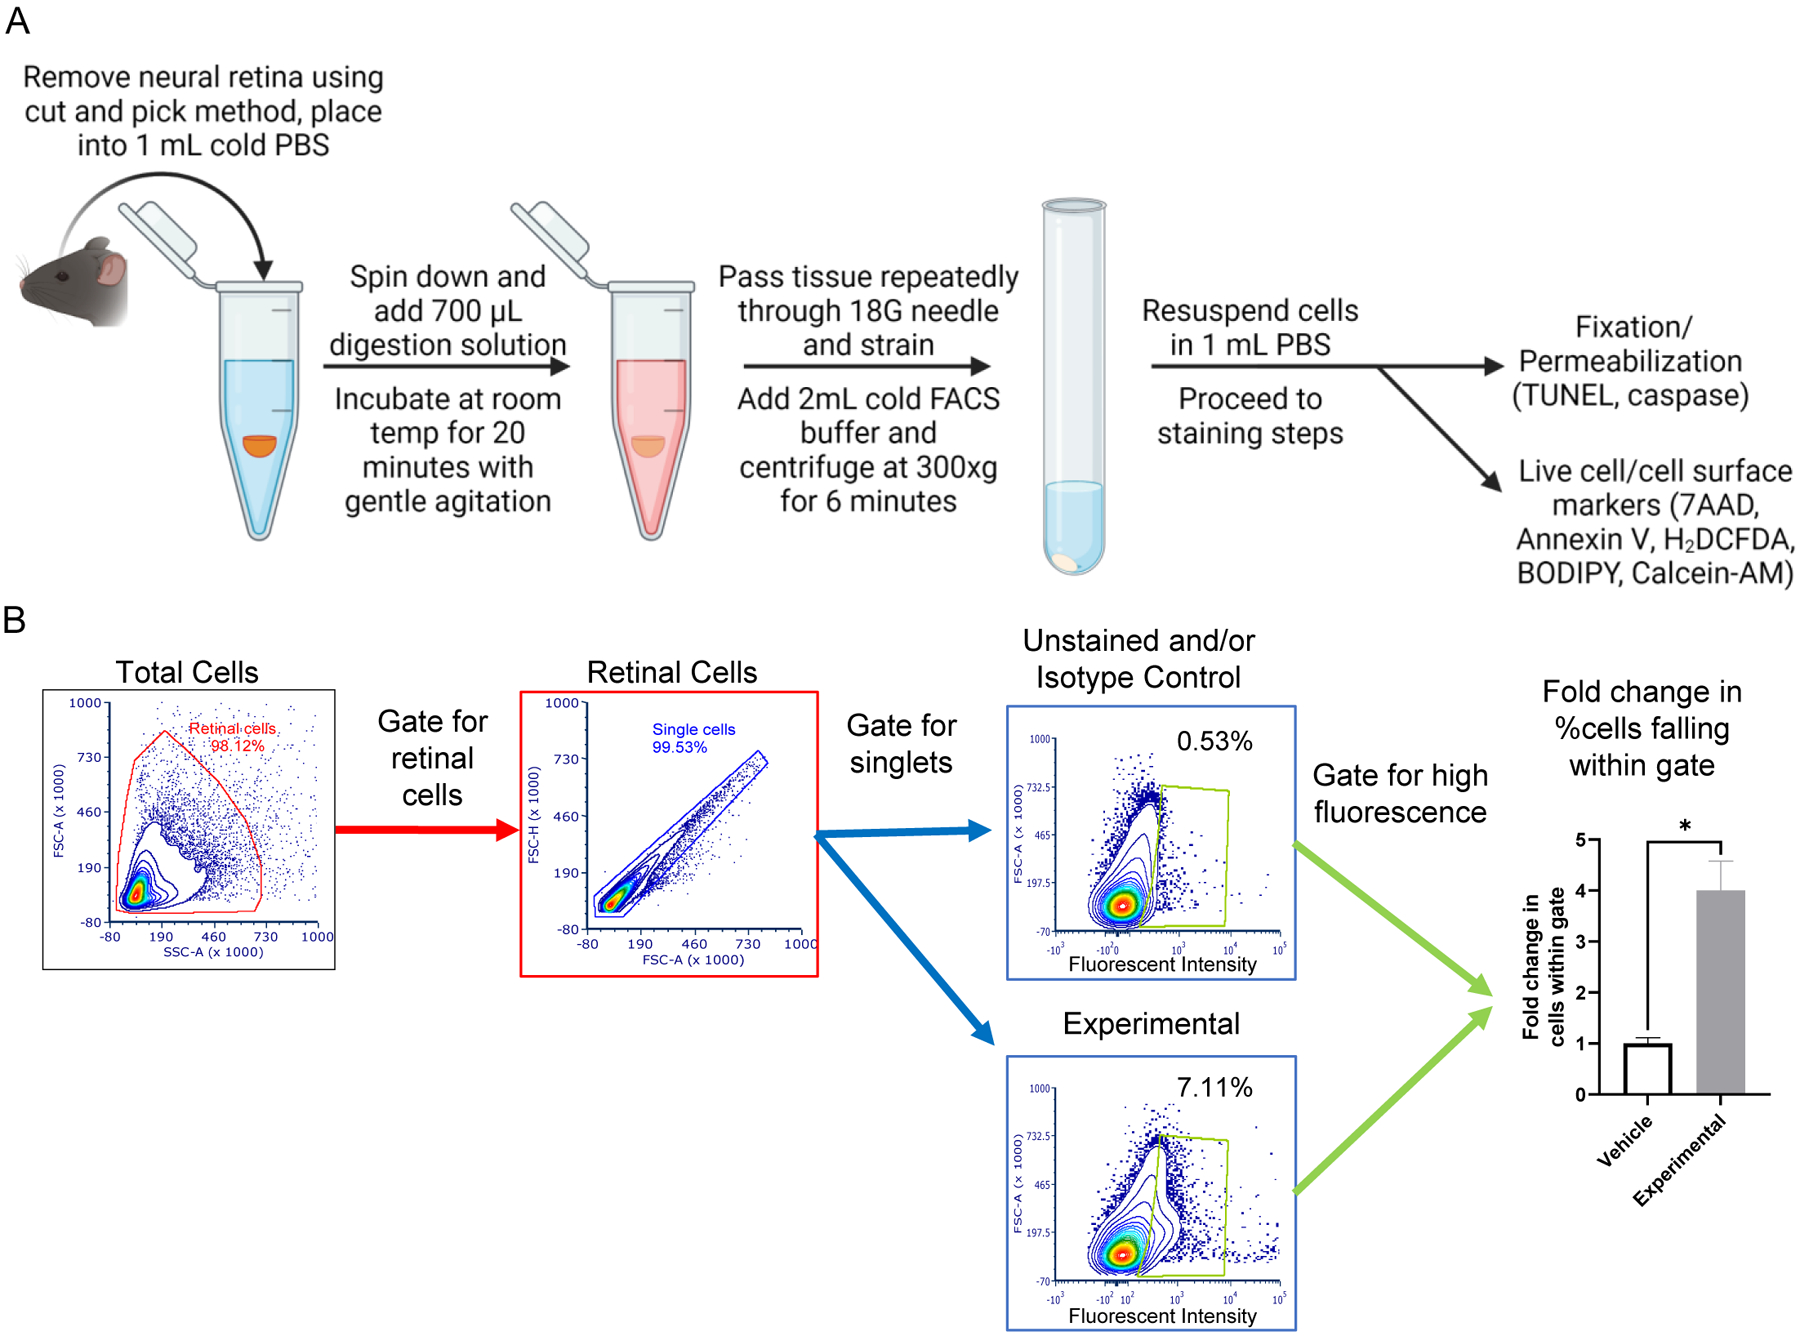
(A) Flow diagram showing steps involved in dissociating whole neural retina into a single cell suspension. Mouse retina is dissected using the cut and pick method and digested in a trypsin solution for 20 minutes. The tissue is then passed repeatedly though an 18G needle before 2 mL of FACS buffer is added to inactivate the trypsin solution. The tissue homogenate is then centrifuged, supernatant removed, and the cells are resuspended in 1 mL of PBS. The single cell suspension is now ready for staining. (B) Gating strategy for flow cytometric analysis. Cells are initially gated using forward scatter and side scatter to remove any broken cells or debris from further analysis (red gate). The cells within the red gate are then further refined to only examine singlet cells (blue gate). Cells within the blue gate are then analyzed for a change in fluorescent intensity for each individual stain (green gate). The fold change of the percentage of cells within the green gate are used to calculate changes in marker expression.
Table 5 –
Gating controls per assay.
| Staining method | Gating controls |
|---|---|
| DeadEnd Fluorometric TUNEL assay | Cells treated with incubation buffer without rTdT enzyme |
| 7AAD | Unstained cells |
| Annexin V | Unstained cells |
| Anti-cleaved Caspase-8 | Cells stained with AF594-Donkey Anti-Rabbit IgG only |
| Anti-cleaved Caspase-8 (Asp387) | Cells stained with PE-Mouse IgG1 |
| CM-H2DCFDA | Unstained cells |
| C11-BODIPY | Unstained cells |
| Calcein-AM | Unstained cells |
The percentage of cells that fall into the green gate in either the control or experimental group is determined and the fold change between groups is used to identify changes in marker
3.2. Detection and quantitation of markers of retinal cell death
3.2.1. Inducing retinal cell death
To demonstrate that flow cytometry can reliably detect and quantitate different markers of retinal cell death, we used two previously published and distinct experimental models of retinal cell death. One of these models uses an intravitreal (IVT) injection of ferrous sulfate to induce profound outer retinal cell death (Shu et al., 2020) and the other is the oft-utilized experimental model of retinal detachment (Besirli et al., 2010; Hisatomi et al., 2002; Lo et al., 2011; Weh et al., 2020; Wubben et al., 2017; Wubben et al., 2020; Zacks et al., 2004) that induces outer retinal cell death by separating photoreceptors from the retinal pigment epithelium (RPE), producing an acute metabolic stress. Both of these models result in significant increases in apoptotic and other cell death markers. Apoptosis is the leading cause of retinal cell death across many disease models and preventing apoptosis is an active area of pre-clinical and clinical retinal neuroprotection research (NCT05160805, NCT04744662). As the prevention of apoptosis and necrosis will likely also be necessary to prevent retinal cell death (Chinskey et al., 2014), we focused our efforts on detecting and quantitating key markers of apoptosis, such as Annexin V and 7-Amino-Actinomycin-D staining (7AAD), as well as TUNEL staining, which can detect both apoptosis and necrotic cell death (Charriaut-Marlangue and Ben-Ari, 1995).
Mice were prepared for IVT or subretinal injection as previously described (Weh et al., 2020; Wubben et al., 2020). Briefly, mice were anesthetized using a mixture of Ketamine and Xylazine (90 mg/kg and 10 mg/kg) via intraperitoneal injection. Pupils were dilated by applying 1% Tropicamide and 2.5% phenylephrine drops and topically anesthetized with proparacaine (0.5%) drops. Hypromellose (genteal) 0.3% gel was applied to the corneal surface as a coupling agent for a 3 mm glass coverslip. In combination with a Zeiss Lumera 300 surgical microscope, detailed visualization of the vitreous cavity and retina was achieved to ensure that IVT or subretinal injection was performed safely and effectively each time, avoiding damage to the lens or the retina and reducing the number of animals necessary per experiment.
IVT injections were performed as previously described (Wubben et al., 2020). Briefly, a sclerotomy was made just posterior to the limbus using a 25G microvitreoretinal blade. Following this, a 35G blunt cannula, attached to a 10 μL NanoFil syringe was passed through the sclerotomy into the vitreous cavity. Using the UMP3 microsyringe pump system with accompanying foot pedal control, 1 μL of solution was injected into the vitreous to achieve the desired final concentration assuming an approximate 6 μL vitreous volume (Awwad et al., 2020). The contralateral eye was injected with 1 μL of vehicle as a control.
We induced retinal detachments in mice as previously described (Wubben et al., 2017). Mice were prepared as described above for IVT injection. After the sclerotomy was made, a 35G beveled cannula attached to a 100 μL Nanofil syringe was introduced into the vitreous cavity. The tip of the needle was then passed through the neural retina into the subretinal space. Using the UMP3 microsyringe pump system with accompanying foot pedal control, 4 μL of sodium hyaluronate was injected under the retina. Retinal detachment was visually confirmed with approximately one-half to two-thirds of the neural retinal being detached.
3.2.2. Assessing retinal cell death using flow cytometry
We first assessed markers of retinal cell death after IVT injection of ferrous sulfate. Previous work has shown that IVT injection of ferrous sulfate can rapidly, and reliably, induce retinal cell death within 48 hours (Shu et al., 2020). We performed IVT injection of ferrous sulfate to reach 50, 100, 250, or 500 μM final vitreous concentration and collected retinas 24 hours after IVT injection. Collected tissues were processed as described in 3.1. For Annexin V staining, 200,000 cells per sample were stained using the Dead Cell Apoptosis Kit with Annexin V for Flow Cytometry following the manufacturer’s protocol. Briefly, cells were washed twice in PBS. Washing steps were performed in round-bottom polystyrene tubes with 2 mL of ice-cold PBS and carried out by removing supernatant and resuspending cells in buffer followed by centrifuging for 6 minutes at 4°C and 300xg. Supernatant was carefully decanted in-between wash steps. After the final wash step, supernatant was decanted leaving behind approximately 100 – 300 μL of solution. 100 μL of 1X Annexin V Binding buffer was added after the final wash. 5 μL of FITC-Annexin V was then added to each sample and incubated at room temperature in the dark for 15 minutes. Samples were diluted with 400 μL of cold Annexin V binding buffer and processed on a BD LSR II flow cytometer to measure fluorescence emission at 530 nm.
Dissociated cells were processed similarly for 7AAD staining. 200,000 cells per sample were washed twice in FACS buffer before 5 μL of 7AAD (0.25 μg total) was added to each sample and incubated on ice in the dark for 15–20 minutes. Samples were then washed once with FACS buffer. 400 μL of FACS buffer was added to the cell pellet, which was then processed on a BD LSR II flow cytometer using PerCP channel with a fluorescence emission detection at 633 nm. A minimum of 100,000 events were acquired in each sample for both Annexin V and 7AAD.
Finally, TUNEL positivity was assessed using 300,000 cells per sample. Cells were stained with the DeadEnd Fluorometric TUNEL assay for apoptosis detection following the manufacturer’s protocol. Dissociated cells were fixed by adding 2 mL of 1% paraformaldehyde diluted in PBS for 20 min and then washed with PBS before permeabilization. For permeabilization, samples were incubated in 2 mL of ice-cold 70% ethanol at −20°C for at least 4 hours. From this step onwards, care was taken not to expose cells to excess light. Samples were centrifuged for 10 min at 4°C and 300xg to remove permeabilization solution and then washed with PBS. 50 μL of freshly prepared rTdT incubation buffer (45 μL equilibration buffer, 5 μL nucleotide mix,1 μL rTdT enzyme) or incubation buffer lacking rTdT enzyme (negative control) was added to each sample. Cells were then incubated for 60 minutes at 37°C in a bead bath in the dark and re-suspended every 15 min using a micropipette. The staining reaction was terminated by adding 1 mL of 20 mM EDTA, followed by centrifugation at 300xg and 4°C for 10 minutes. Cell pellets were washed twice with PBS, and 400 μL of FACS buffer was added to each sample prior to flow cytometry analysis. A minimum of 200,000 events were acquired for each sample using the FITC channel with fluorescence emission detection at 530 nm on a BD LSR II or Attune Nxt flow cytometer.
Using these methods and the gating strategy described in 3.1, we observed an increase in the percentage of cells positive for early (Annexin V, Fig. 2A) and late markers of apoptosis (7AAD, Fig. 2B) as well as TUNEL (Fig. 2C) in retinas treated with ferrous sulfate compared to vehicle treated eyes. In further support of these flow cytometric methods for the detection and quantification of retinal cell death, previous work demonstrated that intravitreal injection of ferrous sulfate resulted in a significant increase in retinal cell TUNEL staining and subsequent outer retinal cell death using standard histological methods (Shu et al., 2020).
Figure 2 – Flow cytometry can detect early and late markers of retinal cell death after noxious stimuli.
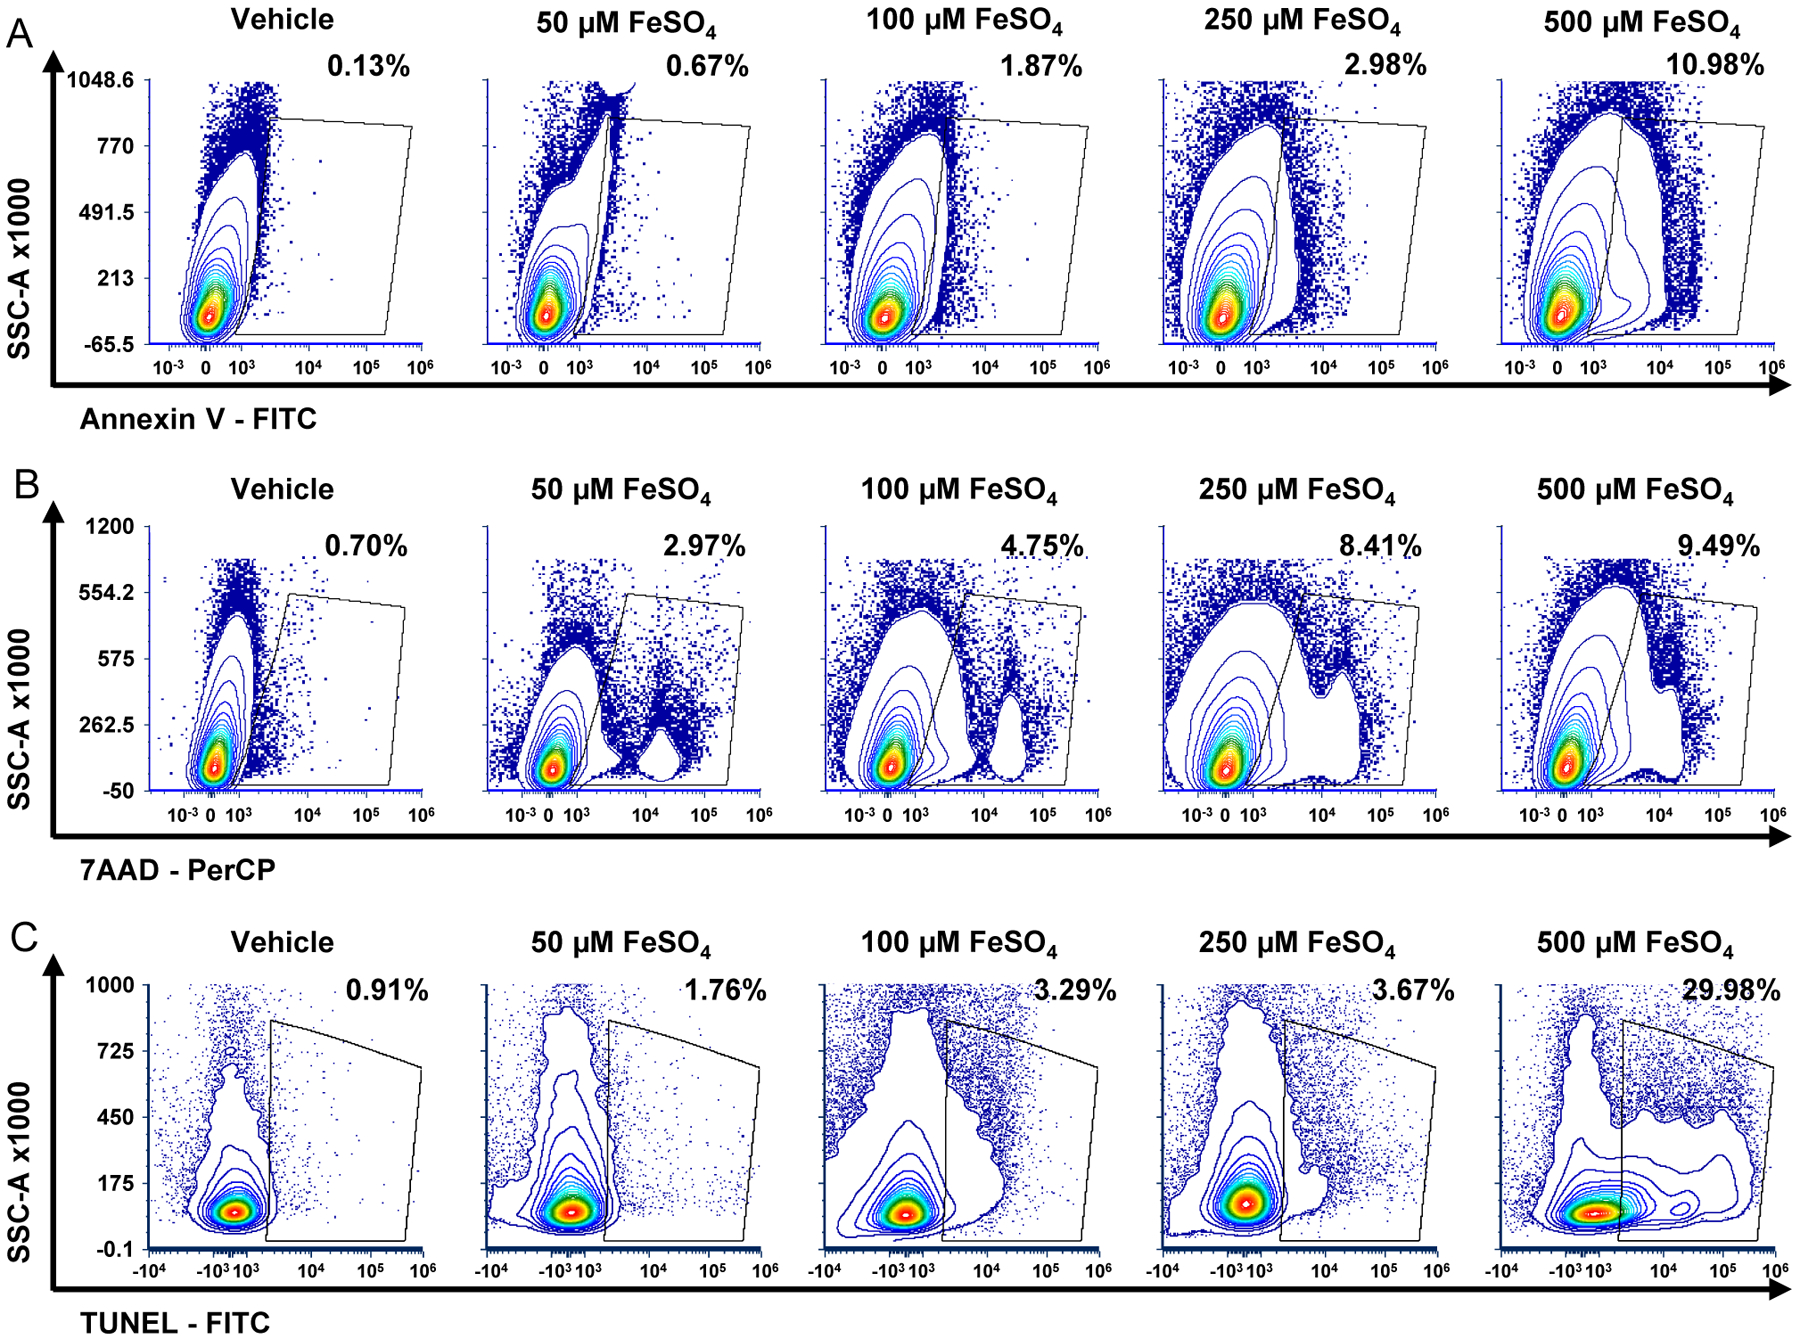
Contour plots showing an increased percentage of (A) Annexin V, (B) 7AAD (7-Aminoactinomycin D), and (C) TUNEL (terminal deoxynucleotidyl transferase dUTP nick end labeling) positive cells compared to their isotype or negative controls. Animals received indicated amount of ferrous sulfate intravitreal (final vitreous concentration), and retinas were harvested 24 hours later.
To demonstrate that these methods are applicable to more than one model of retinal degeneration, we utilized a murine model of experimental retinal detachment. This model has been used by us and others to identify and assess potential neuroprotective factors and therapies (Besirli et al., 2010; Lo et al., 2011; Weh et al., 2020; Wubben et al., 2017; Wubben et al., 2020). Apoptosis is one of the main mechanisms of outer retinal cell death upon retina/RPE separation with necrosis also playing a role (Trichonas et al., 2010). TUNEL staining is increased at 3 days after experimental retinal detachment and correlates with long-term retinal cell survival (Hisatomi et al., 2002).
Experimental retinal detachment was induced in wildtype (WT) mice (as described in 3.2.1) and total retina was harvested 3 days post detachment and processed (as described in 3.1) for TUNEL staining as described above. Our data show a statistically significant increase in cells staining positive for TUNEL (Fig. 3A) compared to attached retinas. These data agree with previously published histological methods of TUNEL staining at this same time point (Besirli et al., 2010; Wubben et al., 2017). Previous work has also shown that caspase activation, including caspase 8, also increases 3 days after retina/RPE separation and has been validated to correspond with an increase in cell apoptosis and the extent of outer retinal cell death in this experimental model (Besirli et al., 2010; Wubben et al., 2017; Zacks et al., 2004).Therefore, we next assessed the ability of flow cytometry to determine an increase in two different cleaved caspase 8 markers following retinal detachment.
Figure 3 – Flow cytometry can detect and quantitate retinal cell death secondary to experimental retinal detachment.
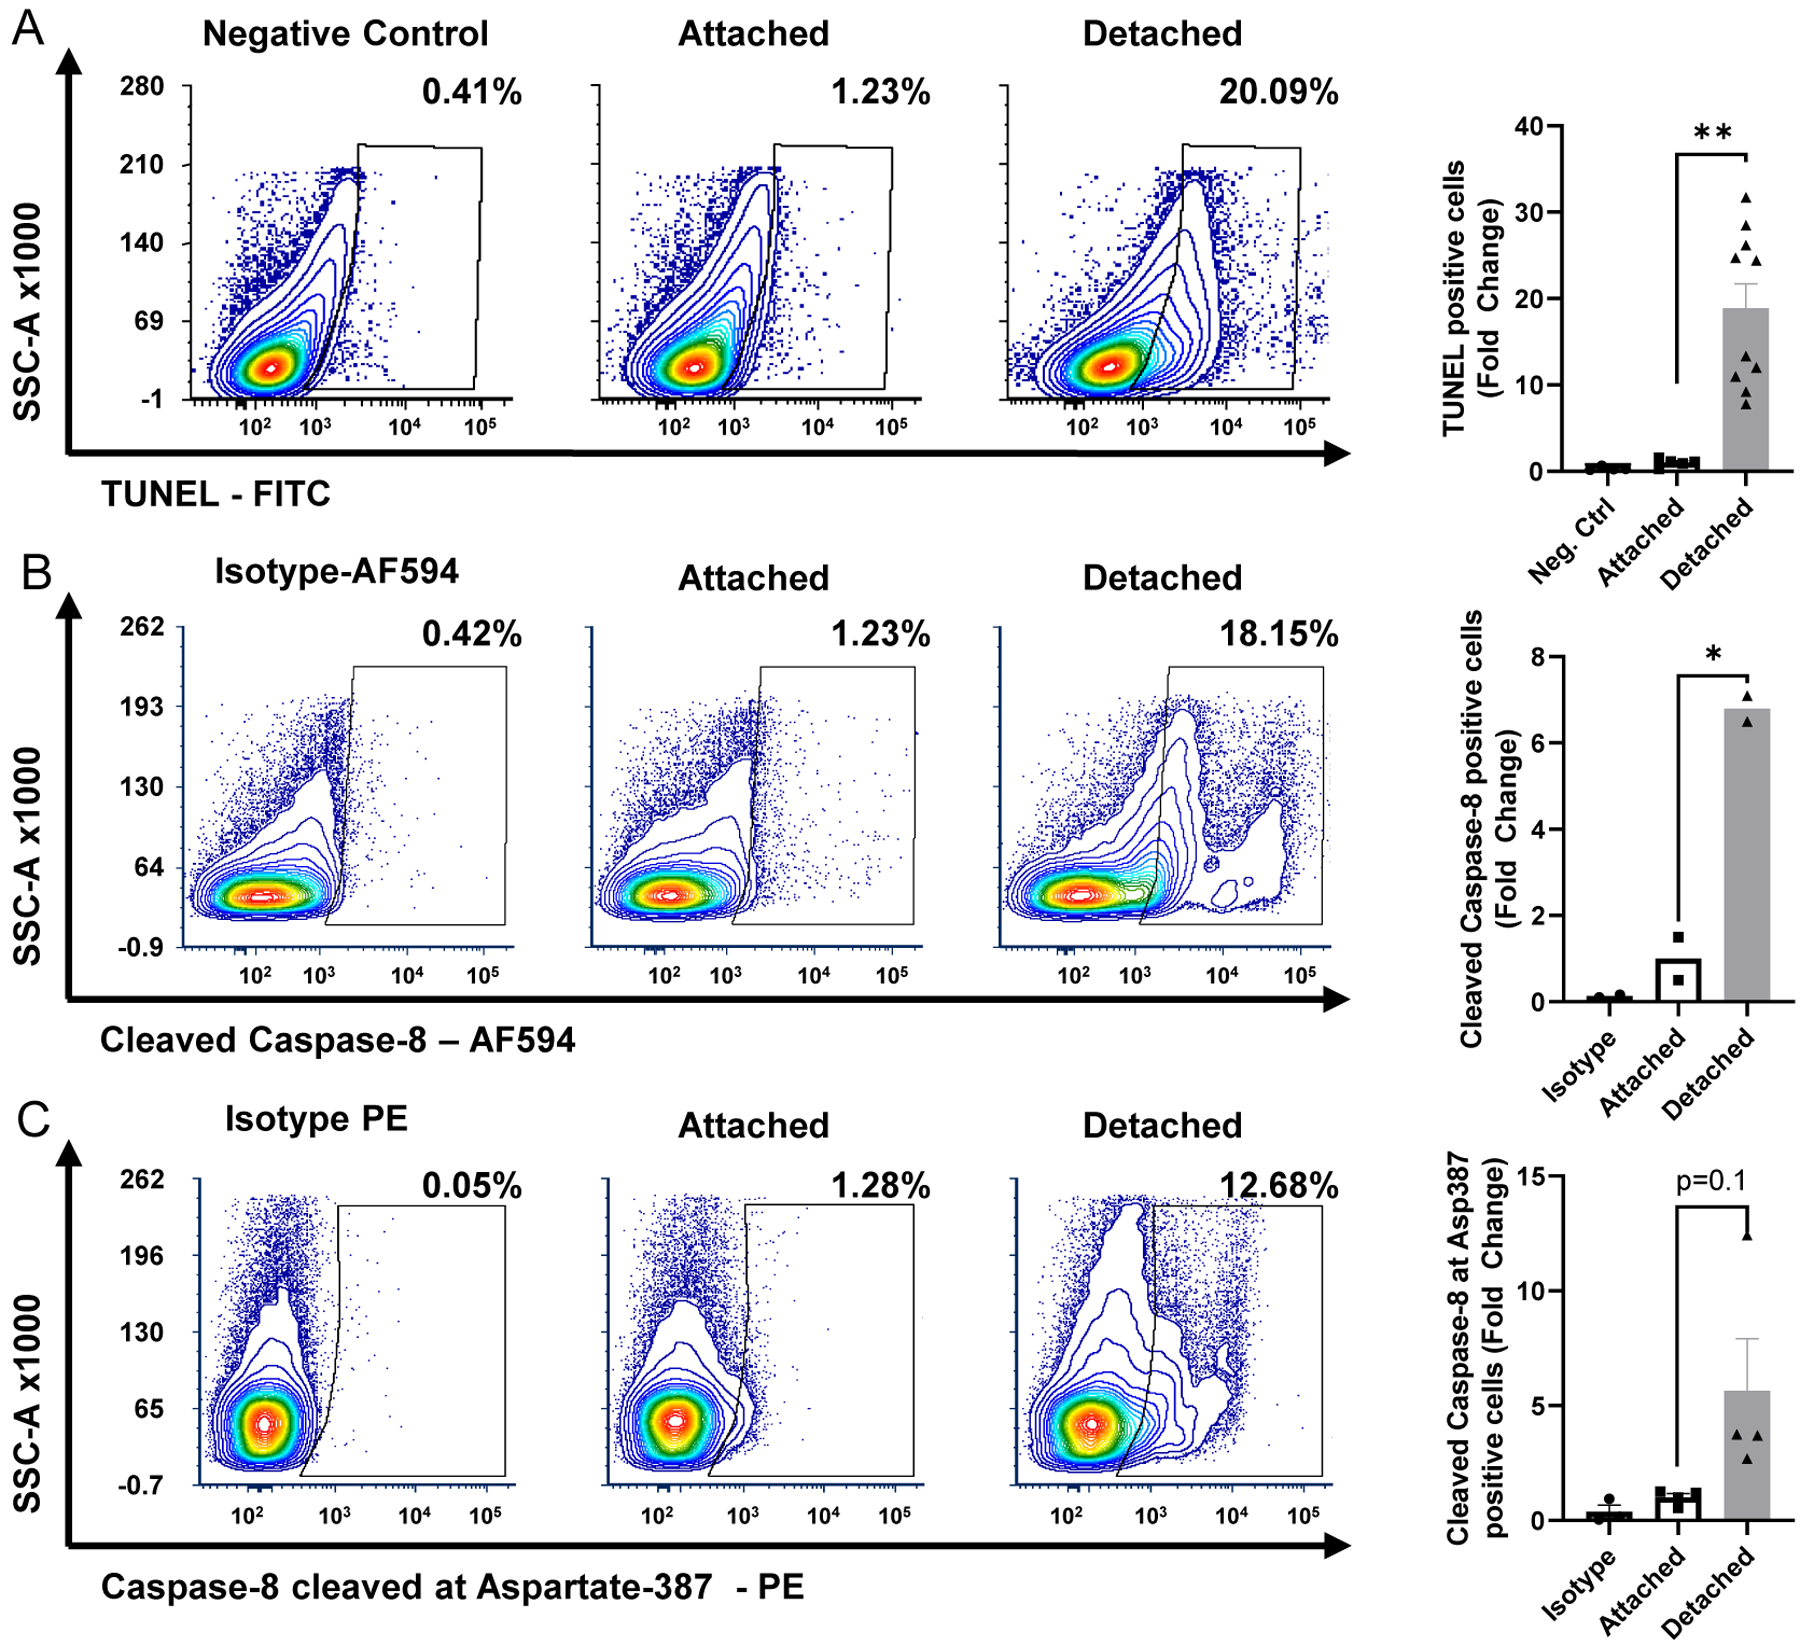
Mouse retinas were harvested 3 days after experimental retinal detachment. Dissociated cells were stained to assess for cell death. Contour plots depicting increased (A) TUNEL (terminal deoxynucleotidyl transferase dUTP nick end labeling), (B) cleaved caspase-8, and (C) caspase-8 cleaved at Asp387 staining. Graphs showing corresponding fold change increase in stained cells are displayed to the right of their respective contour plots. There was a significant increase in the percentage of TUNEL positive and cleaved caspase-8 positive cells compared to negative control or isotype control. There was a trend towards increased caspase 8 cleaved at Aspartate-387. N=2–3 for control and attached samples; N=2–11 for detached samples from 4 independent experiments. Alexa Fluor 594 (AF594). **p<0.01, *p<0.05
To detect cleaved caspase 8, we used 200,000 dissociated retinal cells per sample and fixed them by resuspending in 2 mL of 4% paraformaldehyde diluted in PBS for 15 min at room temperature and then pelleted the fixed cells by centrifugation for 10 minutes at 300xg and 4°C. Cell pellets were washed twice with PBS and permeabilized in 70% ice-cold ethanol for at least 4 hours before being washed twice with FACS buffer. A solution of 5 μL FACS buffer and 2 μL antibody (cleaved caspase 8) was added to each sample (final dilution approximately 1:50), vortexed gently, and then incubated for 30 min at room temperature, according to the manufacturer’s recommendations. Cells were then washed once more with FACS buffer before the addition of the secondary antibody solution consisting of 100 μL FACS buffer and 0.2 μL Anti-Rabbit Alexa Fluor 594. Cells were vortexed gently and incubated for 20 min at room temperature in the dark. Light exposure was avoided after this step. For the isotype control, cells were incubated with secondary antibodies only without prior staining with primary antibody. Cell pellets were washed twice with FACS buffer and 400 μL FACS buffer was added before flow analysis. A minimum of 100,000 events were acquired for each sample on the Texas Red channel (630 nm) using either a BD LSR II or Attune Nxt flow cytometer. A similar protocol was followed using a PE-conjugated antibody to detect cleaved caspase-8 at Asp387 (1:50 dilution) with events being acquired on the PE channel (585 nm).
Similar to what we observed with TUNEL staining after experimental retinal detachment using flow cytometry (Fig. 3A), our data show a significant increase in the number of cells positive for both cleaved caspase 8 antibodies following experimental separation of the retina from the RPE (Fig. 3B&C). Furthermore, this flow cytometry data recapitulates data from our group, as well as others, showing an upregulation of caspase 8 and its activity 3 days post experimental retinal detachment in rodents using orthogonal techniques such as qRT-PCR, Western blot, and enzyme activity assays (Besirli et al., 2010; Wubben et al., 2017; Zacks et al., 2007; Zacks et al., 2003; Zacks et al., 2004).
The goal of understanding the mechanisms of retinal cell death is to identify potential neuroprotective strategies that prevent vision loss in blinding retinal diseases. Therefore, as a final step, we assessed if flow cytometry could detect a change in retinal cell death markers after experimental retinal detachment when using either genetic or pharmacologic neuroprotective strategies. We have previously shown that knocking out pyruvate kinase muscle isozyme 2 (PKM2) in rod photoreceptors (with compensatory upregulation of PKM1) can significantly reduce the number of TUNEL positive retinal cells 3 days post retinal detachment and improve cell survival long-term as demonstrated via traditional histological methods (Wubben et al., 2017). Experimental retinal detachments were created in both WT and rod photoreceptor-specific, Pkm2 conditional knockout animals (cKO) as described in 3.2.1. Total retinas were harvested 3 days later, and the tissue was processed for flow cytometry as described in 3.1. Similar to our previously published data using histology, flow cytometry demonstrated a statistically significant decrease in TUNEL positive cells in detached retina from the PKM2 cKO mice compared to detached retina from WT mice (Fig. 4A).
Figure 4 – Flow cytometry detects and quantitates changes in retinal cell death markers with neuroprotective strategies.
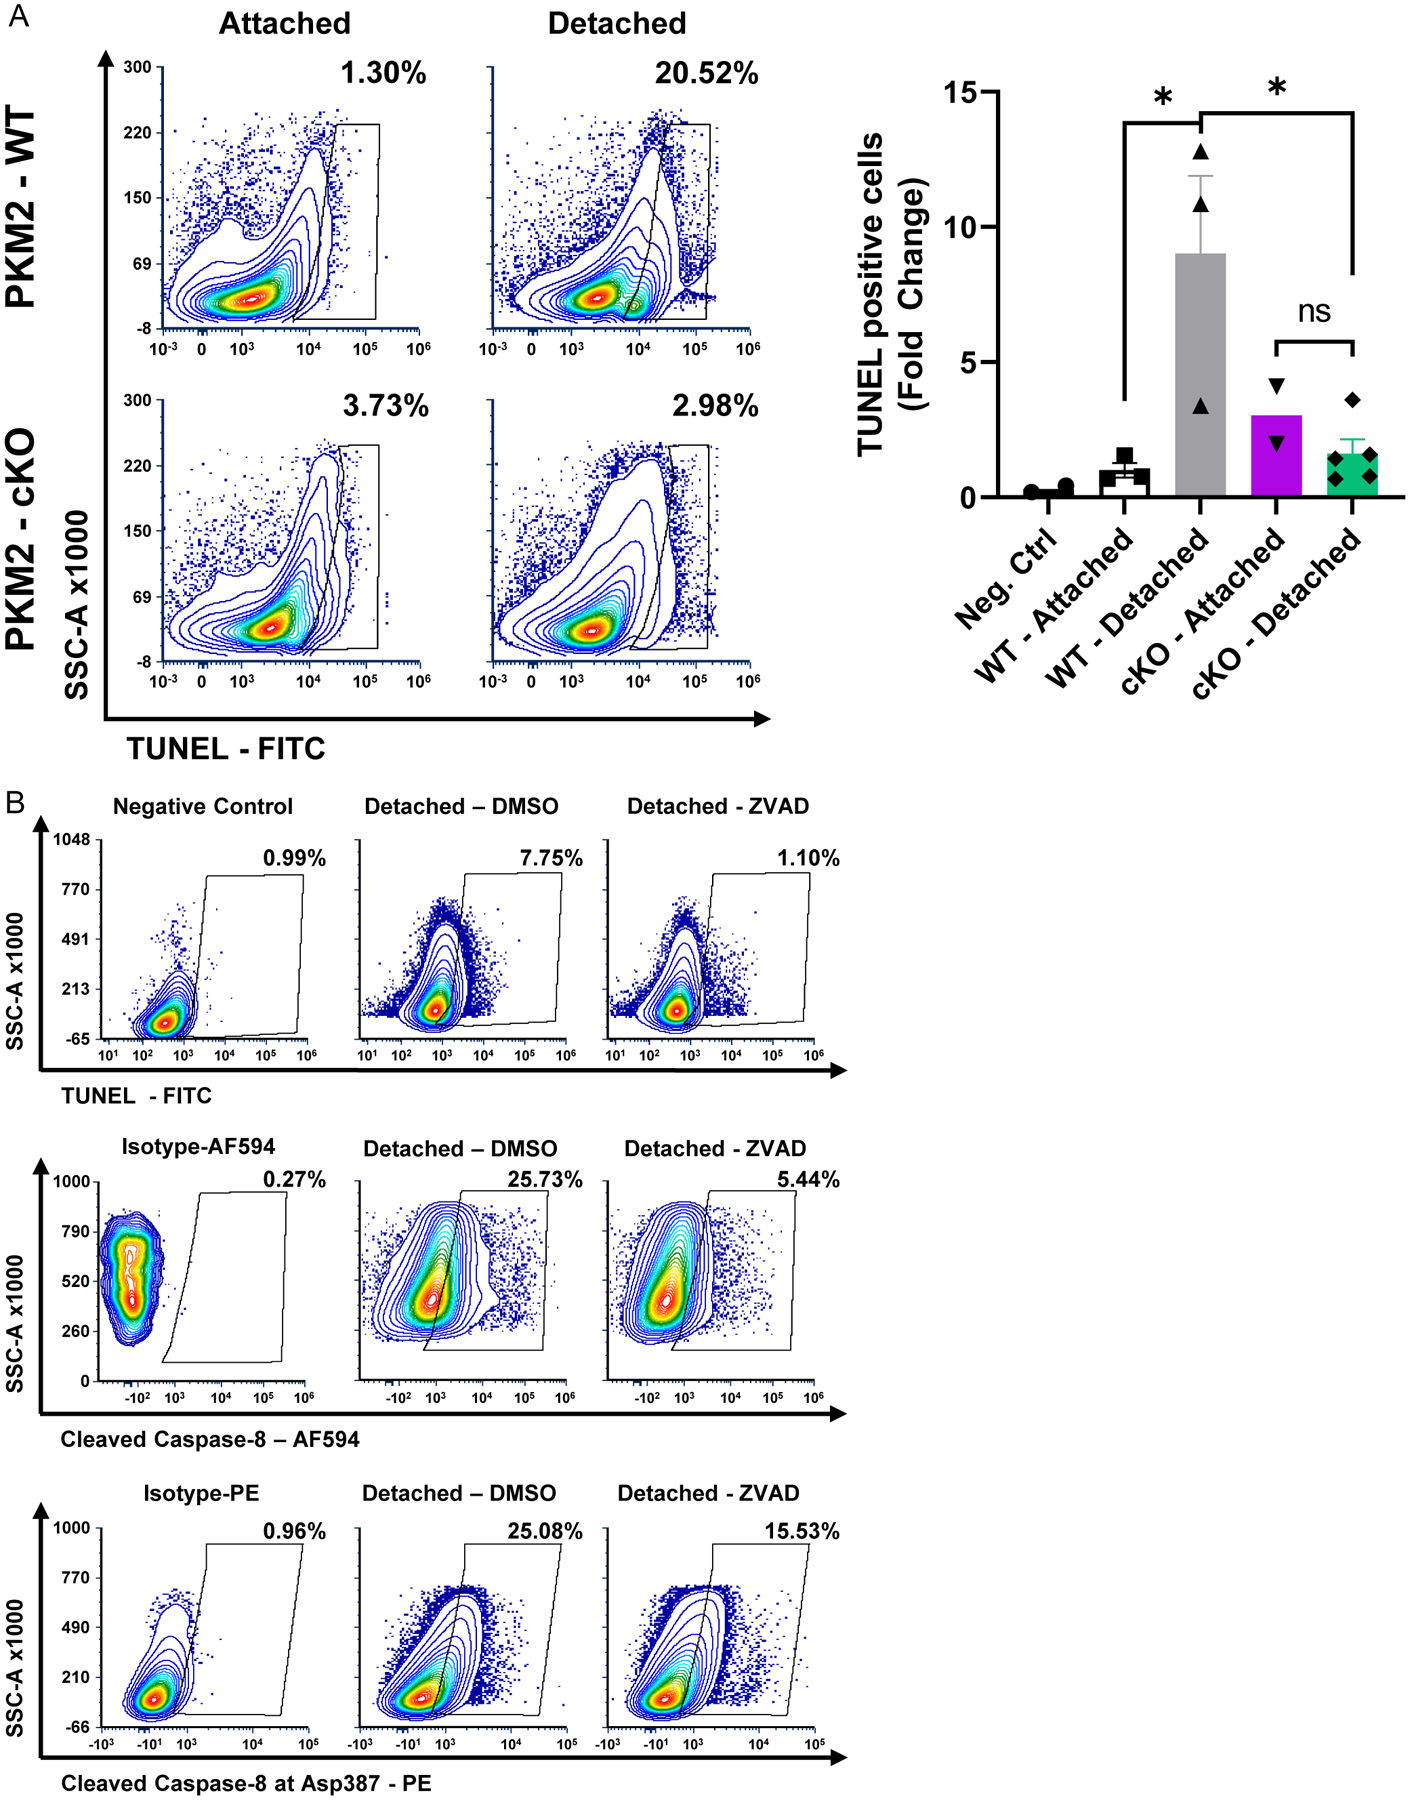
(A) Experimental retinal detachment was induced in either wildtype (PKM2-WT) or Pkm2fl/fl;Rho-Cre+ (PKM2-cKO) and retinas were harvested 3 days later. Contour plots depict a decrease in the percent of TUNEL (terminal deoxynucleotidyl transferase dUTP nick end labeling) positive cells in PKM2-cKO mice compared to PKM2-WT animals. The graph shows a statistically significant fold change in TUNEL positive cells after detachment in PKM2-cKO animals compared to PKM2-WT animals. N=2–5 per group (B) In a separate experiment, experimental retinal detachment was induced in WT animals and either DMSO or ZVAD-FMK (200 μM) was administered sub-retinally at the time of detachment. Contour plots showing decreased TUNEL, cleaved caspase-8, and cleaved caspase-8 at Asp387 staining 3 days status post experimental retinal detachment after treatment with ZVAD. Alexa Fluor 594 (AF594). * p<0.05, ns – not significant
In a separate experiment, ZVAD-FMK, a pan-caspase inhibitor (Van Noorden, 2001), was pre-mixed in sodium hyaluronate (final concentration of 200 μM) and injected subretinally at the time of retinal detachment in WT mice. Retinas were harvested 3 days later and processed for flow cytometry as described in 3.1. A trend towards a decrease in TUNEL, cleaved caspase 8, and cleaved caspase 8 at Asp387 positive cells was observed in detached retina when ZVAD-FMK was used to inhibit caspases following experimental retinal detachment (Fig. 4B). These data further confirm that flow cytometry can be used to quantify the effects of neuroprotective strategies on retinal cell death markers.
3.3. Detection and quantitation of markers of oxidative stress in the retina
3.3.1. Inducing oxidative stress in the retina
Increased oxidative stress has been postulated to be one of the main pathologic processes that ultimately leads to retinal cell death in numerous retinal degenerative diseases (Chan et al., 2020) and interventions that reduce oxidative damage are being examined in clinical trials (Campochiaro et al., 2020). Like with retinal cell death markers, immunohistochemistry-based methods have traditionally been used to detect markers of oxidative damage in the retina of different disease models (Shu et al., 2020; Xu et al., 2018). As discussed previously, histological methods have limitations, therefore we sought to develop flow cytometry methods that can more rapidly and reliably quantify markers of oxidative stress in the retina to potentially enhance and expedite therapeutic efforts in retinal cell neuroprotection. To simulate excessive oxidative stress in the retina and to demonstrate that our flow cytometry methods can detect markers of this stress, tert-butyl hydroperoxide (tBH) (Pham et al., 2022; Totsuka et al., 2019) was injected intravitreally in mice (as described in 3.2.1) to achieve a final vitreous concentration of 200 μM. Retinas were harvested 24 hours later and processed for flow cytometry as described in 3.1.
3.3.2. Detecting markers of oxidative stress in retinal cells
Three distinct markers of oxidative stress were assessed. CM-H2DCFDA is a marker of reactive oxygen species within cells and C11-BODIPY is a probe for lipid oxidation. Accumulation of labile iron (Fe2+) can lead to oxidative stress and retinal cell death (Shu et al., 2020), and targeting iron homeostasis in models of retinal disease has been shown to be neuroprotective (Daruich et al., 2019). As such, we also assessed the ability of flow cytometry to detect and quantitate a shift in the fluorescence intensity of Calcein-AM, which monitors the intracellular Fe2+ labile iron pool, in the retina.
CM-H2DCFDA was diluted from the 0.5 mM stock solution to a final concentration of 10 μM in DMSO. 300,000 cells from dissociated mouse retina were washed twice with PBS and then 100 μL of 10 μM CM-H2DCFDA (or equivalent volume DMSO for unstained negative controls) in DMSO was added to each sample. Cells were incubated in the dark at room temperature for 30 minutes. Following this step, care was taken to avoid exposing samples to excess light. Cells were then washed twice in FACS buffer and 100 μL of FACS buffer was added to each sample prior to flow cytometry. The CM-H2DCFDA signal was detected at 530 nm on the FITC channel using either the BD LSR II or Attune Nxt Flow cytometer.
For C11-BODIPY, a 20 mM stock was made in DMSO and diluted in DMSO to a working concentration of 400 nM for cell staining. For Calcein-AM staining, a 1 mM stock solution of Calcein-AM in DMSO was diluted in DMSO to a working concentration of 33 μM. A similar staining procedure as with CM-H2DCFDA was performed for C11-BODPIY and Calcein-AM. The C11-BODIPY signal was measured at 575 nm in the PE-Texas Red channel and the Calcein-AM signal was measured at 535 nm in the FITC channel with an Attune Nxt Flow cytometer. A minimum of 100,000 events were acquired for each sample.
Using these methods and the gating strategy outlined in Figure 1B, a statistically significant increase in the percentage of retinal cells positive for CM-H2DCFDA and C11 BODIPY, respectively, was observed after intravitreal treatment with tBH (Fig. 5A&B). It is worth noting that gating with Calcein-AM is unique compared to the other markers presented above (See 4.2 for more details). Calcein-AM staining of vehicle treated retina defined the baseline fluorescence, and tBH treatment shifted the fluorescence distribution to a lower intensity, indicating an increase in the labile iron pool (Fig. 5C). tBH treated retinal cells were also stained for markers of cell death (described in 3.2.2) and a significant increase in TUNEL (Fig. 6A), cleaved caspase-8 (Fig. 6B) and capase-8 cleaved at Asp387-positive cells (Fig. 6C) was noted. These data suggest that tBH treatment liberates ferrous ions in the retina, increases lipid peroxidation and oxidative stress, and causes retinal cell death. Flow cytometry can therefore be used to monitor retinal cells for increases in oxidative stress markers and associated cell death.
Figure 5 – Assessment of oxidative stress markers in dissociated mouse retina.
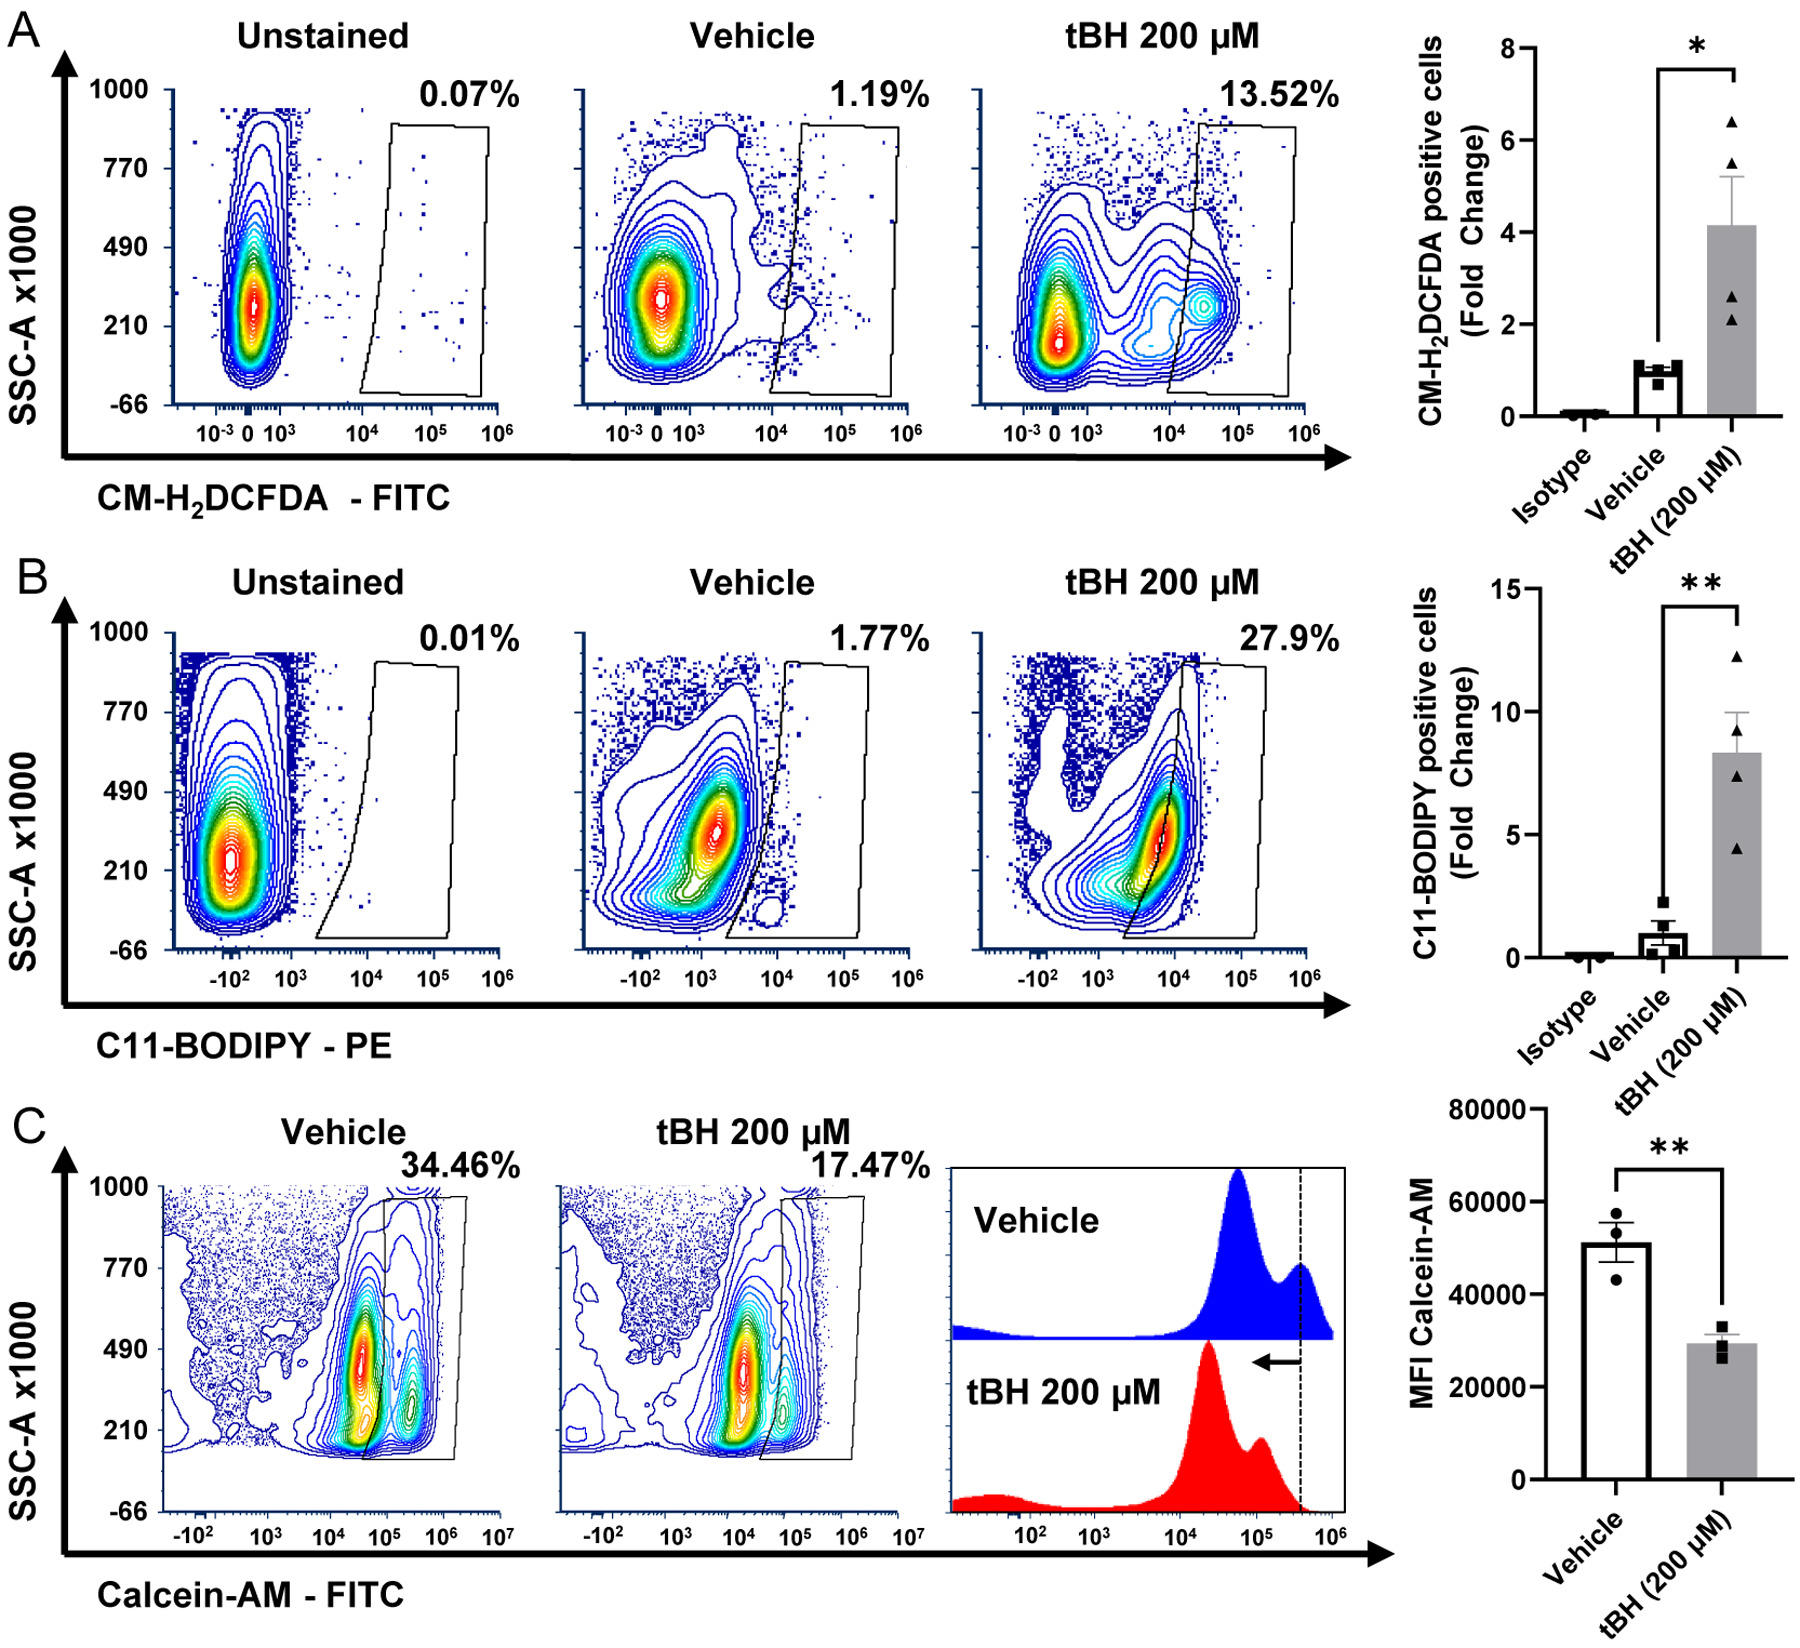
200 μM tBH (final vitreous concentration, tert-butyl hydroperoxide) was injected intravitreally, and retinas were harvested 24 hours later. Contour plots showing a significant increase in (A) CM-H2DCFDA (6-chloromethyl-2’,7’-dichlorodihydrofluorescein diacetate) staining indicating increased levels of reactive oxygen species, and (B) an increase in C11-BODIPY (4,4-difluoro-4-bora-3a,4a-diaza-s-indacene) positive cells indicating lipid peroxidation occurs after treatment with tBH. (C) Calcein-AM fluorescence is shifted to a lower intensity after treatment with tBH, indicating an increase in the labile iron pool retina. The histogram shows a shift in the peak intensity (dotted line) to a lower fluorescent intensity in tBH treated retinas. The graphs to the right of respective contour plots quantify the difference in positive cells between vehicle and tBH treated retinas. N=4. **p<0.01, *p<0.05.
Figure 6 – Demonstration of increased retinal cell death after treatment with tBH using flow cytometric methods.
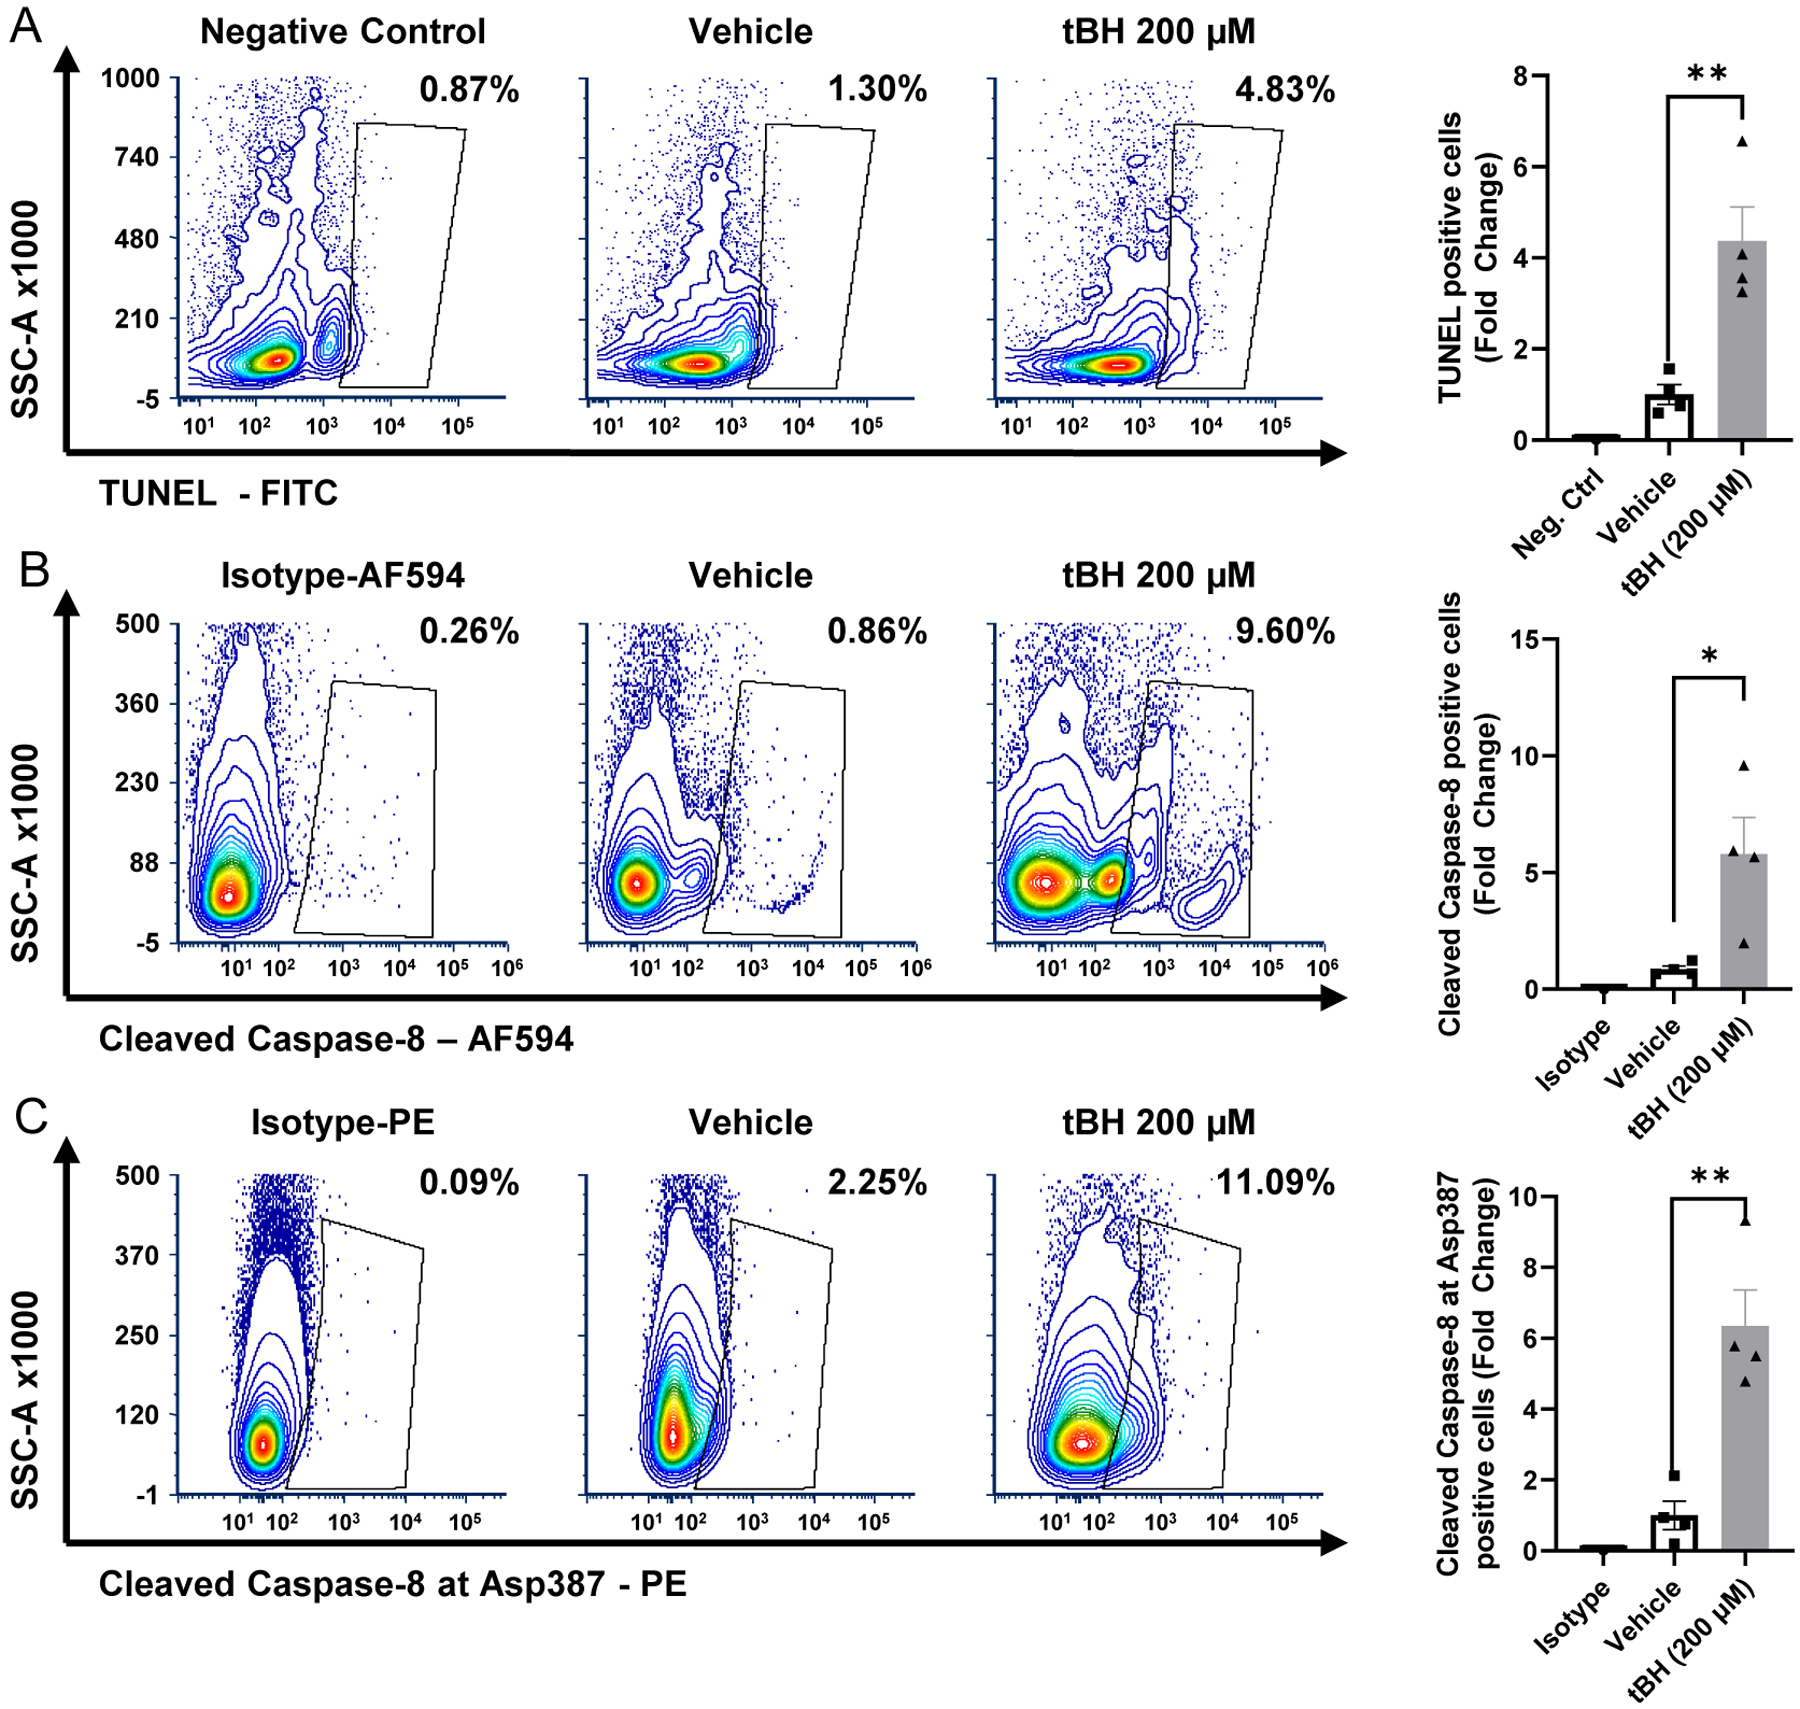
200 μM tBH (final vitreous concentration, tert-butyl hydroperoxide) was injected intravitreally. Retinas were harvested 24 hours later and processed for flow cytometry. Contour plots depicting (A) increased TUNEL (terminal deoxynucleotidyl transferase dUTP nick end labeling), (b) cleaved caspase-8, and (C) caspase-8 cleaved at Asp387 positive cells after tBH treatment. Corresponding bar graphs displayed to the right of the respective contour plots quantify the fold change in positive cells. There was a significant increase in the percentage of TUNEL positive, cleaved caspase-8 positive and caspase-8 cleaved at Asp387 positive cells compared to negative control or isotype control N=4. Alexa Fluor 594 (AF594). **p<0.01, *p<0.05.
4. Potential pitfalls and troubleshooting:
4.1. Retina collection for flow cytometry:
When dissecting the retina from the eye it is essential to remove any adhered retinal pigmented epithelial cells, iris, and ciliary body. Retinal cups contaminated with these tissues increase dissociation time and can lead to cell clumping, which may clog the flow channel during flow analyses. Clumping can also induce variability in data. It is important to remember that dissociation of retinal cells will remove almost all processes of cells (e.g. outer segments in photoreceptors), so if selecting additional markers to enrich for specific cell populations (e.g. photoreceptors) it is crucial to select markers that are not lost due to the shedding of cell processes.
4.2. Calcein-AM gating
Healthy and intact cells should stain highly for Calcein-AM, whereas cells which have excess labile iron will stain much less intensely as the fluorophore is quenched. The shift in fluorescence between the bound and unbound form acts as a readout of the labile iron pool. Instead of gating off the isotype (by setting the gate equal to or less than 1% of cells), the vehicle treated or control group must be used to set the gate around cells which are highly positive for Calcein-AM. This gate is then used for the other groups to assess any shift in fluorescence intensity due to treatment or other effects. This gating strategy is backwards from normal, so it is essential to gate correctly to obtain accurate data.
4.3. Species specificity
Please note that all of the methods presented here were optimized using mouse tissue only. Mice are one of the most common experimental organisms with a variety of models for retinal diseases available. It is imperative for researchers to empirically determine the optimum staining parameters if working with a model other than mice.
Supplementary Material
Highlights.
Flow cytometry can reliably detect and quantitate cell death markers in dissociated retinal cells with improved throughput and efficiency compared to histological methods.
Neuroprotective strategies can be quickly assessed for efficacy using flow cytometry.
Oxidative stress markers in retinal cells can be efficiently quantified using flow cytometry.
Acknowledgments
The authors thank Dr. Katherine Weh for critical review of the manuscript for resubmission. This work utilized the Vision Research Core funded by P30EY007003 from the National Eye Institute (NEI). This work was also supported by the E. Matilda Ziegler Foundation, other grants from the NEI (K08EY031757 and R01EY029675), and an unrestricted grant from the Research to Prevent Blindness within the Department of Ophthalmology and Visual Sciences at the University of Michigan. Figure 1A was Created with Biorender.com
Footnotes
Publisher's Disclaimer: This is a PDF file of an unedited manuscript that has been accepted for publication. As a service to our customers we are providing this early version of the manuscript. The manuscript will undergo copyediting, typesetting, and review of the resulting proof before it is published in its final form. Please note that during the production process errors may be discovered which could affect the content, and all legal disclaimers that apply to the journal pertain.
Data Availability:
All data are available by request to the corresponding authors.
References
- Awwad S, Henein C, Ibeanu N, Khaw PT, Brocchini S, 2020. Preclinical challenges for developing long acting intravitreal medicines. Eur. J. Pharm. Biopharm 153, 130–149. [DOI] [PubMed] [Google Scholar]
- Besirli CG, Chinskey ND, Zheng QD, Zacks DN, 2010. Inhibition of retinal detachment-induced apoptosis in photoreceptors by a small peptide inhibitor of the fas receptor. Invest. Ophthalmol. Vis. Sci 51, 2177–2184. [DOI] [PMC free article] [PubMed] [Google Scholar]
- Campochiaro PA, Iftikhar M, Hafiz G, Akhlaq A, Tsai G, Wehling D, Lu L, Wall GM, Singh MS, Kong X, 2020. Oral N-acetylcysteine improves cone function in retinitis pigmentosa patients in phase I trial. J. Clin. Invest 130, 1527–1541. [DOI] [PMC free article] [PubMed] [Google Scholar]
- Carmody RJ, McGowan AJ, Cotter TG, 1998. Rapid detection of rod photoreceptor apoptosis by flow cytometry. Cytometry 33, 89–92. [DOI] [PubMed] [Google Scholar]
- Chan TC, Wilkinson Berka JL, Deliyanti D, Hunter D, Fung A, Liew G, White A, 2020. The role of reactive oxygen species in the pathogenesis and treatment of retinal diseases. Exp. Eye Res 201, 108255. [DOI] [PubMed] [Google Scholar]
- Charriaut-Marlangue C, Ben-Ari Y, 1995. A cautionary note on the use of the TUNEL stain to determine apoptosis. Neuroreport 7, 61–64. [PubMed] [Google Scholar]
- Chen C, Chen J, Wang Y, Liu Z, Wu Y, 2021. Ferroptosis drives photoreceptor degeneration in mice with defects in all-trans-retinal clearance. J. Biol. Chem 296, 100187. [DOI] [PMC free article] [PubMed] [Google Scholar]
- Chinskey ND, Besirli CG, Zacks DN, 2014. Retinal cell death and current strategies in retinal neuroprotection. Curr. Opin. Ophthalmol 25, 228–233. [DOI] [PubMed] [Google Scholar]
- Daruich A, Le Rouzic Q, Jonet L, Naud MC, Kowalczuk L, Pournaras JA, Boatright JH, Thomas A, Turck N, Moulin A, Behar-Cohen F, Picard E, 2019. Iron is neurotoxic in retinal detachment and transferrin confers neuroprotection. Sci Adv 5, eaau9940. [DOI] [PMC free article] [PubMed] [Google Scholar]
- Dong K, Yan Y, Lu L, Wang Y, Li J, Zhang M, Ding J, 2021. PJ34 Protects Photoreceptors from Cell Death by Inhibiting PARP-1 Induced Parthanatos after Experimental Retinal Detachment. Curr. Eye Res 46, 115–121. [DOI] [PubMed] [Google Scholar]
- Dunaief JL, Dentchev T, Ying GS, Milam AH, 2002. The role of apoptosis in age-related macular degeneration. Arch. Ophthalmol 120, 1435–1442. [DOI] [PubMed] [Google Scholar]
- Hisatomi T, Sakamoto T, Goto Y, Yamanaka I, Oshima Y, Hata Y, Ishibashi T, Inomata H, Susin SA, Kroemer G, 2002. Critical role of photoreceptor apoptosis in functional damage after retinal detachment. Curr. Eye Res 24, 161–172. [DOI] [PubMed] [Google Scholar]
- Le YZ, Zheng L, Zheng W, Ash JD, Agbaga MP, Zhu M, Anderson RE, 2006. Mouse opsin promoter-directed Cre recombinase expression in transgenic mice. Mol. Vis 12, 389–398. [PubMed] [Google Scholar]
- Lo AC, Woo TT, Wong RL, Wong D, 2011. Apoptosis and other cell death mechanisms after retinal detachment: implications for photoreceptor rescue. Ophthalmologica 226 Suppl 1, 10–17. [DOI] [PubMed] [Google Scholar]
- Murakami Y, Miller JW, Vavvas DG, 2011. RIP kinase-mediated necrosis as an alternative mechanisms of photoreceptor death. Oncotarget 2, 497–509. [DOI] [PMC free article] [PubMed] [Google Scholar]
- Nag TC, Kumar P, Wadhwa S, 2017. Age related distribution of 4-hydroxy 2-nonenal immunoreactivity in human retina. Exp. Eye Res 165, 125–135. [DOI] [PubMed] [Google Scholar]
- Newton F, Megaw R, 2020. Mechanisms of Photoreceptor Death in Retinitis Pigmentosa. Genes (Basel) 11. [DOI] [PMC free article] [PubMed] [Google Scholar]
- Pham JH, Johnson GA, Rangan RS, Amankwa CE, Acharya S, Stankowska DL, 2022. Neuroprotection of Rodent and Human Retinal Ganglion Cells In Vitro/Ex Vivo by the Hybrid Small Molecule SA-2. Cells 11. [DOI] [PMC free article] [PubMed] [Google Scholar]
- Ruan Y, Jiang S, Musayeva A, Gericke A, 2020. Oxidative Stress and Vascular Dysfunction in the Retina: Therapeutic Strategies. Antioxidants (Basel) 9. [DOI] [PMC free article] [PubMed] [Google Scholar]
- Shu W, Baumann BH, Song Y, Liu Y, Wu X, Dunaief JL, 2020. Ferrous but not ferric iron sulfate kills photoreceptors and induces photoreceptor-dependent RPE autofluorescence. Redox Biol 34, 101469. [DOI] [PMC free article] [PubMed] [Google Scholar]
- Totsuka K, Ueta T, Uchida T, Roggia MF, Nakagawa S, Vavvas DG, Honjo M, Aihara M, 2019. Oxidative stress induces ferroptotic cell death in retinal pigment epithelial cells. Exp. Eye Res 181, 316–324. [DOI] [PMC free article] [PubMed] [Google Scholar]
- Trichonas G, Murakami Y, Thanos A, Morizane Y, Kayama M, Debouck CM, Hisatomi T, Miller JW, Vavvas DG, 2010. Receptor interacting protein kinases mediate retinal detachment-induced photoreceptor necrosis and compensate for inhibition of apoptosis. Proc. Natl. Acad. Sci. U. S. A 107, 21695–21700. [DOI] [PMC free article] [PubMed] [Google Scholar]
- Tsoka P and Tsilimbaris M (2010), Flow cytometry for the characterization of retinal neural populations and the quantification of retinal apoptosis. Acta Ophthalmologica, 88: 0–0. [Google Scholar]
- Van Noorden CJ, 2001. The history of Z-VAD-FMK, a tool for understanding the significance of caspase inhibition. Acta Histochem. 103, 241–251. [DOI] [PubMed] [Google Scholar]
- Weh E, Lutrzykowska Z, Smith A, Hager H, Pawar M, Wubben TJ, Besirli CG, 2020. Hexokinase 2 is dispensable for photoreceptor development but is required for survival during aging and outer retinal stress. Cell Death Dis. 11, 422. [DOI] [PMC free article] [PubMed] [Google Scholar]
- Winkler BS, 1972. The electroretinogram of the isolated rat retina. Vision Res. 12, 1183–1198. [DOI] [PubMed] [Google Scholar]
- Wubben TJ, Pawar M, Smith A, Toolan K, Hager H, Besirli CG, 2017. Photoreceptor metabolic reprogramming provides survival advantage in acute stress while causing chronic degeneration. Sci. Rep 7, 17863. [DOI] [PMC free article] [PubMed] [Google Scholar]
- Wubben TJ, Pawar M, Weh E, Smith A, Sajjakulnukit P, Zhang L, Dai L, Hager H, Pai MP, Lyssiotis CA, Besirli CG, 2020. Small molecule activation of metabolic enzyme pyruvate kinase muscle isozyme 2, PKM2, circumvents photoreceptor apoptosis. Sci. Rep 10, 2990. [DOI] [PMC free article] [PubMed] [Google Scholar]
- Xu L, Kong L, Wang J, Ash JD, 2018. Stimulation of AMPK prevents degeneration of photoreceptors and the retinal pigment epithelium. Proc. Natl. Acad. Sci. U. S. A 115, 10475–10480. [DOI] [PMC free article] [PubMed] [Google Scholar]
- Zacks DN, Boehlke C, Richards AL, Zheng QD, 2007. Role of the Fas-signaling pathway in photoreceptor neuroprotection. Arch. Ophthalmol 125, 1389–1395. [DOI] [PubMed] [Google Scholar]
- Zacks DN, Hanninen V, Pantcheva M, Ezra E, Grosskreutz C, Miller JW, 2003. Caspase activation in an experimental model of retinal detachment. Invest. Ophthalmol. Vis. Sci 44, 1262–1267. [DOI] [PubMed] [Google Scholar]
- Zacks DN, Zheng QD, Han Y, Bakhru R, Miller JW, 2004. FAS-mediated apoptosis and its relation to intrinsic pathway activation in an experimental model of retinal detachment. Invest. Ophthalmol. Vis. Sci 45, 4563–4569. [DOI] [PubMed] [Google Scholar]
- Zhao T, Guo X, Sun Y, 2021. Iron Accumulation and Lipid Peroxidation in the Aging Retina: Implication of Ferroptosis in Age-Related Macular Degeneration. Aging Dis. 12, 529–551. [DOI] [PMC free article] [PubMed] [Google Scholar]
Associated Data
This section collects any data citations, data availability statements, or supplementary materials included in this article.
Supplementary Materials
Data Availability Statement
All data are available by request to the corresponding authors.