

Abstract
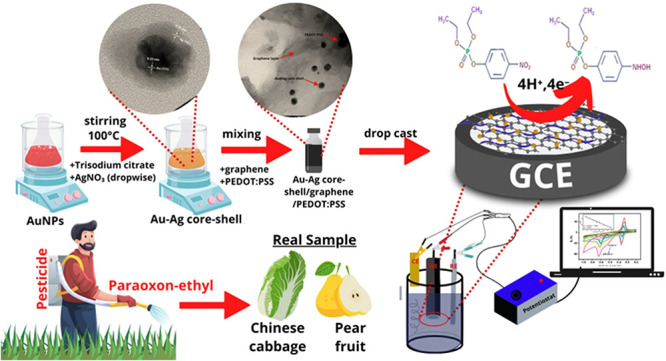
Herein, a nonenzymatic detection of paraoxon-ethyl was developed by modifying a glassy carbon electrode (GCE) with gold–silver core–shell (Au–Ag) nanoparticles combined with the composite of graphene with poly(3,4-ethylenedioxythiophene)/poly(styrenesulfonate) (PEDOT:PSS). These core–shell nanoparticles (Au–Ag) were synthesized using a seed-growth method and characterized using UV–vis spectroscopy and high-resolution transmission electron microscopy (HR-TEM) techniques. Meanwhile, the structural properties, surface morphology and topography, and electrochemical characterization of the composite of Au–Ag core–shell/graphene/PEDOT:PSS were analyzed using infrared spectroscopy, field emission scanning electron microscopy (FE-SEM), atomic force microscopy (AFM), and electrochemical impedance spectroscopy (EIS) techniques. Moreover, the proposed sensor for paraoxon-ethyl detection based on Au–Ag core–shell/graphene/PEDOT:PSS modified GCE demonstrates good electrochemical and electroanalytical performance when investigated with cyclic voltammetry (CV), differential pulse voltammetry (DPV), and chronoamperometry techniques. It was found that the synergistic effect between Au–Ag core–shell nanoparticles and the composite of graphene/PEDOT:PSS provides a higher conductivity and enhanced electrocatalytic activity for paraoxon-ethyl detection at an optimum pH of 7. At pH 7, the proposed sensor for paraoxon-ethyl detection shows a linear range of concentrations from 0.2 to 100 μM with a limit of detection of 10 nM and high sensitivity of 3.24 μA μM–1 cm–2. In addition, the proposed sensor for paraoxon-ethyl confirmed good reproducibility, with the possibility of being further developed as a disposable electrode. This sensor also displayed good selectivity in the presence of several interfering species such as diazinon, carbaryl, ascorbic acid, glucose, nitrite, sodium bicarbonate, and magnesium sulfate. For practical applications, this proposed sensor was employed for the determination of paraoxon-ethyl in real samples (fruits and vegetables) and showed no significant difference from the standard spectrophotometric technique. In conclusion, this proposed sensor might have a potential to be developed as a platform of electrochemical sensors for pesticide detection.
Introduction
The concern about pesticide residue in foods has become a critical issue in modern farming due to excessive and uncontrolled application to agricultural land, which has led to environmental pollution and aquatic pollution. In the literature, the percentage of pesticide sprayed on agricultural crops that reaches the target pest is thought to be less than 0.1%, with the rest contaminating the surrounding environment and left as pesticide residues.1,2 Most pesticide residues are classified as toxic and harmful substances depending on their chemical structures, which can enter the food chain through water, soil, and food including vegetables and fruits.3,4 Moreover, humans can absorb pesticide residue from the environment through their skin and respiratory and digestive systems.5,6 One of the pesticide residues that might occur in the environment and enter the human body via the digestive system is paraoxon-ethyl, which is used in agricultural farming because of its exceptional ability to control and eradicate the population of pests and insects.7,8 The accumulation of trace-level concentrations of paraoxon-ethyl residue in the human body can cause a serious threat to the metabolic,9 immune,10 and central nervous systems.11 Furthermore, the United States Environmental Protection Agency (USEPA) declared that paraoxon-ethyl (one of the most widespread organophosphate insecticides) is a dangerous compound due to its 70% similarity of chemical properties with the nerve agent sarin.12 In the literature, paraoxon-ethyl has a half-life of around 5000 years and is considered the most potent and poisonous insecticide that poses significant health risks to humans.13,14 According to the European Union pesticide database, the maximum residue limit (MRL) of paraoxon-ethyl should be no more than 0.01 mg/L (0.036 μM) in humans and 0.05 mg/kg in plant-based food.15 In addition, the acute toxicity (LD50 values) of paraoxon-ethyl in mice was calculated to be 0.66 mg/kg.16 These factors have led to the prohibition and restriction of paraoxon-ethyl application to agricultural farming in several countries.17,18 As a result, developing a portable, selective, and sensitive detection of paraoxon-ethyl is essential for environmental monitoring, agricultural activities, and health management.
Several analytical methods have been developed to detect the concentration of paraoxon-ethyl in the environmental matrices based on ultraviolet–visible spectroscopy,19 surface-enhanced Raman spectroscopy,20 chemiluminescence,21 high-performance liquid chromatography–mass spectrometry,22 gas chromatography–mass spectrometry,23 quartz crystal microbalance,24 biosensors,25,26 and electrochemical methods.27−29 Although these methods are accurate and trustworthy, their applicability is compromised by their complex pretreatment for sample preparation, overpriced instruments, and the requirement of trained personnel, which make them impractical for daily routine analysis. Electrochemical techniques were developed to address these issues because they can detect very low concentrations of analytes with good reproducibility and selectivity. They are also quick and affordable, and the instruments are simple to operate.30,31
The combination of conductive materials between graphene and poly(3,4-ethylenedioxythiophene)/poly(styrenesulfonate) (PEDOT:PSS) has been extensively employed to enhance conductivity of modified electrodes.32−34 Graphene has been known as an excellent candidate as electrode modifier due to its great conductivity,35 high electron mobility,36 high surface-to-volume ratio,37 and versatility to be modified as a material composite-based electrode.38 Furthermore, graphene might be aggregated because of electrostatic and π–π interactions, which can reduce its conductivity. PEDOT:PSS could employed to avoid the restacking problem between the graphene layers.39,40 In addition, gold–silver core–shell (Au–Ag) as a bimetallic particle has shown a synergistic effect in terms of its optical properties and electrocatalytic activity when employed as an electrode modifier.41 The employment of Au–Ag core–shell modified electrodes has been investigated for the quantitative detection of antimicrobial drugs,42 redox protein,43,44 heavy metals,45,46 fungicides,47 and antidepressants.48 However, to the best of our knowledge, no previous work has reported the employment of a combination between Au–Ag core–shell nanoparticles with the composite of graphene and PEDOT:PSS as a platform for electrochemical sensors. Therefore, it would be worthwhile to investigate the application of these material composites deposited onto the surface of a glassy carbon electrode (GCE) for paraoxon-ethyl detection.
In this work, we developed an electrochemical sensor based on Au–Ag core–shell nanoparticles combined with a graphene/PEDOT:PSS composite modified glassy carbon electrode (GCE) for quantitative determination of paraoxon-ethyl in samples of fruits and vegetables. The prepared modified electrode shows remarkable electroanalytical performance for paraoxon-ethyl detection with high sensitivity and selectivity with a low limit of detection via an electrocatalytic reduction process. The concentration of paraoxon-ethyl obtained from this proposed sensor was then compared with the standard UV–vis spectrophotometric technique using statistical analysis and resulted in no significant difference between these two methods. Thus, this developed method might have potency to be further employed for the determination of paraoxon-ethyl in practical applications.
Reagents and Apparatus
Poly(3,4-dioxythiophene)/poly(styrene-4-sulfonate) (PEDOT:PSS) (CAS: 155090-83-8), graphene powder (Jiangsu XFNano Materials Tech, China), HAuCl4, H2SO4, KMnO4, H2O2 30%, Na2HPO4, NaH2PO4, KCl, diethyl 4-nitrophenyl phosphate or paraoxon-ethyl (POE, CAS: 311-45-5), NaNO2, FeSO4, Zn(CH3CO2)2, NH4NO3, chlorophenol, triclosan, and ascorbic acid were obtained from Sigma-Aldrich Ltd. and used without further purification.
All electrochemical experiments were performed in a three-electrode system, i.e., a glassy carbon electrode (GCE) (3 mm diameter, IJ Cambria Scientific) as the working electrode, silver/silver chloride (3 M) as reference electrode, and platinum wire as an auxiliary electrode. The experiments of electrochemical studies were conducted using a PalmSens Emstat 3 (ES316U669) (Houten, The Netherlands) equipped with the PSTrace 5.9 software using cyclic voltammetry (CV) and differential pulse voltammetry (DPV) techniques. All voltammetric data were processed and interpreted using Origin Pro 7.0 (OriginLab, Northampton, USA). In addition, the investigation of electrochemical impedance spectroscopy (EIS) of the modified electrode was performed using a Sensit BT.SNS (Houten, The Netherlands). The UV–vis spectra of the Au–Ag core–shell were obtained using a UV–visible spectrophotometer (M51 Bel Engineering). Meanwhile, the surface morphology of the synthesized Au–Ag core–shell was characterized using scanning electron microscopy (SEM; JEOL JSM-IT200 InTouch Scope) and transmission electron microscopy (TEM; FEI Tecnai G2 20 S-Twin). Furthermore, the surface topography of the Au–Ag core–shell was characterized using atomic force microscopy (AFM; Park System NX 10).
Experimental Section
Synthesis and Characterization of the Au–Ag Core–Shell
The synthesis of the Au–Ag core–shell was carried out using the seed and growth method according to previous works as reported in ref (49) from gold and silver salt solution and trisodium citrate as reducing agent. The detailed procedure is as follows: The seed solution of gold was obtained by preparing 50 mL of 0.01% HAuCl4 solution and then heating it to 100 °C with constant stirring. Next, 2 mL of 1% trisodium citrate solution was quickly added to the HAuCl4 solution and vigorously stirred for 20 min. The seed solution was kept at room temperature until the solution changed to a dark red color, indicating the formation of gold nanoparticles (AuNPs) in the seed solution. Then, 25 mL of AuNP seed solution was heated at 100 °C followed by a subsequent addition of 4 mL of 1% trisodium citrate and 2.5 mL of 10 mM AgNO3 dropwise in the condition of vigorous stirring. The solution color will be changed into yellow, which indicates that the formation of the Au–Ag core–shell was completed. The reaction of the Au–Ag core–shell can be described as follows: (1) the reduction of Au3+ from gold salts (HAuCl4) into Au0 to form a core consisting of citrate-stabilized AuNPs core and (2) trisodium citrate also reduced AgNO3 into Ag0, which capped the citrate-stabilized AuNP core to produce Au–Ag core–shell nanoparticles. The chemical reaction involved in the process of the Au–Ag core–shell is as follows:
| 1 |
| 2 |
Then, the obtained solution containing the Au–Ag core–shell was characterized using a UV–vis spectrophotometer (M51). In addition, the solution containing a Au–Ag core–shell was further investigated using FESEM and TEM techniques.
Modification of GCE with the Au–Ag Core–Shell/Graphene/PEDOT:PSS Composite
The electrode modifier for GCE was prepared by mixing graphene powder with PEDOT:PSS at the composition ratio of 7:3 by weight. Then, 1.0 mL of the solution containing the Au–Ag core–shell was added to 2 mg of the composite of graphene and PEDOT:PSS at the weight ratio of 7:3. The composite containing a mixture of Au–Ag core–shell with graphene/PEDOT:PSS (7:3) was then sonicated for 1 h and continuously stirred for 1 h to obtain the composite solution in the concentration of 2 mg/mL. Next, 5 μL of the composite solution was drop casted onto the GCE surface followed by drying in an oven at 80 °C for 5 min. The surface morphology of the modified electrode was characterized using SEM and TEM techniques, and AFM analysis was performed to obtain the information about the topography of the electrode surface.
Evaluation of the Electrochemical Behavior of the Modified Electrodes
The evaluation of the electrochemical behavior of GCE, GCE-modified graphene/PEDOT:PSS/GCE, and GCE-modified Au–Ag core–shell/graphene/PEDOT:PSS was performed using a cyclic voltammetry (CV) technique by measuring 1.0 mM K3[Fe(CN)6] solution in 0.1 M KCl. The experimental parameters used for the investigation of electrochemical behavior were determined using the CV technique at the potential range from −1.0 to +0.2 V with variation of scan rates (25, 50, 75, 100, 150, and 200 mV s–1). In addition, the conductivity of three different electrodes was also determined by measuring 1.0 mM K3[Fe(CN)6] solution in 0.1 M KCl using electrochemical impedance spectroscopy (EIS). A similar experiment using the CV technique with the same experimental parameters as above was also performed using paraoxon to determine the electrochemically active surface (ECSA) and the electron transfer coefficient. Furthermore, the diffusion coefficient and catalytic rate constant were determined using the chronoamperometry technique by measuring paraoxon in concentrations of 20, 40, 60, 800, and 100 μM in 0.1 M of pH 7 phosphate buffer.
Evaluation of Electroanalytical Performance of the Modified Electrode
Linearity, Limit of Detection (LOD), and Limit of Quantification (LOQ)
The linearity of GCE-modified Au–Ag core–shell/graphene/PEDOT:PSS was evaluated by measuring paraoxon at the concentration range of 0.2–100 μM in 0.1 M phosphate buffer pH 7 using the DPV technique. The experimental parameters for the DPV technique were set at a potential range of 0 to −1.0 V vs Ag/AgCl, a potential step of 10 mV, a potential pulse of 50 mV, a pulse time of 0.05 s, and a scan rate of 50 mV/s. The linearity was determined from the calibration curve from the paraoxon concentration versus its current response. Then, the linear regression and the coefficient of determination (R2) can be calculated, with the highest sensitivity indicated by R2 ≈ 1. The limit of detection (LOD) and limit of quantification (LOQ) were subsequently determined based on the signal-to-noise (S/N) ratio for LOD (S/N ≈ 3) and LOQ (S/N ≈ 10). Furthermore, the sensitivity of GCE-modified Au–Ag/graphene/PEDOT:PSS for paraoxon measurements can be determined based on the slope of a calibration curve.
Reproducibility, Stability, and Selectivity
The electrode reproducibility was evaluated by measuring 80 μM paraoxon in 0.1 M of pH 7 phosphate buffer using five different electrodes based on GCE-modified Au–Ag core–shell/graphene/PEDOT:PSS. Meanwhile, the electrode stability was investigated by also measuring 0.1 M of pH 7 phosphate buffer containing 80 μM paraoxon using a similar electrode for 3 consecutive days. In addition, the electrode selectivity was evaluated by measuring 80 μM paraoxon in 0.1 M pH 7 phosphate buffer in the presence of several interfering species, such as diazinon (DZN), ascorbic acid (AA), glucose, carbaryl, nitrite, NH4Cl, NaHCO3, and MgSO4. The concentration ratio between paraoxon and interfering species was adjusted to 1:1. All electrochemical measurements were performed using the differential pulse voltammetry (DPV) technique at a potential range from 0 to −1.0 V, a scan rate of 50 mV s–1, a potential step of 10 mV, a potential pulse of 50 mV, and a pulse time of 50 ms.
Detection of Paraoxon in Fruit and Vegetable Samples
To assess the applicability of the proposed sensor, a GCE-modified Au–Ag core–shell/graphene/PEDOT:PSS was employed for paraoxon detection in the vegetable and fruit samples using the standard addition method. The Chinese cabbage and pear were chosen to represent the vegetable and fruit samples and obtained from the local store in the Bogor area, West Java, Indonesia. The parts of the samples used for analysis were the outer leaf of Chinese cabbage and the skin of pear fruit. Both samples of Chinese cabbage and pear were directly analyzed without the washing process to avoid the removal of residual pesticide from the samples. Each 10 g of both samples of cabbage and peel of pear was mashed and extracted using 30 mL of 0.1 M phosphate buffer pH 7 followed by the sonication process for 40 min. Each extract obtained from the fresh sample was then filtered followed by spiking with 5 mL of paraoxon and diluted with 0.1 M of pH 7 phosphate buffer to obtain the final concentration from 5, 10, 15, 20, and 25 μM. The concentration of paraoxon in the fresh sample (Ca) can be calculated as an x-intercept of the calibration curve using the following equation:
where CA is the concentration of paraoxon in the sample of cabbage or pear, V0 is the initial volume of the fresh sample of cabbage or pear, Vf is the final volume of the spiked fresh sample solution, and x-intercept is obtained when y is equivalent to zero.
The concentration of paraoxon in the fresh sample of vegetables and fruit determined with the proposed sensor was also compared with the standard methods using the spectrophotometry technique using a similar pretreatment process.50 Briefly, the standard solution of paraoxon was dissolved in 0.1 M NaOH (pH ≈13) until the paraoxon solution changed color from colorless to yellow. Then, 5 mL of cabbage and pear was spiked with the standard solution of paraoxon-ethyl in a series of concentrations of 5, 10, 15, 20, and 25 μM followed by dilution in 0.1 M NaOH. The absorbance of the spiked solution of a fresh sample containing paraoxon was then measured using a UV–visible spectrophotometer at a maximum wavelength of 400 nm. The concentration of paraoxon in samples was calculated based on the x-intercept equation as above and its results were compared with electrochemical methods using a statistical analysis at a 95% confidence interval.
Results and Discussion
Characterization of the Au–Ag Core–Shell Using UV–Vis Spectroscopy and TEM
Figure 1A depicts the synthetic strategy of Au–Ag core–shell nanoparticles by forming silver nanoshells onto seeds of citrate-stabilized gold nanoparticles (AuNPs) that act as nucleation sites. Besides acting as a stabilizer for AuNPs, citrate also causes reduction of Au3+ into Au. The successful formation of AuNP in the solution can be traced back to the color of the solution changing from light yellow into wine red and its maximum absorbance of AuNPs obtained at 524 nm (Figure 1B). The average size of the synthesized AuNPs can be calculated as ∼28 nm based on the calculation from the Haiss equation.51 However, when silver was coated with citrate-stabilized AuNPs to form a Au–Ag core–shell, its maximum absorbance was shifted to 485 nm (Figure 1B). This blue shift of absorbance into a lower wavelength is due to the presence of silver nanoparticles in the shell and the formation of Au–Ag core–shell in the solution.52 In addition, based on transmission electron microscopy (TEM) analysis with its size distribution measurements from 100 nanoparticles of the Au–Ag core–shell (Figure 1C), the average size of this core–shell is approximately 48 nm. Furthermore, the obtained HR-TEM image obtained from a single Au–Ag core–shell revealed the distinct difference between the gold core as a darker shade and the silver shell as a lighter color as shown in Figure 1D. The HR-TEM images also confirm that clear lattice fringes with fringe spacing of 0.23 nm match with the 111 plane for the gold core and those with 0.24 nm correspond to the 101 plane for the silver shell. The selected area electron diffraction (SAED) pattern of this core–shell metal nanoparticle as shown in Figure 1E also reveals several interplanar distances with corresponding planes for gold as 2.44 Å (101), silver as 2.30 Å (111), and Au–Ag core–shell as 2.02 Å (200).
Figure 1.

(A) Schematic illustration of the synthesis of the Au–Ag core–shell using citrate as a stabilizer. (B) UV–vis spectra of AuNPs and Au–Ag core–shell. (C) TEM Au–Ag core–shell. Inset: diameter distribution of the Au core and Au–Ag core–shell. (D) HRTEM of the Au–Ag core–shell. (E) SAED pattern for the Au–Ag core–shell.
Characterization of the Au–Ag Core–Shell Combined with the Graphene-PEDOT:PSS Composite Using FTIR Spectroscopy, FESEM, and AFM Techniques
FTIR spectroscopy was employed to study the successful integration between graphene and PEDOT:PSS as an electrode modifier for glassy carbon electrodes. As seen in Figure 2A, only a few absorption signals of graphene were observed as a result of the small difference in the state of charges between the graphene layers.53 Meanwhile, PEDOT:PSS shows several characteristic peaks at 840 and 980 (C–S stretching in the thiophene ring), 1050 (C–O stretching), 1400 (S=O stretching), and 1600 (C=C stretching) and a broad peak at 3500 cm–1 (O–H stretching). However, when graphene was combined with PEDOT:PSS, it can be seen that the previously mentioned infrared signals of PEDOT:PSS were mirrored in the graphene-PEDOT:PSS composite. This result confirms that the backbone of PEDOT:PSS has been successfully integrated into the graphene structure. Further investigation of the Au–Ag core–shell/graphene-PEDOT:PSS composite using TEM analysis (Figure 2B) revealed that the Au–Ag core–shell embedded in the graphene-PEDOT:PSS nanocomposite. In addition, the SAED pattern of Au–Ag core–shell/graphene/PEDOT:PSS (Figure 2C) also confirms the interplanar distance for gold as 2.34 Å (111) plane; silver as 2.41 Å (101) plane; Au–Ag core–shell as 1.23 Å (311), 1.41 Å (220), and 2.08 Å (200) plane; and graphene layer as 3.34 Å (002) plane.
Figure 2.

(A) Infrared spectrum of graphene, PEDOT:PSS, and graphene:PEDOT:PSS composite. (B) TEM image of Au–Ag core–shell/graphene/PEDOT:PSS. (C) The SAED pattern for Au–Ag/graphene/PEDOT:PSS composite. SEM images were obtained from (D) graphene, (E) graphene:PEDOT:PSS composite, and (F) Au–Ag core–shell/graphene/PEDOT:PSS. AFM images of (G) graphene/PEDOT:PSS composite and (H) Au–Ag core–shell/graphene/PEDOT:PSS.
The surface morphologies of graphene, graphene-PEDOT:PSS composite, and Au–Ag core–shell/graphene/PEDOT:PSS nanocomposite were investigated using the field emission scanning electron microscopy (FESEM) technique. Figure 2D reveals that the surface of graphene has a flake-like morphology with some agglomerates made up of several sheets of graphene layers. However, when graphene is combined with PEDOT:PSS, it can diffuse within the stacked layer, and a flake-like morphology leads to the formation of a thin layer on the graphene surface as displayed in Figure 2E. It is known that the π–π interactions between graphene layers and PEDOT:PSS helps to stabilize the formation of a tightly coated polymeric layer on the graphene surface.54,55 Further, TEM analysis of Au–Ag core–shell/graphene/PEDOT:PSS as shown in Figure 2F confirms the homogeneous distribution of these core–shell nanoparticles on the surface of the graphene/PEDOT:PSS composite.
To further understand the impact of Au–Ag core–shell integration on the surface of the graphene-PEDOT:PSS composite, the atomic force microscopy (AFM) technique was employed to obtain information about the surface topography and its roughness. Figure 2G,H shows 2D and 3D images of AFM obtained from the graphene/PEDOT:PSS composite and Au–Ag core–shell/graphene/PEDOT:PSS, respectively. Both AFM images were investigated in a scan area of 1 × 1 μm with a scan rate of 0.75 Hz. It was observed that the value of root-mean-square roughness (Rq) was increased from 26.6 nm for the graphene-PEDOT:PSS composite to 41.5 nm for Au–Ag core–shell/graphene/PEDOT:PSS. In addition, the value of peak-to-valley (Rpv) was also enhanced from 149.8 nm for the graphene-PEDOT:PSS composite to 263.9 nm for Au–Ag core–shell/graphene/PEDOT:PSS. The increase of both roughness (Rq) and peak-to-valley (Rpv) could be attributed to the higher volume ratio of the Au–Ag core–shell embedded to the graphene/PEDOT:PSS composite that leads to a higher amount of these core–shell nanoparticles penetrating the nanocomposite layer.56,57 In addition, this increase could also minimize the electron diffusion length, which could facilitate a faster charge transfer on the active layer of the Au–Ag/graphene/PEDOT:PSS nanocomposite. The enhanced properties of these core–shell nanoparticles modified with the nanocarbon composite would be expected to be beneficial when they were employed as a material for electrode modifier as will be investigated in the next sections.
Electrochemical Characterization of the Modified Electrodes Using Cyclic Voltammetry (CV) and Electrochemical Impedance Spectroscopy (EIS) Techniques
The electrochemical characterization was performed on the modified electrodes to obtain information about the fundamental characteristics and properties of the electrodes before they would be investigated further for sensing applications. One way to investigate the fundamental properties at the electrode/electrolyte interface is using electrochemical impedance spectroscopy (EIS) analysis for the modified electrodes. Figure 3A shows the Nyquist plot obtained from the measurements of 1 mM K3[Fe(CN)6] in 0.1 M of pH 7 phosphate buffer with a frequency range from 1 × 10⁶ to 5 × 10³ Hz and Eac = 10 mV at an open constant potential using four different modified electrodes (bare GCE, graphene/GCE, graphene/PEDOT:PSS/GCE, and Au–Ag/graphene/PEDOT:PSS/GCE). The diameter size of the semicircle obtained from the impedance measurement of each modified electrode corresponds to the charge transfer resistance at the interface of electrode/electrolyte. In general, a larger diameter of the semicircle is related to less resistance and a faster charge transfer process at the electrode/electrolyte interface.58 Thus, the value of electrode resistance (R2) can be obtained by fitting the Nyquist plot from each modified electrode to the equivalent Randles circuit as displayed in the inset of Figure 3A. Based on Figure 3A, the order of diameter size of the obtained Nyquist plot from each modified electrode from the largest to smallest with its corresponding resistance value is as follows: bare GCE (149 Ω), graphene/GCE (85 Ω), graphene/PEDOT:PSS/GCE (71 Ω), and Au–Ag core–shell/graphene/PEDOT:PSS/GCE (61 Ω). The lowest resistance value observed at Au–Ag core–shell/graphene/PEDOT:PSS/GCE among other electrodes indicates an enhanced electronic conductivity of the modified electrodes that could be attributed to two main points. First, the presence of the Au–Ag core–shell in the graphene/PEDOT:PSS composite could facilitate a faster electron transfer process at the electrolyte/electrode interface.59 Second, the synergistic effect between graphene and PEDOT:PSS as conductive materials could lower resistance at the electrolyte/electrode interface and increase the electron transfer rate as well.60,61 Thus, the enhanced electrocatalytic activity of this metal–carbon–polymer nanocomposite due to higher electronic conductivity might be intriguing to further investigate it as electrode modifier for electrochemical sensing purposes particularly for pesticide detection.
Figure 3.

(A) The Nyquist plot was obtained at the frequency range 2 × 10⁵ to 1 × 10³ Hz (Eac = 6 mV, Edc = 0.2 V) at open circuit potential from the measurement of 1 mM K3[Fe(CN)6] in 0.1 M of pH 7 phosphate buffer using four modified electrodes (bare GCE, graphene-modified GCE, graphene/PEDOT:PSS-modified GCE, and Au–Ag/graphene/PEDOT:PSS-modified GCE). Voltammogram of 1 mM K3[Fe(CN)6] in 0.1 M pH 7 phosphate buffer measured with (B) bare GCE, (C) graphene/PEDOT:PSS-modified GCE, and (D) Au–Ag core–shell/graphene/PEDOT:PSS-modified GCE.
Next, the effect of scan rate was investigated by measuring 1 mM K3[Fe(CN)6] in 0.1 M of pH 7 phosphate buffer with the cyclic voltammetry (CV) technique at various scan rates from 25 to 250 mV s–1. The investigation of scan rate effect was performed using three different electrodes (bare GCE, graphene/PEDOT:PSS/GCE, and Au–Ag core–shell/graphene/PEDOT:PSS/GCE). As displayed in Figure 3B, the bare GCE shows both increasing peaks for oxidation (Ipa) and reduction (Ipc) with the corresponding calibration plot of Ipa versus v1/2 (Ipa = 0.2256x – 0.5575, R2 = 0.9912) and Ipc versus v1/2 (Ipc = −0.2457x + 0.3479, R2 = 0.9852). Meanwhile, graphene/PEDOT:PSS/GCE displays a linear relationship with the corresponding calibration plot of Ipa versus v1/2 (Ipa = 2.8847x – 9.9743, R2 = 0.9913) and Ipc versus v1/2 (Ipc = −2.4571x + 5.700, R2 = 0.9899), as shown in Figure 3C. In addition, Au–Ag core–shell/graphene/PEDOT:PSS/GCE (Figure 3D) exhibits a linear plot with the corresponding regression equation of Ipa versus v1/2 = 3.9425x – 12.878, R2 = 0.9934) and Ipc versus v1/2 = −4.1157x + 12.759, R2 = 0.9899). All these results show an excellent linear relationship that confirmed that the electrochemical reaction of electroactive species on the surface of modified electrode was controlled by diffusion processes. Furthermore, the effective area for bare GCE, graphene/PEDOT:PSS/GCE, and Au–Ag core–shell/graphene/PEDOT:PSS/GCE can be calculated based on the Randles–Sevcik equation:
where ip is the peak current for the oxidation or reduction of K3[Fe(CN)6] (ampere), n is the number of electrons involved in the redox reaction of K3[Fe(CN)6] (1), D is the diffusion coefficient (6.70 × 10⁻⁶ cm2 s–1 as reported in ref (62)), A is the effective area electrode (cm2), ν is the scan rate (V s–1), and C is the concentration of K3[Fe(CN)6] solution (mol cm–3). It can be calculated that the effective surface area for bare GCE, graphene/PEDOT:PSS/GCE, and Au–Ag core–shell/graphene/PEDOT:PSS/GCE is 0.008, 0.084, and 0.115 cm2, respectively. This result reveals that the effective surface area for Au–Ag core–shell/graphene/PEDOT:PSS-modified GCE was roughly 14 times higher than that of the unmodified GCE. Therefore, the improvement of the effective surface area for the Au–Ag core–shell/graphene/PEDOT:PSS modified GCE is expected to enhance the electrocatalytic activity toward pesticide detection particularly for paraoxon sensing compared with the unmodified GCE.
Electroanalytical Behavior of the Modified Electrode for Paraoxon-ethyl Detection
At first, the unmodified GCE was employed to investigate the electrochemical behavior for paraoxon-ethyl detection. Figure 4A shows the cyclic voltammogram (CV) obtained at a scan rate of 50 mV s–1 for the measurements of 1 mM paraoxon-ethyl in 0.1 M of pH 7 phosphate buffer, which was first scanned from 0 to −1 V and reversed back to +0.6 V vs Ag/AgCl. It can be seen from this CV that there is a cathodic peak observed at −0.6 V vs Ag/AgCl with two additional peaks for oxidation and reduction displayed at 0.07 and −0.16 V vs AgCl, respectively. The first cathodic peak observed at −0.6 V vs Ag/AgCl can be attributed to the direct reduction of paraoxon-ethyl into phenylhydroxylamine involving the transfer processes of four electrons and four protons63 (Figure 4B, system I). Meanwhile, the subsequent reversible redox processes for both anodic (B) and cathodic (C) peaks could be related to the formation of hydroxylamine to the nitroso group requiring the transfer of two electrons and two protons64 (Figure 4B, system II). Thus, we decided to focus on investigating the first electrochemical reduction of paraoxon-ethyl into phenylhydroxylamine on scanning toward a cathodic direction.
Figure 4.

(A) Cyclic voltammogram obtained at a scan rate of 50 mV s–1 from measuring 1 mM paraoxon in 0.1 M of pH 7 phosphate buffer using bare GCE. (B) The complete electrochemical reaction of paraoxon involving its oxidation and reduction processes at bare GCE, (C) Voltammograms obtained at a scan rate of 50 mV s–1 for the measurements of 100 μM paraoxon-ethyl in 0.1 M of pH 7 phosphate buffer (solid line) and the measurements of electrolyte solution (dashed line). (D) The current response (Ipc) of 100 μM paraoxon in 0.1 M of phosphate buffer at a pH range from 4 to 10 measured with Au–Ag core–shell/graphene/PEDOT:PSS/GCE. (E) Schematic illustration of the interaction between Au–Ag core–shell, graphene, and PEDOT:PSS on the surface of GCE.
Figure 4C shows the electrochemical characterization of 100 μM paraoxon-ethyl in 0.1 M of pH 7 phosphate buffer measured with four different electrodes (bare GCE, graphene/GCE, graphene/PEDOT:PSS/GCE, and Au–Ag core–shell/graphene/PEDOT:PSS/GCE) using DPV techniques. From this figure, it can be seen that there is a shift in the peak reduction potential of paraoxon-ethyl when it was measured with Au–Ag core–shell/graphene/PEDOT:PSS/GCE to a potential −0.5 V vs AgCl compared to other modified electrodes. In addition, the cathodic peak current of paraoxon-ethyl at this modified electrode is shown to be more than 6-fold higher than bare GCE, depicting the significant electrocatalytic activity of Au–Ag core–shell/graphene/PEDOT:PSS. It is also observed from Figure 4D that the highest current for paraoxon-ethyl reduction at Au–Ag core–shell/graphene/PEDOT:PSS/GCE was observed at pH 7 in a pH range from 4 to 10. The lowered intensity of peak current for paraoxon-ethyl reduction in acidic or alkaline conditions could be attributed to its decomposition processes in both media.65 Then, pH 7 was chosen as the optimum pH for subsequent investigation of paraoxon-ethyl measurements using this modified electrode.
Figure 4E displays the schematic illustration of chemical interaction between graphene and PEDOT:PSS as conductive materials with Au–Ag core–shell as an electron channel on the surface of GCE. The improved performance of the modified electrodes could be associated with two parallel synergistic phenomena that occur on the surface of Au–Ag core–shell/graphene/PEDOT:PSS modified GCE. The first is due to π–π interactions between graphene with PEDOT:PSS, whose polymeric structure can be intercalated within graphene layers and thus could enhance the conductivity of the material composite.66
In addition, π–π interactions may also occur between the aromatic moiety of paraoxon-ethyl with graphene and PSS to improve the electrocatalytic redox process on the surface of modified electrodes.67 Second, the hydrogen interaction occurs between oxygen in nitro (NO2–) and orthophosphate (PO4–) functional groups from the chemical structure of paraoxon-ethyl with sulfonic acid functional groups (−SO3H) in the chain structure of PSS. Therefore, all these possible chemical interactions may occur on the surface of the modified electrode possessing the highest electrocatalytic activity that is due to the synergistic effect between Au–Ag core–shell, graphene, and PEDOT:PSS.
The effect of scan rates on the cathodic peak current was investigated by measuring 100 μM paraoxon-ethyl in 0.1 M of pH 7 phosphate buffer at different scan rates (10, 25, 50, 75, 100, 150, 200, and 250 mV s–1) using Au–Ag core–shell/graphene/PEDOT:PSS/GCE. As displayed in Figure 5A, the peak current of paraoxon-ethyl reduction (Ipc) is linearly proportional with the scan rate from 10 to 250 mV s–1. Based on the inset of Figure 5A, a corresponding calibration plot of Ipc vs v1/2 (Ipc = −1.4676x – 1.6804; R2 = 0.9910) can be obtained, which defines an excellent calibration curve. This result also confirms that the electrochemical reduction process of paraoxon-ethyl on the surface of Au–Ag core–shell/graphene/PEDOT:PSS was controlled by diffusion phenomena. In addition, the potential of cathodic peak (Epc) for paraoxon-ethyl reduction negatively shifted as the scan rates increased when it was measured with this modified electrode. Based on Figure 5B, the Epc for paraoxon-ethyl reduction shifted linearly with the natural logarithm of scan rate (ln v) with the increasing scan rates from 10 to 250 mV s–1. The obtained linear regression was Epc = −0.0143x – 0.5041; R2 = 0.9904 as shown in Figure 5B. Thus, the kinetic parameters for the electrochemical reduction process of paraoxon-ethyl can be determined according to Laviron’s theory, as follows:
where n is the number of transferred electrons, α is the coefficient for electron transfer, ks is the electron transfer rate constant, F is the Faraday constant, R is the universal gas constant, T is the absolute temperature, v is the scan rate, Eθ is the formal potential, and Kθ is the standard potential. It was obtained from the above calculations that the values for α and n are 0.45 (equivalent to 0.5) and 3.5 (equivalent to 4), respectively. Meanwhile, the calculated value for ks is 3.50 s–1, which is still comparable to the values reported in the previous works (1.10 s–1 as reported in ref (68)).
Figure 5.

(A) Voltammogram of 100 μM paraoxon in 0.1 M of pH 7 phosphate buffer at various scan rates using Au–Ag core–shell/graphene/PEDOT:PSS/GCE. (B) The linear relationship between natural logarithm of the scan rate (ln v) and peak potential (Epc) of paraoxon measured with Au–Ag core–shell/graphene/PEDOT:PSS/GCE. (C) Chronoamperograms paraoxon (20–100 μM) in 0.1 M of pH 7 phosphate buffer using Au–Ag core–shell/graphene/PEDOT:PSS/GCE at the applied potential (Edc) of −0.64 V vs Ag/AgCl; inset: Cottrel plot from Figure 4G. (D) The corresponding calibration plot of paraoxon measurements versus their slopes obtained from the Cottrell plot measured with Au–Ag core–shell/graphene/PEDOT:PSS/GCE. (E) Galus plot (t1/2 versus IC/IL) obtained from the chronoamperometric measurement of 100 μM paraoxon in 0.1 M pH 7 phosphate buffer.
The chronoamperometric studies were conducted to determine the diffusion coefficient in a series of concentrations of paraoxon-ethyl in 0.1 M pH 7 phosphate buffer using Au–Ag core–shell/graphene/PEDOT:PSS/GCE as a working electrode. As displayed in Figure 5C, the chronoamperograms show an increasing cathodic current of paraoxon-ethyl reduction corresponding to the increasing concentration of paraoxon-ethyl varying from 20 to 100 μM. Then, a diffusion coefficient (D) of paraoxon-ethyl can be determined using the Cottrell equation as follows:
where n is the total number of electrons involved in the reduction of paraoxon-ethyl (4), D is the diffusion coefficient for paraoxon-ethyl (cm2 s–1), and A is the electrode area (0.115 cm2). It can be seen in Figure 5D that the plot of I vs t–1/2 at various concentrations of paraoxon-ethyl ranging from 20 to 100 μM was linearly proportional. The calculated diffusion coefficient for paraoxon-ethyl detection using Au–Ag core–shell/graphene/PEDOT:PSS was 4.45 × 10⁻⁷ cm2 s–1, which is also comparable with previous studies (9.19 × 10 –6 cm 2 s –1 as reported in ref (69)). In addition, the catalytic rate constant can be determined using the slope of the IC/IL vs t1/2 as shown in Figure 5E following the equation below:
where IC is the catalytic current of paraoxon-ethyl reduction using Au–Ag core–shell/graphene/PEDOT:PSS/GCE, IL is the limiting current in the absence of paraoxon-ethyl (A), kh is the catalytic rate constant (L mol–1 s–1), C is the concentration of paraoxon-ethyl (mol L–1), and t is the experiment time (s). On the basis of this equation, it can be derived that the catalytic rate constant (kh) for the paraoxon-ethyl reduction using this modified electrode is 1.98 × 10³ L mol–1 s–1, which is proportional to the value reported in previous studies (5.88 × 10³ L mol–1 s–1 as reported in ref (70) and 2.25 × 10³ L mol–1 s–1 as reported in ref (71)).
Electroanalytical Performance of Au–Ag Core–Shell/Graphene/PEDOT:PSS/GCE for Paraoxon-ethyl Detection
The electroanalytical performance of Au–Ag core–shell/graphene/PEDOT:PSS/GCE was evaluated in terms of several parameters such as linearity, limit of detection (LOD), limit of quantitation (LOQ), reproducibility, stability, and selectivity toward several interfering species. Figure 6A shows the evaluation of the linearity derived from the DPV measurements at a scan rate of 50 mV s–1 for paraoxon-ethyl in a concentration range from 0.2 to 100 μM in 0.1 M pH 7 phosphate buffer. This figure clearly indicates that the intensity of peak current increased linearly with the increasing concentration of paraoxon-ethyl with the corresponding calibration plot at a range of 0.2–1 μM (Ipc = 3.2467x + 0.5936, R2 = 0.9951) and 1–100 μM (Ipc = 0.4179x + 2.8985, R2 = 0.9998), as shown in the inset of Figure 6A. From signal-to-noise investigation, it can be calculated that the LOD, LOQ, and sensitivity for paraoxon-ethyl measurements using Au–Ag core–shell/graphene/PEDOT:PSS/GCE were 0.01 μM, 0.03 μM, and 3.24 μA μM–1 cm–2, respectively. In addition, based on Table 1, it can be seen the electroanalytical performance of this proposed sensor for paraoxon-ethyl detection is comparable with previous sensors.36,37,41−43 The synergistic effect between the Au–Ag core–shell with the composite of graphene/PEDOT:PSS could improve the electrochemical performance and sensitivity toward paraoxon-ethyl measurements at the optimum experimental conditions.
Figure 6.

(A) Voltammograms obtained from the measurements of paraoxon-ethyl in different concentrations from 0.2 to 100 μM using Au–Ag core–shell/graphene/PEDOT:PSS/GCE. (B) Reproducibility of the paraoxon-ethyl measurements at a concentration of 80 μM in 0.1 M of pH 7 phosphate buffer using five different electrodes. (C) Stability of paraoxon-methyl measurement at a 80 μM in 0.1 M of pH 7 phosphate buffer over 3 consecutive days. (D) Variation in the reduction current of the measurement of paraoxon-ethyl in the presence of several potential interfering species when measured with Au–Ag core–shell/graphene/PEDOT:PSS/GCE.
Table 1. Comparison of the Analytical Performance of This Developed Sensor for Paraoxon-ethyl Detection with Previous Sensors.
| techniques | electrode | linear range (μM) | LOD (nM) | sensitivity(μA μM–1 cm–2) | ref |
|---|---|---|---|---|---|
| colorimetry | AChE-[Cu(Nc)2]2+ | 0.15–1.25 | 0.045 | (25) | |
| DPV | AChE/PANIb@CuO | 1 × 10⁻³–0.2 | 9.6 × 10⁻² | 4.98 × 10⁴ | (27) |
| DPV | NiCO2O4–SWCNTa | 1 × 10⁻⁴–1.4 × 10⁻³ | 2.03 × 10⁻³ | 9.8 × 10⁶ | (28) |
| SWVd | graphene@NiFe phosphosulfide | 1.23 × 10⁻²–10 × 103 | 3.7 | (65) | |
| DPV | La3+-TiO2-fMWCNTe | 11.66–307.66 | 1.9 | 7.669 | (68) |
| DPV | Ag@CuO/polyaniline | 5 × 10⁻⁶–1 × 10⁻⁴ | 11.35 × 10⁻³ | 5.5 × 10⁵ | (72) |
| amperometry | CuO@PEDOT:PSS | 1–8 × 10⁻² | 4.3 × 10⁻⁴ | 9.13 × 10³ | (73) |
| DPV | MnCo2O4 | 0.015–435 | 2 × 10⁻³ | 2.3 | (74) |
| amperometry | Zn-Ni-P-S/GO | 1–200 | 35 | 6.39 × 10⁻² | (75) |
| amperometry | Pd-WO3/g-C3N4c | 0.01–900 | 0.03 | 3.7 | (76) |
| DPV | defect graphene nanoribbon | 0.01–25 | 4.3 | (77) | |
| DPV | BiVO4 | 0.05–860 | 30 | 0.345 | (78) |
| DPV | Au–Ag core–shell/graphene/PEDOT:PSS/GCE | 0.2–100 | 10 | 3.24 | this work |
Single-walled carbon nanotube.
Acetylcholinesterase/polyaniline.
Graphitic carbon nitride.
Square wave voltammetry.
Functionalized multiwalled-carbon nanotube.
The reproducibility of Au–Ag core–shell/graphene/PEDOT:PSS/GCE for was evaluated by measuring 80 μM paraoxon-ethyl in 0.1 M of pH 7 phosphate buffer. Figure 6B displays the value of the relative standard deviation (RSD) of 4.6%, which was obtained by measuring paraoxon-ethyl using five different electrodes. Meanwhile, the stability of Au–Ag core–shell/graphene/PEDOT:PSS/GCE was investigated by measuring 80 μM paraoxon-ethyl in 0.1 M of pH 7 phosphate buffer using a similar electrode in 3 consecutive days, which resulted in a %RSD value of 4.9% (Figure 6C). The obtained current from this sensor based on Au–Ag core–shell/graphene/PEDOT:PSS/GCE was gradually diminished after 3 days, which suggests that this proposed sensor might be suitable for further development as a disposable sensing platform.
In addition, the selectivity of the Au–Ag core–shell/graphene/PEDOT:PSS/GCE was investigated to evaluate several interfering species to meet its requirement as a selective sensing platform for paraoxon-ethyl detection. Figure 6D shows the current variation obtained from the measurement of 80 μM paraoxon-ethyl (POE) in 0.1 M of pH 7 phosphate buffer in the presence of several potential interfering species including diazinon (DZN), ascorbic acid (AA), glucose, carbaryl, nitrite, NH4Cl, NaHCO3, and MgSO4. As revealed in this figure, the current response of Au–Ag core–shell/graphene/PEDOT:PSS/GCE shows negligible change when several interfering species were added to paraoxon-ethyl, which indicates that this proposed sensor provides a selective current signal for analytes. Furthermore, Table 2 also shows that the recovery value obtained from this investigation is in the range of 97–105% and can be assumed to be in the acceptable analytical range.79 Therefore, it can be concluded that this proposed sensor for the detection of paraoxon-ethyl yielded a reliable and good analytical performance and might have a potency further to be employed in real samples such as vegetables.
Table 2. Effect of the Presence of Several Interfering Species and Its Recovery Value for the Measurement of 80 μM Paraoxon-ethyl in 0.1 M of pH 7 Phosphate Buffer.
| interferences | interference ratio level (interference/paraoxon-ethyl) | Iparaoxon-ethyl(μA) | recovery (%) |
|---|---|---|---|
| 33.19 ± 0.11 | |||
| diazinon (DZN) | 1:1 | 34.89 ± 1.50 | 105.14 |
| ascorbic acid (AA) | 1:1 | 33.33 ± 0.82 | 100.41 |
| glucose | 1:1 | 32.50 ± 1.00 | 97.93 |
| carbaryl | 1:1 | 32.82 ± 0.35 | 97.51 |
| nitrite | 1:1 | 34.90 ± 1.15 | 105.15 |
| NH4Cl | 1:1 | 33.62 ± 1.13 | 101.32 |
| NaHCO3 | 1:1 | 32.79 ± 0.34 | 98.79 |
| MgSO4 | 1:1 | 33.69 ± 0.74 | 101.52 |
Analysis of Real Samples
The applicability of Au–Ag core–shell/graphene/PEDOT:PSS/GCE for paraoxon-ethyl detection in real applications was investigated using two different samples (Chinese cabbage and pear fruit) by the DPV technique. Figure 7A,B shows the results of electrochemical evaluation of the proposed sensor for the two different samples using the standard addition method. Each sample was first initially prepared in 5 mL solution and subsequently added with paraoxon-ethyl in the concentration range from 5 to 25 μM. The inset of Figure 7A,B reveals two calibration plots: the first is Ipc = 0.8026x + 1.3635, R2 = 0.9984, for the Chinese cabbage sample, and the second is Ipc = 0.8343x + 0.4262, R2 = 0.9981, for the pear fruit sample. Then, the real concentrations of paraoxon-ethyl in the sample of Chinese cabbage and pear fruit as shown in Table 3 were 4.128 ± 0.043 and 1.024 ± 0.017 μM, respectively. The results from this proposed electrochemical technique were then compared with the standard spectrophotometric technique with its corresponding calibration plot as y = 0.0351x + 0.0794, R2 = 0.9968, for the Chinese cabbage sample and y = 0.0495x + 0.0109, R2 = 0.9900, for the pear fruit sample (figure not shown). Thus, the concentration of paraoxon-ethyl in the sample of Chinese cabbage is 4.349 ± 0.093 μM and that in the sample of pear fruit is 1.101 ± 0.011 μM as shown in Table 3. The concentrations of paraoxon-ethyl in two samples determined with two different techniques were subsequently compared with statistical analysis (t–student at the 95% confidence interval), which resulted in no significant difference between these two methods. Therefore, it can be concluded that the proposed sensor for paraoxon-ethyl detection based Au–Ag core–shell/graphene/PEDOT:PSS/GCE might have a potency to be further employed in real samples, and its results were also comparable with the standard method. This also indicates that this proposed sensor for paraoxon detection could be further developed as a platform for quick and early detection of pesticide concentration in agricultural products.
Figure 7.

(A) Voltammograms recorded at a scan rate of 50 mV s–1 with Au–Ag core–shell/graphene/PEDOT:PSS/GCE from the measurement 0.1 M of pH 7 phosphate buffer spiked with various concentrations of paraoxon-ethyl ranging from 5 to 25 μM in the sample of (A) Chinese cabbage and (B) pear fruit.
Table 3. Comparison of the Paraoxon-ethyl Concentration in the Sample of Chinese Cabbage and Pear Fruit Determined with Electrochemical and Spectrophotometric Techniques.
| sample | measured
concentrations |
|
|---|---|---|
| electrochemical (μM) | spectrophotometric (μM) | |
| Chinese cabbage | 4.128 ± 0.043 | 4.349 ± 0.093 |
| pear fruit | 1.024 ± 0.017 | 1.101 ± 0.011 |
Conclusions
In conclusion, we have demonstrated the successful fabrication of an electrode modifier based on the Au–Ag core–shell/graphene/PEDOT:PSS composite and employed it as a platform for paraoxon-ethyl sensing by embedding it into the GCE surface. Before being used as an electrode modifier, the Au–Ag/graphene/PEDOT:PSS composite was characterized using UV–vis and FTIR spectroscopy, FESEM, TEM, and AFM techniques, as well as electrochemical characterization (CV and EIS). Analysis of the electrochemical behavior of Au–Ag core–shell/graphene/PEDOT:PSS/GCE found that the first cathodic peak corresponds to the direct reduction into phenylhydroxylamine involving the transfer process of four protons and four electrons, and thus, it can be further quantitatively investigated at pH 7 as the optimum pH for paraoxon-ethyl detection. It is also revealed that Au–Ag core–shell/graphene/PEDOT:PSS shows a sensitivity for paraoxon-ethyl detection, with its current peak intensity being approximately 6-fold higher than bare GCE. Further characterization of Au–Ag core–shell/graphene/PEDOT:PSS/GCE confirmed its electroanalytical range area in a wide linear range concentration (0.2–100 μM), a low LOD (10 nm), and a high sensitivity (3.24 μA μM–1 cm–2) for paraoxon-ethyl detection. This is due to the fact that the synergistic effect of the Au–Ag core–shell with the graphene/PEDOT:PSS composite via hydrogen and π–π interactions could enhance the conductivity of the modified electrode as confirmed by EIS studies. In addition, the proposed sensor for paraoxon-ethyl detection also shows a satisfactory performance in terms of its reproducibility and selectivity toward several potential interfering species, and this sensing platform might be more suitable further as a disposable electrode. Furthermore, the calculated concentration of paraoxon-ethyl derived from the proposed sensor (Au–Ag core–shell/graphene/PEDOT:PSS/GCE) was found to have no significant difference using statistical analysis compared with the standard spectrophotometric technique (t–test at 95% confidence interval) when it was employed in the samples of agricultural products. Thus, this present work demonstrates an alternative electrochemical sensing platform for paraoxon-ethyl detection, which offers a rapid and reliable method and might be used in future applications to monitor the pesticide concentration in environmental samples.
Acknowledgments
We would like to acknowledge The Directorate General of Higher Education, Research, and Technology, The Ministry of Education, Culture, Research and Technology, Republic of Indonesia, for the research funding in scheme Penelitian Kerjasama Dalam Negeri fiscal year 2023 with contract no. 102/E5/PG.02.00.PL/2023.
The authors declare no competing financial interest.
References
- Karimi-Maleh H.; Ghalkani M.; Dehkordi Z. S.; Tehran M. M.; Singh J.; Wen Y.; Baghayeri M.; Rouhi J.; Fu L.; Rajendran S. MOF-enabled pesticides as developing approach for sustainable agriculture and reducing environmental hazards. J. Ind. Eng. Chem. 2023, 129 (January 2024), 105–123. 10.1016/j.jiec.2023.08.044. [DOI] [Google Scholar]
- Bekele H.; Megersa N. Fast surface floating organic droplets based dispersive liquid-liquid microextraction for trace enrichment of multiclass pesticide residues from different fruit juice samples followed by high performance liquid chromatography–diode array detection analysis. Sep. Sci. Plus 2023, 6 (8), 2300042 10.1002/sscp.202300042. [DOI] [Google Scholar]
- Miao S.; Wei Y.; Pan Y.; Wang Y.; Wei X. Detection methods, migration patterns, and health effects of pesticide residues in tea. CRFSFS. 2023, 22 (4), 2945–2976. 10.1111/1541-4337.13167. [DOI] [PubMed] [Google Scholar]
- Thorat T.; Patle B. K.; Wakchaure M.; Parihar L. Advancements in techniques used for identification of pesticide residue on crops. J. Nat. Pest. Res. 2023, 4, 100031 10.1016/j.napere.2023.100031. [DOI] [Google Scholar]
- Sharma A. K.; Sharma M.; Sharma A. K.; Sharma M.; Sharma M. Mapping the impact of environmental pollutants on human health and environment: A systematic review and meta-analysis. J. Geochem. Explor. 2023, 255, 107325 10.1016/j.gexplo.2023.107325. [DOI] [Google Scholar]
- Ashraf S. A.; Mahmood D.; Elkhalifa A. E. O.; Siddiqui A. J.; Khan M. I.; Ashfaq F.; Patel M.; Snoussi M.; Kieliszek M.; Adnan M. Exposure to pesticide residues in honey and its potential cancer risk assessment. Food Chem. Toxicol. 2023, 180, 114014 10.1016/j.fct.2023.114014. [DOI] [PubMed] [Google Scholar]
- Li J.; Gao M.; Xia X.; Cen Y.; Wei F.; Yang J.; Wang L.; Hu Q.; Xu G. Spherical hydrogel sensor based on PB@Fe-COF@Au nanoparticles with triplet peroxidase-like activity and multiple capture sites for effective sites for effective detection of organophosphate pesticides. ACS Appl. Mater. Interfaces. 2023, 15 (5), 6473–6485. 10.1021/acsami.2c19921. [DOI] [PubMed] [Google Scholar]
- Selvi S. V.; Prasannan A.; Alagumalai K.; Liang S.-T.; Hong P.-D. Disposable tungsten sulfide framed polydopamine nanostructure modified sensor for non-enzymatic electrochemical detection of organophosphate pesticide. Coll. Surf. A: Physicochem. Eng. Asp. 2023, 677 (B), 132418 10.1016/j.colsurfa.2023.132418. [DOI] [Google Scholar]
- Olisah C.; Rubidge G.; Human R. D.; Adams J. B. Tissue distribution, dietary intake and human health risk assessment of organophosphate pesticides in common fish species from South African estuaries. Mar. Pollut. Bull. 2023, 186, 114466 10.1016/j.marpolbul.2022.114466. [DOI] [PubMed] [Google Scholar]
- Ayivi R. D.; Obare S. O.; Wei J. Molecularly imprinted polymers as chemosensors for organophosphate pesticide detection and environmental applications. TrAC, Trends Anal. Chem. 2023, 167, 117231 10.1016/j.trac.2023.117231. [DOI] [Google Scholar]
- Haggerty C. J. E.; Delius B. K.; Jouanard N.; Ndao P. D.; Leo G. A. D.; Lund A. J.; Lopez-Carr D.; Remais J. V.; Riveau G.; Sokolow S. H.; Rohr J. R. Pyrethroid insecticides pose greater risk than organophosphate insecticides to biocontrol agents for human schistosomiasis. Environ. Pollut. 2023, 319, 120952. [DOI] [PubMed] [Google Scholar]
- Karthik K.; Kumar J. V.; Chen S.-M.; Kokulnathan T.; Yang H.-Y.; Muthuraj V. Design of novel ytterbium molybdate nanoflakes anchored carbon nanofibers: challenging sustainable catalyst for the detection and degradation of assassination weapon (Paraoxon-ethyl). ACS Sustainable Chem. Eng. 2018, 6 (7), 8615–8630. 10.1021/acssuschemeng.8b00936. [DOI] [Google Scholar]
- Khoshsafar H.; Karimian N.; Nguyen T. A.; Fakhri H.; Khanmohammadi A.; Hajian A.; Bagheri H. Enzymeless voltammetric sensor for simultaneous determination of parathion and paraoxon based on Nd-based metal-organic framework. Chemosphere. 2022, 292, 133440 10.1016/j.chemosphere.2021.133440. [DOI] [PubMed] [Google Scholar]
- Dargahi A.; Shokoohi R.; Asgari G.; Ansari A.; Nematollahi D.; Samarghandi M. R. Moving-bed biofilm reactor combined with three-dimensional electrochemical pretreatment (MBBR-3DE) for 2,4-D herbicide treatment: application for real wastewater, improvement of biodegradability. RSC Adv. 2021, 11, 9608–9620. 10.1039/D0RA10821A. [DOI] [PMC free article] [PubMed] [Google Scholar]
- Zhang R.; Li N.; Sun J.; Gao F. Colorimetric and phosphorimetric dual-signaling strategy mediated by inner filter effect for highly sensitive assay or organophosphate pesticides. J. Agric. Food Chem. 2015, 63 (40), 8947–8954. 10.1021/acs.jafc.5b03096. [DOI] [PubMed] [Google Scholar]
- Pashirova T.; Shaihutdinova Z.; Tatarinov D.; Mansurova M.; Kazakova R.; Bogdanov A.; Chabriere E.; Jacquet P.; Daude D.; Akhunzianov A. A.; Miftakhova R. R.; Masson P. Tuning the envelope structure of enzyme nanoreactors for in vivo detoxification of organophosphates. Int. J. Mol. Sci. 2023, 24 (21), 15756. 10.3390/ijms242115756. [DOI] [PMC free article] [PubMed] [Google Scholar]
- Kaur S.; Chowdhary S.; Kumar D.; Bhattacharyya R.; Banerjee D. Organophosphorus and carbamate pesticides: Molecular toxicology and laboratory testing. Clin. Chim. Acta 2023, 551, 117584 10.1016/j.cca.2023.117584. [DOI] [PubMed] [Google Scholar]
- Chen J.; Guo Z.; Xin Y.; Gu Z.; Zhang L.; Guo X. Effective remediation and decontamination of organophosphorus compounds using enzymes: From rational design to potential applications. Sci. Total Environ. 2023, 867, 161510 10.1016/j.scitotenv.2023.161510. [DOI] [PubMed] [Google Scholar]
- Li B.; Sun P.; Zhen J.; Gong W.; Zhang Z.; Jia W.; Liang G.; Pan L. pH-controlled UV-Vis strategy for indirect, rapid detection of paraoxon based on molecular form conversion. Sens. Actuators B Chem. 2021, 348, 130715 10.1016/j.snb.2021.130715. [DOI] [Google Scholar]
- Zhao L.; Deng C.; Xue S.; Liu H.; Hao L.; Zhu M. Multifunctional g-C3N4/Ag NPs intercalated GO composite membrane for SERS detection and photocatalytic degradation of paraoxon-ethyl. Chem. Eng. J. 2020, 402, 126223 10.1016/j.cej.2020.126223. [DOI] [Google Scholar]
- Luo M.; Wei J.; Zhao Y.; Sun Y.; Liang H.; Wang S.; Li Fluorescent and visual detection of methyl-paraoxon by using boron-and nitrogen-doped carbon dots. Microchem. J. 2020, 154, 104547 10.1016/j.microc.2019.104547. [DOI] [Google Scholar]
- Li W.; Qi Y.; Gao C.; Liu Y.; Duan J. A sensitive approach for screening acetylcholinesterase inhibition of water samples using ultra-performance liquid chromatography-tandem mass spectrometry. J. Chromatogr. B 2022, 1190, 123101 10.1016/j.jchromb.2022.123101. [DOI] [PubMed] [Google Scholar]
- Uclés S.; Uclés A.; Lozano A.; Bueno M. J. M.; Fernández-Alba A. R. Shifting the paradigm in gas chromatography mass spectrometry pesticide analysis using high resolution accurate mass spectrometry. J. Chromatogr. A 2017, 1501, 107–116. 10.1016/j.chroma.2017.04.025. [DOI] [PubMed] [Google Scholar]
- Yagmuroglu O.; Diltemiz S. E. Development of QCM based biosensor for the selective and sensitive detection of paraoxon. Anal. Biochem. 2020, 591, 113572 10.1016/j.ab.2019.113572. [DOI] [PubMed] [Google Scholar]
- Ayaz S.; Ulucay S.; Uzer A.; Dilgin Y.; Apak R. A novel acetylcholinesterase inhibition based colorimetric biosensor for the detection of paraoxon ethyl using CUPRAC reagent as chromogenic oxidant. Talanta. 2024, 266 (1), 124962 10.1016/j.talanta.2023.124962. [DOI] [PubMed] [Google Scholar]
- Celik H.; Soylemez S. An electrochemical acetylcholinesterase biosensor based on fluorene(bisthiophene) comprising polymer for paraoxon detection. Electroanalysis 2023, 35 (3), e202200271 10.1002/elan.202200271. [DOI] [Google Scholar]
- Paneru S.; Kumar D. Ag-doped-CuO nanoparticles supported polyaniline (PANI) based novel electrochemical sensor for sensitive detection of paraoxon-ethyl in three real samples. Sens. Actuators B Chem. 2023, 379, 133270 10.1016/j.snb.2022.133270. [DOI] [Google Scholar]
- Kulkarni B.; Suvina V.; Pramoda K.; Balakrishna R. G. Picomolar, electrochemical detection of paraoxon ethyl, by strongly coordinated NiCo2O4-SWCNT composite as an electrode material. J. Electroanal. Chem. 2023, 931, 117175 10.1016/j.jelechem.2023.117175. [DOI] [Google Scholar]
- Chuasontia I.; Sirisom W.; Nakpathomkun N.; Toommee S.; Pechyen C.; Tangnorawich B.; Parcharoen Y. Development and characterization of nano-ink from silicon carbide/multi-walled carbon nanotubes/synthesized silver nanoparticles for non-enzymatic paraoxon residuals detection. Micromachines. 2023, 14 (8), 1613. 10.3390/mi14081613. [DOI] [PMC free article] [PubMed] [Google Scholar]
- Kadu R. D.; Keri R. S.; D H N.; Budagumpi S. State-of-the-art electrochemical sensors for quantitative detection of pesticides. Appl. Organomet. Chem. 2023, 37 (6), e7097 10.1002/aoc.7097. [DOI] [Google Scholar]
- Karimi-Maleh H.; Darabi R.; Baghayeri M.; Karimi F.; Fu L.; Rouhi J.; Niculina D. E.; Gündüz E. S.; Dragoi E. N. Recent developments in carbon nanomaterials-based electrochemical sensors for methyl parathion detection. J. Food Meas. Charact. 2023, 17, 5371–5389. 10.1007/s11694-023-02050-z. [DOI] [Google Scholar]
- Ren P.; Dong J. Electrohydrodynamic printed PEDOT:PSS/graphene/PVA circuits for sustainable and foldable electronics. Adv. Mater. Technol. 2023, 8 (22), 2301045 10.1002/admt.202301045. [DOI] [Google Scholar]
- Greco G.; Giuri A.; Bagheri S.; Seiti M.; Degryse O.; Rizzo A.; Mele C.; Ferraris E.; Corcione C. E. PEDOT:PSS/graphene oxide (GO) ternary nanocomposites for electrochemical applications. Molecules. 2023, 28 (7), 2963. 10.3390/molecules28072963. [DOI] [PMC free article] [PubMed] [Google Scholar]
- Adekoya G. J.; Sadiku R. E.; Ray S. S. Nanocomposites of PEDOT:PSS with graphene and its derivatives for flexible electronic applications: a review. Macromol. Mater. Eng. 2021, 306 (3), 2000716 10.1002/mame.202000716. [DOI] [Google Scholar]
- Miao J.; Fan T. Flexible and stretchable transparent conductive graphene-based electrodes for emerging wearable electronics. Carbon. 2023, 202 (1), 495–527. 10.1016/j.carbon.2022.11.018. [DOI] [Google Scholar]
- Smaisim G. F.; Abed A. M.; Al-Madhhachi H.; Hadrawi S. K.; Al-Khateeb H. M. M.; Kianfar E. Graphene-based important carbon structures and nanomaterials as chemical capacitors and supercapacitor electrodes: a review. BioNanoScience. 2023, 13, 219–248. 10.1007/s12668-022-01048-z. [DOI] [Google Scholar]
- Sahoo B. B.; Pandey V. S.; Dogonchi A. S.; Thatoi D. N.; Nayak N.; Nayak M. K. Synthesis, characterization and electrochemical aspects of graphene based advanced supercapacitor electrodes. Fuel. 2023, 345, 128174 10.1016/j.fuel.2023.128174. [DOI] [Google Scholar]
- Pogacean F.; Varodi C.; Magerusan L.; Pruneanu S. Highly sensitive graphene-based electrochemical sensor for nitrite assay in waters. Nanomaterials. 2023, 13 (9), 1468. 10.3390/nano13091468. [DOI] [PMC free article] [PubMed] [Google Scholar]
- Shewale P. S.; Yun K.-S. Ternary nanocomposites of PEDOT:PSS, RGO, and urchin-like hollow microspheres of NiCo2O4 for flexible and weavable supercarpacitors. Mater. Sci. Eng. B 2023, 292, 116404 10.1016/j.mseb.2023.116404. [DOI] [Google Scholar]
- Putra B. R.; Nisa U.; Heryanto R.; Rohaeti E.; Khalil M.; Izzataddini A.; Wahyuni W. T. A facile electrochemical sensor based on a composite of electrochemically reduced graphene oxide and a PEDOT:PSS modified glassy carbon electrode for uric acid detection. Anal. Sci. 2022, 38, 157–166. 10.2116/analsci.21P214. [DOI] [PubMed] [Google Scholar]
- Rani P.; Varma R. S.; Singh K.; Acevedo R.; Singh J. Catalytic and antimicrobial potential of green synthesized Au and Au@Ag core-shell nanoparticles. Chemosphere. 2023, 317, 137841 10.1016/j.chemosphere.2023.137841. [DOI] [PubMed] [Google Scholar]
- He B.; Li M. A novel electrochemical aptasensor based on gold electrode decorated Ag@Au core-shell nanoparticles for sulfamethazine determination. Anal. Bioanal. Chem. 2018, 410, 7671–7678. 10.1007/s00216-018-1381-3. [DOI] [PubMed] [Google Scholar]
- Li L.; Zhang W.; Chen H.; Zhao Z.; Wang M.; Chen J. Visual and electrochemical determination of breast cancer marker CA15–3 based on etching of Au@Ag core/shell nanoparticles. Int. J. Electrochem. Sci. 2023, 18 (5), 100123 10.1016/j.ijoes.2023.100123. [DOI] [Google Scholar]
- Rana S.; Bharti A.; Singh S.; Bhatnagar A.; Prabhakar N. Gold-silver core-shell nanoparticle–based impedimetric immunosensor for detection of iron homeostasis biomarker hepcidin. Microchim. Acta 2020, 187, 626. 10.1007/s00604-020-04599-8. [DOI] [PubMed] [Google Scholar]
- Jayeoye T. J.; Supachettapun C.; Muangsin N. Toxic Ag+ detection based on Au@Ag core shell nanostructure formation using tannic acid assisted synthesis of Pullulan stabilized gold nanoparticles. Sci. Rep. 2023, 13, 1844. 10.1038/s41598-023-27406-9. [DOI] [PMC free article] [PubMed] [Google Scholar]
- Vilian A. T. E.; Shahzad A.; Chung J.; Choe S. R.; Kim W.-S.; Huh Y. S.; Yu T.; Han Y.-K. Square voltammetric sensing of mercury at very low working potential by using oligomer-functionalized Ag@Au core-shell nanoparticle. Microchim. Acta 2017, 184, 3547–3556. 10.1007/s00604-017-2372-3. [DOI] [Google Scholar]
- Wang J.; Luo Z.; Lin X. An ultrafast electrochemical synthesis of Au@Ag core-shell nanoflowers as a SERS substrate for thiram detection in milk and juice. Food Chem. 2023, 402, 134433 10.1016/j.foodchem.2022.134433. [DOI] [PubMed] [Google Scholar]
- Madani-Nejad E.; Shokrollahi A.; Shahdost-Fard F. A smartphone-based colorimetric assay using Au@Ag core–shell nanoparticles as the nanoprobes for visual tracing of fluvoxamine in biofluids as a common suicide drug. Spectrochim. Acta, Part A 2023, 296, 122665 10.1016/j.saa.2023.122665. [DOI] [PubMed] [Google Scholar]
- Mohsin M.; Jawad M.; Yameen M. A.; Waseem A.; Shah S. H.; Shaikh A. J. An insight into the coating behavior of bimetallic silver and gold core-shell nanoparticles. Plasmonic. 2020, 15, 1599–1612. 10.1007/s11468-020-01166-y. [DOI] [Google Scholar]
- Li B.; Sun P.; Zhen J.; Gong W.; Zhang Z.; Jia W.; Liang G.; Pan L. pH-controlled UV–Vis sensing strategy for indirect, rapid detection of paraoxon based on molecular form conversion. Sensors Actuators B Chem. 2021, 348, 130715 10.1016/j.snb.2021.130715. [DOI] [Google Scholar]
- Haiss W.; Thanh N. T. K.; Aveyard J.; Fernig D. G. Determination of size and concentration of gold nanoparticles from UV-Vis spectra. Anal. Chem. 2007, 79, 4215–4221. 10.1021/ac0702084. [DOI] [PubMed] [Google Scholar]
- Sinha T.; Ahmaruzzaman M. A novel and greener approach for shape controlled synthesis of gold and gold-silver core shell nanostructure and their application in optical coatings. Spectrochim. Acta A Mol. Biomol. Spectrosc. 2015, 145, 280–288. 10.1016/j.saa.2015.03.059. [DOI] [PubMed] [Google Scholar]
- Faniyi I. O.; Fasakin O.; Olofinjana B.; Adekunle A. S.; Oluwasusi T. V.; Eleruja M. A.; Ajayi E. O. B. The comparative analyses of reduced graphene oxide (RGO) prepared via green, mild and chemical approaches. SN Appl. Sci. 2019, 1, 1181. 10.1007/s42452-019-1188-7. [DOI] [Google Scholar]
- Rahman H. A.; Rafi M.; Putra B. R.; Wahyuni W. T. Electrochemical sensors based on a composite of electrochemically reduced graphene oxide and PEDOT:PSS for hydrazine detection. ACS Omega. 2023, 8, 3258–3269. 10.1021/acsomega.2c06791. [DOI] [PMC free article] [PubMed] [Google Scholar]
- Anindya W.; Wahyuni W. T.; Rafi M.; Putra B. R. Electrochemical sensor based on graphene oxide/PEDOT:PSS composite modified glassy carbon electrode for environmental nitrite detection. Int. J. Electrochem. Sci. 2023, 18 (3), 100034 10.1016/j.ijoes.2023.100034. [DOI] [Google Scholar]
- Alkhalayfeh M. A.; Aziz A. A.; Pakhuruddin M. Z.; Katubi K. M. M. Spiky durian-shaped Au@Ag nanoparticles in PEDOT:PSS for improved efficiency of organic solar cells. Materials 2021, 14 (19), 5591. 10.3390/ma14195591. [DOI] [PMC free article] [PubMed] [Google Scholar]
- Babaei Z.; Rezaei B.; Pisheh M. K.; Afshar-Taromi F. In situ synthesis of gold/silver nanoparticles and polyaniline as buffer layer in polymer solar cells. Mater. Chem. Phys. 2020, 248, 122879 10.1016/j.matchemphys.2020.122879. [DOI] [Google Scholar]
- Kumar N.; Lin Y.-J.; Huang Y.-C.; Liao Y.-T.; Lin S.-P. Detection of lactate in human sweat via surface-modified, screen-printed carbon electrodes. Talanta. 2023, 265, 124888 10.1016/j.talanta.2023.124888. [DOI] [PubMed] [Google Scholar]
- Dey S.; Raul C. K.; Karmakar R.; Chatterjee A.; Meikap A. K.; Basu S. Enhanced electrocatalytic activity of Cu@Ag core-shell nano catalyst for borohydride oxidation using MWCNT as catalyst support. Ionics. 2023, 29, 4191–4202. 10.1007/s11581-023-05158-w. [DOI] [Google Scholar]
- Sharma R. K.; Sharma D.; Saini A.; Laxmi S.; Singh B. P.; Srivastava S. K. Synergistic effect of graphene oxide on structural and electrical performance of PEDOT:PSS polymer. Mater. Today: Proc. 2023, 82, 375–380. 10.1016/j.matpr.2023.03.114. [DOI] [Google Scholar]
- Li Y.; Liu W.; Gao X.; Zou T.; Deng P.; Zhao J.; Zhang T.; Chen Y.; He L.; Shao L.; Yan Z.; Zhang X. Carbon nanomaterials-PEDOT: PSS based electrochemical ionic soft actuators: Recent development in design and applications. Sens. Actuators, A 2023, 354, 114277 10.1016/j.sna.2023.114277. [DOI] [Google Scholar]
- Feng J.; Lang G.; Li T.; Zhang J.; Zhao J.; Li W.; Yang W.; Jiang Z. Enhanced electrochemical detection performance of C-Cr2O3 towards glucose and hydrazine by assembling Ni-MPN coating. Appl. Surf. Sci. 2022, 604, 154548 10.1016/j.apsusc.2022.154548. [DOI] [Google Scholar]
- Lin Y.; Zhang R. Liquid chromatography series dual-electrode amperometric detection for aromatic nitro compounds. Electroanalysis. 1994, 6 (11–12), 1126–1131. 10.1002/elan.1140061135. [DOI] [Google Scholar]
- Liu G.; Lin Y. Electrochemical stripping analysis of organophosphate pesticides and nerve agents. Electrochem. Commun. 2005, 7 (4), 339–343. 10.1016/j.elecom.2005.02.002. [DOI] [Google Scholar]
- Aghaie A.; Khanmohammadi A.; Hajian A.; Schmid U.; Bagheri H. Nonenzymatic electrochemical determination of paraoxon ethyl in water and fruits by graphene-based NiFe bimetallic phosphosulfide nanocomposite as a superior sensing layer. Food Anal. Methods. 2019, 12, 1545–1555. 10.1007/s12161-019-01486-8. [DOI] [Google Scholar]
- Kim G. H.; Hwang D. K.; Woo S. I. Thermoelectric properties of nanocomposite thin films prepared with poly(3,4-ethylenedioxythiophene) poly(styrenesulfonate) and graphene. Phys. Chem. Chem. Phys. 2012, 14, 3530–3536. 10.1039/c2cp23517j. [DOI] [PubMed] [Google Scholar]
- Kanoun O.; Lazarević-Pašti T.; Pašti I.; Nasraoui S.; Talbi M.; Brahem A.; Adiraju A.; Sheremet E.; Rodriguez R. D.; Ali M. B.; Al-Hamry A. A Review of Nanocomposite-Modified Electrochemical Sensors for Water Quality Monitoring. Sensors 2021, 21 (12), 4131. 10.3390/s21124131. [DOI] [PMC free article] [PubMed] [Google Scholar]
- Nehru R.; Chen S.-M. A La3+-doped TiO2 nanoparticle decorated functionalized-MWCNT catalyst: novel electrochemical non-enzymatic sensing of paraoxon-ethyl. Nanoscale Adv. 2020, 2, 3033–3049. 10.1039/D0NA00260G. [DOI] [PMC free article] [PubMed] [Google Scholar]
- Stoytcheva M.; Zlatev R.; Montero G.; Velkova Z.; Gochev V. Nanostructured platform for the sensitive determination of paraoxon by using an electrode modified with a film of graphite-immobilized bismuth. Microchim. Acta 2017, 184, 2707–2714. 10.1007/s00604-017-2282-4. [DOI] [Google Scholar]
- Huyen N. N.; Tung L. M.; Nguyen T. A.; Phung T. L. H.; Thang P. D.; Vinh N. T.; Nguyen Q. V.; Vu T. K. O.; Lam V. D.; Le V. K.; Dinh N. X.; Le A.-T. Insights into the effect of cation distribution at tetrahedral sites in ZnCo2O4 spinel nanostructures on the charge transfer ability and electrocatalytic activity toward ultrasensitive detection of carbaryl pesticide in fruit and vegetable samples. J. Phys. Chem. C 2023, 127 (25), 12262–12275. 10.1021/acs.jpcc.3c02039. [DOI] [Google Scholar]
- Xu Y.; Qin Y.; Gao X.; Li J.; Xiao D. Defective Prussian blue analogue with cobalt for fabrication of an electrochemical sensor for detecting ascorbic acid, dopamine and uric acid. ChemElectroChem 2023, 10 (16), e202300134 10.1002/celc.202300134. [DOI] [Google Scholar]
- Paneru S.; Kumar D. Ag-doped-CuO nanoparticles supported polyaniline (PANI) based novel electrochemical sensor for sensitive detection of paraoxon-ethyl in three real samples. Sens. Actuators B Chem. 2023, 379, 133270 10.1016/j.snb.2022.133270. [DOI] [Google Scholar]
- Paneru S.; Sweety; Kumar D. CuO@PEDOT:PSS-grafted paper-based electrochemical biosensor for paraoxon-ethyl detection. J. Appl. Electrochem. 2023, 53, 2229–2238. 10.1007/s10800-023-01909-9. [DOI] [Google Scholar]
- Kokulnathan T.; Wang T.-J.; Wang Y.-Y.; Suvina V.; Ahmed F. Three-dimensional manganese cobaltate: a highly conductive electrocatalyst for paraoxon-ethyl detection. Microchim. Acta 2022, 189, 315. 10.1007/s00604-022-05416-0. [DOI] [PubMed] [Google Scholar]
- Xiao B. Electrochemical sensor bed on bimetallic phosphosulfide Zn-Ni-P-S nanocomposite-reduced graphene oxide for determination ethyl in agriculture wastewater. Int. J. Electrochem. Sci. 2022, 17 (6), 220672 10.20964/2022.06.72. [DOI] [Google Scholar]
- Rajkumar C.; Kim H. Hybrid nanostructures of Pd–WO3 grown on graphitic carbon nitride for trace level electrochemical detection of paraoxon-ethyl. Microchim. Acta 2021, 188, 233. 10.1007/s00604-021-04866-2. [DOI] [PubMed] [Google Scholar]
- Zhao Y.; Ma Y.; Zhou R.; He Y.; Wu Y.; Yi Y.; Zhu G. Highly sensitive electrochemical detection of paraoxon ethyl in water and fruit samples based on defect-engineered graphene nanoribbons modified electrode. J. Food Meas. Charact. 2022, 16, 2596–2603. 10.1007/s11694-022-01366-6. [DOI] [Google Scholar]
- Gopi P. K.; Ngo D. B.; Chen S.-M.; Ravikumar C. H.; Surareungchai W. High-performance electrochemical sensing of hazardous pesticide Paraoxon using BiVO4 nano dendrites equipped catalytic strips. Chemosphere. 2022, 288 (2), 132511 10.1016/j.chemosphere.2021.132511. [DOI] [PubMed] [Google Scholar]
- Hernandez-Rodriguez J. F.; Rojas D.; Escarpa A. Electrochemical sensing directions for next-generation healthcare: trends, challenges, and frontiers. Anal. Chem. 2021, 93 (1), 167–183. 10.1021/acs.analchem.0c04378. [DOI] [PubMed] [Google Scholar]