

Abstract
The role of B cells in anti-tumor immunity is still debated and accordingly, immunotherapies have focused on targeting T and NK cells to inhibit tumor growth1,2. Here, using high-throughput flow cytometry, bulk and single-cell RNA- and BCR-sequencing of B cells temporally during B16F10 melanoma growth, we identified a subset of B cells that expands specifically in the draining lymph node over time in tumor bearing-mice. The expanding B cell subset expresses the cell surface molecule T cell immunoglobulin and mucin domain 1 (TIM-1) and a unique transcriptional signature, including multiple co-inhibitory molecules such as PD-1, TIM-3, TIGIT and LAG-3. While conditional deletion of these co-inhibitory molecules on B cells had little or no effect on tumor burden, selective deletion of Havcr1 (the gene encoding TIM-1) in B cells both dramatically inhibited tumor growth and enhanced effector T cell responses. Loss of TIM-1 enhanced the type 1 interferon response in B cells, which augmented B cell activation and increased antigen presentation and co-stimulation, resulting in increased expansion of tumor-specific effector T cells. Our results demonstrate that manipulation of TIM-1-expressing B cells enables engagement of the second arm of adaptive immunity to promote anti-tumor immunity and inhibit tumor growth.
Keywords: B cells, checkpoint receptors, cancer, adaptive immunity, immunomodulation, TIM-1, type I interferons
B cells play key roles in both innate and adaptive immunity. Distinct specialized B cell subsets engage a range of responses from antigen presentation to antibody production and B cells are one of the most abundant cell types of tumor infiltrating leukocytes (TILs)3, especially in melanoma4,5. However, their role in anti-tumor immunity remains unclear. Here, we examine the B cell repertoire at single cell resolution from tumor-infiltrating B cells and tumor-draining lymph nodes (dLN) and identify and characterize a subset of B cells expressing the checkpoint molecule TIM-1. We find that targeting of TIM-1 allows engagement of this B cell subset, with subsequent enhancement of anti-tumor CD8+ T cell responses and inhibition of tumor cell growth, with implications for novel approaches to cancer therapy.
Distinct B-cell infiltrates in B16F10 TME
To understand the role of B cell subsets in regulating immune responses to tumors, we characterized B cells from tumors, dLNs and ndLNs in the B16F10 melanoma mouse model. We confirmed that B cells infiltrate the tumor and are increased in frequency within the dLN compared to the ndLN (Extended Data Fig. 1a). Depletion of B cells globally using anti-CD20 mAb significantly enhanced melanoma tumor growth; however, abrogating plasma-cell generation (using CD19Cre/+Prdm1fl/fl mice) did not impact tumor burden (Extended Data Fig. 1b, c). Tumor-infiltrating B cells had distinct expression profiles by bulk RNA-seq compared to B cells from lymphoid tissues, reflecting the induction of proliferative and migratory pathways associated with B cell activation (Extended Data Fig. 1d–g). In addition, tumor-infiltrating B cells were predominantly follicular B cells of the B2 lineage with bimodal IgD expression (Extended Data Fig. 1h). Thus, while plasma cells seemed dispensable, total B cells produced an anti-tumor effect and displayed a distinct phenotype upon infiltration in B16F10 tumors, prompting a deeper analysis.
B16F10 growth induces a specific B-cell subset
To further decipher B cell heterogeneity, we performed 5’ single-cell RNA-seq (scRNA-seq) combined with VDJ/BCR-seq (scRNA/BCR-seq) of CD45+ cells in TME, dLN and ndLN at three different time points of B16F10 melanoma growth (Fig. 1a, b, Extended Data Fig. 2). The 34,071 high quality cell profiles were grouped by respective lineages and tissue origin, and expressed known marker genes, which we used for their annotation (Fig. 1c, Extended Data Fig. 2c). We searched for B cell populations that were expanded over time or in the three compartments (tumor, dLN, ndLN), based on either transcriptional states or BCR clones (Fig. 1d and Extended Data Fig. 2d–h). While known B cell subset expression signatures and markers did not identify discrete B cell groups (except for Germinal center-like B cells (GC B cells) (Extended Data Fig. 2g), unsupervised graph clustering partitioned them into five distinct clusters (Fig. 1e and Extended Data Fig. 2h). The main separation was by tissue origin (Fig. 1f), with clusters 1 and 2 consisting of tumor-infiltrating B cells with a highly activated or inflammatory phenotype (Cd69, Cd86 or Cxcr4 in cluster 1; Cd274, Apoe or Hspa1a in cluster 2), clusters 4 and 5 consisting of both dLN and ndLN B cells with a naïve-like profile (Cr2, Cxcr5, Tnfrsf13c in cluster 4; Fcer2a, Tnfrsf13b in cluster 5) and cluster 3 mainly composed of cells from the tumor dLN with proliferative and GC-like profiles (Mki67, Aicda). The frequency of dLN cells in cluster 3 B cells augmented over time as tumors increased in size, suggesting a specific induction of cluster 3 in response to melanoma growth (Fig. 1g), consistent with the expression of activation and GC B cell signatures in these cells. Moreover, BCR-based clonal analysis (with Immcantation6) identified only a small fraction of immunoglobulin heavy chain gamma (IGHG)-expressing cells, and those cells were predominantly members of cluster 3 and were moderately clonally expanded within the dLN compartment (Extended Data Fig. 2d, e).
Fig. 1: Characterization of B cells expressing TIM-1 and several checkpoint molecules in murine models and human tumors.
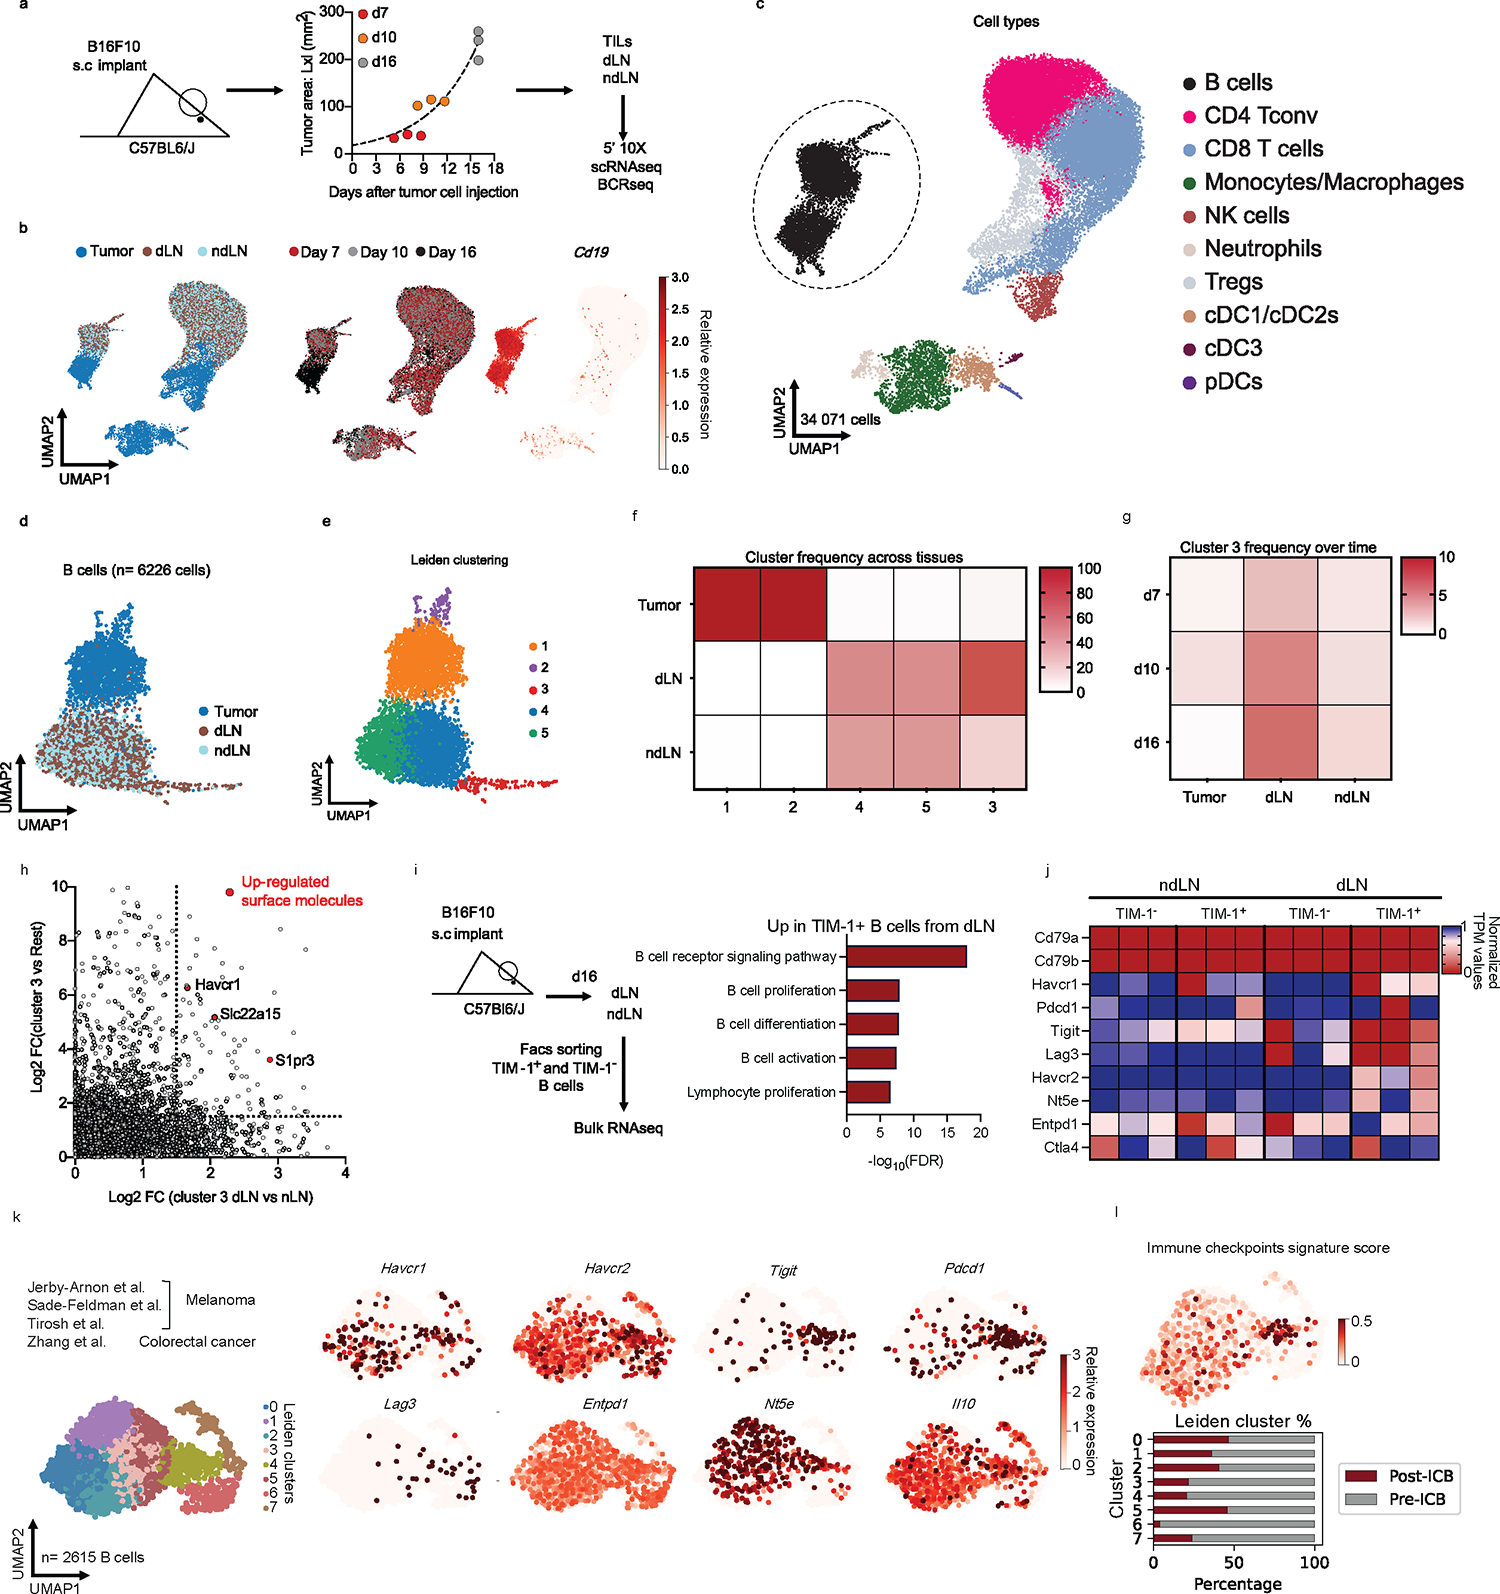
a, Workflow for single-cell transcriptome profiling of 34,071 viable leukocytes from the TME, dLN and ndLN samples. n=3 mice per time point (days 7 (early), 10 (intermediate) and 16 (late)). b, Uniform manifold approximation and projection (UMAP) embedding of all cells sequenced with each color representing tissues of origin (left), time point (center) and expression of Cd19 gene (right). c, UMAP visualization of the immune cell types. CD4+ Tconv, conventional CD4+ T cells, cDC1/2/3, type 1, 2 and 3 conventional dendritic cells; pDCs, plasmacytoid dendritic cells; Tregs, regulatory T cells; NK, Natural killer cells. d and e, UMAPs visualization of the 6,226 B cells (dots) collected from wild-type mice bearing B16F10 melanoma depicting tissues of origin (d), or Leiden cell clusters (resolution 0.85) (e). f, g, Heatmap displaying the frequencies of cells from each cluster within the tissues of origin (f) or from cluster 3 over time and tissues of origin (g). h, the log2 fold change (FC) in RNA levels between B cells derived from cluster 3 with the rest of the clusters and between the dLN and ndLN. i, j, Bulk RNAseq analysis of TIM-1+ and TIM-1− B cells derived from dLN and ndLN of B16F10-bearing wild-type mice (n=3). Pathway enrichment analysis of dLNderived TIM-1+ B cells (i). Heatmap depicting the expression pattern of a set of selected genes (j). k and l, UMAP plot of published scRNAseq14,20,21,24 data depicting 2615 B cells(dots) isolated from human tumors, colored by cell clusters (k, left), selected gene expression (k, right), Immune checkpoint signature score (l, top) and stacked bar graph displaying the frequencies of B cells derived from Responder and Pre- and Post- ICB samples among each Leiden cluster (l, bottom).
TIM-1 marks checkpoint expressing B cells
We sought to isolate and purify the B cell subset that increases with tumor growth by identifying cell surface markers that are expressed on this B cell population. The dLN-derived, expanded cluster 3 B cells expressed genes encoding specific cell surface markers, especially Havcr1, encoding T cell Immunoglobulin and Mucin Domain-Containing Protein 1 (TIM-1) (by COMET7, Fig. 1h, Extended Data Fig. 2f). In the B16F10 tumor model, TIM-1+ B cells poorly infiltrated the tumor but were found in the lymphoid organs and increased preferentially within the dLN (Extended Data Fig. 3a), consistent with our RNA profiles. TIM-1 is a member of the TIM family, of which TIM-3 is the most characterized molecule in the context of autoimmunity and anti-tumor immunity8. TIM-1 is not well studied in the context of cancer but is expressed on a fraction (~10%) of peripheral B cells and can promote tissue tolerance by binding to phosphatidylserine (PS) exposed on apoptotic cells9−13.
Sorted TIM-1+ and TIM-1− B cells from dLN and ndLN of B16F10-bearing mice showed distinct transcriptional profiles by bulk RNA-seq and flow cytometry (Fig. 1i, j and Extended Data Fig. 3b and c), clustering by TIM-1 expression and not tissue origin, with TIM-1+ B cells from dLN displaying a unique expression signature, enriched in B-cell activation and proliferation genes (Fig. 1i, Extended Data Fig. 3b and c). These features of TIM-1+ B cells were confirmed functionally in vitro, as TIM-1+ B cells had increased proliferation and differentiation into plasma cells (PC) (Extended Data Fig. 3d).
However, scRNA-seq of sorted TIM-1+ and TIM-1− B cells from dLN, ndLN and spleen showed that GC-like TIM-1+ B cells consist of only ~25% of all TIM-1 expressing B cells (Extended Data Fig. 3e–g), indicating that TIM-1 is not simply a marker of GCs, or a unique B cell lineage. Instead, our data suggest that TIM-1 may be expressed on all B cells during B cell activation. Consistent with this model, TIM-1 is transiently induced across cell divisions on the cell surface of TIM-1-negative B cells upon B cell activation in vitro with BCR and/or CD40 but not LPS, supporting that TIM-1 could be induced on all B cells upon antigen-driven B cell activation (Extended Data Fig. 3h).
Remarkably, TIM-1+ B cells from the dLN of B16F10 tumor-bearing mice also express higher levels of various co-inhibitory and immunoregulatory molecules that are expressed on T cells, including PD-1, TIGIT, LAG3, TIM-3, CD39, CD73, and IL-10 (Fig. 1j, Extended Data Fig. 4a, b). These molecules were preferentially induced on TIM-1+ B cells compared to TIM-1− B cells upon anti-IgM, anti-CD40 or LPS stimulation in vitro (Extended Data Fig. 4c).
To study the relevance of TIM-1+ B cells in human tumors, we re-analyzed TILs from human tumors, using publicly available datasets that we and others have previously generated with high sensitivity (Smartseq2 protocol)4,14−24. While focusing on tumor-infiltrating B cells derived from ICB naïve samples, we identified a cluster of B cells (cluster 4) that co-expressed TIM-1 and multiple co-inhibitory molecules (Havcr2, Tigit, Pdcd1, Lag3) and Il10, comprising a distinct B-cell subset and a signature that overlaps with human exhausted T cells14 (Fig. 1k–l, Extended Data Fig. 4d and e). Interestingly, cells in cluster 4 that largely included TIM-1+ B cells were more frequent among B cells derived from ICB naïve patients and were decreased in TILs upon checkpoint blockade therapy in human tumors (Fig. 1l, Extended Data Fig. 4f and g). We corroborated these findings by investigating additional human cancer datasets derived from breast, colorectal, ovarian and lung tumors where we could identify a similar cluster of B cells expressing checkpoint receptors enriched in ICB naïve patient samples (Extended Data Fig. 4h–j). Clinically, high expression of Havcr1 correlated with poor overall survival in patients with lung, pancreatic and stomach adenocarcinomas, while being protective in the context of colorectal cancer (Extended Data Figure 4k and l). Additionally, except for a poor impact on survival for stomach cancer, a high score for the IC+ B cell signature did not impact patients’ clinical outcomes (Extended Data Figure 4m). These data indicate that TIM-1 marks a subset of activated B cells expressing co-inhibitory molecules and IL-10 in both mouse and human tumors and their presence in human tumors seems to be inhibited upon checkpoint blockade therapy.
TIM-1 loss in B cells limits tumor growth
Because TIM-1+ B cells expressed multiple known T cell checkpoint molecules, some previously reported in B cells25−29, we investigated their B cell-intrinsic roles in regulating anti-tumor immunity. Conditional deletion of the checkpoint molecules Havcr2 (TIM-3), Tigit (TIGIT), Pdcd1 (PD-1) or Lag3 (LAG-3) in B cells had a modest or no effect on tumor growth (Fig. 2a–e). Only loss of TIGIT on B cells led to a modest but significant reduction of tumor growth. Although IL-10 has previously been associated with regulatory B cells25,30 and shown to be a critical driver of B cell regulatory function31, loss of B cell-specific IL-10 had no impact on B16F10 growth, arguing against a functional role of IL-10-producing B cells in this melanoma model (Fig. 2f).
Fig. 2: In vivo regulatory molecules screening reveals TIM-1 as a B cell immune checkpoint controlling tumor growth.
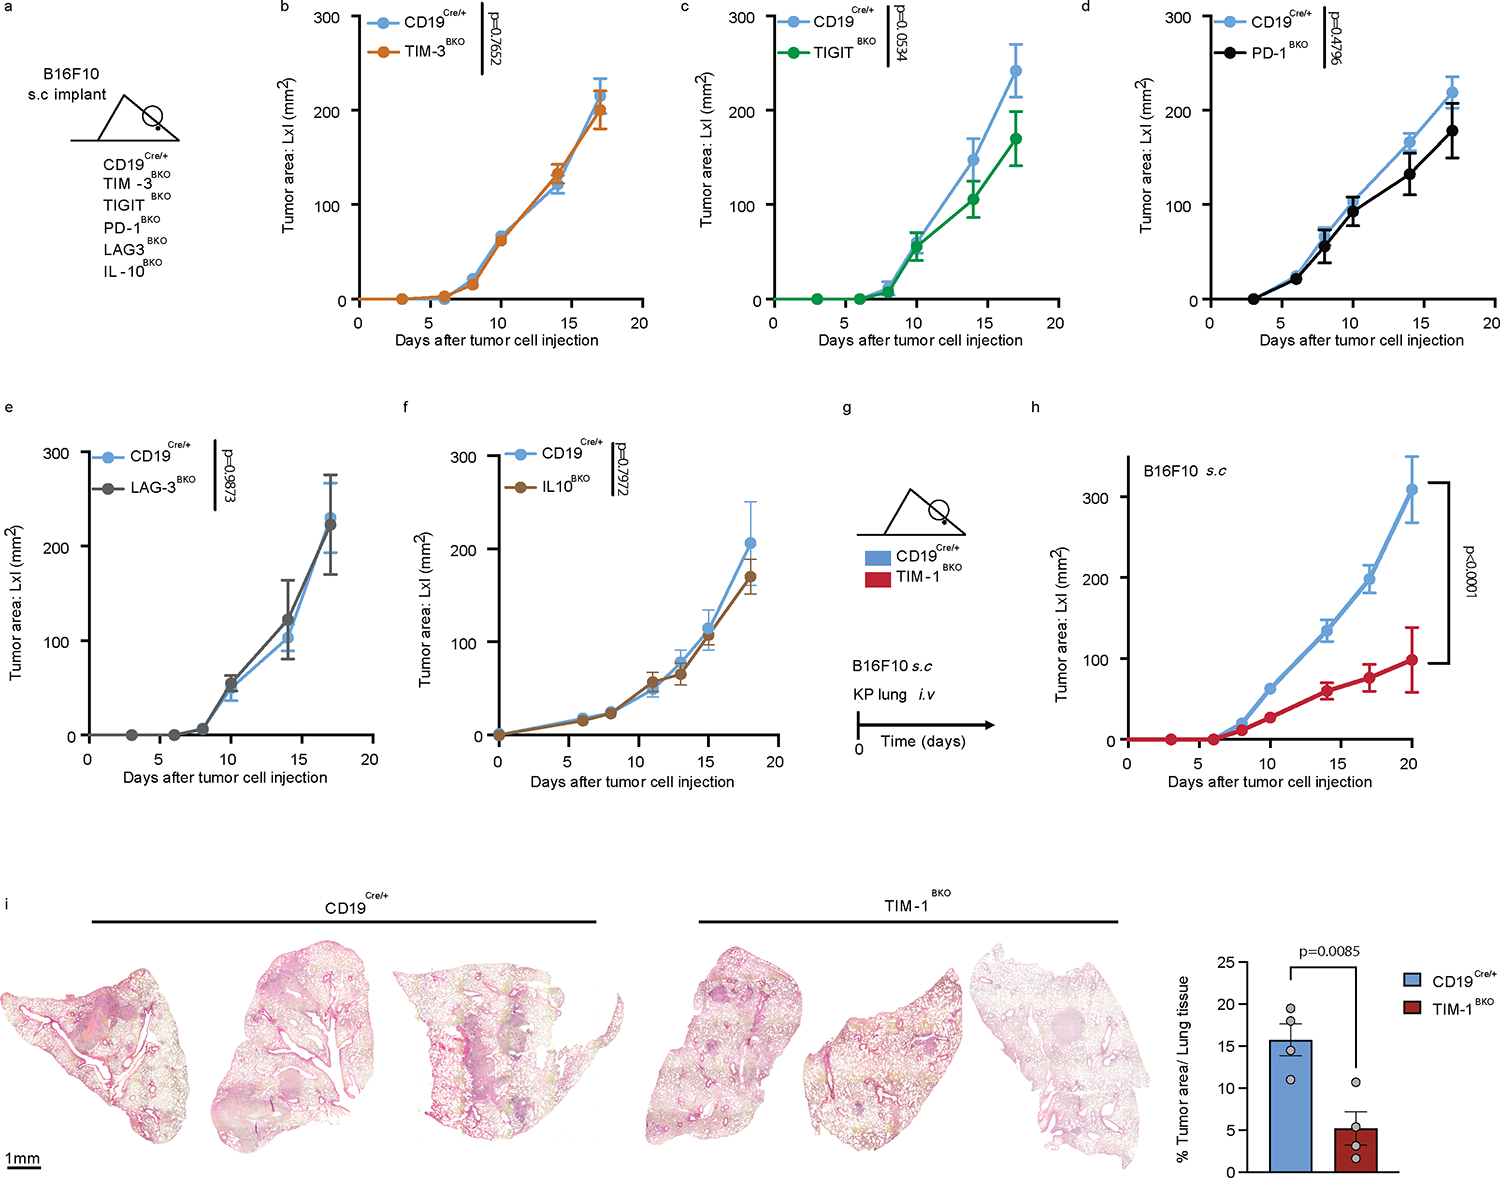
a-f, Subcutaneous B16F10 melanoma growth in CD19Cre/+ (n=5) and TIM-3BKO (n=5) (b), TIGITBKO (n=6) (c), PD1BKO (n=4) (d), LAG3BKO (n=4) (e), IL10BKO (n=4 controls vs 4 IL10BKO) (f) mice. g-i, tumor growth in CD19Cre/+ and TIM-1BKO mice implanted with B16F10 subcutaneous (n=6 control vs 9 TIM-1BKO) or with KP1.9 cells were injected i.v. into CD19Cre/+ and TIM-1BKO mice (n=4 mice per group) (i). Tumor burden was assessed by histological analyses of lung tissue harvested 4 weeks post injection. Data are mean ± s.e.m and pooled from two to three independent experiments. Repeated measures two-way ANOVA test in b, c, d, e, f and h; two-tailed Student’s t-test in i.
Conversely, conditional deletion of Havcr1 (TIM-1) on B cells dramatically inhibited tumor growth in various B16F10 melanoma tumor models, as well as MC38 colon carcinoma or KP1.9 lung adenocarcinoma (Fig. 2g–i, Extended Data Fig.5a–e), indicating that TIM-1 is not only a marker of checkpoint-receptor expressing B cells, but that TIM-1 has a functional role in regulating tumor growth in vivo. Notably, while TIM-1 was initially described to be expressed on T cells, TIM-1 conditional deletion using CD4Cre, which deleted TIM-1 on all T cells had no effect on tumor growth in mice implanted with B16F10 melanoma (Extended Data Fig. 5f and g), supporting a cell-intrinsic role of TIM-1 in B cell function. Together, these data demonstrate an important role of TIM-1 specifically expressed on B cells in regulating anti-tumor immune responses and tumor growth in vivo.
TIM-1 blockade reduces tumor growth
To examine whether acute deletion of TIM-1 also regulates tumor growth, we generated hCD20.TamCre x TIM-1fl/fl (TIM-1iBKO) mice and treated the mice with tamoxifen to trigger acute Cre-mediated TIM-1 deletion and observed inhibition of tumor growth similar to that with constitutive deletion of TIM-1 in B cells (Extended Data Fig. 5h). Moreover, this indicates that deletion of TIM-1 on B cells using another Cre-driver independent of CD19Cre induces similar control of tumor growth.
Next, therapeutic administration of a commercially available high-affinity anti-TIM-1 antibody (3B3) also induced marked inhibition of B16F10 tumor growth (Extended Data Fig. 5i). This therapeutic effect required the presence of B cells, and of TIM-1 expression on B cells, such that the therapeutic effect of anti-TIM-1 antibody was lost in μMT (lacking B cells) or TIM-1BKO mice (Fig. 3a and Extended Data Fig. 5i–j). Notably, we found that anti-TIM-1 treatment had a therapeutic effect inhibiting tumor growth selectively in mice with intact MHCII expression on the B-cell surface (Extended Data Fig. 5k).Whereas 3B3 has previously been reported to be an agonistic antibody based on activating T cell effector functions, in B cells the effects of 3B3 antibody are very similar to what we observed with loss of TIM-1 on B cells. Whether this is due to differential effects of TIM-1 on T cells versus B cells needs to be further characterized, nonetheless the therapeutic effects of anti-TIM-1 antibody on tumor growth. Since TIM-1 expression on T cells has no impact on tumor growth, in vivo effects of anti-TIM-1 antibody appear to be entirely dependent on the expression of TIM-1 on B cells. Moreover, we performed anti-TIM-1 treatment experiments using the spontaneous melanoma model: Tyr-CreERT2, BrafCA/WT, and Ptenlox/lox (called Braf-Pten from hereon) mice carrying a tamoxifen-inducible Cre-recombinase under the control of the tyrosinase promoter. This model allows melanocyte lineage-specific induction of a BRAFV600E mutation and deletion of Pten, inducing spontaneous melanoma formation and replicating many of the features of human melanoma. Remarkably, treatment with anti-TIM-1 (clone 3B3) significantly reduced melanoma genesis and proximal metastatic dissemination (Fig. 3b and c). Lastly, combined PD-1 blockade (as a T cell relevant target) together with anti-TIM-1 antibody treatment had an additive effect, consistent with an impact on two compartments, resulting in more rapid and consistent growth control and prolonged survival in B16F10-bearing mice than either treatment alone (Fig. 3d and Extended Data Fig. 5l). Monotherapy with anti-TIM-1 or in combination with PD-1 blockade was accompanied by an increased frequency of effector CD4+ and CD8+ T cells infiltrating the tumors of antibody-treated animals, without affecting B cell or regulatory T cell (Tregs) infiltration (Extended Data Fig. 5m) and with an induction of a larger fraction of Granzyme B+ CD8+ T cells and TNFα+ IFNγ+ cells among both CD4+ and CD8+ T cell compartments (Fig. 3e and Extended Data Fig. 5n). Altogether, these data show that therapeutic antibody blockade of TIM-1 in vivo results in tumor growth control of both transplanted and spontaneous tumor models and requires TIM-1 expression on B cells, but not on other cell types, which is consistent with the phenotype observed in tumor-bearing mice with genetic deletion of TIM-1 in B cells.
Fig. 3: TIM-1 targeting reduces B16F10 growth, depends on TIM-1 expression on B cells and augments PD-1 blockade therapy.
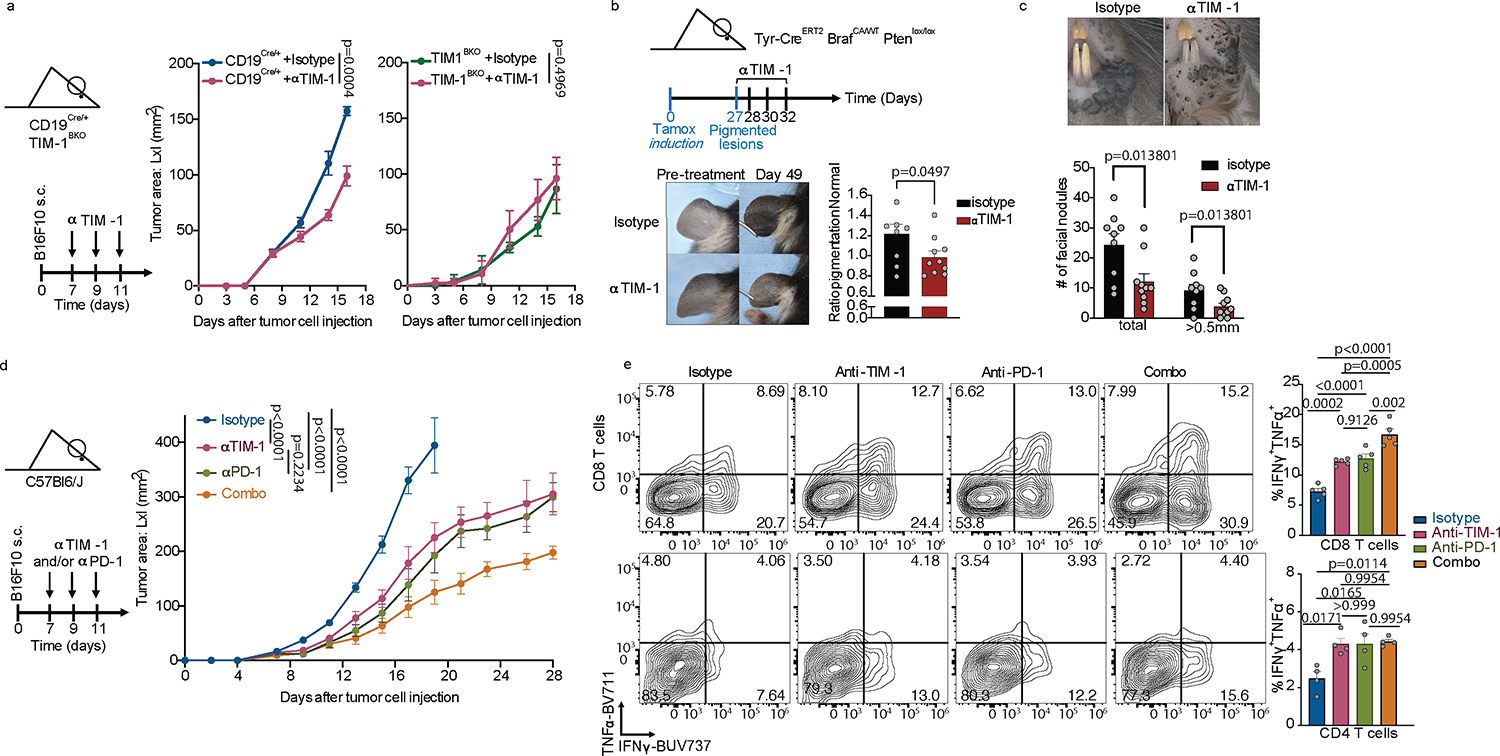
a, B16F10 tumor growth in CD19Cre/+ and TIM-1BKO mice (n=8 mice per group) treated with anti-TIM-1 or isotype control antibodies. b and c, Tyr-CreERT2 BRafCA/WT Ptenlox/lox mice were painted with 4-hydroxytamoxifen on one ear and treated with anti-TIM-1 antibody beginning 27 days later when visible lesions were apparent. Shown are representative photographs and pigmentation (b) or number of facial (c) measurements of Isotype (n=9 mice) or anti-TIM-1 (n=10 mice) treated ears at treatment and 3 weeks after treatment initiation/7 weeks after tumor induction. Data are mean ± s.e.m and pooled from two to three independent experiments. d and e, tumor growth (d) and flow cytometry immunophenotyping of TILs depicting frequencies of IFNγ+TNFα+ cells among CD8+ and CD4+ TILs (e) of C57Bl/6J implanted with B16F10 melanoma and treated with either anti-TIM-1, anti-PD-1, anti-TIM-1 + anti-PD-1 (combo), or isotype controls (n=8 mice per group for tumor growth analysis and 5 mice per group for flow cytometry analysis). Repeated measures two-way ANOVA test in a and d. One way ANOVA with Tukey's multiple comparisons test in e.
TIM-1+ B cells shape effector responses
To investigate how TIM-1 loss in B cells affects tumor growth, we analyzed the composition of CD45+ cells in the tumor microenvironment (TME), dLN and ndLN from control or TIM-1BKO mice by flow cytometry at 16 days after receiving subcutaneous B16F10 cells (Fig. 4a and b, Extended Data Fig. 6). There was an increased immune cell infiltration in TIM-1BKO versus control tumors (Extended Data Fig. 6b), and a significant increase in the frequency of CD8+ T cells, and decreased frequency of FOXP3+ CD25+ cells (Tregs) among CD4+ T cells, resulting in an approximately 4-fold increase in the ratio of CD8+ T cells to Tregs (Extended Data Fig. 6c–e). In addition, there was a decreased proportion of Tregs within the dLN of TIM-1BKO mice (Extended Data Fig. 6k). Myeloid cell subsets and B cells were unchanged in either the tumor or the LNs (Extended Data Fig. 6f). Moreover, amongst TILs from TIM-1BKO mice, a larger fraction of CD8+ and CD4+ T cells secreted both TNFα and IFNγ in tumors compared to control mice, and CD8+ T cells displayed a stronger cytotoxic profile, with elevated expression of CD107a, and an increased frequency of CD8+ T cells co-expressing granzyme B and perforin or the transcription factors eomes and tbet that regulate IFNγ production (Fig. 4a and b, Extended Data Fig. 6f and g). However, IL-2 production was not changed in CD4+ or CD8+ cells (Fig. 4a), and there were no alterations in TCF1 expression levels nor the checkpoint molecules PD-1 and TIM-3 co-expression (Extended Data Fig. 6h and i). Similar results were obtained in mice receiving MC38 colon adenocarcinoma (Extended Data Fig. 6l).
Fig. 4: TIM-1 deletion in B cells enhances anti-tumor T cell immunity.
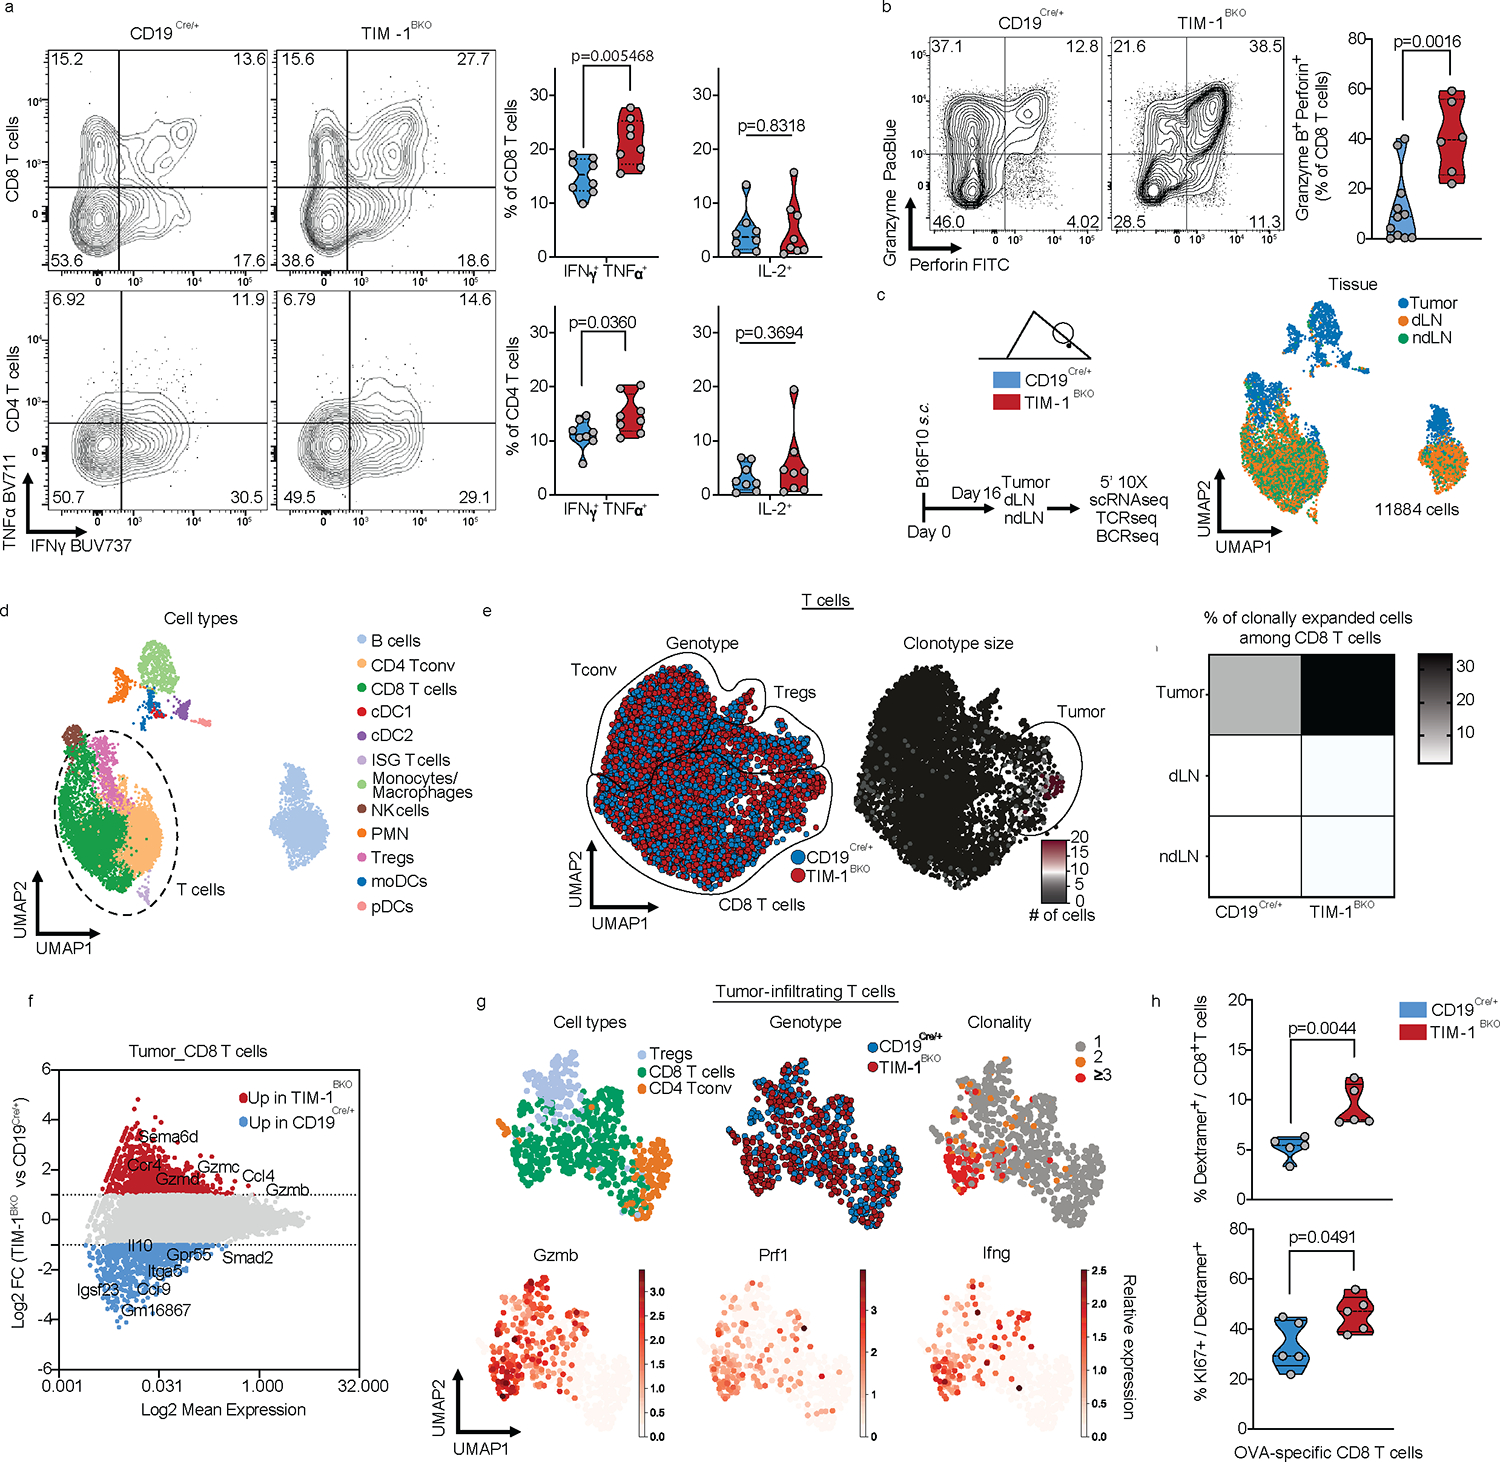
a and b, Flow cytometry analysis of TILs derived from CD19Cre/+ and TIM-1BKO mice implanted with B16F10 s.c. Representative FACS plot and percentage of IFNγ and TNFα double-producing cells and IL-2 within tumor-infiltrating CD8+ (top) and CD4+ (bottom) T cells (n=8 mice per group) (a), Representative FACS plot and percentage of Granzyme B and perforin double-expressing CD8+ T cells (n=11 controls and n=6 TIM-1BKO mice) (b). c-g, scRNA/BCR and TCR-seq of the TME, dLN and ndLN from CD19Cre/+ and TIM-1BKO mice bearing B16F10 melanoma. Schematic of the experimental design and UMAP of 11,884 CD45+ cells colored by their tissue of origin (c) and immune cell types (d). e, UMAP projection of CD19Cre/+ (blue) and TIM-1BKO (red) T cells delineated between CD4+ conventional T cells (Tconv), Tregs and CD8+ T cells (left panel) and clonally expanded T cells (middle panel). Frequencies of clonally expanded CD8+ T cells in different compartments (e, right panel). f, MA plot of gene expression comparing CD19Cre/+ versus TIM-1BKO CD8+ TILs. Positive log2 fold change corresponds to up-regulation within TIM-1BKO CD8+ TILs and vice versa. g, UMAP of TILs colored by cell types (top left), genotypes (top middle), clonal expansion (top right) and bottom panels show expression of the indicated markers. h, Frequencies of OVA-specific cells among CD8+ TILs (top) and KI67-expressing OVA-specific CD8+ TILs (bottom) (n=5 mice per group). Data are mean ± s.e.m and pooled from at least two to three independent experiments. two-tailed Student’s t-test in a, b and h.
To further characterize these changes in the tumors of TIM-1BKO, we profiled 11,884 CD45+ cells infiltrating the tumors, dLN and ndLN from these mice by combined single-cell RNA- and TCR-seq (scRNA/TCR-seq, Fig. 4c, d, Extended Data Fig. 7a and b). scRNA-seq confirmed an increase in cytotoxic CD8+ T cell infiltration in TIM-1BKO tumors vs. controls and showed a higher frequency of clonally expanded CD8+ T cells in TIM-1BKO tumors based on TCR analysis (30.3% vs 11.7% of clones with more than 2 cells) (Fig. 4e, Extended Data Fig. 7c, Methods). Notably, clonally expanded CD8+ T cells from TIM-1BKO tumors displayed a higher expression of genes associated with an effector/cytotoxic phenotype (i.e Gzmb, Gzma, Gzmc, Prf1, Ifng, Ccl4) (Fig. 4f, g, Extended Data Fig. 7d). Consistently, TILs from B16-OVA bearing mice showed an increased frequency of proliferating OVA-specific CD8+ T cells in TIM-1BKO tumors vs. control as determined by H-2Kb-OVA257–264 dextramer staining and KI67 expression (Fig. 4h). Taken together, these data indicate that the deletion of TIM-1 in B cells gave rise to decreased Treg infiltration and increased clonally expanded antigen-specific CD8+ TILs.
TIM-1 restrains B-cell antigen presentation
To determine the mechanism by which TIM-1 deletion in B cells influenced T cell-mediated anti-tumor responses, we analyzed the B cell-intrinsic effects of the genetic loss of TIM-1. Although there were no differences in the total frequency of B cells in TIM-1BKO tumors, dLN and ndLN relative to their respective controls (Extended Data Fig. 8a), scRNA-seq profiles of TIM-1BKO B cells from dLN and tumors (but not ndLNs) had higher expression of signatures of the response to type I and type II interferons (Fig. 5a–c, Extended Data Fig. 9a and 10a, e.g., Ifnar2, Irf1, Irf9, Stat1, Stat2). Type I interferons are critical regulators of B cell homeostasis and responses32,33 and potentiate BCR-driven activation, co-stimulation and antigen presentation pathways in B cells32,34. Consistently we found significant enrichment for BCR signaling (not shown), B cell activation (Lyn, Tnfrsf13c, Btla, Cd81, Cd22) and antigen processing and T cell antigen presentation and co-stimulation (Icosl, Cd40, Ciita) gene signatures (Fig. 5a–c, Extended Data Fig. 9b). Supporting these RNA expression patterns, there was increased surface expression of CD86, MHC II and ICOSL on TIM-1BKO B cells infiltrating the tumors (Extended Data Fig. 9c). Although TIM-1 deletion increases the response to type-1 interferons and B cell activation, humoral immunity was largely unaffected by its deletion in the tumor setting. Flow cytometry showed similar frequencies of plasmablasts (B220+ CD138+), plasma cells (B220low/− CD138+), GC B cells (CD19+ GL-7+Fas+) or TFh cells within the dLN and spleen from TIM-1BKO and control mice (Extended Data Fig. 8b–d and 8k–m). Furthermore, we did not observe significant differences in circulating immune complexes (CICs)35 or in the total amount of IgGs, IgA or IgM in in the serum of either naïve or B16F10-bearing TIM-1BKO and control mice (Extended Data Fig. 8e–h). More importantly, the levels of B16F10-reactive IgGs and IgM were also unaltered in TIM-1BKO sera (Extended Data Fig. 8i). Finally, we did not detect a significant increase of class-switched nor clonally expanded B cells across the compartments and no difference in major B cell subsets in TIM-1BKO mice or mice treated with anti-TIM-1 mAb (Extended Data Fig. 8j–m). Thus, TIM-1 deletion had little to no effect on humoral immunity in tumors and lymphoid organs.
Fig. 5: TIM-1-deficiency in B cells unleashes B cell activation, antigen presentation and co-stimulatory function.
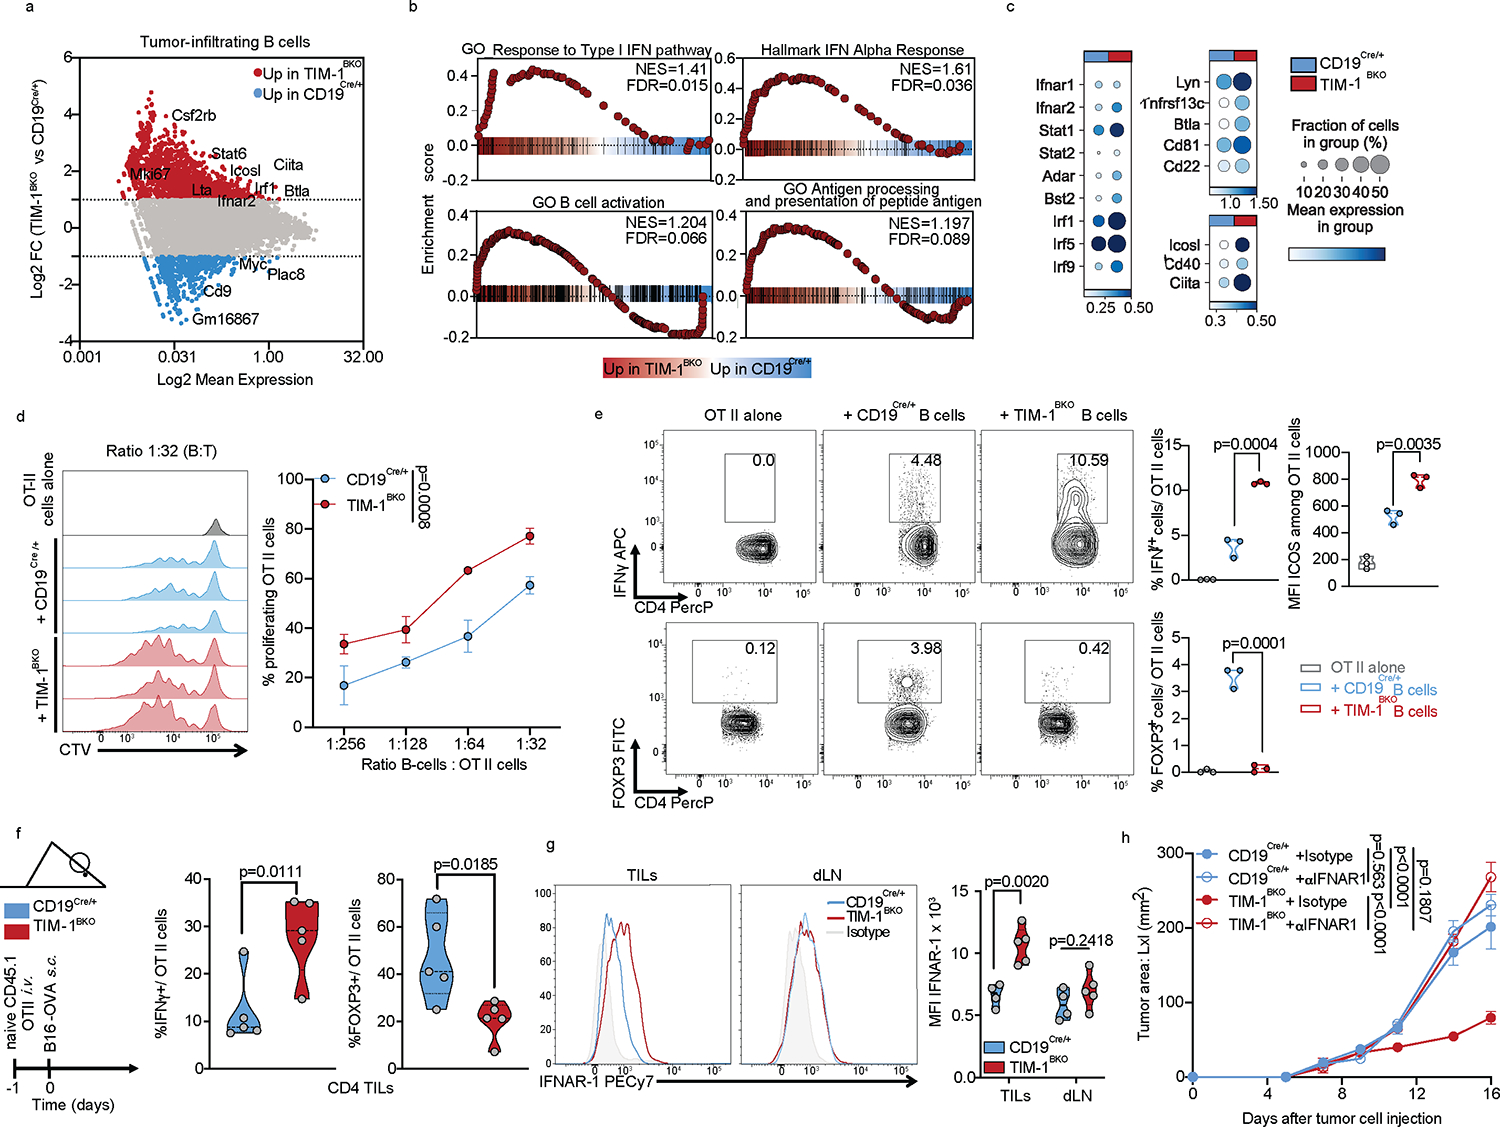
a-c, scRNAseq analysis of B cells derived from TILs, dLN and ndLN from CD19Cre/+ and TIM-1BKO mice bearing B16F10 melanoma. MA plot of gene expression comparing tumor-derived CD19Cre/+ and TIM-1BKO B cells (a), GSEA analysis (b) and dotplots depicting selected genes (c) between tumor-infiltrating TIM-1BKO and CD19Cre/+ B cells. Selected genes are annotated. d, OVA323–339 peptide-pulsed TIM-1BKO and CD19Cre/+ B cells were co-cultured with CTV-labeled OVA-restricted CD4+ T cells at different ratios for 4 days. T cell proliferation was determined by dilution of CTV. Representative histograms and quantitative analysis of proliferation indices are shown (n=3 mice per group). e, T cells were analyzed for expression of IFNγ, ICOS and FOXP3. Representative and quantitative data are shown. Circles denote data points from individual mice (n=3). f, Naïve CD45.1+ OVA-restricted CD4+ T cells were transferred i.v. 1 day prior to B16-OVA melanoma cells s.c implantation into CD45.2+ CD19Cre/+ and TIM-1BKO mice (n=5 mice per group). Tumor-infiltrating OT II cells were examined for expression of IFNγ and FOXP3. Schematic of the experimental and quantitative results are depicted. g, Quantification and representative histogram of IFNAR-1 surface expression of B cells derived from CD19Cre/+ and TIM-1BKO TILs and dLN implanted with B16F10 s.c. (n=5 mice per group). h, Tumor growth in indicated mice implanted with B16F10 melanoma and treated with isotype control (n=3 mice per group) or neutralizing anti-IFNAR-1 antibody (n=4 mice per group). Data are mean ± s.e.m and pooled or representative of at least two to three independent experiments. Repeated measures two-way ANOVA test in d and h. two-tailed Student’s t-test in e, f, and g.
On the other hand, TIM-1 deletion enhanced B cell antigen presentation to CD4+ T cells, expanded CD4+ helper T cells and reduced FOXP3+ Treg expansion. Indeed, in vitro, TIM-1BKO B cells induced greater T cell proliferation in a manner dependent on MHC II presentation (Fig. 5d, Extended Data Fig. 9d and e). Moreover, in vivo MHC II blockade abolished the enhanced anticancer efficacy in TIM-1BKO mice, suggesting a critical role for antigen presentation via MHC II in mediating tumor control in mice lacking TIM-1 in B cells (Extended Data Fig. 9f). Interestingly, TIM-1BKO B cells also influenced CD4+ T cell expansion and function as TIM-1BKO B cells induced a greater fraction of IFNγ+ cells, including a substantial increase of ICOS expression, while inhibiting FOXP3 expression in CD4+ T cells (Fig. 5e). This effect on T cell polarization was recapitulated in vivo by adoptively transferring naïve CD4+ T cells from CD45.1 OT-II donors, into congenic CD45.2 TIM-1BKO or control mice (Fig. 5f, Extended Data Fig. 9g). Tumor derived CD45.1+ CD4+ T cells in TIM-1BKO hosts exhibited increased expression of IFNγ and reduced FOXP3 expression (Fig. 5f). In addition, while FOXP3− OT II cells exhibited similar proliferative capacity in TIM-1BKO or control tumors, FOXP3+ OT II cell proliferation was reduced in TIM-1BKO tumors (Extended Data Fig. 9g), indicating that Treg cell proliferation is impaired in the TME of TIM-1BKO tumors. In addition, TIM-1BKO B cells expressed higher levels of the costimulatory ligand ICOSL both in vitro and ex vivo (Extended Data Fig. 9c,d), a recently described marker of anti-tumor B cells, potentiating T cell mediated anticancer immunity36.
Requirement for IFN type I and II sensing
During B cell activation, antigen presentation and expression of co-stimulatory molecules such as ICOSL, are tightly regulated by the type I and type II IFN signaling cascade, influencing B cell:T cell cooperation and effector T cell responses. In tumors, TIM-1BKO B cells exhibit a striking enrichment for a type I IFN gene signature, enhanced IFN-β responsiveness and a marked increased expression of IFN-alpha/beta receptor (IFNAR), constituted of the IFNAR1 and IFNAR2 chains ex vivo (Fig. 5c and g). We hypothesized that TIM-1 expression on B cells during activation suppresses the type I interferon response and as a result limits B cell activation and antigen presentation capacity. Indeed, activation of wild type B cells (CD19cre/+) with anti-IgM and anti-CD40 increases the expression of TIM-1 on B cells (Extended Data Fig. 9h) but, IFN-β limits TIM-1 upregulation with a significantly increased surface expression of CD86 and MHC II in TIM-1BKO B cells upon anti-IgM and anti-CD40 stimulation (Extended Data Fig. 9h). These data suggest an interplay between the TIM-1 and type I interferon pathways in that increased TIM-1 expression limits the response to type 1 interferons and conversely type 1 interferons limit TIM-1 expression on B cells and increase B cell activation, supporting antagonism between the two pathways.
We postulated that enhanced IFNAR signaling could regulate the anti-tumor immune response of TIM-1BKO B cells, and treated B16F10-tumor engrafted control and TIM-1BKO mice with either anti-IFNAR1 or isotype control. IFNAR1 blockade completely abrogated tumor growth control observed in TIM-1BKO mice (Fig. 5h), and inhibited the increased CD8+ T cell abundance normally observed in the TILs of TIM-1BKO mice, but did not affect Treg or IFNγ+ CD4+ T cell proportions in TIM-1BKO mice (Extended Data Fig. 9i). In addition, tumor-derived leukocytes from anti-IFNAR1-treated TIM-1BKO mice displayed decreased B cell infiltration and lower expression of MHC I, MHC II and CD86 on the B cell surface (Extended Data Fig. 9j). Lastly, projection of the intra-tumoral TIM-1BKO B cell signature onto the single-cell profiles of human melanoma-infiltrating B cells obtained from ICB responder vs. non-responder samples20, marked a distinct cluster of TIM-1BKO B cells overlapping with B cells derived from the responder patients but not in the B cells from non-responder patients treated with anti-PD-1 therapy (Extended Data Fig. 9k). Furthermore, the type I interferon response or antigen processing and presentation signatures were increased in B cell clusters (particularly cluster 4) from responders of ICB therapy and particularly the ones enriched for TIM-1BKO B cells signature supporting a potential role of these pathways in promoting anti-tumor immunity in humans (Extended Data Fig. 9l–n). As downstream signaling from interferons converges onto similar pathways, and TIM-1BKO B cells from tumors present a high signature score for the response to IFNγ (Extended Data Fig. 10a), we tested whether other interferons could inhibit TIM-1 induction in B cells in vitro. Interestingly, while IFNλ had no effect on TIM-1 expression, both IFNβ and γ significantly inhibited TIM-1 induction with a more potent role for IFNβ in both murine and human B cells (Extended Data Fig. 10b). Moreover, blockade of the IFNγ pathway using anti-IFNGR mAb partially abrogated the protective effects and restored the B16F10 growth in TIM-1BKO mice (Extended Data Fig. 10d). Finally, we interrogated the cellular source for IFNβ in the TME that acts on TIM-1BKO B cells and leads to tumor control. IFNβ was found with a high abundance in the TME, consistent with previous reports 37, but was not changed in TIM-1BKO mice, and pDCs were the highest IFNβ -expressing cell-type in the TME (Extended Data Fig. 10e and f). Moreover, pDC depletion using anti-PDCA1 antibody abrogated the tumor control observed in TIM-1BKO mice, which is consistent with the anti-IFNAR1 blockade and highlights the contribution of pDCs as the major source of IFNβ within the TME (Extended Data Fig. 10g–i). Overall, these results suggest that TIM-1 surface expression is regulated by type I and type II interferons. Moreover, TIM-1 expression limited B cell responses in the TME by regulating type I interferon receptor expression/signaling, consequently dampening their ability to present antigen and costimulate anti-tumor effector T cells.
Discussion
Whereas the role of T cells in anti-tumor immunity has been exhaustively studied, the role of B cells in anti-tumor immunity remains less well understood, hampering efforts to harness the B cell response for cancer immunotherapy. Here, we identified a subset of B cells that co-expressed TIM-1 among several other checkpoint molecules, which was increased with tumor progression in the tumor-draining lymph node. Although various checkpoint molecules expressed on B cells play an important intrinsic role in B cell homeostasis and responses26−29, only the selective deletion of TIM-1 in B cells profoundly limited tumor growth. In human cancer patients, TIM-1+ B cells also co-expressed multiple checkpoint molecules, suggesting that this co-expression cluster identifies a B cell program or activation state that is conserved between mouse and humans. Importantly, this subset was strongly decreased in the cancer patients that had received checkpoint blockade therapy. However, our observed association of high TIM-1 expression or Immune Checkpoint expressing B cells with poor clinical outcome in human cancers requires further study due to the lack of sufficient B cells captured in human tumor single-cell atlases. Our data also suggest that B cells may play an important role during B and T cell priming within the dLN, prior to acting locally within the tumor. Analysis of TIM-1+ B cells co-expressing checkpoint molecules within the sentinel lymph nodes of cancer patients would provide additional insights about the emergence of this B cell subset in human tumors.
Our analysis reveals a critical role for TIM-1 expression by B cells in promoting tumor growth, strengthening our initial findings 38. The induction of TIM-1 upon BCR-driven activation suggests that TIM-1 does not define a separate B cell lineage (Extended Data Fig. 3h). While TIM-1 marks B cells that express IL-10, a key mediator of B cell regulatory function25,39, loss of IL-10 from B cells had no effect on tumor growth control. Although TIM-1 is also expressed on other cell types40,41, including T cells as we previously described42−44, we did not observe changes in tumor burden in mice with conditional deletion of TIM-1 in T cells, suggesting a B-cell-specific role for TIM-1 on anti-tumor immunity.
Our comprehensive scRNA-seq profiling and functional analysis of the tumor microenvironment reveals two inter-connected roles of TIM-1+ B cells: (1) Inhibition of anti-tumor CD8+ and CD4+ T cells, limiting the expansion of tumor-specific effector CD8+ T cells; and (2) promotion of regulatory FOXP3+ T cell induction. Interestingly, the enhanced effector and cytotoxic profiles of T cells from TIM-1BKO tumor-bearing mice were not accompanied by an increased fraction of stem-like TCF1+ progenitors or a reduction in checkpoint receptor expression on T cells, suggesting a selective promotion of T cell effector function by TIM-1-deficient B cells. TIM-1 expressed on B cells may curtail multiple B cell functions including antigen-presentation, expression of co-stimulatory ligands, inflammatory cytokine production and cytokine responsiveness, which all coordinately promote effector anti-tumor T cell responses.
Our results highlighted a role for TIM-1 in regulating intrinsic B cell activation and function. The humoral response to B16F10 melanoma, which has been shown to either promote tumor growth or clearance of tumor cells45, was unaffected by TIM-1 deletion. However, B cells lacking TIM-1 exhibit an enhanced type I interferon response gene signature, which has been described to lower the BCR activation threshold, and to promote B cell antigen-presentation and costimulatory functions 32,33,46. Our data suggest that TIM-1 limits excessive B cell activation, antigen presentation and T cell activation, B-cell responses that are associated with a positive outcome in multiple cancers, by fostering intratumoral B cell–T cell cooperation 47–49. Gene expression of lymphotoxin β (Ltb) and Icosl, associated with formation of tertiary lymphoid structures (TLS), was increased in B cells derived from TIM-1BKO tumors (data not shown), suggesting that the enhanced interferon response may promote the development of ectopic lymphoid follicles (TLS). This suggests a mechanism whereby loss of TIM-1 on B cells affects T cell activation and expansion and is reminiscent of recent studies highlighting the cooperation of CD4+ and CD8+ T cells in anticancer immunity, and formation of TLS in effective checkpoint blockade immunotherapy in tumors 50−52. Particularly, our results set the stage for future investigations regarding the spatial organization of TIM-1+ B cells in tissues and evaluating how this impacts tumor growth or response to ICB in human tumor samples.
In summary, our study identifies TIM-1 as a critical checkpoint of B cell activation. TIM-1 impacts type 1 interferon responsiveness in B cells, limiting B cell activation, antigen-presentation and co-stimulation, thereby highlighting TIM-1 as a potential target by which B cell responses can be unleashed in promoting anti-tumor immunity. Identifying specific checkpoint molecules on B cells, such as TIM-1, may enable the harnessing of this second arm of the adaptive immune system, thereby improving therapeutic efficacy and broadening the application of immune checkpoint blockade in cancer immunotherapy.
Methods
Mice
C57BL/6J, B6.129S2-Ighmtm1Cgn/J (μMT), B6.129-Prdm1tm1Clme/J (Prdm1fl/fl), Tg(CD4-cre)1Cwi (CD4Cre) and B6.129P2(C)-Cd19tm1(cre)Cgn/J (Cd19Cre), B6. Cg-Tg(TcraTcrb)425Cbn/J (OT II), B6.SJL-Ptprca Pepcb/BoyJ (CD45.1), B6.129S2-H2dlAb1−Ea/J (MHC II KO) mice were purchased from Jackson Laboratory and bred in our facility or used for experiments after at least one week of housing in our facility. CD45.1 and OT II mice were crossed to generate CD45.1-OT II mice. Havcr1fl/fl, Tigitfl/fl, Havcr2 fl/fl, Pdcd1 fl/fl, Lag3 fl/fl, Il10 fl/fl generated on C57BL/6 background and described previously (Joller et al., 2014; Xiao et al., 2015). hCD20ERT2Cre mice 55 were kindly provided by Mark Shlomchik. Floxed mice were crossed to CD4Cre, CD19Cre or hCD20ERT2Cre mice in our facility. Havcr1+/+ or Havcr1fl/fl x hCD20ERT2Cre (hCD20TamCre and TIM-1iBKO) mice were gavaged with 4mg Tamoxifen in 200μl corn oil on days indicated in the figure. While TIM-1fl/fl and CD19Cre/+ animals had a similar tumor growth profile (not shown), we preferentially used the CD19Cre/+ mice as controls since this strain has been generated as “knock-in/knock-out” which partially impairs CD19 expression. Braf-Pten mice (B6.Cg-Braftm1Mmcm Ptentm1Hwu Tg(Tyr-cre/ERT2)13Bos/BosJ), and ZsG mice (B6.Cg-Gt(ROSA)26Sortm6(CAG-ZsGreen1)Hze/J) were purchased from The Jackson Laboratory. Mice used in the inducible cancer model (Braf-Pten -ZsG) were crosses of Braf-Pten and ZsG bred in-house and having the following genotype: Braftm1Mmcm +/−, Ptentm1Hwu +/+, Tg(Tyr-cre/ERT2)13Bos + and B6.Cg-Gt(ROSA)26Sortm6(CAG-ZsGreen1)Hze/J+/− or B6.Cg-Gt(ROSA)26Sortm6(CAG-ZsGreen1)Hze/J−/−, where “+” indicates presence of the mutant/transgenic allele and “−“ indicates allele absence. ZsG +/− and ZsG−/− mice were included in equal proportions in each treatment group. Mice at the age of 4–10 weeks were used for experiments. All experiments were conducted in accordance with animal protocols approved by the Harvard Medical Area Standing Committee on Animals or BWH and MGH IACUC.
Cell lines
B16F10 mouse melanoma and MC38 mouse colon adenocarcinoma cell lines were obtained from ATCC. B16-OVA cells (B16-F10 cells engineered to express OVA) were kindly provided by Kai Wucherpfennig (Dana-Farber Cancer Institute, Boston, MA). KP1.9 was derived from lung tumors of C57BL/6 KP mice and was kindly provided by Dr. A. Zippelius. All cells were cultured in a humidified, 5% CO2 incubator at 37 °C, and grown in RPMI or DMEM with 10% fetal bovine serum (FBS) and 100 U ml−1 penicillin/streptomycin (Life Technologies). All cell lines were tested and were negative for mycoplasma contamination.
Tumor models
For primary tumor growth experiments, MC38 (1 × 10⁶), B16F10 (2.5 × 10⁵), B16-OVA (5 × 10⁵) cells were subcutaneously (s.c) or intradermally (i.d) injected into the right flank in a final volume of 100 μL. Tumor growth was measured using digital calipers, and tumor sizes were recorded. For primary tumor cell dissemination experiments, 2 × 10⁵ B16F10 cells were injected intravenously (i.v) in the tail vein, lungs were harvested on day 14, and B16F10 colonies were counted using a dissecting microscope. For lung tumors (KP1.9, harboring Kras and TP53 mutations)56 2.5×10⁵ cells were injected intravenously in 100 μl PBS to develop orthotopic tumors. 4 weeks post injection, lungs were harvested, embedded in paraffin, sectioned (4um thickness) and colored with hematoxylin and eosin (H&E). Quantification of tumor area was calculated as a percentage of area occupied by the tumor among total lung tissue surface.
Autochthonous mouse melanoma experiments
Tamoxifen induction was initiated when Braf-Pten mice were 4 weeks old. To induce tumors, 2 μL of 10 mg/mL 4-hydroxytamoxifen (Sigma H6278) dissolved in 100% Ethanol was administered to the left ear on three consecutive days. Tumors were allowed to develop for 24–27 days, at which time visible pigmentation was present. Anti-TIM-1(clone 3B3) treatment schedule is indicated in the figure schematic. Mice were euthanized three weeks after initiation of treatment with anti-TIM-1 antibody. Differences in darkening of the skin were measured by reflective colorimetry (Commission Internationale de l’Eclairage [CIE] L* white-black color axis) utilizing a CR-400 Colorimeter (Minolta) calibrated to a white standard background calibration plate before each set of measurements. Photos were taken using a Nikon D750 DSLR camera with a Nikon Nikkor AF-S Micro 60mm lens. Photos were taken on manual with settings of shutter speed 1/400sec, aperture f/13, ISO 320. Ott-Lite Model L139AB lamps were used to create uniform lighting for photos. Facial tumors diameters were measured, and number of tumor nodules were counted manually.
In vivo treatments
In some experiments, mice were treated with 250μg of anti-TIM-1 (clone 3B3) and/or 200μg of anti-PD-1 (clone RMP1–14), anti-MHC II (clone M5/114), anti-IFNAR-1 (clone MAR-15A3) or anti-IFNGR (clone GR-20) antibodies or 250μg of control immunoglobulin (Rat IgG2a) intraperitoneally (i.p) on days 7, 9 and 11 post tumor implant. For in vivo pDC depletion, some groups of mice were injected either i.v with i.p with 250μg with anti-PDCA1 (clone 927) or their isotype control (Rat IgG2b) with schedules as indicated on the figures or figure legends.
Preparation of cell suspensions
Single-cell suspensions were prepared from mouse lymph nodes, spleens or tumors as previously described 57. Briefly, tumors were dissociated mechanically and digested with 1 mg/mL collagenase A and 0.1 mg/mL DNase1 for 20 min at 37°C. Lymph nodes and spleens were mechanically dissociated, digested with 0.1 mg/mL collagenase A and 0.01 mg/mL DNase1 for 20 min at 37°C, and passed through a 40-μm cell strainer and lysed of red blood cells (RBCs; using ACK buffer) then washed with cold PBS and spun down.
Multiplexing and droplet-based single-cell RNA-seq (scRNAseq), BCR and TCR-seq (scBCR/ scTCR-seq)
For the B cell atlas analysis or the examination of CD19cre/+ and TIM-1BKO mice, viable leukocytes were sorted by FACS-sorted from tumors (70% CD3e+ and CD19+ cells, 30% total CD45+ cells), dLN and ndLN (100% CD45+ cells) at three different time points as depicted in Extended Date Figure 2a. For the analysis of TIM-1-expressing B cells, viable B220+ CD19+ CD138+ and − cells derived from dLN, ndLN and spleen from C57Bl6/J mice were sorted by FACS. Cells were resuspended in PBS containing 2% FCS and stained with oligo tagged TotalSeq antibodies (BioLegend) for 30 minutes on ice. Cells were washed and pooled accordingly, centrifuged at 1,200 rcf for 5 minutes at 4°C and resuspended in PBS + 2% FCS. For the B cell temporal profiling, 9 samples were combined into each channel of the Chromium system (10x Genomics): Tumor, dLN, ndLN from three different timepoints: days 7, 10 and 16 of one replicate. For the examination of CD19cre/+ and TIM-1BKO, 6 samples were combined into each channel: tumor, dLN, ndLN derived from one biological replicate of each genotype. For the TIM-1 positive cells analysis, cells derived from LN were loaded in separate channels and the splenic cells TIM-1 positive and TIM-1 negative were combined. For samples that did not include scBCR-seq and/or scTCR-seq and 5' feature barcoding, sorted cells were separated into droplet emulsions using the Chromium Single Cell 3′ Solution (v2) according to manufacturer’s instructions (10x Genomics). Samples that included scBCR-seq and/or scTCRseq and 5' feature barcoding were separated into droplet emulsions using the Chromium Single Cell 5' V2 Solution, according to manufacturer’s instructions (10x Genomics). scBCR-seq, scTCR-seq and 5' feature barcoding libraries were prepared according to the manufacturer’s instructions (10x Genomics). scRNA-sequencing libraries (5’ and 3’) and 5' feature barcoding libraries were sequenced on an Illumina Nextseq 550 using the 75-cycle kit to a depth of 100 million reads per library.
Pre-processing of droplet-based scRNAseq data and VDJ-seq – time course dataset
Three sample sets were loaded, each sample set on two separate 10x channels. Sample sets included samples from tumor, draining and non-draining lymph node from day 7, day 10 and day 16 post injection. Cells from a separate location and time point were hashed separately to be distinguishable in the analysis. Hashed scRNA-seq expression profiles were processed in Terra (https://app.terra.bio/) through the ‘demultiplexing’ workflow in scCloud/ Cumulus (v 0.8.058), a wrapper for cellranger_mkfastq, cellranger_count (v 3.0.2), and cumulus_adt. Profiles were mapped to the pre-built mouse reference mm10, cellranger reference v1.2.0 (Ensembl v84 gene annotation), specifying that the profiles were obtained with the 10x 5’ chemistry. After mapping, cell profiles were processed to remove ambient RNA with CellBender 59 through the Terra workflow ‘run_cellbender_remove_background_gpu’, with Docker image ‘us.gcr.io/broad-dsde-methods/cellbender:latest’ (as of Jan 30, 2020) with epochs = 300, low-count-threshold = Null, expected-cells: 15000 (Timecourse_1, repl1&2), 3000 (Timecourse2_repl1&2), or 7000 (Timecourse3_repl1&2). Next, cell profiles were matched with antibody derived tags (ADT) counts to assign their identity, as samples from different time points or locations had been associated with unique combinations of 2 hashing antibodies. Cells with incorrect combinations of hashing antibodies were discarded from the analysis. Separately, reads from the VDJ libraries (BCR and TCR) were processed with Cumulus, using the pre-built reference GRCm38_vdj_v3.1.0, part of cellranger reference 3.1.0, annotation built from Ensembl Mus_musculus.GRCm38.94.gtf. Filtered_contig annotations and filtered_contig.fasta from the two separate channels of each sample set (technical replicates) were merged before further processing.
RNA profiles were then processed with Scanpy (v 1.7.2). Cells were filtered out if their fraction of mitochondrial genes was ≥ 4.5% or if they had < 1,000 counts or < 300 or >6,000 genes. Genes detected in ≤1 cell were also filtered out. Each cell transcriptome was scaled to sum to 10K, and expression values were further normalized with log1p, finally obtaining log (TP10K +1) values for each gene. Scrublet 60 was run to detect doublets and only cells with a doublet score of <0.5 were retained for the analysis. Highly variable genes were selected using the highly_variable_genes function in scanpy, with min_mean=0.01, max_mean=3, min_disp=0.25. Normalized values were then scaled to unit variance with a max_value for standard deviation equal to 10. Dimensionality reduction with UMAP, using a k-nearest neighbor graph (k=15), was performed after batch correction with Harmony 61 (using the harmony-pytorch wrapper) on biological replicates. Cells from the draining lymph node and non-draining lymph node in day16, in the third biological replicate, clustered separately from cells from the other two biological replicates even after batch correction and displayed higher expression of ribosomal genes and genes associated with oxidative stress. We removed these samples from the analysis. Furthermore, around 300 cells were identified as potential doublets from the expression of markers from different cell types (i.e. Cd19/Lyz2, Cd19/Cd3e or Cd4/Cd8) and were excluded from the analysis. Preprocessing described above was repeated after removing these cells from the dataset. Finally, the dataset included 34,071 cells, 17,763 genes with 1,658 genes identified as highly variable genes.
A B cell-only embedding was obtained repeating the same processing described above starting only from single cells annotated as B cells in the full time-course dataset, with the exception of n=5 in sc.pp.neighbors.
Pre-processing of droplet-based scRNAseq data and VDJ-seq – TIM-1BKO dataset
Hashed transcriptional profiles from three sample sets of CD19Cre/+/ TIM-1BKO samples (each sample set including cells from tumor, draining and non-draining lymph node from a CD19Cre/+and TIM-1BKO replicate, each loaded on a single 5’ channel) were processed in Terra with scCloud/ Cumulus (v 0.8.0) as described for the time-course dataset above. After mapping, cell profiles were processed to remove ambient RNA with CellBender 59 (latest version as of Jan 30, 2020) as described above, with expected-cells at 5,000 (Rep.1), 10,000 (Rep.2), and 1,000 (Rep.3). Cells with incorrect combinations of hashing antibodies were discarded from the analysis. Reads from the VDJ libraries (BCR and TCR) were processed with Cumulus, as described for the time-course dataset. RNA profiles were processed with Scanpy (v 1.7.2). Cells were filtered out if their fraction of mitochondrial genes was ≥ 7.5% or if they had < 500 or >5,000 counts or < 300 or >5,000 genes. Genes detected in less than 3 cells were also filtered out. Each cell profile was scaled to sum to 10K and gene expression values were further normalized with log1p, finally obtaining log (TP10K +1) values for each gene. Scrublet 60 was run to detect doublets and only cells with a doublet score of <0.5 were retained for the analysis. Highly variable genes were selected using the highly_variable_genes function in scanpy, with min_mean=0.05, max_mean=3, min_disp=0.2 run in each individual replicate. Only genes identified as variable in at least 2 batches were retained. Normalized values were then scaled to unit variance with a max_value for standard deviation equal to 10. Dimensionality reduction with UMAP, using a k-nearest neighbors (k-NN) graph (k=15) was performed after batch correction with Harmony 61 (using the harmony-pytorch wrapper) on biological replicates. Finally, the dataset included 11,884 cells, 15,337 genes with 1,668 genes identified as highly variable genes.
A T cell-only embedding was obtained repeating the same process described above starting only from single cell profiles annotated as T cells in the full CD19Cre/+/ TIM-1BKO dataset with the exception of the harmonization.
Pre-processing of droplet-based scRNAseq data – Tim1 positive/negative dataset
ScRNA-seq profiles from B cells from draining and non-draining lymph nodes, sorted for Tim1 surface presence and processed in 4 separate 10x channels were processed in Terra scCloud/Cumulus (v 0.10.0) as described above, specifying 10x 3’ V2 chemistry. After mapping, cell profiles were processed to remove ambient RNA with CellBender 59 (latest version as of Feb 12, 2020) as described above, with expected cells at 2,500 (dLN_T1p), 2,500 (nLN_T1n), and 700 (nLN/nLN_T1p).
ScRNA-Seq profiles from B cells from spleen from tumor-bearing mice, sorted for Tim1 surface presence and hashed together, were also processed in Terra with scCloud/ Cumulus (v 0.8.0) as described above, specifying that the profiles were obtained with the 10x 3’ V2 chemistry. After mapping, cell profiles were processed to remove ambient RNA with CellBender 59 (latest version as of Jan 30, 2020) as described above, with expected cells: 12000. ScRNA-seq profiles were then processed with Scanpy (v 1.7.2). Cells were filtered out if their fraction of mitochondrial genes was ≥ 7.5% or if they had < 500 or >25,000 counts or < 200 or >5,000 genes. Genes detected in ≤1 cell were also filtered out. Each cell profile was scaled to sum to 10K and gene expression values were further normalized with log1p, finally obtaining log (TP10K +1) values for each gene. Scrublet 60 was run to detect doublets and only cells with a doublet score of <0.5 were retained for the analysis. Highly variable genes were selected using the highly_variable_genes function in Scanpy, with min_mean=0.0125, max_mean=3, min_disp=0.35. Normalized values were then scaled to unit variance with a max_value for standard deviation equal to 10. Dimensionality reduction with UMAP, using a k-nearest neighbors (k-NN) graph (k=15), was performed after regressing out with Harmony 61 (using the harmony-pytorch wrapper) the tissue of origin (draining or non-draining lymph node, spleen) and differences in sample processing (hashed vs. non-hashed samples).
A small number (< 100) of possible contaminant cells expressing Lyz2 and Timd4 were excluded from the analysis, and the dataset was reprocessed as described above.
Finally, the dataset included 13,067 cells, 15,284 genes with 2,215 genes identified as highly variable genes.
Scoring cells using signature gene sets
To calculate a score for a specific set of genes in a given cell, B cell lineage signatures in supplementary table 1, signatures obtained from MSigDB 62,63, or other sources as indicated in the figures, we computed scores using scanpy (tl.score_genes). The signature score for each cell was then defined as the average expression of a set of genes subtracted with the average expression of a reference set of genes randomly sampled from the gene pool for each binned expression value.
Differentially expressed genes in scRNA-seq
Differential expression analysis was performed with a two-sided t-test or Wilcoxon rank-sum test as indicated using scanpy’s “rank_genes_groups” function. Subsequently, genes were retained if the fraction of expressing cells within the considered group was ≥0.1, the fraction of expressing cells in the other group was ≤0.95, and the fold-change between groups was at least 2 (Extended Data Figure 3h) or 1 (Fig. 4f and Fig. 5a). We considered genes with a Benjamini-Hochberg FDR<0.05 as significant in Extended Data Figure 3h. The ranked gene lists for cluster 3 B cells from the time course dataset and TIM-1BKO B cells derived from tumor, dLN and ndLN are depicted in supplementary tables 2 and 5.
Surface marker prediction using COMET 7
COMET was applied to predict cell surface markers for clusters of interest. Murine surfaceome64 gene list was used, and other parameters were set to default.
Analysis of scTCR-seq data
TCR sequences for each single T cell were assembled by CellRanger vdj pipeline (v.3.1.0) as described above, leading to the identification of CDR3 sequences and the re-arranged TCR gene. TCR repertoire analysis was performed with Scirpy65 (v.4.2). TCR diversity and TCR clonal size were estimated using scirpy.tl.alpha_diversity and scirpy.pl.clonal_expansion (performing the normalization), respectively. V(D)J gene usage was estimated with scirpy.pl.vdj_usage.
Analysis of scBCR-seq data
BCR sequences for each single B cell were assembled by CellRanger vdj pipeline (v.3.1.0) as described above. V, D, J chain assignment and clonal group definition was performed with Immcantation6, run using the provided Docker container image (v4.1.0), following the recommendations for 10x datasets from the tutorial, specifying species « mouse » and a conservative distance threshold « 0.1 ».
Analysis of published scRNA-seq studies of human cancer
Processed scRNA-seq data were obtained from previously published, publicly available datasets and are depicted in the supplementary table 4. These datasets included tumor-derived leukocytes isolated pre- and/or post-ICB, from both responding and non-responding patients. We preferentially included count data that had been generated using plate-based platform Smart-Seq2, for a higher sequencing depth and better capture of HAVCR1 transcripts. However, due to the limited availability of Smart-Seq2-generated datasets with a design relevant to the current study, we also selected datasets that had been generated using droplet-based platforms (e.g. 10x Genomics Chromium). For downstream analysis, datasets from these respective protocols were analysed separately. All datasets were used without any change to processing, using the same expression values and cell annotations as originally reported. Additionally, we obtained published and processed scRNA-seq data from ICB responders or non-responders 24 from Gene Expression Omnibus (GEO), accession GSE120575. B cells and plasma cells were identified by the expression of Cd19, Cd79a, CD79b, Sdc1, Jchain and Prdm1, then sub-clustered and processed as described above. For some analysis, the human orthologues of selected genes or TIM-1BKO B cell signature gene were determined with the Ensembl project’s Biomart database (Ensembl v.101). The signature score was defined as the relative average expression of the ortholog genes of the signature of tumor-infiltrating TIM-1BKO B cells, GO response to type I IFN (GO:0034340) and GO antigen processing and presentation of peptide antigen (GO:0048002) as computed using scanpy (tl.score_genes). The cell density of the depicted categories was shown by sc.tl.embedding_density (Extended Data Figures 4j, and 9k).
Merging, integrating and clustering of Smart-Seq2 datasets
For each Smart-Seq2 scRNA-seq dataset, TPM count tables and metadata (including quality control metrics, cell type assignment, ICB treatment status, etc) were obtained directly from the original publications or through the Single Cell Portal from the Broad Institute (https://singlecell.broadinstitute.org/single_cell). B cells were selected from each dataset, with selection based on the original annotation as provided by the authors. Although we did not change the pre-processing of the cells, we did remove genes that were expressed in less than 2 cells, to exclude artifacts and redundantly expressed genes. Similarly, mitochondrial and ribosomal protein transcripts marked with the prefix “MT-“ and “RP-“ were discarded.
The individual datasets were merged using “AnnData.concatenate()” and the normalized counts were subsequently log1p-transformed. Highly-variable genes among the concatenated dataset were identified using scanpy’s “highly_variable_genes()” function, with the mean normalized expression set between 0.5 and 3, and a quantile-normalized variance > 0.5. Normalized values were scaled to unit variance with a maximum standard deviation set to 10. We ran principal component analysis on the highly variable genes and subsequently used “harmony_integrate()” from Harmony to correct for batch effects between the different datasets. We next computed a k-nearest neighbour graph, with the number of neighbours set to 20, followed by dimensionality reduction using UMAP. Cells were clustered using the Leiden algorithm, an improved version of the Louvain algorithm, with a clustering resolution of 1.2. Default values were used for the remaining parameters. The resulting dataset included 2615 cells, 10,687 genes with 1,618 genes identified as highly variable genes, divided among 6 clusters.
Merging, Integrating and Clustering of Data from Droplet-based Platforms (10x Genomics Chromium)
For each 10x scRNA-seq dataset, gene transcript count tables and metadata (including quality control metrics, cell type assignment, ICB treatment status, etc) were obtained directly from the original publications or through the Single Cell Portal from the Broad Institute (https://singlecell.broadinstitute.org/single_cell). B cells were selected from each dataset, with selection based on the original annotation as provided by the authors. Although we did not change the pre-processing of the cells, we did remove genes that were expressed in less than 2 cells, to exclude artifacts and redundantly expressed genes. Similarly, mitochondrial and ribosomal protein transcripts marked with the prefix “MT-“ and “RP-“ were discarded.
The individual datasets were merged using “AnnData.concatenate()”. Expression values were normalized to sum 10,000 reads per cell and the the normalized counts were subsequently log1p-transformed. Highly-variable genes among the concatenated dataset were identified using scanpy’s “highly_variable_genes()” function, with the mean normalized expression set between 0.00125 and 3, and a quantile-normalized variance > 0.5. Normalized values were scaled to unit variance with a maximum standard deviation set to 10. We next ran principal component analysis on the highly variable genes and used “harmony_integrate()” from Harmony to correct for batch effects between the different datasets. We next computed a k-nearest neighbour graph, with the number of neighbours set to 25, followed by dimensionality reduction using UMAP. Cells were clustered using the Leiden algorithm, an improved version of the Louvain algorithm, with the resolution of clustering of 1.2. Default values were used for the remaining parameters. The resulting dataset included 110,064 cells, 16,313 genes with 2,008 genes identified as highly variable genes.
Differential abundance analysis
To explore the differential abundance of each cluster between the treatment-naïve cohort and post-treatment group, the MiloR R package was used. Specifically, we used a predesigned pipeline that allowed interoperability between the R version of Milo with python-compatible anndata objects according to the following code depicting by the authors of the algorithm: https://github.com/MarioniLab/milo_analysis_2020/blob/main/notebooks/milo_in_python.ipynb). Before running the pipeline, we only selected cells derived from patients that contained cells from both pre- and post-treatment conditions. One dataset [zhang et al.] did not contain both timepoints and was excluded from further differential abundance analysis. Likewise, cells where the timing of acquisition was unclear were discarded. The remaining cells were used to recompute a k-nearest neighbor (KNN) graph, with the number of nearest neighbours set to 10, and the number of reduced dimensions set to 40. Subsequently, cell neighbourhoods were computed using miloR’s “makeNhoods()” function, with 10% of the cells, the value of k set to 5 and a number of reduced dimensions of 30. For each neighbourhood, the fraction of cells derived from the pre-treatment and post-treatment was established. We then used “calcNhoodDistance()” to calculate the distance between neighbourhoods, followed by differential abundance testing within each neighbourhood using the “testNhoods()” function. Differentially abundant neighbourhoods (classified as having an FDR-corrected p-value lower than 0.05) were assigned one of the previously established B cell subtypes when >70% of the cells in the neighbourhood belonged to this specific subset. Neighbourhoods where <70% of the cells belonged to a single B cell subset were annotated as “Mixed”.
Bulk RNA-Seq
1,000 live PAN-B cells (CD45+ CD3e− CD138+ CD19+/− cells) or TIM-1+ vs TIM-1− B cells were double-sorted by FACS and immediately lysed in TCL buffer (QIAGEN) supplemented with 1% ß-mercaptoethanol (Sigma). Full-length RNA-seq libraries were prepared following a modified SMART-Seq2 protocol 66 as previously described 67. cDNA concentration was measured using the Quant-iT PicoGreen dsDNA Assay Kit (ThermoFisher Scientific) and normalized to .25ng/ μl. cDNA libraries were prepared using the Nextera XT DNA Library Preparation kit (Illumina). Final libraries were confirmed to have a size of 500 bp using a Bioanalyzer (Agilent). Prior to sequencing, the uniquely barcoded libraries were pooled, normalized to 2nM, and denatured using 0.1N NaOH. Flow cell cluster amplification and sequencing were performed according to the manufacturer’s protocols using the paired-end Illumina sequencing (38bp X 2) with 75 cycle Nextseq 500 high output V2 kit (Illumina).
Bulk RNA-Seq data analysis
Reads were extracted with Illumina’s Bcl2Fastq, run via the KCO (http://kcoserver.broadinstitute.org:8088/) Galaxy server 68. Reads were mapped and expression of genes was quantified using rsem-1.2.8 69, run from the KCO Galaxy server as above using as annotation “mm10_ucsc_genomestudio_genes”. Expression was quantified as gene-level TPMs (Transcripts Per Kilobase Million). Differential expression analysis and pathway enrichment analysis (Fig. 1l, Extended Data Figure 1d–g) were performed using iDEP 70 (v0.92) and DESeq2 (1.28.1), respectively. The list of differentially expressed genes between TIM-1+ and TIM-1− B cells derived from dLN is depicted in supplementary table 3.
Gene Set Enrichment Analysis
Gene Set Enrichment Analysis (GSEA) 71 was performed for each cell subset based on scores in pre-ranked list mode with 1,000 permutations (nominal P value cutoff < 0.05).
Flow cytometry and fluorescence-activated cell sorting (FACS)
Single-cell suspensions were prepared from mouse lymph nodes, spleens or tumors as described above. Live/dead cell discrimination was performed using Live/Dead Fixable viability dye e506 (eBioscience). Surface antibodies used in this study were against: CD45 (30-F11), TCRb (H57–597), CD3e (17A2), TCRγδ, CD8a (53–6.7), CD4+ (RM4–5), CD19 (6D5), B220, CD138((281–2), GL-7 (GL-7), Fas (Jo2), IgD (11–26c.2a), IgM (RMM-1), CD21 (CR2/CR1), CD43 (S7), CD93 (AA4.1), CD23 (B3B4), TIM-1 (RMT1–4), Ly6C (HK1.4), Ly6G (1A8), CD11c (N418), CD11b (M1/70), CD64 (X54–5/7.1), CD11c (N418), PD-1 (RMP1–30), TIGIT (1G9), LAG3 (C9B7W), TIM-3 (5D12), CD39 (5F2), CD73 (TY/11.8), CD107a (1D4B), NK1.1 (PK136), MHC I (H-2Kb/H-2Db, 28–8-6), MHC II (I-A/E, M5/114.15.2), CD80 (16–10A1), CD86 (A17199A), ICOSL (HK5.3), CD40 (3/23), CD25 (3C7), IFNAR-1 (MAR1–5A3). The following cell populations were identified based on cell marker expression: CD4+ T cells (CD45+ TCRβ+ CD4+), CD8+ T cells (CD45+ TCRβ+ CD8+), B cells (CD45+ B220+ CD19+), natural killer (NK) cells (CD45+ NK1.1+), NKT cells (CD45+ NK1.1+ TCRβ+), PMN (CD45+ CD11b+ Ly-6Cint Ly6G+), dendritic cells (DCs) (CD45+ CD11c+ I-A/Ehigh), macrophages (Macs) (CD45+ CD11b+ Ly-6C− Ly6G− CD64+), γδ T cells (CD45+ CD3e+ TCRγδ+).
For intra- cytoplasmic cytokine (ICC) staining, cells were stimulated with phorbol myristate acetate (50 ng ml−1) and ionomycin (1 μg ml−1). Permeabilized cells were then stained with antibodies against IL-2 (JES6–5H4), TNF-α (MP6-XT22) and IFN-γ (XMG1.2). For FOXP3, Eomes (W17001A), tBet (4B10), Helios (22F6), KI67 (16A8), Granzyme B (2C5/F5) and Perforin (S16009A) staining were performed using the Foxp3/Transcription Factor Staining Buffer Set (eBioscience). To assess OVA-specific CD8+ cells, TILs were stained with H-2Kb-OVA257–264 dextramers (Immudex) and then stained with surface antibodies. To determine Tcf1 protein levels, TILs were stained with surface antibodies then fixed and permeabilized with eBioscience Transcription Factor Staining Buffer Set. Cells were then stained with anti-Tcf1 antibody (C63D9) followed by fluorescently tagged anti-Rabbit IgG (Cell Signaling). All data were collected on a BD Symphony A5 (BD Biosciences) and analyzed with FlowJo software (Tree Star).
In vitro B cell cultures
FACS-sorted total B cells from CD19Cre/+, TIM-1BKO mice or TIM-1+ and TIM-1− B cells from C57Bl/6J mice were labelled with 5 μM CellTrace Violet (CTV) and plated in 96-well U-bottom plates in the presence or absence of LPS (5μg/mL, invivoGen), F(ab’)2 fragment donkey anti-mouse IgM (anti-IgM) (10μg/mL, Jackson ImmunoResearch) and/or Anti-CD40 (5μg/mL, BioLegend) for 72h in complete media with or without addition of IFNβ, IFNγ or IFNλ (10ng/ml, RnD systems). Cells were then analyzed by flow cytometry.
Antibodies and humoral response analysis
Serum immunoglobulin levels were measured with LEGENDplex Mouse Immunoglobulin Isotyping Panel, according to the manufacturer’s protocol (Biolegend). For B16F10-specific antibody assay, sera from naïve or B16F10 bearing mice were obtained following intracardiac blood collection. B16F10 and MC38 cell lines were incubated with purified anti-CD16/32 Ab. Cells were incubated with or without sera and then stained with Alexa Fluor 647-conjugated Goat anti-mouse κ (GAM) from Invitrogen to reveal B16F10 specific antibodies. Data are expressed using mean fluorescent intensity (MFI) ratio between serum+ GAM and GAM alone. Circulating immune complexes (CIC) were analyzed using (CIC) Ig's (total (A+G+M) ELISA kit (Alpha Diagnostic International) according to the manufacturer’s instructions.
In vitro B cell–T cell co-culture assays
For antigen presentation assays, lymph nodes and spleens from CD19Cre/+ or TIM-1BKO mice were dissociated into single-cell suspensions, as described above, pulsed with OVA323–339 (10μg/mL), and sorted by FACS for CD19+ B cells, and then co-cultured with CTV-labeled OT-II T cells at different ratios in a 96-well V-bottom plate. After 4 days, cells were analyzed by flow cytometry.
In vivo OT II transfer
CD45.1+ OT II cells were isolated from lymph nodes and spleens of CD45.1 OT II mice and transferred i.v into CD45.2 CD19Cre/+ or TIM-1BKO mice one day before s.c injection of 5 × 10⁵ B16-OVA cells. Tumor growth was monitored and on day 16, OT II cells isolated from TILs and draining lymph nodes were analyzed by flow cytometry.
Human B-cell cultures and analysis
Human peripheral blood mononuclear cells (PBMCs) were isolated using density gradient centrifugation from whole blood drawn from healthy volunteers. PBMCs were labelled with 5μM CellTrace Violet (CTV) and plated in 96-well U-bottom plates in the presence of F(ab’)2 fragment donkey anti-mouse IgM (anti-IgM) (5μg/mL, Jackson ImmunoResearch) with Anti-CD40 (1μg/mL, Peprotech) for 7d in X-vivo media. For some experiments PBMCs were stimulated in the presence of recombinant IFNβ, IFNγ or IFNλ (all 20μg/mL, Peprotech) as indicated. Cells were then analyzed by flow cytometry. Briefly, Human PBMCs were analyzed using following antibodies: Live/dead cell discrimination was performed using Live/Dead Fixable viability dye 455UV (Thermo Fisher). For surface staining following antibodies against CD19 (SJ25C1), CD27 (M-T271), CD38 (HB7), CD86 (IT2.2), IgD (IA6–2) and Tim-1 (1D12) were used. All data were collected on a BD Symphony A5 (BD Biosciences) and analyzed with FlowJo software (Tree Star).
Statistics and Reproducibility
Unless otherwise specified, each experiment was repeated independently at least twice and all statistical analyses were performed using the two-tailed student’s t test, Mann-Whitney test or one-way ANOVA test followed by Tukey’s multiple comparison test, using GraphPad Prism software (GraphPad Prism version 8.0). P value less than 0.05 is considered significant (p < 0.05 = *; p < 0.01 = **; p < 0.001 = ***, p < 0.0001=****) unless otherwise indicated.
Extended Data
Extended Data Fig. 1: Total B cells but not plasma cells limit tumor growth and B16F10-infiltrating B cells have a distinct phenotype.
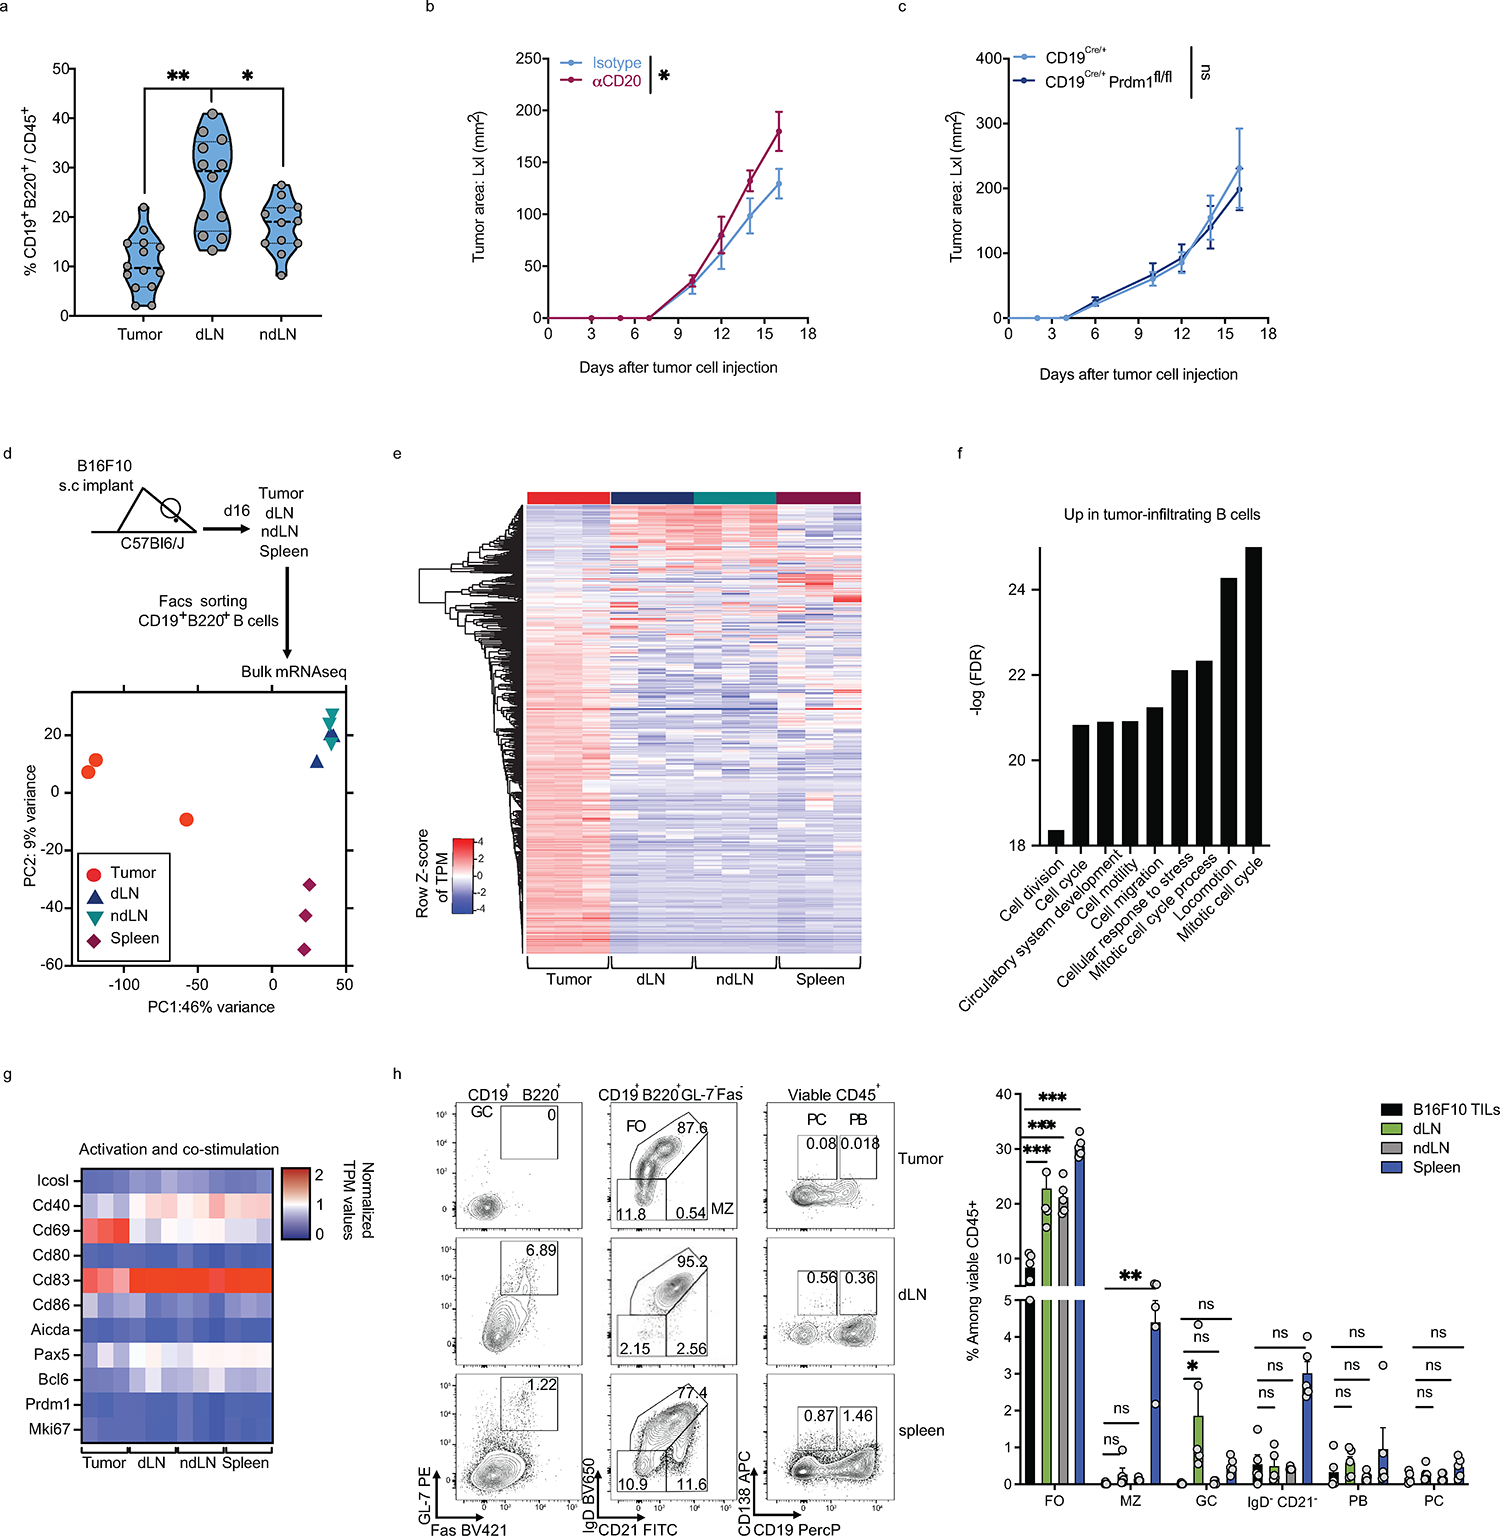
a, Frequencies of B cells among CD45+ cells derived from tumor, dLN, ndLN from C57Bl6/J mice 16 days post tumor implantation. b, c, B16F10 tumor growth in C57Bl/6J treated with anti-CD20 (48h prior to tumor injections) or isotype control antibodies (n=5 mice per group) (b) or CD19Cre/+ and CD19Cre/+xPrdm1fl/fl (n=5 mice per group). d-g, Bulk RNAseq analysis of B cells derived from tumor, dLN, ndLN and spleen of B16F10-bearing wild-type mice (n=3). Experimental design and PCA plot (d), Heatmap of global gene expression (e), Pathway enrichment analysis of genes up-regulated in tumor-derived B cells (f) and heatmap of a selected set of genes (g). h, Flow cytometry analysis of B cells derived from tumor, dLN, ndLN and spleen of C57Bl6/J mice implanted with B16F10 s.c. Representative FACS plot and percentage of B cell subsets. Heatmap depicting the MFI of various B cell markers in B cells derived from tumors or dLN from C57Bl6/J mice (n=5) (h). Data are mean ± s.e.m and pooled or representative of at least two to three independent experiments. * p<0.05, ** p<0.01, *** p<0.0001. Repeated measures two-way ANOVA test in b and c. two-tailed Student’s t-test in a. two-way ANOVA with Tukey's multiple comparisons test in h.
Extended Data Fig. 2: scRNAseq and BCRseq of TILs, dLN and ndLN derived from B16F10 melanoma bearing mice.
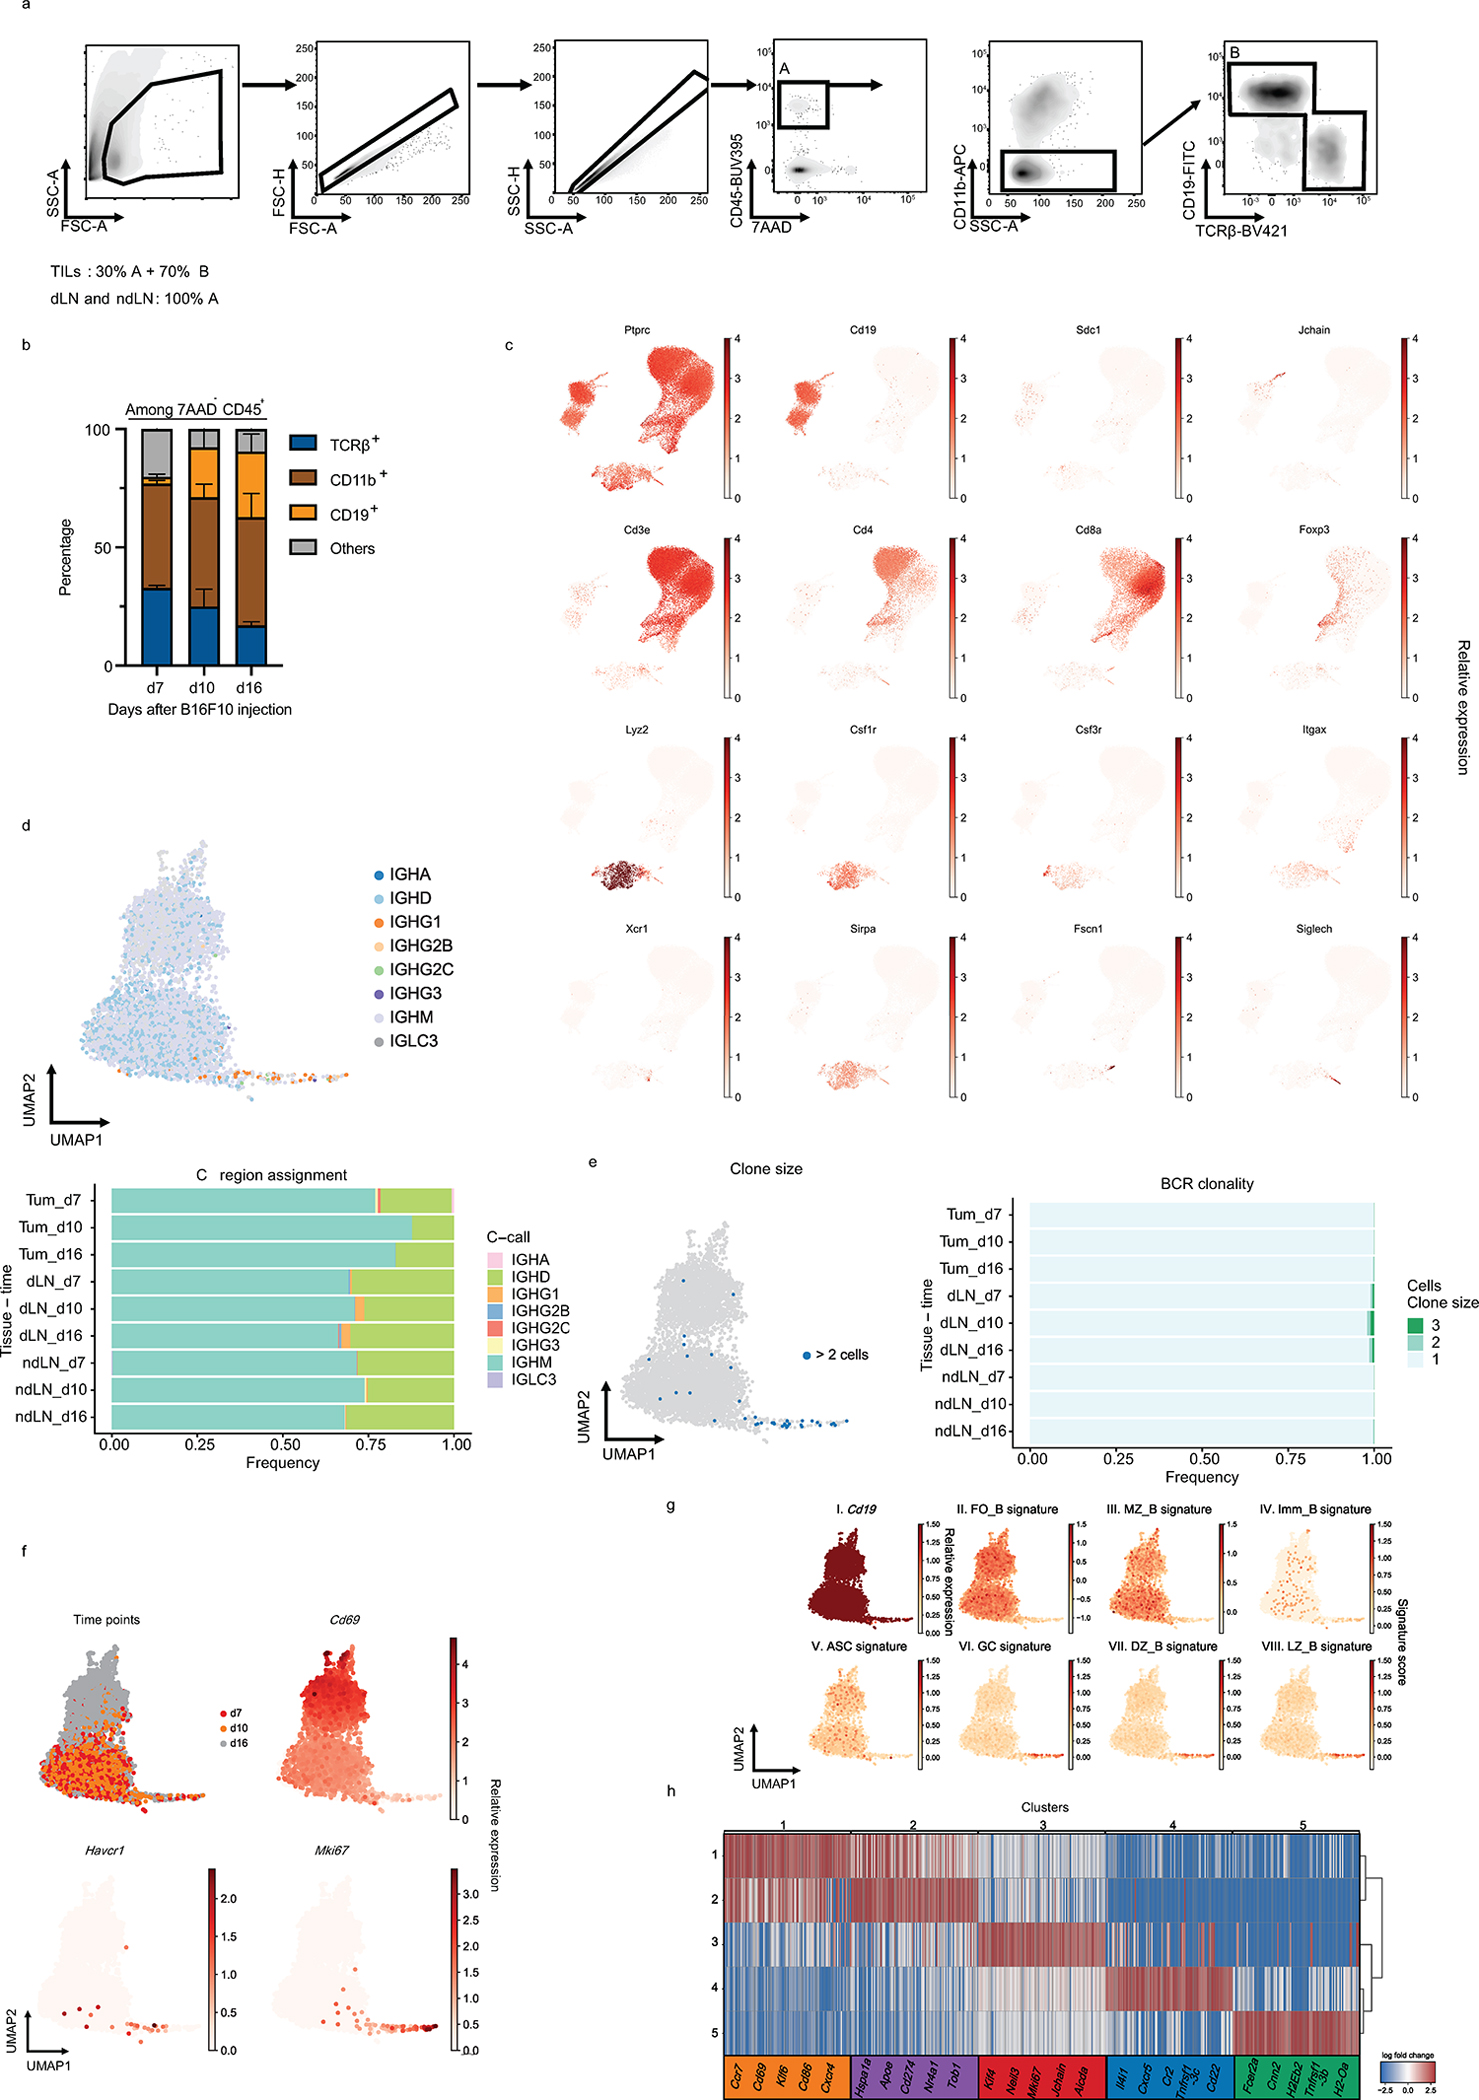
a, Gating strategy for the sorting of singlet viable cells prior to scRNAseq. b, Flow cytometry analysis depicting proportions of cell types infiltrating tumors across time. Data are mean ± s.e.m from two experiments. n=3 mice per group. c, UMAP of expression of different lineage marker transcripts. d, e, UMAPs and quantification of immunoglobulin class-switch (d) and clonal expansion (e) in B cells. f and g, UMAPs of B cells colored by time points or relative expression of the indicated genes (f) and g, Panels I-VIII, cells are colored by Cd19 expression (I) or by their signature score that reflects the relative average expression of the genes overlapping with the signatures for several indicated B cell subsets (II-VIII). Follicular (FO_B), Marginal zone (MZ_B), Immature (Imm_B), Antibody secreting cells (ASC), germinal center (GC) B cells derived from the dark zone (DZ_B) or light zone (LZ_B). h, Heatmap depicting the log fold change of the top 100 genes uniquely up-regulated in each Leiden cluster (t-test; fold change >2). Selected genes are shown.
Extended Data Fig. 3: TIM-1 expressing B cells characterization.
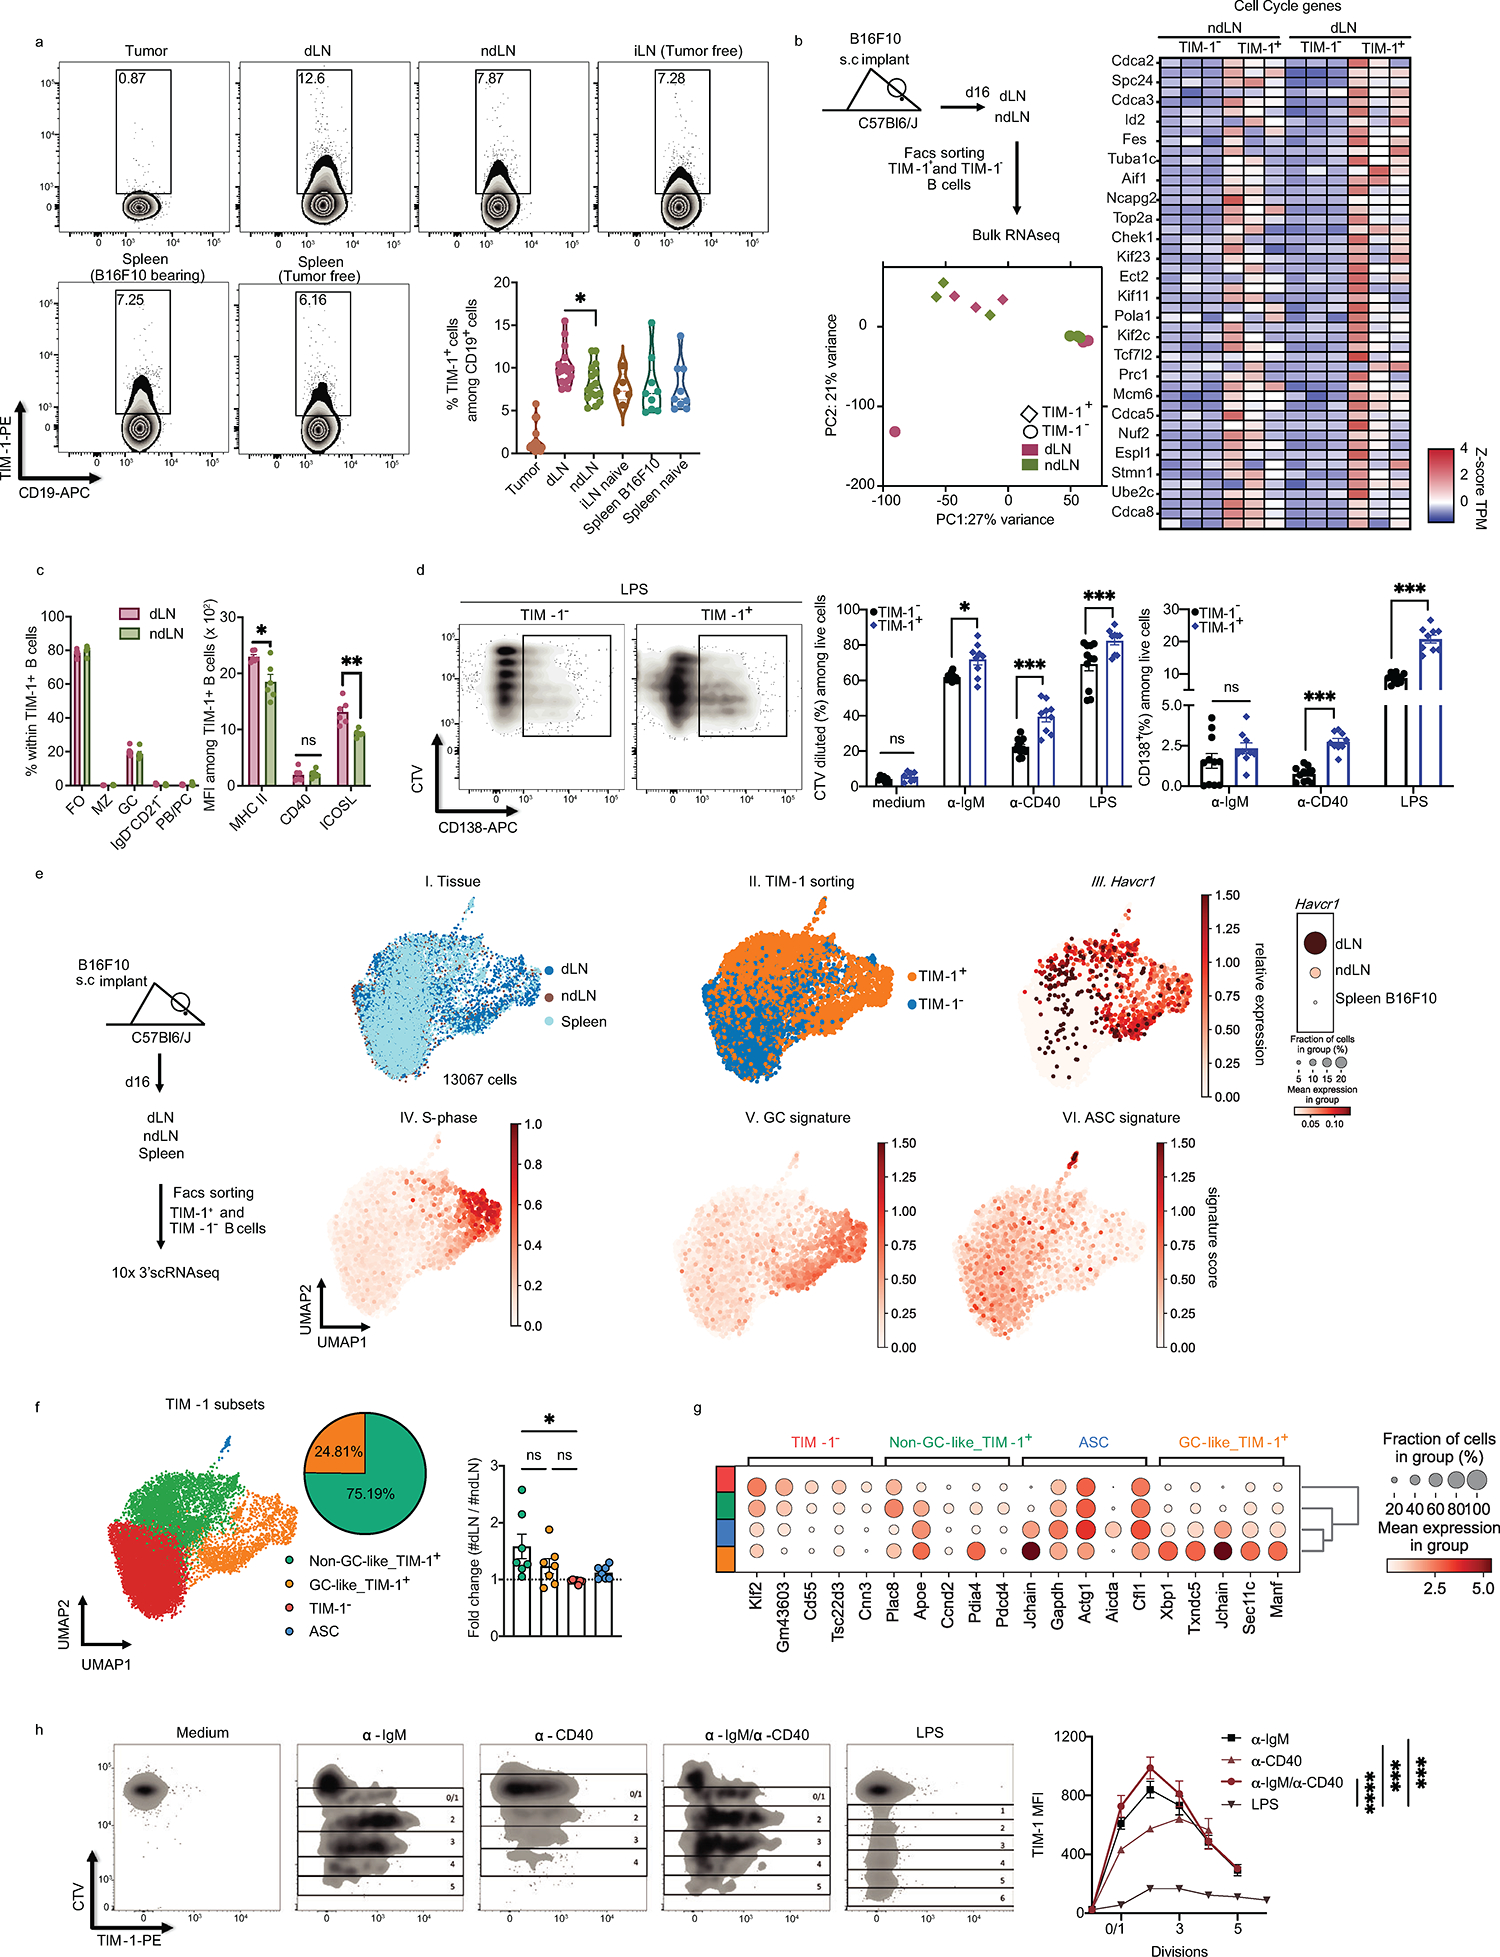
a, Proportions of TIM-1+ cells among CD19+ cells derived from tumor, dLN, ndLN, and spleen from B16F10 bearing C57Bl6/J mice 16 days post tumor injection together with inguinal LN (iLN) and spleen from tumor-free WT mice (n=5 for pLN, n=9 for spleens, n=16 for Tumor, dLN and ndLN). b, TIM-1+ B cells derived from dLN and ndLN were sorted and analyzed by bulk RNAseq (n=3). Experimental design, PCA plot and heatmap of selected genes are shown. c, Flow cytometry analysis of subsets and marker expression of TIM-1+ B cells derived from dLN vs ndLN from B16F10-bearing WT mice (n=6). d) FACS-sorted TIM-1− and TIM-1+ B cells were stained with CTV and stimulated in vitro with anti-IgM, anti-CD40 or LPS for 72h. Cell proliferation and plasma cell differentiation was analyzed by flow cytometry. Representative FACS plot (left) and quantification (right) are shown (n=7 for medium, for stimulation n=11 for TIM-1- and n=9 for TIM-1+). e, f, scRNAseq analysis depicting the experimental design, UMAPs colored by tissue of origin (I), TIM-1 sorting (II), expression of havcr1 (III) and gene signature score of cell cycle S-phase (IV), germinal center cells (V) and antibody secreting cells (VI). Dotplot of Havcr1 expression (III. right). f, UMAP colored by B cell clusters annotated according to TIM-1 expression. Pie chart depicting the frequency of the two main TIM-1-expressing subsets and foldchange of cell numbers between dLN and ndLN for each subset (n=7). g, Top 5 differentially expressed genes (FDR<0.05 and LFC>1) (x axis) by cluster (y axis). Dot size represents the fraction of cells in the cluster that express the gene; color indicates the mean expression (logTP10K (see Methods)) in all cells, relative to other clusters. h, FACS-sorted TIM-1− B cells were stained with CTV and stimulated in vitro with LPS, anti-IgM, anti-CD40 (n=3) or both anti-IgM+anti-CD40 (n=4) for 72h. TIM-1 surface expression across cell divisions was analyzed by flow cytometry. Representative FACS plot (left) and TIM-1 MFI quantification (right). Flow cytometry data are mean ± s.e.m and pooled or representative of at least two to three independent experiments. * p<0.05, ** p<0.01, *** p<0.001, **** p<0.0001, two-way ANOVA test in h. two-tailed Student’s t-test in a, c, d and f.
Extended Data Fig. 4: TIM-1 expressing B cells express higher levels of checkpoint molecules and IL-10.
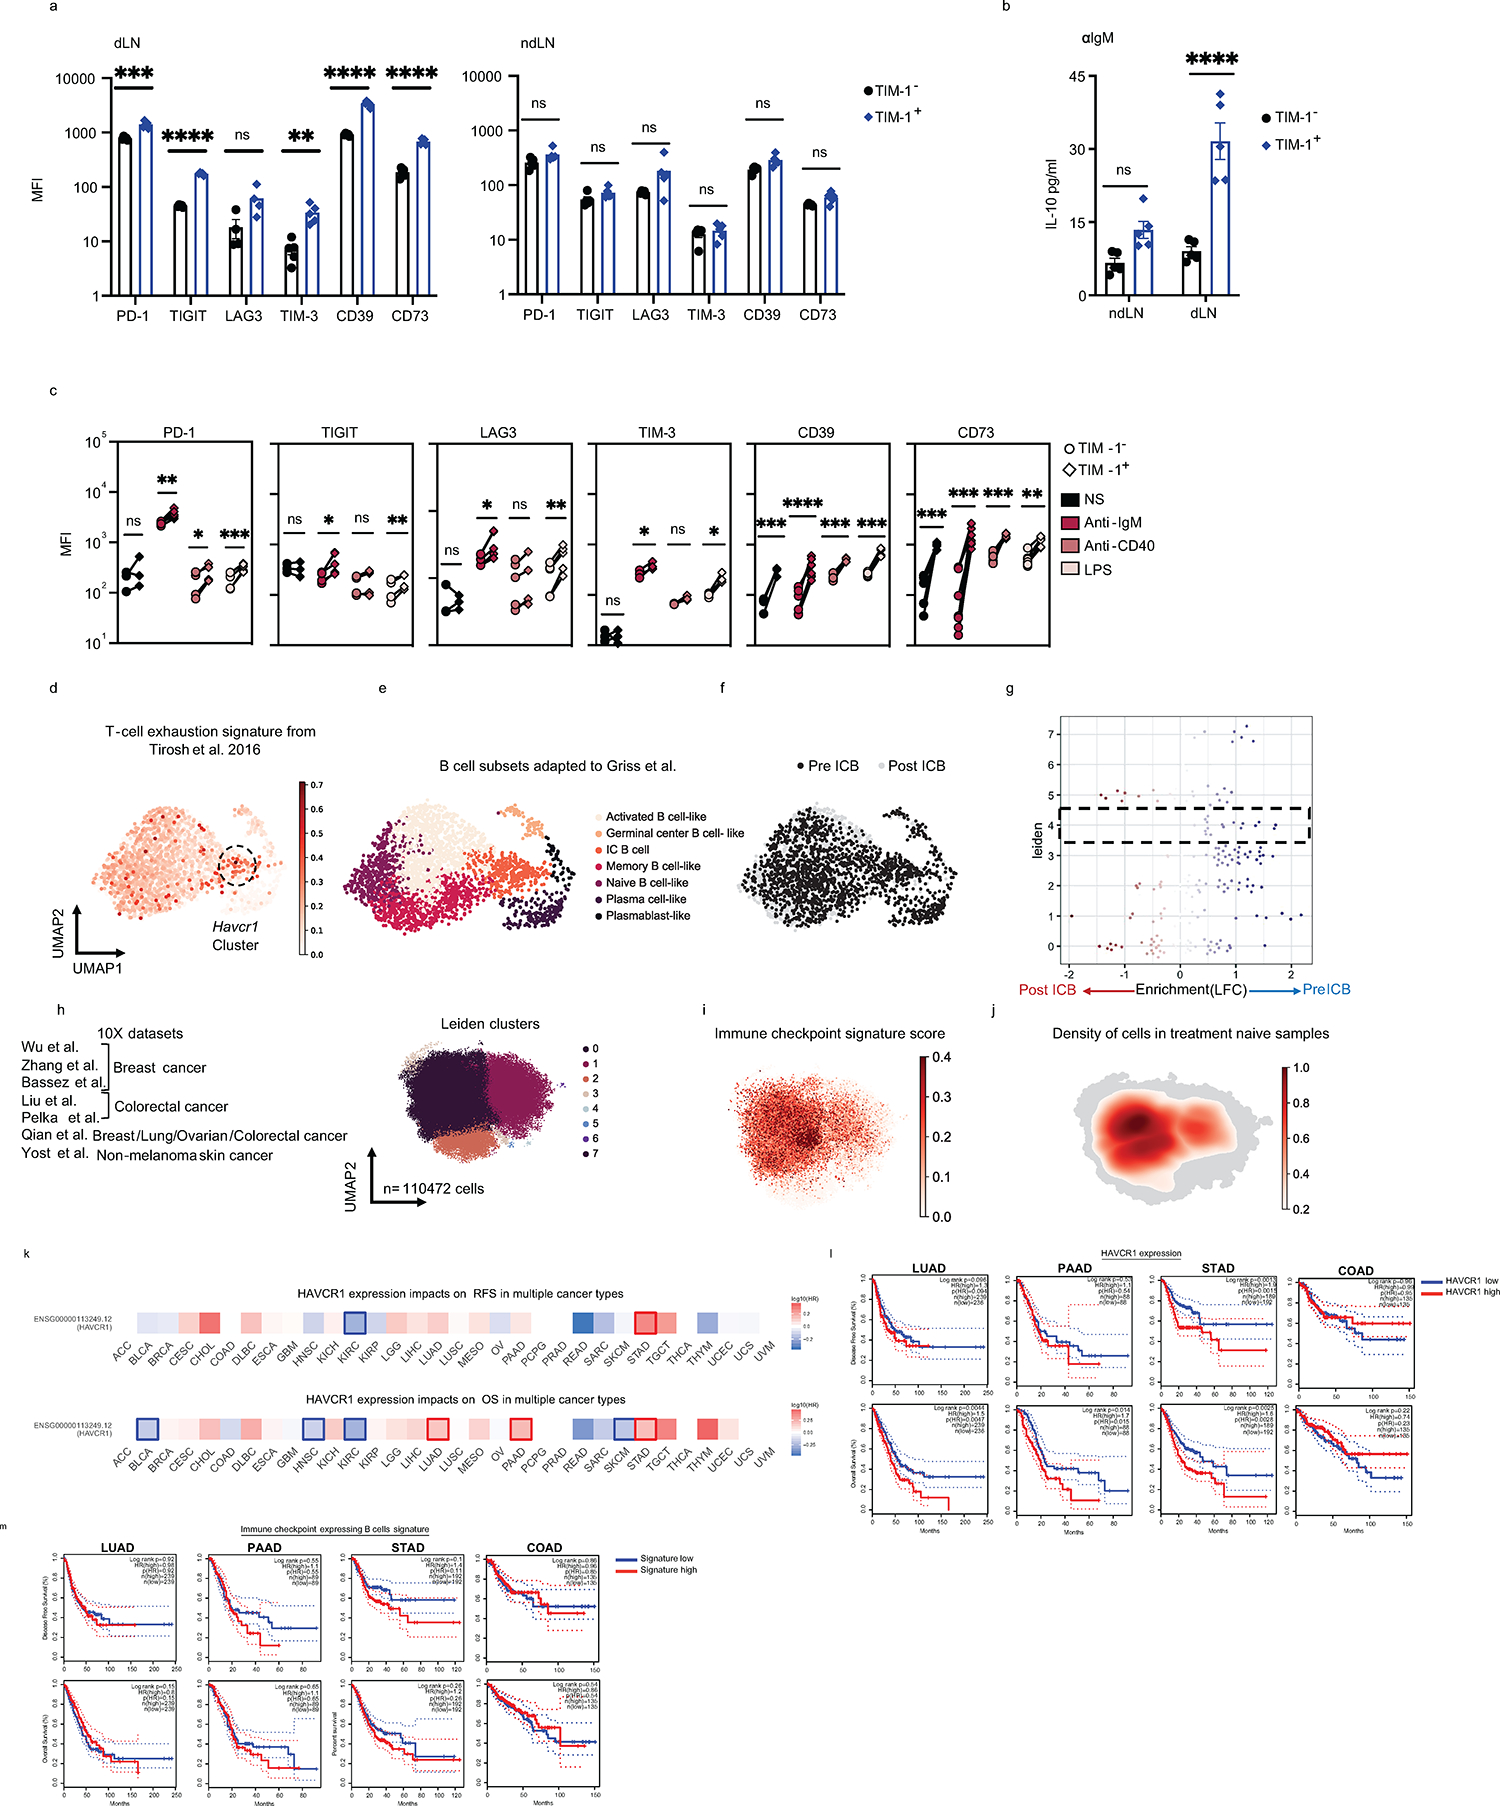
a-b, TIM-1+ and TIM-1− B cells derived from dLN and ndLN from B16F10 bearing C57Bl6/J mice were analyzed ex vivo. MFI of various checkpoint molecules (n=4 mice per group) (a), IL-10 secretion 24h post anti-IgM stimulation as determined by LegendPlex (n=5 mice per group) (b). c, FACS-sorted TIM-1− and TIM-1+ B cells were stimulated in vitro with anti-IgM, anti-CD40 or LPS for 72h. MFI of checkpoint molecules was analyzed by flow cytometry. d-f, UMAP plot of published scRNAseq data depicting 2615 B cells(dots) isolated from human tumors, colored by their signature score that reflects the relative average expression of the genes overlapping with the signature of human melanoma exhausted T cells from Tirosh et al. 2016 (d), known B-cell subsets4 (e) or Leiden clusters (f). g, Beeswarm plots of the distribution of log fold change across Pre and Post ICB treatment from the Merge SS2 datasets using miloR53. h-j) UMAPs depicting each single cell dots colored by Leiden clusters (h), Immune checkpoint signature score (i) or density plot for treatment naïve samples (j). Flow cytometry data are mean ± s.e.m and pooled or representative of at least two to three independent experiments. k, Survival map depicting the association of HAVCR1 high expression and clinical outcome in 32 cancer types. High log10 Hasard ratio (HR) (Reds) indicates a negative correlation with survival which would be outlined if p≤0.05. l and m, Kaplan Meier disease free (top row) or Overall (bottom row) survival curves for TIM-1 expression (l) or IC B cells signature (m) in Lung (LUAD), pancreatic (PAAD), stomach (STAD) and colon (COAD) adenocarcinomas. For each signature gene set, the cohorts were divided into high and low expression groups by median value (50% cutoff).Analyses were performed with log-rank Mantel-Cox test using web server GEPIA254, based on TCGA and GTEx databases. * p<0.05, ** p<0.01, *** p<0.001, **** p<0.0001, paired two-tailed t-test in a, b, and c.
Extended Data Fig. 5: Anti-TIM-1 treatment requires MHC II expression on B cells.
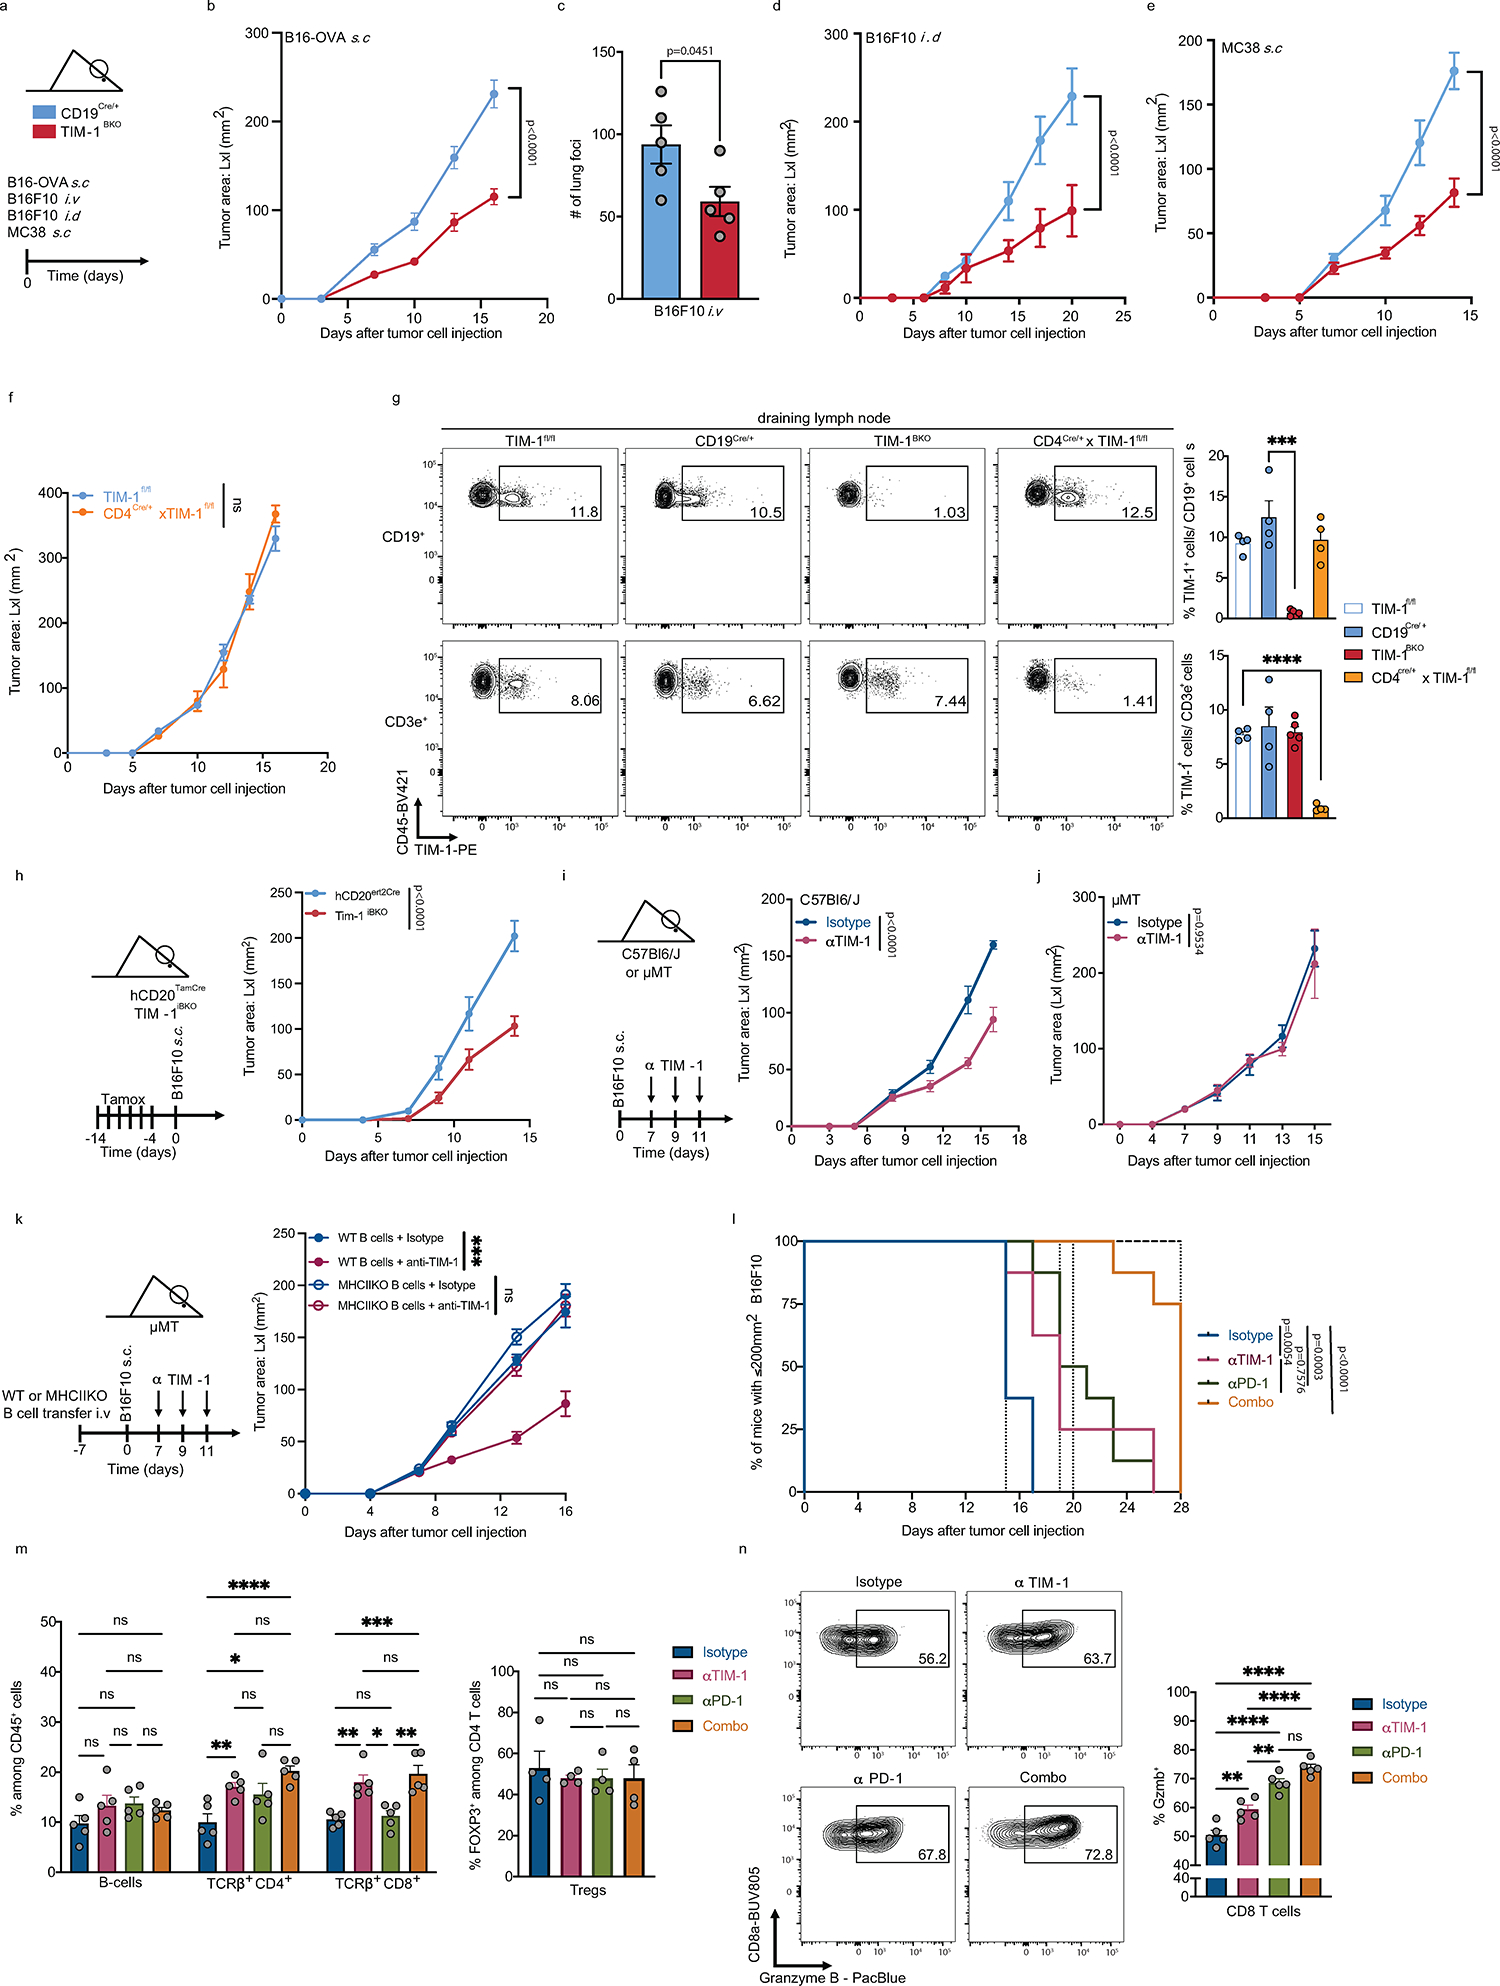
a-e, Tumor growth in CD19Cre/+ and TIM-1BKO mice implanted with B16-OVA (n=5 control vs 5 TIM-1BKO) (b), intravenously (n=5 control vs 5 TIM-1BKO) (c), intradermally (n=4 control vs 5 TIM-1BKO) (d) or subcutaneous MC38 colon adenocarcinoma (n=6 control vs 6 TIM-1BKO) (e). f, Tumor growth curve of B16F10 implanted into TIM-1fl/fl and CD4Cre/+xTIM-1fl/fl mice (n=4). g, Subcutaneous B16F10 melanoma were subcutaneously implanted into CD19Cre/+, TIM-1BKO, TIM-1fl/fl and CD4Cre/WTxTIM-1fl/fl mice. On day 16 dLN were harvested followed by flow cytometric analysis of TIM-1 expression of CD19+ or CD3e+ cells. n=4 mice per group. h, B16F10 melanoma growth in TIM-1iBKO and hCD20ert2Cre mice treated with tamoxifen on days indicated prior to tumor inoculation (n=6 mice per group). i-k, B16F10 tumor growth with anti-isotype control or anti-TIM-1 treatment in C57Bl/6J (n=7 treated with isotype control vs n=9 treated with anti-TIM-1), μMT (n=5 per group) (j) or μMT mice were reconstituted with WT or MHCII KO B cells and treated with anti-TIM-1 antibody (n=5 mice per group) (k). Experimental design (k, left), tumor growth curves (k, right). l-n, Survival curves (l) and flow cytometry immunophenotyping of TILs depicting frequencies of B cells, CD4+ and CD8+ TILs among living CD45+ cells (m, left), FOXP3+ cells among CD4+ TILs (m, right) and granzyme B+ cells among CD8+ TILs (n) of C57Bl/6J implanted with B16F10 melanoma and treated with either anti-TIM-1, anti-PD-1, anti-TIM-1 + anti-PD-1 (combo), or isotype controls (n=8 mice per group for tumor growth analysis and 5 mice per group for flow cytometry analysis). Data are mean ± s.e.m and pooled from two to three independent experiments. * p<0.05, ** p<0.01, *** p<0.001, **** p<0.0001. Repeated measures two-way ANOVA test in b, d, e, f, h, I, j and k. unpaired two-tailed t-test in c and g. Differences between survival curves were analyzed by log-rank (Mantel–Cox) test (l). One or two-way ANOVA with Tukey's multiple comparisons test in m and n.
Extended Data Fig. 6: Immunophenotyping of tumor-bearing CD19Cre/+ and TIM-1BKO mice.
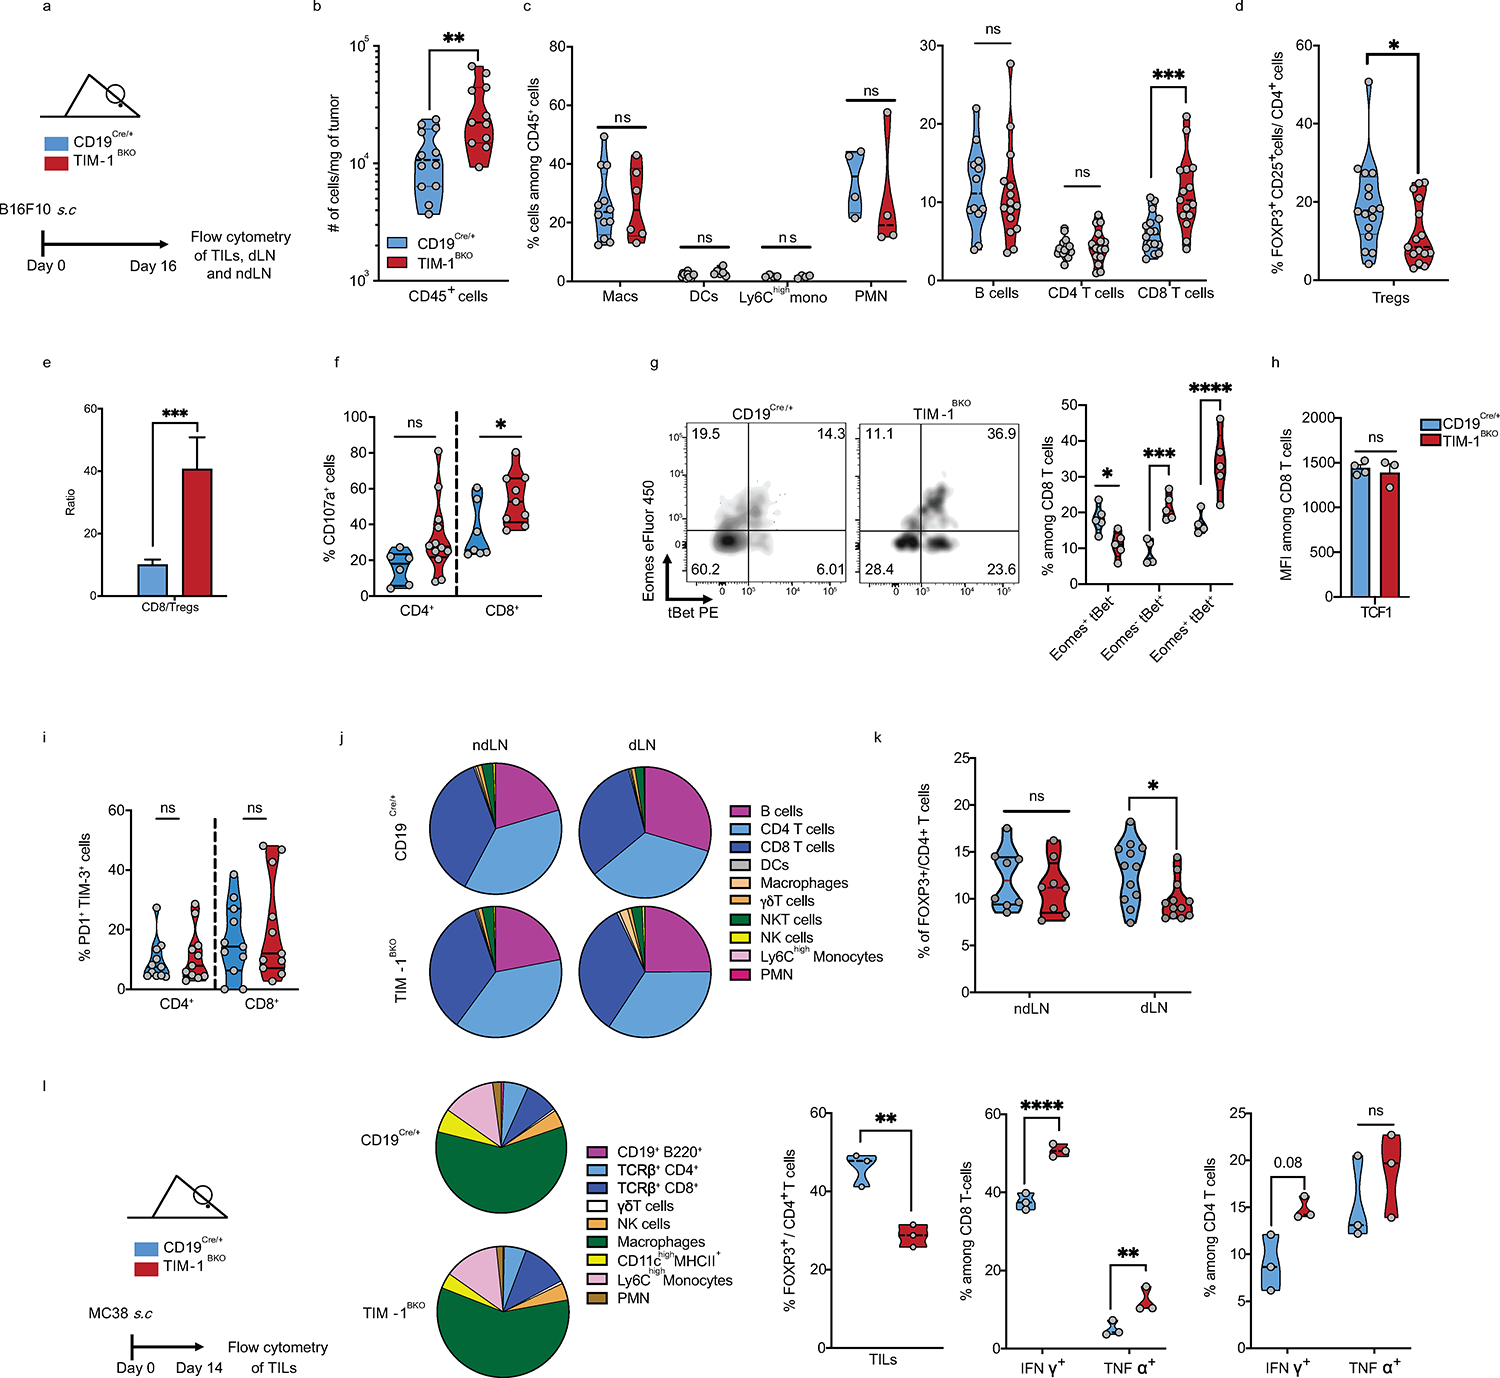
a-k, Flow cytometry analysis of TILs, dLN and ndLN derived from CD19Cre/+ and TIM-1BKO mice implanted with B16F10 s.c. Absolute number of live CD45+ cells per gram of tumor (n=12 controls and n=11 TIM-1BKO mice) (b), Macs, DCs (n=12 controls and n=6 TIM-1BKO mice), mono, PMN (n=4 controls and n=4 TIM-1BKO mice), B cells (n=12 controls and n=15 TIM-1BKO mice), CD4+ and CD8+ T cells frequencies among CD45+ cells (n=16 controls and n=15 TIM-1BKO mice) (c), Frequency of Tregs among CD4+ T cells (n=16 mice per group) (d), CD8+ T cells vs Tregs ratio (e). CD107a-expressing CD4+(n=6 controls and n=12 TIM-1BKO mice) and CD8+ T cells (n=7 controls and n=9 TIM-1BKO mice) (f), Eomes and/or Tbet fraction (n=5 mice per group) (g), MFI of TCF1 (n=4 controls and n=3 TIM-1BKO mice) (h) and Frequency PD-1+ TIM-3+ among CD8+ T cells (d). j, pie charts depicting the proportions of various immune cell populations with dLN and ndLN. k, frequencies of FOXP3+ cells among CD4+ T cells (n=8 mice per group). l, Flow cytometry analysis of TILs from derived from CD19Cre/+ and TIM-1BKO mice implanted with MC38 colon adenocarcinoma s.c. Experimental design, pie chart of immune population and frequencies of FOXP3+ CD4+ T cells and of IFNγ or TNFα expressing CD8+ and CD4+ T cells (n=4 mice per group). Data are mean ± s.e.m and pooled from two to three independent experiments. * p<0.05, ** p<0.01, *** p<0.001, **** p<0.0001, two-tailed Student’s t-test in b, c, d, e, f, g, h, i, k and l.
Extended Data Fig. 7: scRNAseq of TILs, dLN and ndLN derived from B16F10 bearing CD19Cre/+ and TIM-1BKO mice.
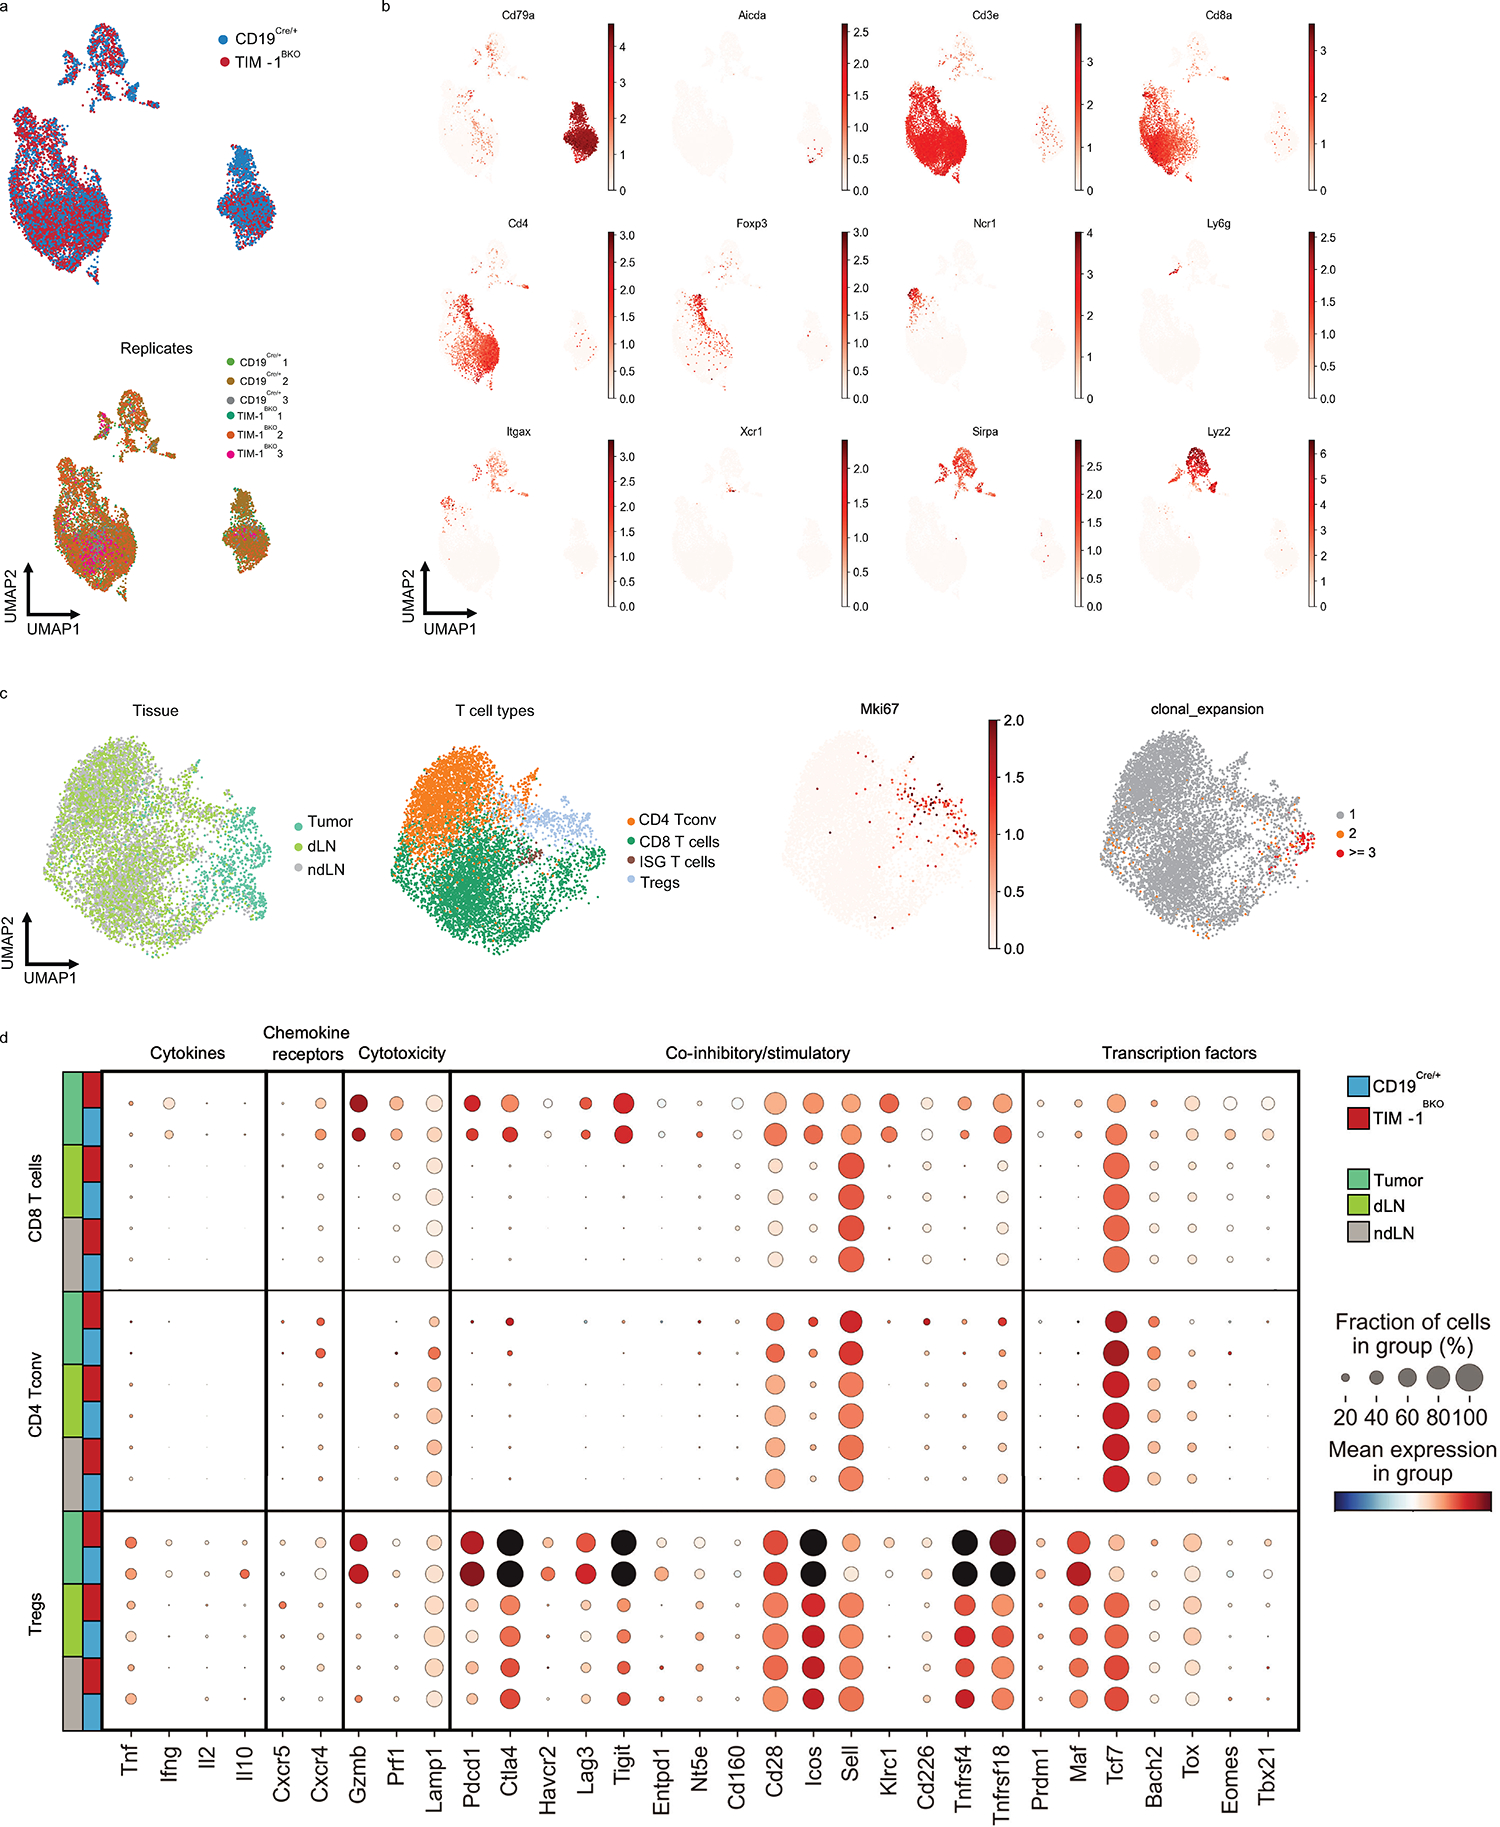
a, b, scRNA/TCR-seq of TILs, dLN and ndLN from CD19Cre/+ and TIM-1BKO mice bearing B16F10 melanoma. UMAPs colored by genotype (a, top), biological replicates (a, bottom) or the relative expression of the indicated genes (b). c, UMAPs of T cells colored by tissue, T cell types, Mki67 relative expression or clonal expansion as indicated. d, Gene expression for functional marker genes in T cells. For each gene (columns) in each group (rows), the proportion of cells in the group expressing the gene (dot size) and the relative mean expression of expressing cells (color) is plotted.
Extended Data Fig. 8: Analysis of the humoral immunity and B-cell subsets in B16F10 bearing CD19Cre/+ and TIM-1BKO mice.
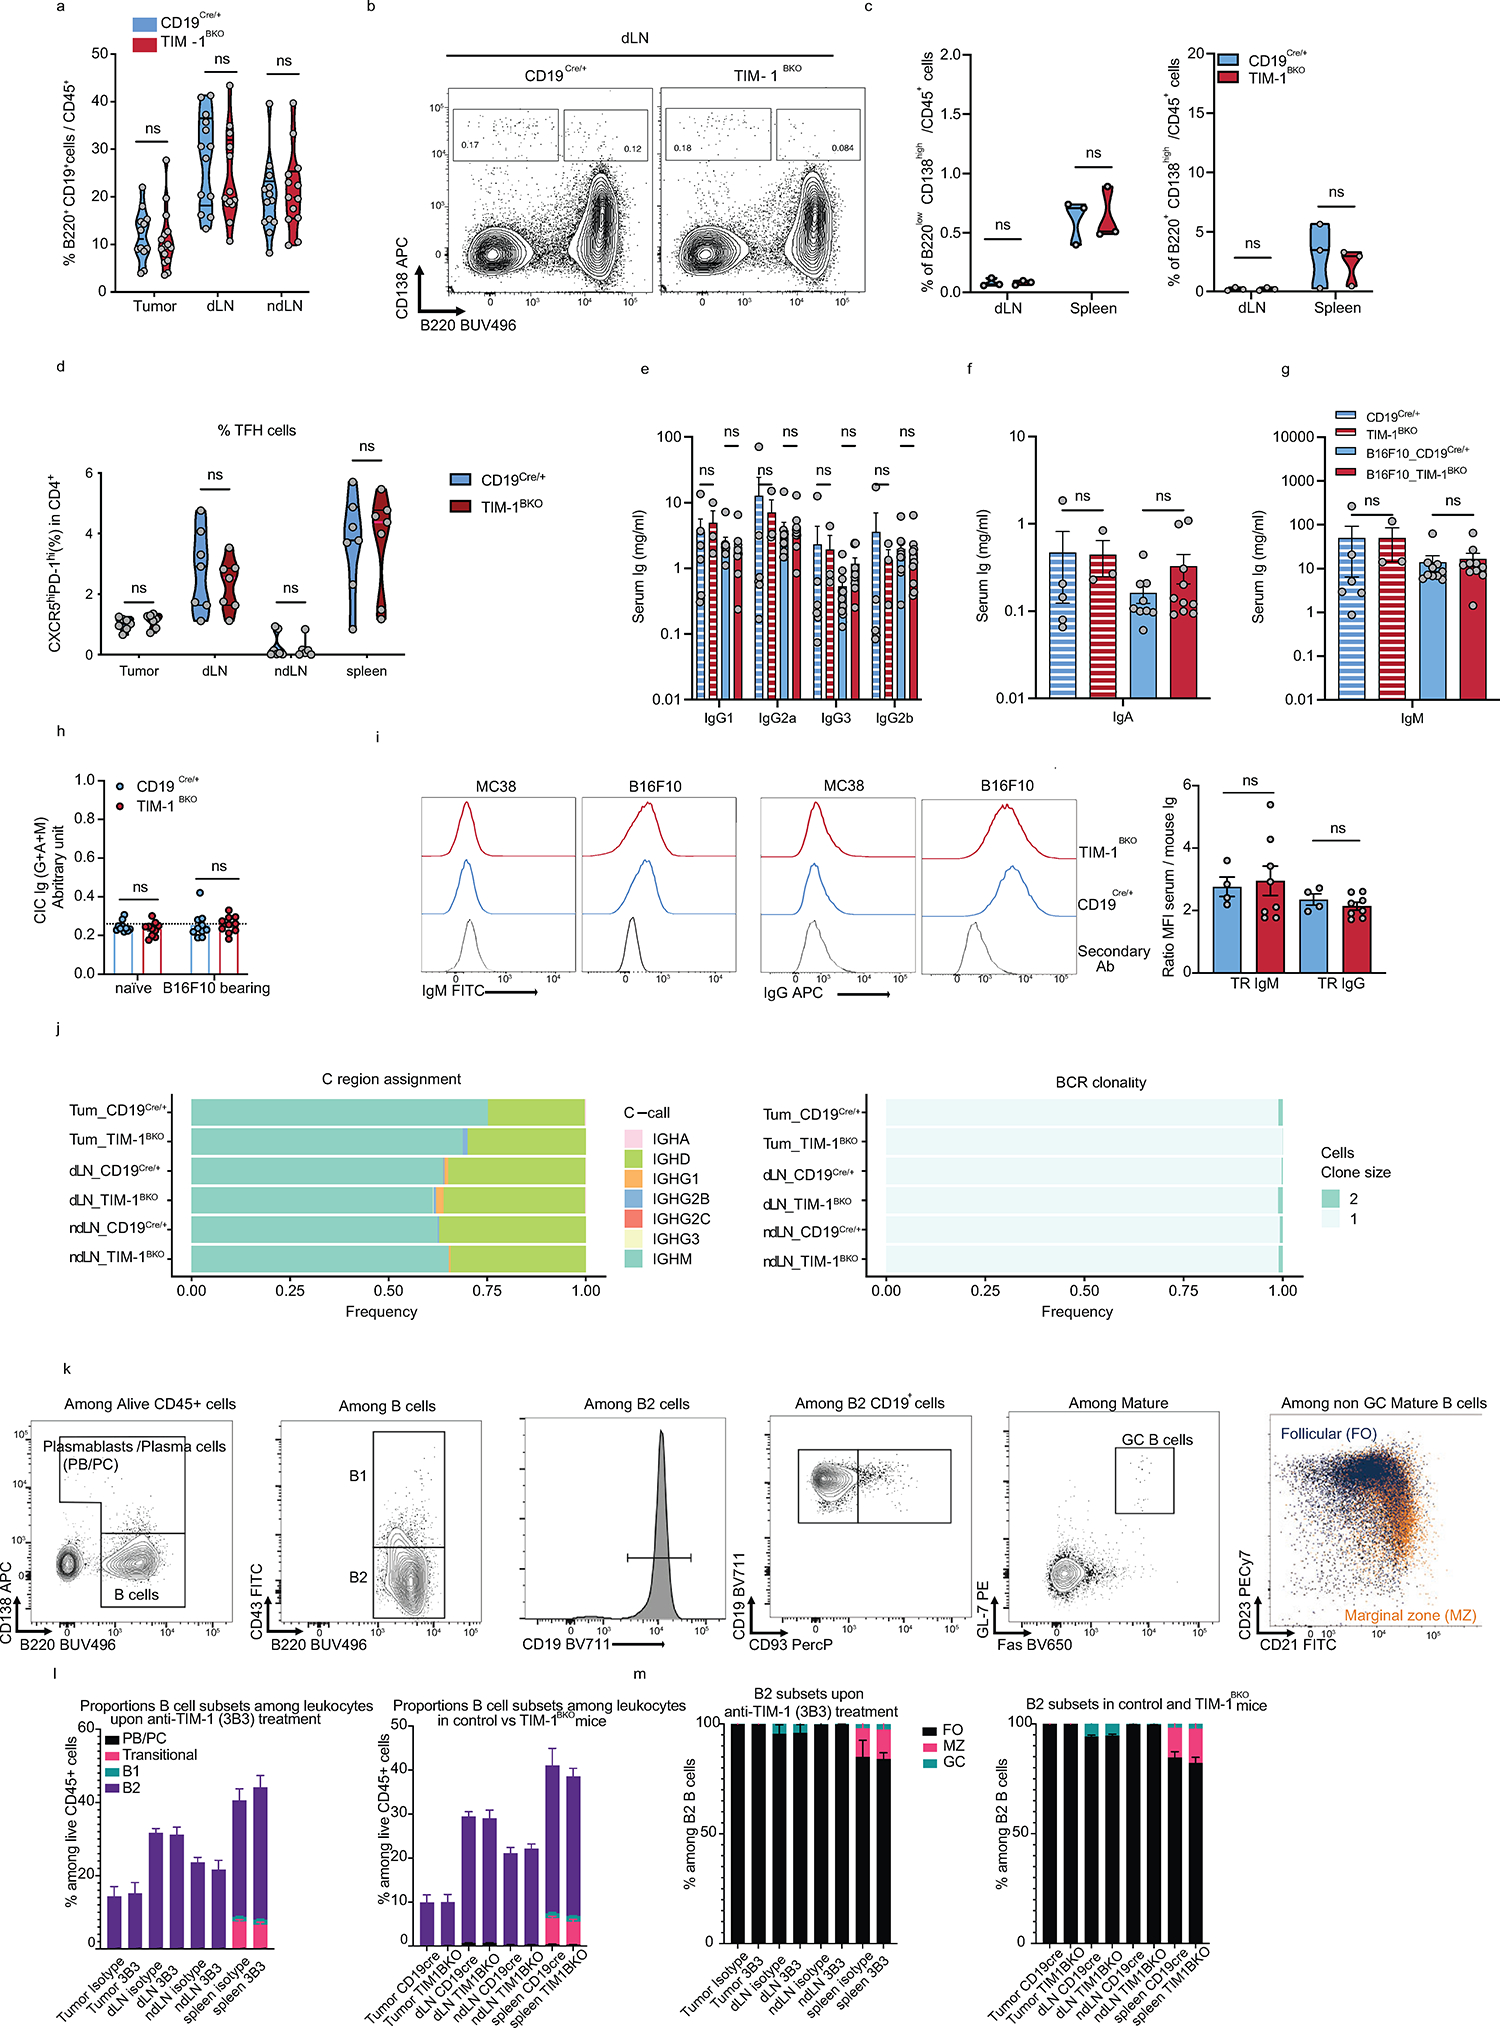
a, Frequencies of B cells among CD45+ TILs derived from CD19Cre/+ and TIM-1BKO mice implanted with B16F10 s.c. b, c, Representative FACS plot (b) and percentage (c) of plasma cells (B220low CD138high) or plasmablasts (B220+ CD138high) or TFh cells (d) from CD19Cre/+ and TIM-1BKO mice implanted with B16F10 s.c. e-h, serum immunoglobulins or CICs from naïve (n=5 CD19Cre/+ and n=3 TIM-1BKO) or B16F10-bearing CD19Cre/+ and TIM-1BKO mice (n=9 per group) and measured by LegendPlex (e-g) or ELISA (h). i, Flow-cytometric analysis of the presence of antitumor antibodies in the sera of CD19Cre/+ and TIM-1BKO mice implanted with B16F10 s.c. Representative histograms (light gray, staining with the secondary antibody alone; blue, CD19Cre/+ mice serum (n=4); red, TIM-1BKO mice serum (n=8)), and MFI ratios were calculated by dividing the MFI obtained with a given serum by the MFI obtained with the secondary antibody. j, Quantification of Immunoglobulin class-switch (left) and BCR clonality (right) in CD19Cre/+ and TIM-1BKO B cells. k-m, Flow cytometry analysis of B cell subsets in Tumor, dLN, ndLN and spleen from isotype vs anti-TIM-1 (3B3) treatment mice or in control vs TIM-1BKO mice (n=5 mice per group). k, Gating strategy used. l and m, Bar plots depicting the frequencies of major B-cell subsets (l) or subsets within B2 cells (n=5 mice per group) (m). Data are mean ± s.e.m and pooled from two to three independent experiments. Two-tailed Student’s t-test in a, c, d, h and i. two-way ANOVA with Tukey's multiple comparisons test in e, f, g.
Extended Data Fig. 9: TIM-1BKO B cells exhibit enhanced antigen presentation and co-stimulation capacity.
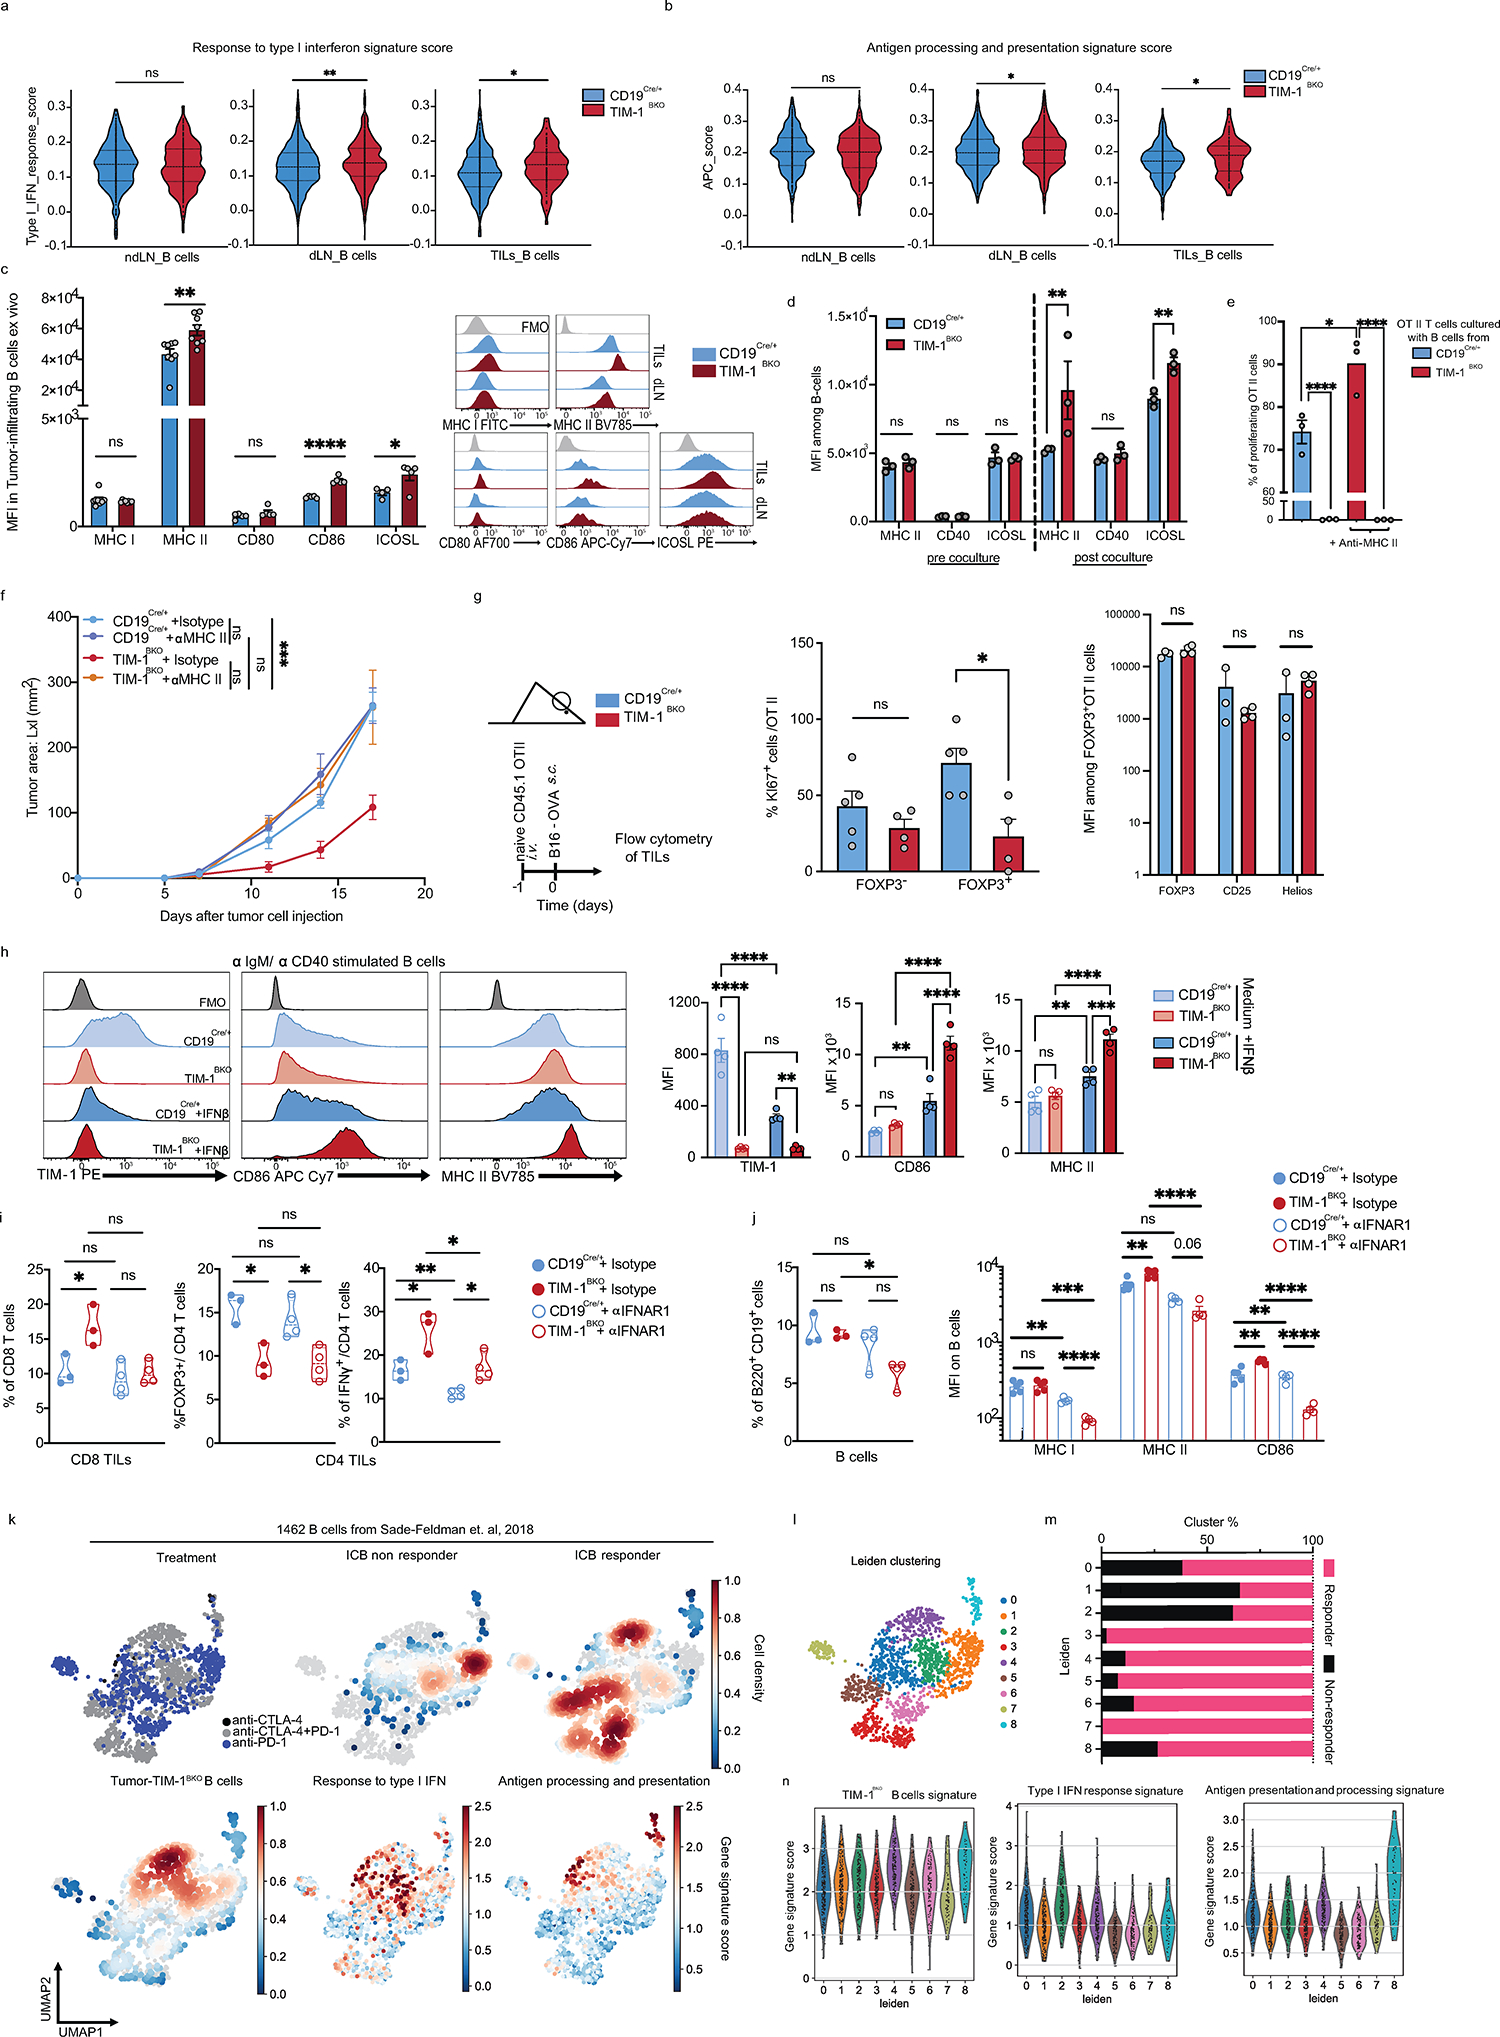
a and b, Violin plots displaying the distribution of the type I interferon response signature score (a) or the antigen processing and presentation of peptide antigen (APC) signature score (b) between TIM-1BKO and CD19Cre/+ B cells derived from ndLN, dLN and TILs. c and d, MFI and histograms of MHC I and II as well as co-stimulation molecules ex vivo (n=8 mice per group) (c) or in vitro co-cultured with OT II CD4+ T cells (n=3) (d). d and e, OVA323–339 peptide-pulsed TIM-1BKO and CD19Cre/+ B cells were co-cultured with CTV-labeled OVA-restricted CD4+ T cells for 4 days with or without anti-MHC II antibody. T cell proliferation was determined by dilution of CTV. Quantitative analysis of proliferation indices is shown (e). f, B16F10 melanoma growth in CD19Cre/+ and TIM-1BKO mice treated with anti-MHC II or isotype control antibodies (n=5 mice per group). g, Naïve CD45.1+ OVA-restricted CD4+ T cells were transferred i.v. 1 day prior to B16-OVA melanoma cells s.c implantation into CD45.2+ CD19Cre/+ and TIM-1BKO mice (n=5 mice per group). Tumor-infiltrating OT II cells were examined for expression of KI67 as proportions of expressing cells or MFI of FOXP3, CD25 and Helios (n=3 CD19Cre/+ and n=4 TIM-1BKO mice). Schematic of the experimental and quantitative results are depicted. h, TIM-1BKO and CD19Cre/+ B cells cultured with anti-IgM/anti-CD40 for 72h in the absence (medium) or with 20ng/ml of IFN-β. Representative histograms (left) and quantitative analysis of the MFI of TIM-1, CD86 and MHC II (n=4 mice per group). i and j, Flow cytometry analysis of TILs of indicated mice implanted with B16F10 melanoma and treated with isotype control (n=3 mice per group) or neutralizing anti-IFNAR-1 antibody (n=4 mice per group). Frequencies of CD8+ T cells (i, left), FOXP3+ and IFNγ+ cells among CD4+ T cells (i, middle and right), B cells (j, left) and MFI of MHC I, MHC II and CD86 among B cells (j, right) are depicted. k-n, Analysis of published scRNAseq 20 data depicting 1462 B cells (dots) isolated from human melanoma tumors, projected onto UMAPs colored by treatment group (top left), density of cells associated with responder, non-responder lesions (top middle and right) or signature scores of tumor-derived TIM-1BKO B cells, GO type I interferon response and GO antigen processing and presentation gene signatures as detailed in Methods. l, UMAP colored by Leiden cell clusters (resolution 1). m, stacked bar graph displaying the frequencies of B cells derived from Responder and Non-responder samples among each Leiden cluster and n, violin plots displaying the signature scores of the indicated signatures across clusters. Data are mean ± s.e.m and pooled from two to three independent experiments. * p<0.05, ** p<0.01, *** p<0.001, ****p<0.0001. Kruskal-Wallis test in a and b. Two-tailed Student’s t-test in c, d, e, g, h, i and j. Repeated measures two-way ANOVA test in f.
Extended Data Fig. 10: Source of Interferons in B16F10 tumors and impact on TIM-1-mediated anti-tumor immunity.
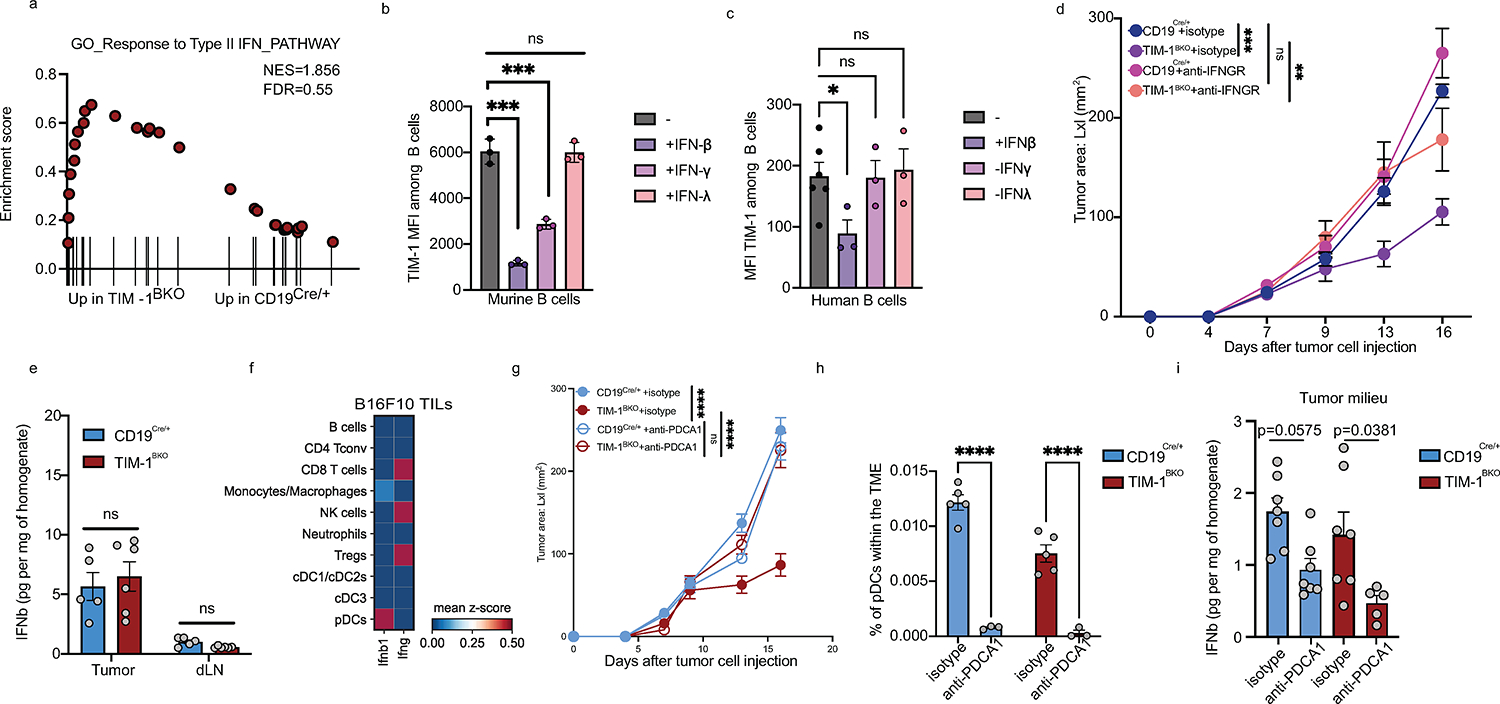
a) GSEA analysis for the “Response to type II IFN pathway” of tumor-infiltrating TIM-1BKO and CD19Cre/+ B cells. b and c) Murine (b) or human (c) B cells were stimulated with IgM/CD40 for 3 and 7 days respectively in the presence or not of IFNβ, IFNγ or IFNλ (n=3). TIM-1 expression (MFI) was analyzed by flow cytometry. d) Tumor growth in indicated mice implanted with B16F10 melanoma and treated with isotype control or neutralizing anti-IFNGR-1 antibody (n=5 mice per group). e and i) B16F10 tumor and dLN supernatants derived from CD19Cre/+ and TIM-1BKO mice were collected, and levels of IFNβ were determined by ELISA (n=5 CD19Cre/+ vs n=6 TIM-1BKO mice in e). f) Matrixplot depicting IFNb1 mRNA expression profile across immune populations in B16F10 tumors by scRNAseq. g) Tumor growth in indicated mice implanted with B16F10 melanoma and treated with isotype control or depleting anti-PDCA1 antibody (two i.p injections 48 and 24h prior to tumor injection, n=7 mice per group). h) Flow cytometry analysis of pDC (MHCII+ CD11c+B220+PDCA1+) frequencies in B16F10 CD19Cre/+ and TIM-1BKO tumors (n=5 istoype treated and n=3 anti-PDCA1 treated mice). Data are mean ± s.e.m and pooled from two to three independent experiments. Two-tailed Student’s t-test in b, c, e, h and i. * p<0.05, ** p<0.01, *** p<0.001, ****p<0.0001, repeated measures two-way ANOVA test in d and g.
Supplementary Material
Acknowledgments
We thank all members of the Kuchroo lab, A. C. Anderson, S.H. Krovi, A.Kohl and M. Collins for insightful discussions, J. Xia, H. Stroh, D. Kozoriz and R. Kumar for laboratory support and C. Lambden for computational advice. The work was supported by the grants Melanoma Research Alliance (MRA) #926682 and P01AI129880, P01AI039671, P01AI073748, P01AI056299 and R01AI144166 from National Institutes of Health (VKK), by the Klarman Cell Observatory and HHMI (A.R.). Y-C.K was supported by the NMSS FG-2007–36929 and L.B was supported by the Philippe Foundation. LA was supported by the LabEx MAbImprove (ANR-10-LABX-53–01).
Footnotes
Disclosure of interest
VKK has an ownership interest in and is a member of the scientific advisory board for Tizona Therapeutics, Bicara Therapeutics, Compass Therapeutics, Larkspur Biosciences and Trishula Therapeutics. LB, SX and VKK, are named inventors on a provisional patent that has been filed including work from this study. LA performed consultancy work for Roche, Merck, Bristol-Myers Squibb, and Orega Biotech and was a recipient of a research grant from Sanofi. AR and VKK are co-founders of and have an ownership interest in Celsius Therapeutics. Additionally, AR is a co-founder and equity holder in Immunitas Therapeutics and was a scientific advisory board member of Thermo Fisher Scientific, Syros Pharmaceuticals, Asimov, and Neogene Therapeutics until 31 July 2020. A.R. and O.R.-R. are co-inventors on patent applications filed by the Broad Institute to inventions relating to single-cell genomics. The interests of VKK were reviewed and managed by the Brigham and Women’s Hospital and Partners Healthcare in accordance with their conflict-of-interest policies. The interests of AR were reviewed and managed by the Broad Institute and HHMI in accordance with their conflict-of-interest policies. Since 1 August 2020, AR has been an employee of Genentech, a member of the Roche group. ORR. is currently an employee of Genentech. The authors declare no other competing interests.
Data and materials availability
All genomics data produced for this study have been deposited in the NCBI Gene Expression Omnibus (GEO) under accession GSE225717. All other data needed to evaluate the conclusions in this paper are available in the main text or the supplementary materials.
References
- 1.Topalian SL et al. Safety, activity, and immune correlates of anti-PD-1 antibody in cancer. The New England journal of medicine 366, 2443–2454, doi: 10.1056/NEJMoa1200690 (2012). [DOI] [PMC free article] [PubMed] [Google Scholar]
- 2.Wolchok JD et al. Nivolumab plus ipilimumab in advanced melanoma. The New England journal of medicine 369, 122–133, doi: 10.1056/NEJMoa1302369 (2013). [DOI] [PMC free article] [PubMed] [Google Scholar]
- 3.Thorsson V et al. The Immune Landscape of Cancer. Immunity 48, 812–830 e814, doi: 10.1016/j.immuni.2018.03.023 (2018). [DOI] [PMC free article] [PubMed] [Google Scholar]
- 4.Griss J et al. B cells sustain inflammation and predict response to immune checkpoint blockade in human melanoma. Nature communications 10, 4186, doi: 10.1038/s41467-019-12160-2 (2019). [DOI] [PMC free article] [PubMed] [Google Scholar]
- 5.Ladanyi A et al. Prognostic impact of B-cell density in cutaneous melanoma. Cancer immunology, immunotherapy: CII 60, 1729–1738, doi: 10.1007/s00262-011-1071-x (2011). [DOI] [PMC free article] [PubMed] [Google Scholar]
- 6.Gupta NT et al. Change-O: a toolkit for analyzing large-scale B cell immunoglobulin repertoire sequencing data. Bioinformatics 31, 3356–3358, doi: 10.1093/bioinformatics/btv359 (2015). [DOI] [PMC free article] [PubMed] [Google Scholar]
- 7.Delaney C et al. Combinatorial prediction of marker panels from single-cell transcriptomic data. Mol Syst Biol 15, e9005, doi: 10.15252/msb.20199005 (2019). [DOI] [PMC free article] [PubMed] [Google Scholar]
- 8.Wolf Y, Anderson AC & Kuchroo VK TIM3 comes of age as an inhibitory receptor. Nat Rev Immunol 20, 173–185, doi: 10.1038/s41577-019-0224-6 (2020). [DOI] [PMC free article] [PubMed] [Google Scholar]
- 9.Mohib K, Rothstein DM & Ding Q Characterization and Activity of TIM-1 and IL-10-Reporter Expressing Regulatory B Cells. Methods Mol Biol 2270, 179–202, doi: 10.1007/978-1-0716-1237-8_10 (2021). [DOI] [PubMed] [Google Scholar]
- 10.Xiao S, Brooks CR, Sobel RA & Kuchroo VK Tim-1 is essential for induction and maintenance of IL-10 in regulatory B cells and their regulation of tissue inflammation. Journal of immunology 194, 1602–1608, doi: 10.4049/jimmunol.1402632 (2015). [DOI] [PMC free article] [PubMed] [Google Scholar]
- 11.Xiao S et al. Defect in regulatory B-cell function and development of systemic autoimmunity in T-cell Ig mucin 1 (Tim-1) mucin domain-mutant mice. Proceedings of the National Academy of Sciences of the United States of America 109, 12105–12110, doi: 10.1073/pnas.1120914109 (2012). [DOI] [PMC free article] [PubMed] [Google Scholar]
- 12.Ding Q et al. Regulatory B cells are identified by expression of TIM-1 and can be induced through TIM-1 ligation to promote tolerance in mice. The Journal of clinical investigation 121, 3645–3656, doi: 10.1172/JCI46274 (2011). [DOI] [PMC free article] [PubMed] [Google Scholar]
- 13.Yeung MY et al. TIM-1 signaling is required for maintenance and induction of regulatory B cells. American journal of transplantation : official journal of the American Society of Transplantation and the American Society of Transplant Surgeons 15, 942–953, doi: 10.1111/ajt.13087 (2015). [DOI] [PMC free article] [PubMed] [Google Scholar]
- 14.Tirosh I et al. Dissecting the multicellular ecosystem of metastatic melanoma by single-cell RNA-seq. Science 352, 189–196, doi: 10.1126/science.aad0501 (2016). [DOI] [PMC free article] [PubMed] [Google Scholar]
- 15.Liu Y et al. Immune phenotypic linkage between colorectal cancer and liver metastasis. Cancer cell 40, 424–437 e425, doi: 10.1016/j.ccell.2022.02.013 (2022). [DOI] [PubMed] [Google Scholar]
- 16.Wu SZ et al. A single-cell and spatially resolved atlas of human breast cancers. Nat Genet 53, 1334–1347, doi: 10.1038/s41588-021-00911-1 (2021). [DOI] [PMC free article] [PubMed] [Google Scholar]
- 17.Bi K et al. Tumor and immune reprogramming during immunotherapy in advanced renal cell carcinoma. Cancer cell 39, 649–661 e645, doi: 10.1016/j.ccell.2021.02.015 (2021). [DOI] [PMC free article] [PubMed] [Google Scholar]
- 18.Qian J et al. A pan-cancer blueprint of the heterogeneous tumor microenvironment revealed by single-cell profiling. Cell research 30, 745–762, doi: 10.1038/s41422-020-0355-0 (2020). [DOI] [PMC free article] [PubMed] [Google Scholar]
- 19.Pelka K et al. Spatially organized multicellular immune hubs in human colorectal cancer. Cell 184, 4734–4752 e4720, doi: 10.1016/j.cell.2021.08.003 (2021). [DOI] [PMC free article] [PubMed] [Google Scholar]
- 20.Sade-Feldman M et al. Defining T Cell States Associated with Response to Checkpoint Immunotherapy in Melanoma. Cell 175, 998–1013 e1020, doi: 10.1016/j.cell.2018.10.038 (2018). [DOI] [PMC free article] [PubMed] [Google Scholar]
- 21.Zhang Y et al. Single-cell analyses reveal key immune cell subsets associated with response to PD-L1 blockade in triple-negative breast cancer. Cancer cell 39, 1578–1593 e1578, doi: 10.1016/j.ccell.2021.09.010 (2021). [DOI] [PubMed] [Google Scholar]
- 22.Yost KE et al. Clonal replacement of tumor-specific T cells following PD-1 blockade. Nature medicine 25, 1251–1259, doi: 10.1038/s41591-019-0522-3 (2019). [DOI] [PMC free article] [PubMed] [Google Scholar]
- 23.Bassez A et al. A single-cell map of intratumoral changes during anti-PD1 treatment of patients with breast cancer. Nature medicine 27, 820–832, doi: 10.1038/s41591-021-01323-8 (2021). [DOI] [PubMed] [Google Scholar]
- 24.Jerby-Arnon L et al. A Cancer Cell Program Promotes T Cell Exclusion and Resistance to Checkpoint Blockade. Cell 175, 984–997 e924, doi: 10.1016/j.cell.2018.09.006 (2018). [DOI] [PMC free article] [PubMed] [Google Scholar]
- 25.Cerqueira C, Manfroi B & Fillatreau S IL-10-producing regulatory B cells and plasmocytes: Molecular mechanisms and disease relevance. Seminars in immunology 44, 101323, doi: 10.1016/j.smim.2019.101323 (2019). [DOI] [PubMed] [Google Scholar]
- 26.Floudas A et al. Pathogenic, glycolytic PD-1+ B cells accumulate in the hypoxic RA joint. JCI insight 5, doi: 10.1172/jci.insight.139032 (2020). [DOI] [PMC free article] [PubMed] [Google Scholar]
- 27.Hasan MM et al. Implication of TIGIT(+) human memory B cells in immune regulation. Nature communications 12, 1534, doi: 10.1038/s41467-021-21413-y (2021). [DOI] [PMC free article] [PubMed] [Google Scholar]
- 28.Lino AC et al. LAG-3 Inhibitory Receptor Expression Identifies Immunosuppressive Natural Regulatory Plasma Cells. Immunity 49, 120–133 e129, doi: 10.1016/j.immuni.2018.06.007 (2018). [DOI] [PMC free article] [PubMed] [Google Scholar]
- 29.Xiao S et al. Checkpoint Receptor TIGIT Expressed on Tim-1(+) B Cells Regulates Tissue Inflammation. Cell Rep 32, 107892, doi: 10.1016/j.celrep.2020.107892 (2020). [DOI] [PMC free article] [PubMed] [Google Scholar]
- 30.Horikawa M, Minard-Colin V, Matsushita T & Tedder TF Regulatory B cell production of IL-10 inhibits lymphoma depletion during CD20 immunotherapy in mice. The Journal of clinical investigation 121, 4268–4280, doi: 10.1172/JCI59266 (2011). [DOI] [PMC free article] [PubMed] [Google Scholar]
- 31.Hilgenberg E et al. Interleukin-10-producing B cells and the regulation of immunity. Curr Top Microbiol Immunol 380, 69–92, doi: 10.1007/978-3-662-43492-5_4 (2014). [DOI] [PubMed] [Google Scholar]
- 32.Domeier PP et al. B-Cell-Intrinsic Type 1 Interferon Signaling Is Crucial for Loss of Tolerance and the Development of Autoreactive B Cells. Cell reports 24, 406–418, doi: 10.1016/j.celrep.2018.06.046 (2018). [DOI] [PMC free article] [PubMed] [Google Scholar]
- 33.Le Bon A et al. Type i interferons potently enhance humoral immunity and can promote isotype switching by stimulating dendritic cells in vivo. Immunity 14, 461–470, doi: 10.1016/s1074-7613(01)00126-1 (2001). [DOI] [PubMed] [Google Scholar]
- 34.Hervas-Stubbs S et al. Direct effects of type I interferons on cells of the immune system. Clinical cancer research : an official journal of the American Association for Cancer Research 17, 2619–2627, doi: 10.1158/1078-0432.CCR-10-1114 (2011). [DOI] [PubMed] [Google Scholar]
- 35.Andreu P et al. FcRgamma activation regulates inflammation-associated squamous carcinogenesis. Cancer cell 17, 121–134, doi: 10.1016/j.ccr.2009.12.019 (2010). [DOI] [PMC free article] [PubMed] [Google Scholar]
- 36.Lu Y et al. Complement Signals Determine Opposite Effects of B Cells in Chemotherapy-Induced Immunity. Cell 180, 1081–1097 e1024, doi: 10.1016/j.cell.2020.02.015 (2020). [DOI] [PubMed] [Google Scholar]
- 37.Zhou B, Lawrence T & Liang Y The Role of Plasmacytoid Dendritic Cells in Cancers. Frontiers in immunology 12, 749190, doi: 10.3389/fimmu.2021.749190 (2021). [DOI] [PMC free article] [PubMed] [Google Scholar]
- 38.Ding Q, Mohib K, Kuchroo VK & Rothstein DM TIM-4 Identifies IFN-gamma-Expressing Proinflammatory B Effector 1 Cells That Promote Tumor and Allograft Rejection. Journal of immunology 199, 2585–2595, doi: 10.4049/jimmunol.1602107 (2017). [DOI] [PMC free article] [PubMed] [Google Scholar]
- 39.Zhou X CD19(+)IL-10(+) regulatory B cells affect survival of tongue squamous cell carcinoma patients and induce resting CD4(+) T cells to CD4(+)Foxp3(+) regulatory T cells. Oral Oncol 53, doi: 10.1016/j.oraloncology.2015.11.003 (2016). [DOI] [PubMed] [Google Scholar]
- 40.de Souza AJ, Oriss TB, O'Malley K J, Ray A & Kane LP T cell Ig and mucin 1 (TIM-1) is expressed on in vivo-activated T cells and provides a costimulatory signal for T cell activation. Proceedings of the National Academy of Sciences of the United States of America 102, 17113–17118, doi: 10.1073/pnas.0508643102 (2005). [DOI] [PMC free article] [PubMed] [Google Scholar]
- 41.Xiao S et al. Tim-1 stimulation of dendritic cells regulates the balance between effector and regulatory T cells. European journal of immunology 41, 1539–1549, doi: 10.1002/eji.201040993 (2011). [DOI] [PMC free article] [PubMed] [Google Scholar]
- 42.Mariat C et al. Tim-1 signaling substitutes for conventional signal 1 and requires costimulation to induce T cell proliferation. Journal of immunology 182, 1379–1385, doi: 10.4049/jimmunol.182.3.1379 (2009). [DOI] [PMC free article] [PubMed] [Google Scholar]
- 43.Xiao S et al. Differential engagement of Tim-1 during activation can positively or negatively costimulate T cell expansion and effector function. The Journal of experimental medicine 204, 1691–1702, doi: 10.1084/jem.20062498 (2007). [DOI] [PMC free article] [PubMed] [Google Scholar]
- 44.Meyers JH et al. TIM-4 is the ligand for TIM-1, and the TIM-1-TIM-4 interaction regulates T cell proliferation. Nature immunology 6, 455–464, doi: 10.1038/ni1185 (2005). [DOI] [PubMed] [Google Scholar]
- 45.Sharonov GV, Serebrovskaya EO, Yuzhakova DV, Britanova OV & Chudakov DM B cells, plasma cells and antibody repertoires in the tumour microenvironment. Nat Rev Immunol 20, 294–307, doi: 10.1038/s41577-019-0257-x (2020). [DOI] [PubMed] [Google Scholar]
- 46.Braun D, Caramalho I & Demengeot J IFN-alpha/beta enhances BCR-dependent B cell responses. Int Immunol 14, 411–419, doi: 10.1093/intimm/14.4.411 (2002). [DOI] [PubMed] [Google Scholar]
- 47.Bruno TC et al. Antigen-Presenting Intratumoral B Cells Affect CD4(+) TIL Phenotypes in Non-Small Cell Lung Cancer Patients. Cancer immunology research 5, 898–907, doi: 10.1158/2326-6066.CIR-17-0075 (2017). [DOI] [PMC free article] [PubMed] [Google Scholar]
- 48.Rivera A, Chen CC, Ron N, Dougherty JP & Ron Y Role of B cells as antigen-presenting cells in vivo revisited: antigen-specific B cells are essential for T cell expansion in lymph nodes and for systemic T cell responses to low antigen concentrations. Int Immunol 13, 1583–1593, doi: 10.1093/intimm/13.12.1583 (2001). [DOI] [PubMed] [Google Scholar]
- 49.Rossetti RAM et al. B lymphocytes can be activated to act as antigen presenting cells to promote anti-tumor responses. PloS one 13, e0199034, doi: 10.1371/journal.pone.0199034 (2018). [DOI] [PMC free article] [PubMed] [Google Scholar]
- 50.Germain C, Gnjatic S & Dieu-Nosjean MC Tertiary Lymphoid Structure-Associated B Cells are Key Players in Anti-Tumor Immunity. Frontiers in immunology 6, 67, doi: 10.3389/fimmu.2015.00067 (2015). [DOI] [PMC free article] [PubMed] [Google Scholar]
- 51.Cabrita R et al. Tertiary lymphoid structures improve immunotherapy and survival in melanoma. Nature 577, 561–565, doi: 10.1038/s41586-019-1914-8 (2020). [DOI] [PubMed] [Google Scholar]
- 52.Helmink BA et al. B cells and tertiary lymphoid structures promote immunotherapy response. Nature 577, 549–555, doi: 10.1038/s41586-019-1922-8 (2020). [DOI] [PMC free article] [PubMed] [Google Scholar]
- 53.Dann E, Henderson NC, Teichmann SA, Morgan MD & Marioni JC Differential abundance testing on single-cell data using k-nearest neighbor graphs. Nat Biotechnol 40, 245–253, doi: 10.1038/s41587-021-01033-z (2022). [DOI] [PMC free article] [PubMed] [Google Scholar]
- 54.Tang Z, Kang B, Li C, Chen T & Zhang Z GEPIA2: an enhanced web server for large-scale expression profiling and interactive analysis. Nucleic Acids Res 47, W556–W560, doi: 10.1093/nar/gkz430 (2019). [DOI] [PMC free article] [PubMed] [Google Scholar]
- 55.Khalil AM, Cambier JC & Shlomchik MJ B cell receptor signal transduction in the GC is short-circuited by high phosphatase activity. Science 336, 1178–1181, doi: 10.1126/science.1213368 (2012). [DOI] [PMC free article] [PubMed] [Google Scholar]
- 56.Engblom C et al. Osteoblasts remotely supply lung tumors with cancer-promoting SiglecF(high) neutrophils. Science 358, doi: 10.1126/science.aal5081 (2017). [DOI] [PMC free article] [PubMed] [Google Scholar]
- 57.Chihara N et al. Induction and transcriptional regulation of the co-inhibitory gene module in T cells. Nature 558, 454–459, doi: 10.1038/s41586-018-0206-z (2018). [DOI] [PMC free article] [PubMed] [Google Scholar]
- 58.Li B et al. Cumulus provides cloud-based data analysis for large-scale single-cell and single-nucleus RNA-seq. Nature methods 17, 793–798, doi: 10.1038/s41592-020-0905-x (2020). [DOI] [PMC free article] [PubMed] [Google Scholar]
- 59.Fleming SJ, Marioni JC & Babadi M CellBender remove-background: a deep generative model for unsupervised removal of background noise from scRNA-seq datasets. bioRxiv, 791699, doi: 10.1101/791699 (2019). [DOI] [Google Scholar]
- 60.Wolock SL, Lopez R & Klein AM Scrublet: Computational Identification of Cell Doublets in Single-Cell Transcriptomic Data. Cell Syst 8, 281–291 e289, doi: 10.1016/j.cels.2018.11.005 (2019). [DOI] [PMC free article] [PubMed] [Google Scholar]
- 61.Korsunsky I et al. Fast, sensitive and accurate integration of single-cell data with Harmony. Nature methods 16, 1289–1296, doi: 10.1038/s41592-019-0619-0 (2019). [DOI] [PMC free article] [PubMed] [Google Scholar]
- 62.Jerby-Arnon L & Ruppin E Moving ahead on harnessing synthetic lethality to fight cancer. Molecular & cellular oncology 2, e977150, doi: 10.4161/23723556.2014.977150 (2015). [DOI] [PMC free article] [PubMed] [Google Scholar]
- 63.Jerby-Arnon L et al. Predicting cancer-specific vulnerability via data-driven detection of synthetic lethality. Cell 158, 1199–1209, doi: 10.1016/j.cell.2014.07.027 (2014). [DOI] [PubMed] [Google Scholar]
- 64.Liu D et al. Integrative molecular and clinical modeling of clinical outcomes to PD1 blockade in patients with metastatic melanoma. Nature medicine 25, 1916–1927, doi: 10.1038/s41591-019-0654-5 (2019). [DOI] [PMC free article] [PubMed] [Google Scholar]
- 65.Lee JS et al. Harnessing synthetic lethality to predict the response to cancer treatment. Nature communications 9, 2546, doi: 10.1038/s41467-018-04647-1 (2018). [DOI] [PMC free article] [PubMed] [Google Scholar]
- 66.Picelli S et al. Full-length RNA-seq from single cells using Smart-seq2. Nat Protoc 9, 171–181, doi: 10.1038/nprot.2014.006 (2014). [DOI] [PubMed] [Google Scholar]
- 67.Satija R, Farrell JA, Gennert D, Schier AF & Regev A Spatial reconstruction of single-cell gene expression data. Nat Biotechnol 33, 495–502, doi: 10.1038/nbt.3192 (2015). [DOI] [PMC free article] [PubMed] [Google Scholar]
- 68.Afgan E et al. The Galaxy platform for accessible, reproducible and collaborative biomedical analyses: 2018 update. Nucleic Acids Res 46, W537–W544, doi: 10.1093/nar/gky379 (2018). [DOI] [PMC free article] [PubMed] [Google Scholar]
- 69.Li B & Dewey CN RSEM: accurate transcript quantification from RNA-Seq data with or without a reference genome. BMC Bioinformatics 12, 323, doi: 10.1186/1471-2105-12-323 (2011). [DOI] [PMC free article] [PubMed] [Google Scholar]
- 70.Mahoney KM et al. A secreted PD-L1 splice variant that covalently dimerizes and mediates immunosuppression. Cancer immunology, immunotherapy : CII 68, 421–432, doi: 10.1007/s00262-018-2282-1 (2019). [DOI] [PMC free article] [PubMed] [Google Scholar]
- 71.Ye CJ et al. Genetic analysis of isoform usage in the human anti-viral response reveals influenza-specific regulation of ERAP2 transcripts under balancing selection. Genome research 28, 1812–1825, doi: 10.1101/gr.240390.118 (2018). [DOI] [PMC free article] [PubMed] [Google Scholar]
Associated Data
This section collects any data citations, data availability statements, or supplementary materials included in this article.
Supplementary Materials
Data Availability Statement
All genomics data produced for this study have been deposited in the NCBI Gene Expression Omnibus (GEO) under accession GSE225717. All other data needed to evaluate the conclusions in this paper are available in the main text or the supplementary materials.