

Abstract
In this study, we developed two online monitors for total organic carbon (TOC) and water-soluble organic carbon (WSOC) measurements in fine (dp < 2.5μm) and coarse (2.5μm < dp < 10μm) particulate matter (PM), respectively. Their performance has been evaluated in laboratory and field tests to demonstrate the feasibility of using these monitors to measure near real-time concentrations, with consideration of their potential for being employed in long-term measurements. The fine PM collection setup was equipped with a versatile aerosol concentration enrichment system (VACES) connected to an aerosol-into-liquid-sampler (AILS), whereas two virtual impactors (VIs) in tandem with a modified BioSampler were used to collect coarse PM. These particle collection setups were in tandem with a Sievers M9 TOC analyzer to read TOC and WSOC concentrations in aqueous samples hourly. The average hourly TOC concentration measured by our developed monitors in fine and coarse PM were 5.17 ± 2.41 and 0.92 ± 0.29 μg/m3, respectively. In addition, our TOC readings showed good agreement and were comparable with those quantified using Sunset Lab EC/OC analyzer operating in parallel as a reference. Furthermore, we conducted field tests to produce diurnal profiles of fine PM-bound WSOC, which can show the effects of ambient temperature on maximum values in the nighttime chemistry of the winter, as well as on increased photochemical activities in afternoon peaks during the summer. According to our experimental campaign, WSOC mean values during the study period (3.07 μg/m3 for the winter and 2.7 μg/m3 for the summer) were in a comparable range with those of earlier studies in Los Angeles. Overall, our results corroborate the performance of our developed monitors in near real-time measurements of TOC and WSOC, which can be employed for future source apportionment studies in Los Angeles and other areas, aiding in understanding the health impacts of different pollution sources.
Keywords: Total organic carbon, Water-soluble organic carbon, Nighttime chemistry, Aqueous phase reactions, Photochemical reactions, Los Angeles
Graphical Abstract

1. Introduction
Different size ranges of particulate matter (PM) are linked to adverse impacts on human health, as demonstrated by various studies (Klompmaker et al., 2022; Lippmann & Chen, 2009; Mabahwi et al., 2014). In the respiratory system, fine PM (dp < 2.5μm) penetrates deep into the lung, while coarse PM (2.5μm < dp < 10μm) primarily deposits in the nasal cavity, pharynx, and upper airways (Aghaei et al., 2023; Keet et al., 2018). Long-term exposure to fine PM is associated with alveolar inflammation and lower functionality of the lungs in air exchange (Willers et al., 2013; Xing et al., 2016), while coarse PM increases the risk of cancer in nasopharyngeal tissue and local inflammation (Huang et al., 2020; Michikawa et al., 2015). Carbonaceous aerosols, including organic carbon (OC) and elemental carbon (EC), have been identified as an important fraction of the ambient PM (Karanasiou et al., 2011), as they are engaged in cloud formation, solar radiation balance, and visibility degradation, which affect regional and global climate (Chung & Seinfeld, 2002; Hand et al., 2012; Kirchstetter et al., 2004). Water-soluble organic carbon (WSOC) is a significant fraction of OC (Lim & Turpin, 2002; Sannigrahi et al., 2006), and can cause adverse health responses by triggering redox activities (Molina et al., 2020; Saffari et al., 2014; Verma et al., 2012).
There are two main sources of OC in the environment: primary organic aerosol (POA) is directly emitted from local combustion sources such as biomass burning, cooking, and vehicles (Robinson et al., 2007), while indirectly secondary organic aerosol (SOA) is formed in the atmosphere through photo-oxidation of organic gas-phase precursors (Donahue et al., 2006). SOA can also be formed in the aqueous phase on pre-existing water droplets by further dissolving the gas-phase reaction products (Ervens et al., 2011, 2014; Lim & Turpin, 2015). The mass concentration of OC is highly dependent on location and meteorology (Jin et al., 2020; Saffari et al., 2016); previous studies have demonstrated that 35–60% of its concentration is attributed to secondary formation across the United States (Cabada et al., 2004; Lim & Turpin, 2002; Polidori et al., 2007; Saffari et al., 2016; Turpin & Huntzicker, 1995). WSOC could be a product of the primary emissions (Graham et al., 2002; Jin et al., 2020), but its concentration is mainly associated with the formation of SOA, especially in the fine PM (Du et al., 2014; Saffari et al., 2016). The WSOC contribution to OC concentrations varies across different states in the United States. In central Atlanta, WSOC primarily originates from the photo-oxidation of biogenic sources, accounting for 52–56% of OC (Zhang et al., 2012a). In Los Angeles, WSOC is generally produced through the gas-to-particle phase photochemical conversion of anthropogenic volatile organic compounds (VOCs), contributing to 47 to 52% of OC (Hasheminassab et al., 2013). Previous studies have provided more comprehensive analyses of WSOC concentrations in the US (Hayes et al., 2013; Sullivan et al., 2004; Weber et al., 2007; Zhang et al., 2012b). In addition to varied sources, the emissions, chemical reactions, and transport processes of OC and WSOC occur within a short time frame (e.g., minutes to hours) (Huang et al., 2006; Timonen et al., 2010; Zhang et al., 2008), thus emphasizing the necessity of near real-time measurement methods capable of in-field quantification of these organic compounds directly from the atmosphere.
The development of online OC and WSOC measuring instruments plays a critical role in assessing the characteristics, concentration, and potential sources of these PM fractions (Duan et al., 2020; Timonen et al., 2010). These advanced instruments enable continuous field measurements for rapid and practical data acquisition of PM organic compounds (DeCarlo et al., 2006), improving the understanding of the composition and sources of these particles and their impact on air quality. The EC/OC analyzer (Sunset Laboratory Inc., Portland, OR, USA) is an instrument designed for the measurement of EC, OC, and four OC volatility fractions (OC1–OC4) in carbonaceous aerosols, with the utilization of thermal/optical methods (Arhami et al., 2006; Bae et al., 2004; Bauer et al., 2009; Tohidi et al., 2022). Potential limitations of this instrument are associated with the pyrolysis of OC during EC/OC measurements, leading to filter darkening (charring) that might result in the underestimation of OC concentrations (Kang et al., 2010). In addition to the EC/OC analyzer, other instruments have been developed with the capability of in-line WSOC measurements. Earlier efforts for online monitoring of WSOC in ambient PM2.5 involved using a particle-into-liquid-sampler (PILS) (Orsini et al., 2003) along with a total organic carbon (TOC) analyzer (SUEZ Water Technologies and Solutions Inc., Boulder, CO, USA) (Sullivan et al., 2004). This combination of PILS and TOC analyzer has since been widely adopted in similar studies around the world for monitoring WSOC in ambient PM2.5 (Chen et al., 2021a; Chen et al., 2021b; Jin et al., 2020; Miyazaki et al., 2006; Rastogi et al., 2015; Sullivan et al., 2006a; Timonen et al., 2013). A potential limitation of PILS-TOC otherwise elegant sampler is negative artifacts associated with the evaporation of semi-volatile organic compounds (SVOCs) that could lead to a biased measurement due to the temperature difference between the ambient inlet and the PILS sample lines, which is typically 12 degrees higher than the ambient (Sullivan et al., 2006a). Moreover, this instrument has been designed to provide only WSOC and not TOC measurements. Recent progress in this field includes the development of a WSOC measurement setup comprising an activated carbon parallel plate denuder upstream of the PILS to minimize the influence of VOCs on our WSOC measurements (Sciare et al., 2011). Similarly, Tao et al. (2022) employed a wet annular denuder, a scrub, and an impact aerosol collector in their system. Park et al. (2011) also developed an online WSOC monitoring system, integrated with a PM2.5 inlet for particle collection, a steam generator, a reservoir for mixing air and steam, a condenser for particle growth, an air-liquid separator, and a TOC analyzer, to quantify the WSOC in ambient aerosol particles. Additionally, there has been an integration of online excitation-emission matrix (EEM) analysis to determine the characteristics of environmental chromophores (Chen et al., 2021c).
Given the stringent air pollution regulations on the emission of ambient PM in Southern California (California Air Resources Board, 2022), there is a need to continually monitor TOC and WSOC levels in the ambient air to ensure conformity with the established air quality standards. The aim of this study was to develop novel online monitors for near real-time measurements of both ambient TOC and WSOC concentrations and evaluate their performance by comparing their measurements with those of reference setups. Our online monitors were equipped with a TOC analyzer (M9 Sievers, SUEZ Water Technologies and Solutions Inc., Boulder, CO, USA) in tandem with two different particle collection setups, employed for fine and coarse ambient PM, respectively: the fine PM setup consisted of a versatile aerosol concentration enrichment system (VACES) connected to an aerosol-into-liquid-sampler (AILS), whereas coarse PM setup was equipped with two virtual impactors (VIs) in tandem with a modified BioSampler (SKC West Inc., Fullerton, CA, USA). Our findings were further compared using an EC/OC analyzer (Model 4, Sunset Laboratory Inc., Portland, OR, USA), which was concurrently employed, as a reference, to corroborate the accuracy of OC concentrations measured by our developed setups. Field tests were conducted in central Los Angeles as a feasibility demonstration of the ability of our developed monitor to provide TOC and WSOC concentrations with hourly resolution.
2. Methodology
2.1. Sampling site and period
The particle instrumentation unit (PIU) of the University of Southern California (USC), located 3 kilometers south of downtown Los Angeles, proximate to a major freeway (I-110), served as the sampling site, representing a typical urban environment influenced by both primary and secondary sources (Heo et al., 2013; Minguillón et al., 2008; Sowlat et al., 2016).
The feasibility field tests for measuring coarse and fine PM-bound TOC were performed over a period of two weeks in the winter (January) and summer (July) of 2023. During winter precipitation events, the weather was rainy and foggy, with an average daily precipitation of 0.69 inches, and the relative humidity was nearly twice as high compared to fair days in winter, with an average reported daily value of 75.3% and 36.3%, respectively. Moreover, the average ambient temperature during winter was reported to be 11.46 °C. During summer measurements, average daily relative humidity and ambient temperature were reported as 72.4% and 24.68 °C, respectively (California Air Resources Board, 2023). Different weather conditions during the second phase allowed capturing concentration variations in response to ambient temperature and relative humidity, which can impact the TOC and WSOC contribution to ambient PM (Timonen et al., 2010; Tohidi et al., 2022).
2.2. Description of the TOC analyzer setups
Two separate setups were used for collecting ambient PM depending on the targeted size range for measurement. The schematic of the configuration and components of VACES/AILS (for fine PM) and VIs/BioSampler (for coarse PM) coupled with the TOC analyzer are shown in Figure 1.
Figurec 1.
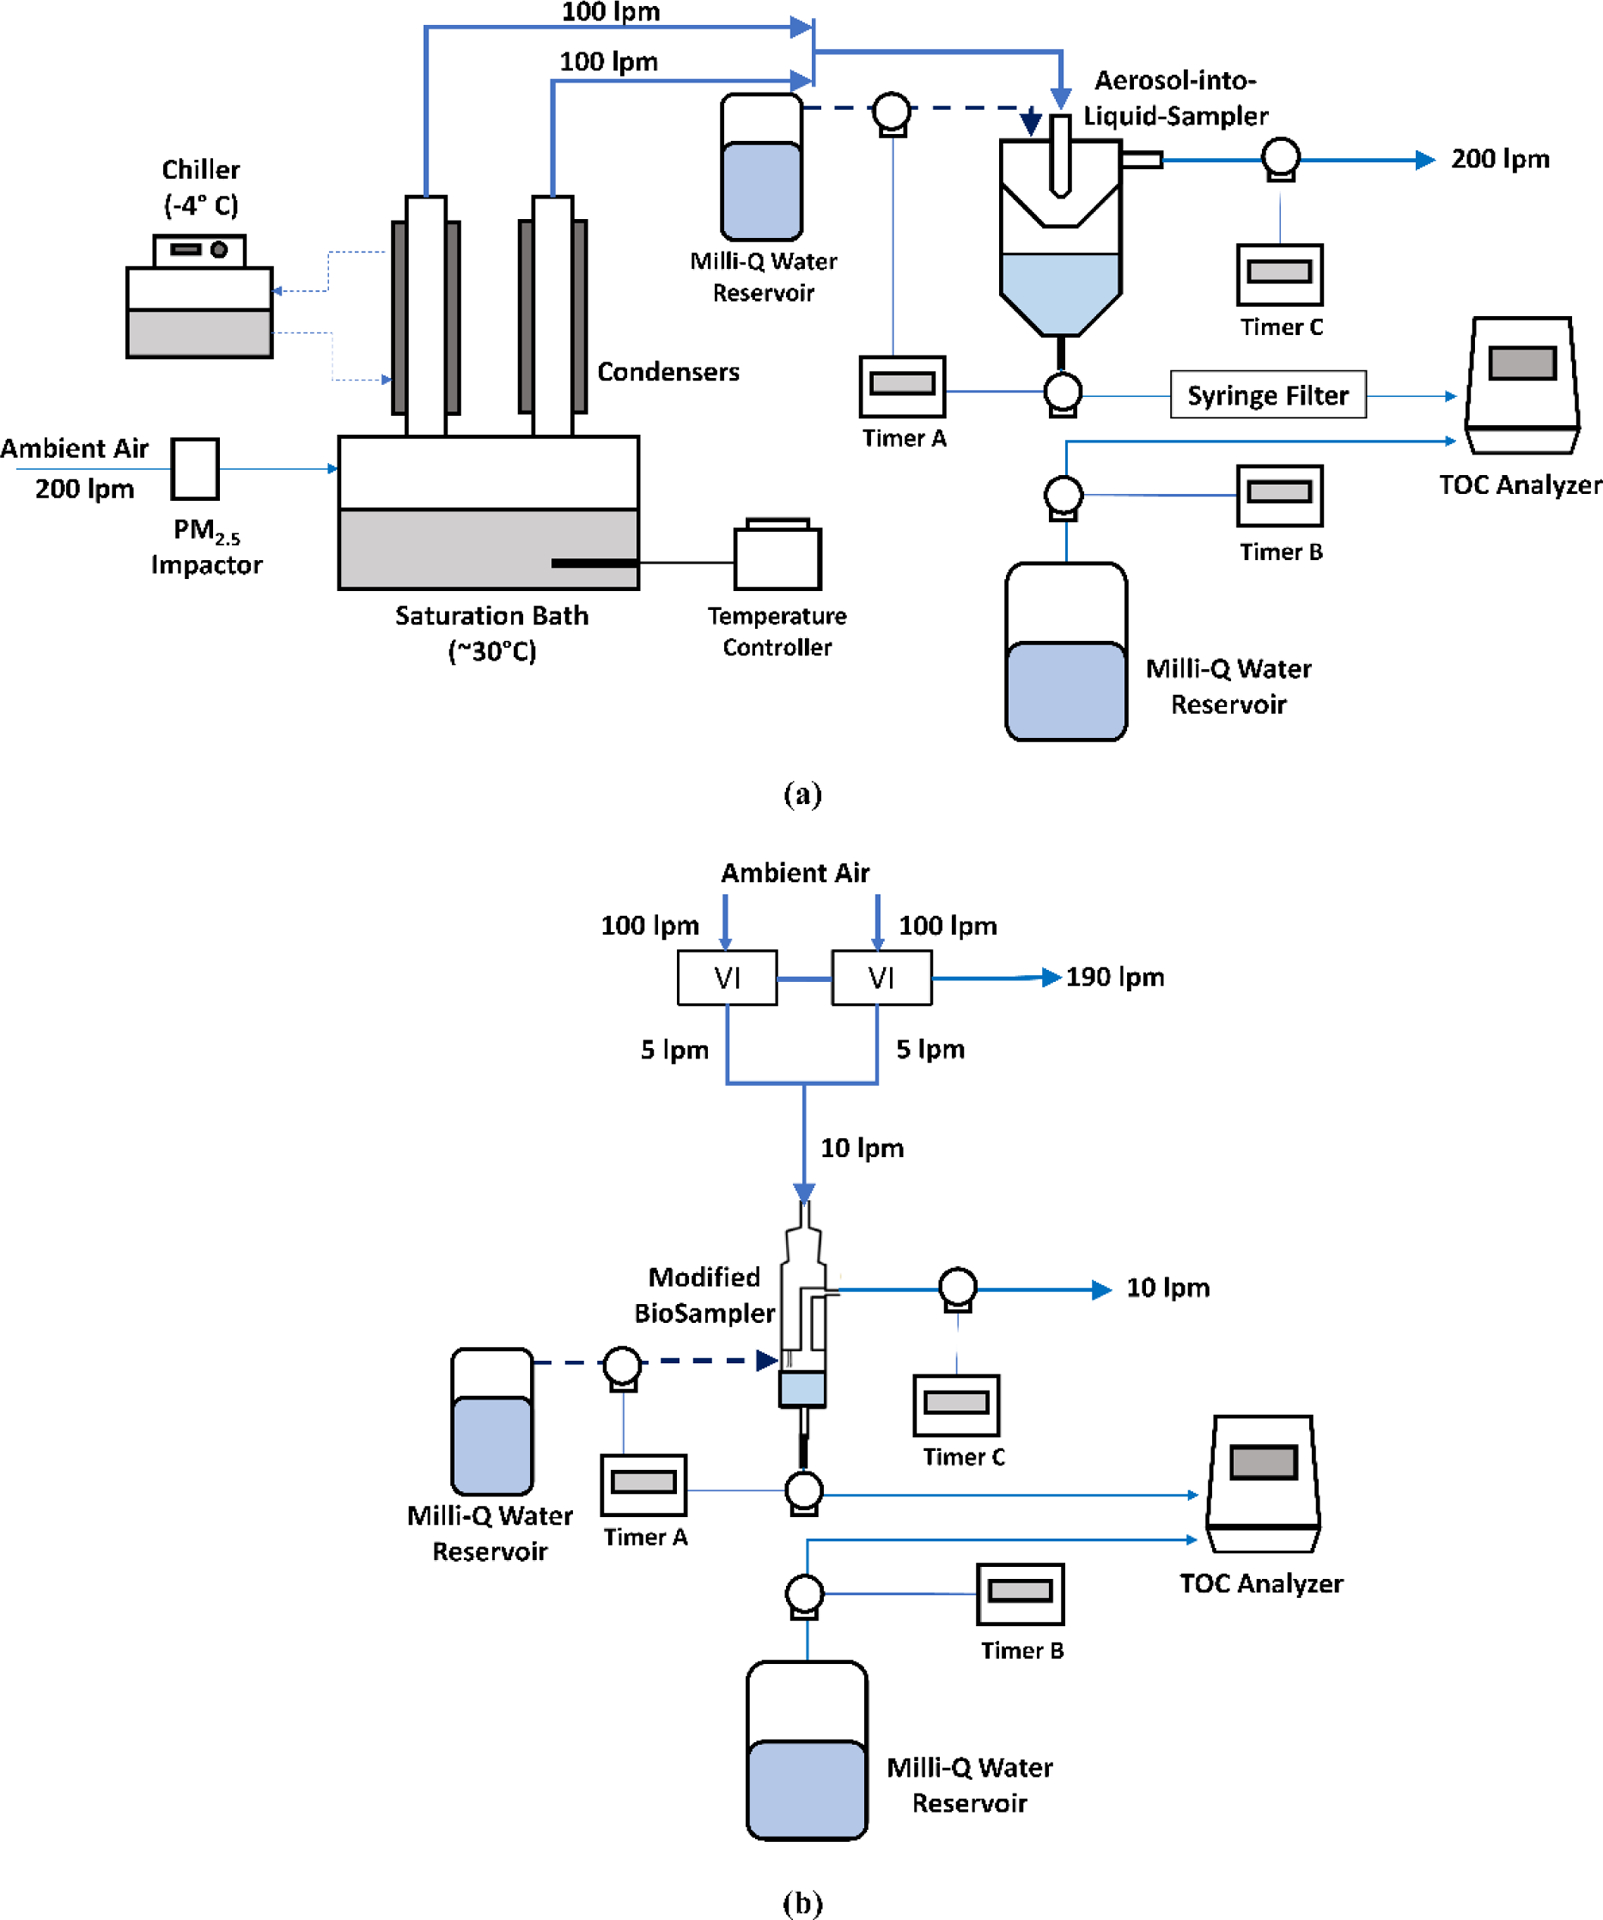
Schematic representation of (a) the VACES/AILS/TOC analyzer experimental setup, (b) the VI/BioSampler/TOC analyzer experimental setup.
In the first approach, the ambient fine PM was collected into an aqueous sample employing a VACES (Kim et al., 2001a,b) in tandem with an AILS (Wang et al., 2013a). As shown in Figure 1(a), the setup incorporated a low-pressure drop, high-flow rate (i.e., 200 liters per minute (lpm)) PM2.5 impactor (compatible with VACES) (Misra et al., 2002) to draw the fine ambient particles into ultrapure Milli-Q water (total organic compounds < 5 ppb, Millipore Inc., Bedford, MA, USA) tank, which was saturated with vapor at the temperature of 30°C. The incoming particle-vapor mixture was subsequently divided into two parallel lines, each with a flow rate of 100 lpm, which entered a condensation unit connected to a chiller operating at −4 °C. In the chiller, the particle-vapor mixture temperature was reduced to 21°C, resulting in supersaturation, which led to condensation of the water vapor on the particles and growing them into droplets ranging from 3 to 4 μm. Two airstreams from condensation lines were merged, generating a combined airstream with a total flow rate of 200 lpm, which was then directed through the impaction nozzles of an AILS (described in more detail by (Wang et al., 2013a)). The grown aerosol droplets were collected in the bottom section of the AILS, serving as the collection stage, which was supplied with Milli-Q water with a volume of 10 mL to form a concentrated aqueous sample. Detailed information regarding concentrated particles and particle-vapor mixture quality control procedures of the VACES and AILS have been documented in previous studies (Kim et al., 2001a,b; Wang et al., 2013a). The aqueous sample was transferred directly to the TOC analyzer to measure fine PM-bound TOC concentration. Moreover, to measure fine PM-bound WSOC concentrations, a 0.22 μm polypropylene syringe filter (Whatman Inc., Florham Park, NJ, USA) was added downstream of the AILS to remove the water-insoluble species of the aqueous sample before entering the TOC analyzer. According to the manufacturer’s guidelines and our sampling procedure, the syringe filter was replaced every four hours. This could be considered as a potential limitation due to the need for periodic in-person attendance for filter replacement.
In the second approach, we collected ambient coarse PM in an aqueous sample employing two VIs (Wang et al., 2013a, 2015) with a cutpoint of 1.5 μm, along with a modified BioSampler (Wang et al., 2015), as shown in Figure 1(b). Ambient particles were initially drawn into two round nozzle VIs, each with a major flow rate of 95 lpm and a minor flow rate of 5 lpm. The coarse particles were concentrated by 20-fold into the minor flows of the VIs. The two minor flows were combined (10 lpm) and directed to the modified BioSampler, which utilizes impaction and centrifugal forces to collect aqueous coarse PM samples (Daher et al., 2011). Before sampling, 20 mL of Milli-Q water was injected into the modified BioSampler to capture coarse PM in the form of an aqueous sample. In-depth details related to the VIs and modified BioSampler were provided in previous studies (Wang et al., 2013a, 2015).
The aqueous sample was streamed to a TOC analyzer each hour by a peristaltic pump using Polytetrafluoroethylene (PTFE) tubes, known for minimal reactivity and low adsorption properties (Radulovic et al., 2014), to determine its TOC content for the feasibility tests. The coarse and fine particle collection setups were connected to a TOC analyzer (M9 Sievers, SUEZ Water Technologies and Solutions Inc., Boulder, CO, USA) to perform online measurements on an hourly basis. The TOC analyzer is designed to measure TOC in aqueous solutions through a two-step process, generating carbon dioxide (CO2), which its concentration measured using a sensitive and selective membrane-based conductometric detection technique. Initially, the process begins by acidifying the aqueous sample to determine the concentration of bicarbonate (HCO3−) and carbonate (CO3−2) by measuring the CO2 produced throughout the process. The second stage involves using UV radiation to oxidize organic compounds in the aqueous sample, also converting them into CO2. The total carbon (TC) content is measured by quantifying the concentration of CO2 produced in both stages. The TOC concentration is calculated by subtracting the concentrations of HCO3− and CO3−2 (measured in the first stage) from the TC (Urbansky, 2001).
The measurement process consisted of a 50-minute sampling period followed by a 10-minute analysis phase. To ensure accurate control of the entire measurement process, including the sampling and analysis phase, the setups were equipped with three programmable time switches, as shown in Figure 1. Before conducting the tests, blank measurements were carried out for fine PM-bound TOC and WSOC and coarse PM-bound TOC setups to obtain the background level concentrations. To achieve accurate readings from the TOC analyzer setups, we utilized a high-efficiency particulate air (HEPA) filter (Model 12144, Pall Corporation, Port Washington, NY, USA) to supply filtered air to the setups and measure the background values. The measured background levels were subtracted from hourly readings to precisely determine the OC content of the sampled air. The blank TOC levels of the fine and coarse PM setups were 0.098 ± 0.006 and 0.268 ± 0.048 μg/m3, respectively. According to the manufacturer’s manual and our sampling procedure, the TOC analyzer can detect a minimum TOC concentration of 6×10⁻⁵ μg/m3 in aqueous samples.
2.3. Description of the EC/OC analyzer setups
To confirm the accuracy and reliability of the collected data from the TOC analyzer setups, a semi-continuous EC/OC field analyzer (Model 4, Sunset Laboratory Inc., Portland, OR, USA) was employed as a reference instrument to measure the TOC and OC fractions levels in the ambient PM. As shown in the schematic diagram in Figure 2, the EC/OC analyzer setups used a PM2.5 impactor and a VI (with a cutpoint of 1.5 μm) for the collection of fine and coarse PM samples, respectively. The sampled particles were drawn through a carbon denuder before undergoing analysis with the EC/OC analyzer. The carbon denuder, operating at a flow rate of 5 lpm, plays a crucial role in eliminating gas-phase organics and minimizing positive sampling artifacts occurring due to the adsorption of organic vapors on the quartz filter (Kirchstetter et al., 2001). The EC/OC analyzer employed the new interagency monitoring of protected visual environments (IMPROVE_A) operational protocol, which involved a series of temperature plateaus in separating and quantifying different OC fractions (OC1 (volatilizes at 140 °C), OC2 (280. °C), OC3 (480 °C), and OC4 (580 °C)) of collected samples on quartz filters. During the analysis, the quartz filter was gradually heated to specific temperatures to determine levels of OC and subsequently raised to an elevated temperature to determine levels of EC, all in accordance with the established operational protocol (Chow et al., 2007). The measurements were conducted with a temporal resolution of 1 hour, with each measurement cycle consisting of a sample collection period of a 40-min, followed by a 20-min period allocated for analysis.
Figure 2.

Schematic representation of (a) PM2.5 Impactor/Denuder/EC-OC analyzer and (b) VI/Denuder/EC-OC analyzer.
3. Results and discussion
3.1. TOC diurnal trends and regression analysis
Figure 3 presents the diurnal variations of the average TOC concentration in both fine and coarse PM samples as determined by the feasibility tests. Our results indicated good agreement between the hourly measurements of TOC levels in fine PM samples collected during the winter and summer by both the TOC analyzer setup and the EC/OC analyzer setup. The averaged fine PM-bound TOC concentrations (i.e., during the entire study period) reported by the TOC analyzer setup and EC/OC analyzer setup were 5.17 ± 2.41 and 5.18 ± 2.79 μg/m3, respectively. Our findings showed a maximum value of approximately 7 μg/m3 at around 11 pm, while the average TOC levels declined to about 3.5 μg/m3 at around 3 pm (Figure 3(a)).
Figure 3.

Diurnal profiles for average concentration of TOC in (a) fine PM, (b) coarse PM.
The average fine PM-bound TOC mass concentration observed in winter was approximately 7.17 μg/m3, comparable to values reported in previous studies carried out during cold periods in the region. Mousavi et al. (2018) reported an average TOC value of 7.37 μg/m3 from December 2016 to February 2017. Similarly, Wang et al. (2013b) conducted field evaluation tests in January and February 2013, reporting TOC mass concentrations averaging 7.06 μg/m3. Moreover, our collected data for summer 2023 revealed an average TOC value of approximately 2.94 μg/m3, closely aligned with TOC concentration observed by the United States Environmental Protection Agency (US EPA) as part of the Air Quality System (AQS) and Chemical Speciation Network (CSN) database in summer 2022, which was approximately 2.86 μg/m3 (US EPA, 2022).
The diurnal profiles of fine PM-bound TOC mass concentration in the winter exhibit a nighttime peak, which can be attributed to limited mixing height, decreasing the dispersion of pollutants and preventing atmospheric dilution (Patel et al., 2021; Ware et al., 2016). Furthermore gas to particle conversion of SVOCs occurs during the winter nighttime due to the favorable higher relative humidity and reduced temperature (Saffari et al., 2016; Zhang et al., 2012b), resulting in elevated TOC levels in these hours. Fine PM mass concentration is also higher overnight in the cold period, providing pre-existing aerosols to participate in the aqueous phase formation of SOA (Ervens et al., 2011; Saffari et al., 2016; Zhang et al., 2012b), leading to higher levels of SOA at nighttime. Both fine PM setups showed lower levels of TOC during the afternoon hours compared to the nighttime in winter, which can be likely attributed to the cloudy conditions with low levels of UV index during the daytime of the investigated period. In addition, the higher mixing height during the winter afternoons increases the volume of pollution dispersion (Liu et al., 2015), possibly leading to a decrease in TOC readings. Another factor contributing to the lower TOC concentration could be higher temperatures during the winter afternoon hours, triggering the evaporation of volatile and semi-volatile organic species (Kroll & Seinfeld, 2008; Saffari et al., 2016). In contrast to the winter, TOC concentrations in summer peaked during afternoon hours, which is due to the intense solar radiation and higher temperature favoring photochemical reactions of organic gas-phase precursors (Hayes et al., 2013; Polidori et al., 2007; Saffari et al., 2016).
The average coarse PM-bound TOC values in winter reported by the TOC analyzer setup and the EC/OC analyzer setup were 0.92 ± 0.29 and 0.93 ± 0.33 μg/m3, respectively. This agreement in the TOC concentrations measured by both coarse PM setups highlights the consistency and precision of the TOC analyzer setup employed in this study. Additionally, the maximum mass concentration of coarse PM-bound TOC measured by the TOC analyzer setup was observed to be about 1.2 μg/m3 at around 6 am, while its value decreased to approximately 0.75 μg/m3 at around 5 pm (Figure 3(b)).
The coarse PM-bound TOC mass concentrations reported in this study are comparable to those in earlier studies conducted in central Los Angeles during winter. Tohidi et al. (2022) conducted a continuous sampling campaign for 30 days to measure coarse PM with VIs coupled with an EC/OC analyzer, reporting that the value for TOC mass concentration was approximately 1 μg/m3 during the winter. Similarly, Cheung et al. (2011a) employed cascade impactor samplers at the USC sampling site and reported TOC mass concentrations on average 1.1 μg/m3 over the winter.
The TOC levels were notably higher during winter nighttime and early morning hours (particularly from 9 pm to 7 am) in comparison to the mid-day period. Due to the off-peak policies for shifting freight, nighttime delivery programs have been implemented, increasing the traffic load of heavy-duty vehicles overnight and early mornings (Geroliminis & Daganzo, 2008; Giuliano & O’Brien, 2007; Sathaye et al., 2010). While the implementation of these off-peak regulations has lessened traffic volume (Browne et al., 2006), an experimental investigation conducted in Southern California demonstrated that despite reduced traffic congestion, emissions might be higher due to aggregate traffic during the nighttime hours and early morning than during the day (Hu et al., 2009). The resuspension of road dust due to the turbulence generated by heavy-duty vehicle traffic could justify the higher winter nighttime concentration of coarse PM-bound TOC, combined with the lower mixing heights and the stagnant air conditions over this period (Charron et al., 2005; Cheung et al., 2011b; Van Pinxteren et al., 2009). Furthermore, the lower traffic volume on the I-110 highway in the mentioned period (between 9 pm and 7 am) in winter led to increased vehicle speeds, further contributing to the resuspension of coarse particles (Liu et al., 2011). In contrast, lower coarse TOC levels were observed during winter mid-day, which can be explained by an increase in the boundary layer height during the day, providing a higher dispersion of air pollutants (Liu et al., 2015).
A comparative regression analysis was conducted to assess the relationship between the hourly readings of TOC obtained from the TOC analyzer setups and the EC/OC analyzer setups. According to Figure 4, very good agreement was observed between measured TOC mass concentrations by both setups (with an R2 value of 0.89 for fine PM and an R2 value of 0.85 for coarse PM), indicating that the values obtained from them were comparable. Moreover, we calculated the average ratios of TOC concentrations measured by TOC analyzer setups to those obtained using EC/OC analyzer setups, which were 0.99 ± 0.21 and 1.00 ± 0.13 in fine and coarse PM, respectively. The comparable TOC levels between TOC analyzer setups and EC/OC analyzer setups (coupled with s denuder), which are presumably artifact-free (Arhami et al., 2006; Badami et al., 2023a; Turpin et al., 2000), indicated that any potential sampling artifacts in our developed setups were probably minimal.
Figure 4.

Linear regression between TOC analyzer setups and EC/OC analyzer setups for average concentration of TOC in (a) fine PM and (b) coarse PM.
3.2. Diurnal trends of WSOC in fine PM
The measurement phase for the WSOC content in fine PM included the summer period, as well as precipitation events and fair days in the winter. Figures 5, 6, and 7 present diurnal profiles in the mentioned periods for the geometric mean WSOC concentrations, measured by the TOC analyzer setup, with the corresponding values of TOC and the least volatile organic carbon fraction (i.e., OC4), as measured by the EC/OC analyzer setup.
Figure 5.

Diurnal profiles of the geometric mean concentration of (a) WSOC and TOC, (b) WSOC and OC4 during precipitation events of the winter (rainy and foggy days with an average daily precipitation of 0.69 inches)
Figure 6.

Diurnal profiles of the geometric mean concentration of (a) WSOC and TOC, (b) WSOC and OC4 during fair weather of winter (without daily precipitation).
Figure 7.

Diurnal profiles of the geometric mean concentration of (a) WSOC and TOC, (b) WSOC and OC4 during summer.
Previous studies have indicated a strong correlation between OC4 and WSOC, highlighting that a considerable portion of the WSOC accounted for OC4 (Miyazaki et al., 2007; Tang et al., 2016). Higher levels of OC4 and WSOC have been attributed to SOA formation due to both aqueous phase reactions of gas-phase reactions products in the cold seasons and photochemical reactions followed by condensation of SVOC in warm seasons (Badami et al., 2023b; Cao et al., 2005; Du et al., 2014; Li et al., 2018; Tohidi et al., 2022). Soleimanian et al. (2019) also reported that secondary formation is the dominant contributor (ranging 43–66%) to OC4 in central Los Angeles.
The findings from the precipitation events in winter revealed that the trends observed for WSOC concentrations were consistent with those of TOC and OC4. As shown in Figure 5, the night and early morning during precipitation events in winter were characterized by increased WSOC levels with a maximum average value of approximately 4.8 μg/m3 occurring at around 7 am, while minimum WSOC concentrations of 2.3 μg/m3 observed in the afternoon hours around 1 pm. The observed WSOC trend was aligned with the findings of Sullivan et al. (2004) in precipitation events exhibiting a daily peak during the night and a decreased concentration during the midday.
The relative humidity is an important factor in the formation of SOA tracers (i.e., WSOC and OC4), with higher relative humidity levels, the availability of liquid water content in the atmosphere increases, which creates favorable conditions for the condensation of hydrophilic compounds in the particulate phase (Du et al., 2014; Favez et al., 2008). Along with the availability of liquid water content, lower winter temperatures induce phase change of SVOCs (Ervens et al., 2011; Zhang et al., 2012b), which is a substantial fraction of SOA mass. Previous studies in different parts of the world have indicated the effect of high relative humidity on increased SOA formation (Saffari et al., 2016; Sullivan et al., 2004; Xiang et al., 2017). Our findings also show a strong positive association between WSOC and relative humidity, supporting that WSOC formation is linked to aqueous reactions in cold seasons (Xiang et al., 2017). Additionally, the limited mixing height and lower boundary layer during the mentioned period (i.e., 9 pm to 7 am) in winter can restrict atmospheric ventilation and effective dispersion, thereby contributing to the observed nighttime peak in carbon concentrations (Patel et al., 2021). In contrast, cloudy weather conditions along with reduced solar radiation minimized the photochemical formation of SOA during the day of precipitation events (Soleimanian et al., 2019; Sullivan et al., 2004); therefore, the lowest values in the concentration of TOC, WSOC, and OC4 were reported in the afternoon over winter. The lower mass concentrations can also be attributed to the loss of semi-volatile WSOC through volatilization, which occurs due to increased ambient temperatures at midday during the winter (Rastogi et al., 2015).
As shown in Figure 6, the WSOC mass concentration during fair days in winter did not exhibit a nighttime peak, in contrast to the precipitation periods. The minimum value of about 2.3 μg/m3 for WSOC occurred at around 1 am and gradually increased to 3.8 μg/m3 at about 5 pm. The lower relative humidity in fair days compared to precipitation periods limited the occurrence of reactions in the aqueous phase, thereby decreasing SOA formation (Ervens et al., 2011; Lim & Turpin, 2015). Given the low rate of SOA formation and reduced ambient temperature at night over the winter, the lower WSOC levels could be primarily attributed to the condensation of POA, and this is supported by the lack of agreement between WSOC and OC4 levels. A daytime peak in WSOC levels occurred between 2 and 5 pm during fair days of cold periods, which could be associated with higher ozone levels, solar radiation, and elevated temperature relative to the nighttime period, increasing the formation of SOA during these hours (Sun et al., 2015; Tang et al., 2016).
According to Figure 7, the diurnal profile of WSOC levels in summer was similar to TOC and OC4, with maximum values during noon and afternoon and minimum values during late night and early morning. As expected, the summer diurnal profile shows different peak hours compared to the winter trends. The mass concentration of WSOC steadily increased from a morning minimum of around 2.2 μg/m3 at about 6 am, and around 12 pm reached its daily maximum of approximately 3.5 μg/m3 during the summer. This observed trend aligned with the diurnal pattern in Los Angeles during the California Nexus field campaign; (Zhang et al., 2012b) indicated that WSOC reached their peak concentrations in the early afternoon, coinciding with intense solar radiation, suggesting that photochemical production was a major source for WSOC. Moreover, another study in Atlanta, GA, indicated a similar pattern with WSOC steadily increasing in concentration from morning to a daily maximum at midday (Hennigan et al., 2009).
In contrast to wintertime, the afternoon peak in summer is due to intense solar radiation with increased temperature, inducing photochemical reactions in the SOA (Hayes et al., 2013; Polidori et al., 2007; Saffari et al., 2016). The WSOC levels observed during the entire measurements exhibited good agreement with results from previous studies conducted in Los Angeles.
Saffari et al. (2016) conducted a study examining the carbonaceous content of fine PM during winter at the USC sampling station. The authors reported only hourly data of WSOC mass concentration for a limited duration of 8 hours, specifically from 11 am to 3 pm (afternoon) and 8 pm to 4 am (nighttime). The average WSOC values in time periods of afternoon and nighttime were approximately 3.12 and 2.91 μg/m3, respectively, which closely align with our observed WSOC mass concentration of 2.95 and 2.88 μg/m3 in corresponding hours (i.e., 11 am to 3 pm and 8 pm to 4 am). Similarly, Soleimanian et al. (2020) carried out a field campaign with weekly integrated sample collection during two seasons: summer (July to September 2018) and winter (November 2018 to March 2019), reporting average WSOC mass concentration of approximately 2.4 and 2.8 μg/m3 over summer and winter, respectively. These results are comparable to our findings in summer and winter, with average WSOC values of 2.7 and 3.07 μg/m3.
In addition, our findings indicated that the WSOC/OC ratio during the winter was about 49 ± 15%, while the ratio during summer increased to approximately 62 ± 4%. The WSOC/OC ratio in winter nights was lower than those during winter daytime, possibly due to the presence of water-insoluble fractions resulting from the condensation of SVOCs (Favez et al., 2008; Sullivan et al., 2004). In contrast, WSOC/OC ratios in summer showed lower variations, suggesting that source contributions to OC and WSOC were similar (Saarikoski et al., 2008), and OC concentration was influenced mainly by WSOC. Hasheminassab et al. (2013) reported an average WSOC/OC ratio of 44 and 58% during the winter and summer in Los Angeles, respectively, which closely aligns with our results. Other studies also indicated lower values of WSOC/OC ratios in cold periods compared to the warmer seasons (Decesari et al., 2001; Sullivan et al., 2006b).
4. Summary and Conclusions
The main goal of this investigation was to develop two online monitors for near real-time measurements of organic species (i.e., TOC and WSOC) in fine and coarse PM. Our online monitors consisted of a TOC analyzer connected to separate particle collection setups based on the targeted size range for measurement: a VACES/AILS tandem setup and a VIs/BioSampler tandem setup employed to collect fine and coarse PM, respectively, and concentrate them into aqueous samples. The measured TOC levels were compared with those obtained using a reference EC/OC analyzer to confirm the accuracy and reliability of our developed monitors. Good agreement was observed between TOC concentrations measured using our developed monitors and EC/OC analyzer setups with R2 values of 0.89 and 0.85 for fine and coarse PM, respectively. Moreover, the average TOC readings (5.17 ± 2.41 μg/m3 for fine PM and 0.92 ± 0.29 μg/m3 for coarse PM) indicated comparable performance of our developed monitors in hourly measurement with reference EC/OC analyzer. In limited field measurements, the developed fine PM monitor provided diurnal profiles of WSOC concentrations in winter (with an average of 3.07 μg/m3) and summer (with an average of 2.7 μg/m3), along with TOC and OC4 concentrations measured by EC/OC analyzer. The diurnal profiles showed winter peak concentrations during nighttime and early morning, while summer concentrations maximized during the afternoon hours. In addition to meteorological factors (e.g., ambient temperature, relative humidity, boundary layer height, and solar radiation), different SOA formation processes (e.g., aqueous phase reactions in winter and photochemical reactions in summer) can justify different peak times between cold and warm periods.
Given the comparable performance of our developed monitors and their good agreement to reference EC/OC analyzer in TOC measurements, as well as comparable TOC and WSOC readings in the winter and summer with those of previous studies conducted in the region, our developed monitors could be employed for long-term WSOC measurements to determine emission sources and its associated toxicological impacts on health, which could help policy-makers to develop effective control strategies to reduce the concentrations of these species.
We developed online monitors to measure TOC and WSOC in fine and coarse ambient PM.
A reference Sunset Lab EC/OC analyzer was used to confirm OC measurements.
The results corroborate monitors’ performance to measure online TOC and WSOC.
Nighttime chemistry in the winter was associated with high TOC and WSOC levels.
Summer peak hours of WSOC occurred in the afternoon due to photochemical reactions.
Acknowledgments
This study was funded by the National Institutes of Health (NIH) (grant numbers: 5R01ES029395-04 and 5R01ES032806-02). Additional support was provided through the Ph.D. fellowship award from the Viterbi School of Engineering, University of Southern California (USC).
Footnotes
Publisher's Disclaimer: This is a PDF file of an unedited manuscript that has been accepted for publication. As a service to our customers we are providing this early version of the manuscript. The manuscript will undergo copyediting, typesetting, and review of the resulting proof before it is published in its final form. Please note that during the production process errors may be discovered which could affect the content, and all legal disclaimers that apply to the journal pertain.
Declaration of interests
As the first author of the paper, on behalf of all of the co-authors declare that there are no known competing financial interests or personal relationships that could have appeared to influence the work reported in this paper.
Yashar Aghaei
Department of Civil and Environmental Engineering, University of Southern California (USC)
References
- Aghaei Y, Sajadi B, & Ahmadi G (2023). The effect of the mucus layer and the inhaled air conditions on the droplets fate in the human nasal cavity: A numerical study. Journal of Aerosol Science, 171(January), 113260. 10.1016/j.jaerosci.2023.106163 [DOI] [Google Scholar]
- Arhami M, Kuhn T, Fine PM, Delfino RJ, & Sioutas C (2006). Effects of sampling artifacts and operating parameters on the performance of a semicontinuous particulate elemental carbon/organic carbon monitor. Environmental Science and Technology, 40(3), 945–954. 10.1021/es0510313 [DOI] [PubMed] [Google Scholar]
- Badami MM, Tohidi R, Aldekheel M, Farahani VJ, Verma V, & Sioutas C (2023a). Design, optimization, and evaluation of a wet electrostatic precipitator (ESP) for aerosol collection. Atmospheric Environment, 308, 119858. 10.1016/J.ATMOSENV.2023.119858 [DOI] [PMC free article] [PubMed] [Google Scholar]
- Badami MM, Tohidi R, Jalali Farahani V, & Sioutas C (2023b). Size-segregated source identification of water-soluble and water-insoluble metals and trace elements of coarse and fine PM in central Los Angeles. Atmospheric Environment, 310, 119984. 10.1016/J.ATMOSENV.2023.119984 [DOI] [PMC free article] [PubMed] [Google Scholar]
- Bae MS, Schauer JJ, DeMinter JT, Turner JR, Smith D, & Cary RA (2004). Validation of a semi-continuous instrument for elemental carbon and organic carbon using a thermal-optical method. Atmospheric Environment, 38(18), 2885–2893. 10.1016/J.ATMOSENV.2004.02.027 [DOI] [Google Scholar]
- Bauer JJ, Yu XY, Cary R, Laulainen N, & Berkowitz C (2009). Characterization of the sunset semi-continuous carbon aerosol analyzer. Journal of the Air and Waste Management Association, 59(7), 826–833. 10.3155/1047-3289.59.7.826 [DOI] [PubMed] [Google Scholar]
- Browne M, Allen J, Anderson S, & Woodburn A (2006). Night-Time Delivery Restrictions. Recent Advances in City Logistics, 245–258. 10.1016/B978-008044799-5/50103-0 [DOI] [Google Scholar]
- Cabada JC, Pandis SN, Subramanian R, Robinson AL, Polidori A, & Turpin B (2004). Estimating the Secondary Organic Aerosol Contribution to PM2.5 Using the EC Tracer Method Special Issue of Aerosol Science and Technology on Findings from the Fine Particulate Matter Supersites Program. Aerosol Science and Technology, 38, 140–155. 10.1080/02786820390229084 [DOI] [Google Scholar]
- California Air Resources Board. (2022). Staff Report: Initial Statement of Reasons, Public Hearing To Consider the Proposed Advanced Clean Cars Regulation.
- California Air Resources Board. (2023). California Air Resources Board Inventory. https://www.arb.ca.gov/aqmis2/metselect.php
- Cao JJ, Wu F, Chow JC, Lee SC, Li Y, Chen SW, An ZS, Fung KK, Watson JG, Zhu CS, & Liu SX (2005). Characterization and source apportionment of atmospheric organic and elemental carbon during fall and winter of 2003 in Xi’an, China. Atmospheric Chemistry and Physics, 5(11), 3127–3137. 10.5194/acp-5-3127-2005 [DOI] [Google Scholar]
- Charron A, & Harrison RM (2005). Matter on a Heavily Trafficked London Highway : Sources and Processes. Environmental Science & Technology, 39(20), 7768–7776. [DOI] [PubMed] [Google Scholar]
- Chen Q, Hua X, & Dyussenova A (2021a). Evolution of the chromophore aerosols and its driving factors in summertime Xi’an, Northwest China. Chemosphere, 281, 130838. 10.1016/J.CHEMOSPHERE.2021.130838 [DOI] [PubMed] [Google Scholar]
- Chen Q, Hua X, Li J, Chang T, & Wang Y (2021b). Diurnal evolutions and sources of water-soluble chromophoric aerosols over Xi’an during haze event, in Northwest China. Science of The Total Environment, 786, 147412. 10.1016/J.SCITOTENV.2021.147412 [DOI] [PubMed] [Google Scholar]
- Chen Q, Hua X, Wang Y, Zhang L, & Chang T (2021c). Semi-continuous measurement of chromophoric organic aerosols using the PILS-EEM-TOC system. Atmospheric Environment, 244, 117941. 10.1016/J.ATMOSENV.2020.117941 [DOI] [Google Scholar]
- Cheung K, Daher N, Kam W, Shafer MM, Ning Z, Schauer JJ, & Sioutas C (2011a). Spatial and temporal variation of chemical composition and mass closure of ambient coarse particulate matter (PM10–2.5) in the Los Angeles area. Atmospheric Environment, 45(16), 2651–2662. 10.1016/j.atmosenv.2011.02.066 [DOI] [Google Scholar]
- Cheung K, Daher N, Shafer MM, Ning Z, Schauer JJ, & Sioutas C (2011b). Diurnal trends in coarse particulate matter composition in the Los Angeles Basin. Journal of Environmental Monitoring, 13(11), 3277–3287. 10.1039/c1em10296f [DOI] [PubMed] [Google Scholar]
- Chow JC, Watson JG, Chen LWA, Chang MCO, Robinson NF, Trimble D, & Kohl S (2007). The IMPROVE_A temperature protocol for thermal/optical carbon analysis: Maintaining consistency with a long-term database. Journal of the Air and Waste Management Association, 57(9), 1014–1023. 10.3155/1047-3289.57.9.1014 [DOI] [PubMed] [Google Scholar]
- Chung SH, & Seinfeld JH (2002). Global distribution and climate forcing of carbonaceous aerosols. Journal of Geophysical Research Atmospheres, 107(19), AAC 14–1-AAC 14–33. 10.1029/2001JD001397 [DOI] [Google Scholar]
- Daher N, Ning Z, Cho AK, Shafer M, Schauer JJ, & Sioutas C (2011). Comparison of the chemical and oxidative characteristics of particulate matter (PM) collected by different methods: Filters, impactors, and BioSamplers. Aerosol Science and Technology, 45(11), 1294–1304. 10.1080/02786826.2011.590554 [DOI] [Google Scholar]
- DeCarlo PF, Kimmel JR, Trimborn A, Northway MJ, Jayne JT, Aiken AC, Gonin M, Fuhrer K, Horvath T, Docherty KS, Worsnop DR, & Jimenez JL (2006). Field-deployable, high-resolution, time-of-flight aerosol mass spectrometer. Analytical Chemistry, 78(24), 8281–8289. 10.1021/ac061249n [DOI] [PubMed] [Google Scholar]
- Decesari S, Facchini MC, Matta E, Lettini F, Mircea M, Fuzzi S, Tagliavini E, & Putaud JP (2001). Chemical features and seasonal variation of fine aerosol water-soluble organic compounds in the Po Valley, Italy. Atmospheric Environment, 35(21), 3691–3699. 10.1016/S1352-2310(00)00509-4 [DOI] [Google Scholar]
- Donahue NM, Robinson AL, Stanier CO, & Pandis SN (2006). Coupled partitioning, dilution, and chemical aging of semivolatile organics. Environmental Science and Technology, 40(8), 2635–2643. 10.1021/es052297c [DOI] [PubMed] [Google Scholar]
- Du Z, He K, Cheng Y, Duan F, Ma Y, Liu J, Zhang X, Zheng M, & Weber R (2014). A yearlong study of water-soluble organic carbon in Beijing I: Sources and its primary vs. secondary nature. Atmospheric Environment, 92, 514–521. 10.1016/j.atmosenv.2014.04.060 [DOI] [Google Scholar]
- Duan L, Yan L, & Xiu G (2020). Online measurement of PM2.5 at an air monitoring supersite in yangtze river delta: Temporal variation and source identification. Atmosphere, 11(8). 10.3390/ATMOS11080789 [DOI] [Google Scholar]
- Ervens B, Sorooshian A, Lim YB, & Turpin BJ (2014). Key parameters controlling OH-initiated formation of secondary organic aerosol in the aqueous phase (AqSOA). Journal of Geophysical Research, 119(7), 3997–4016. 10.1002/2013JD021021 [DOI] [Google Scholar]
- Ervens B, Turpin BJ, & Weber RJ (2011). Secondary organic aerosol formation in cloud droplets and aqueous particles (aqSOA): A review of laboratory, field and model studies. Atmospheric Chemistry and Physics, 11(21), 11069–11102. 10.5194/acp-11-11069-2011 [DOI] [Google Scholar]
- Favez O, Sciare J, Cachier H, Alfaro SC, & Abdelwahab MM (2008). Significant formation of water-insoluble secondary organic aerosols in semi-arid urban environment. Geophysical Research Letters, 35(15). 10.1029/2008GL034446 [DOI] [Google Scholar]
- Geroliminis N, & Daganzo CF (2008). Existence of urban-scale macroscopic fundamental diagrams: Some experimental findings. Transportation Research Part B: Methodological, 42(9), 759–770. 10.1016/j.trb.2008.02.002 [DOI] [Google Scholar]
- Giuliano G, & O’Brien T (2007). Reducing port-related truck emissions: The terminal gate appointment system at the Ports of Los Angeles and Long Beach. Transportation Research Part D: Transport and Environment, 12(7), 460–473. 10.1016/j.trd.2007.06.004 [DOI] [Google Scholar]
- Graham B, Mayol-Bracero OL, Guyon P, Roberts GC, Decesari S, Facchini MC, Artaxo P, Maenhaut W, Köll P, & Andreae MO (2002). Water-soluble organic compounds in biomass burning aerosols over Amazonia 1. Characterization by NMR and GC-MS. Journal of Geophysical Research Atmospheres, 107(20), LBA 14–1-LBA 14–16. 10.1029/2001JD000336 [DOI] [Google Scholar]
- Hand JL, Schichtel BA, Pitchford M, Malm WC, & Frank NH (2012). Seasonal composition of remote and urban fine particulate matter in the United States. Journal of Geophysical Research Atmospheres, 117(5). 10.1029/2011JD017122 [DOI] [Google Scholar]
- Hasheminassab S, Daher N, Schauer JJ, & Sioutas C (2013). Source apportionment and organic compound characterization of ambient ultrafine particulate matter (PM) in the Los Angeles Basin. Atmospheric Environment, 79, 529–539. 10.1016/J.ATMOSENV.2013.07.040 [DOI] [Google Scholar]
- Hayes PL, Ortega AM, Cubison MJ, Froyd KD, Zhao Y, Cliff SS, Hu WW, Toohey DW, Flynn JH, Lefer BL, Grossberg N, Alvarez S, Rappenglück B, Taylor JW, Allan JD, Holloway JS, Gilman JB, Kuster WC, De Gouw JA, … Jimenez JL (2013). Organic aerosol composition and sources in Pasadena, California, during the 2010 CalNex campaign. Journal of Geophysical Research Atmospheres, 118(16), 9233–9257. 10.1002/jgrd.50530 [DOI] [Google Scholar]
- Hennigan CJ, Bergin MH, Russell AG, Nenes A, & Weber RJ (2009). Gas/particle partitioning of water-soluble organic aerosol in Atlanta. Atmospheric Chemistry and Physics, 9(11), 3613–3628. 10.5194/ACP-9-3613-2009 [DOI] [Google Scholar]
- Heo J, Dulger M, Olson MR, McGinnis JE, Shelton BR, Matsunaga A, Sioutas C, & Schauer JJ (2013). Source apportionments of PM2.5 organic carbon using molecular marker Positive Matrix Factorization and comparison of results from different receptor models. Atmospheric Environment, 73, 51–61. 10.1016/j.atmosenv.2013.03.004 [DOI] [Google Scholar]
- Hu S, Fruin S, Kozawa K, Mara S, Paulson SE, & Winer AM (2009). A wide area of air pollutant impact downwind of a freeway during pre-sunrise hours. Atmospheric Environment, 43(16), 2541–2549. 10.1016/j.atmosenv.2009.02.033 [DOI] [PMC free article] [PubMed] [Google Scholar]
- Huang HC, Tantoh DM, Hsu SY, Nfor ON, Frank CFL, Lung CC, Ho CC, Chen CY, & Liaw YP (2020). Association between coarse particulate matter (PM 10–2.5) and nasopharyngeal carcinoma among Taiwanese men. Journal of Investigative Medicine, 68(2), 419–424. 10.1136/jim-2019-001119 [DOI] [PMC free article] [PubMed] [Google Scholar]
- Huang XF, Yu JZ, He LY, & Yuan Z (2006). Water-soluble organic carbon and oxalate in aerosols at a coastal urban site in China: Size distribution characteristics, sources, and formation mechanisms. Journal of Geophysical Research Atmospheres, 111(22). 10.1029/2006JD007408 [DOI] [Google Scholar]
- Jin Y, Yan C, Sullivan AP, Liu Y, Wang X, Dong H, Chen S, Zeng L, Collett JL, & Zheng M (2020). Significant contribution of primary sources to water-soluble organic carbon during spring in Beijing, China. Atmosphere, 11(4), 395. 10.3390/ATMOS11040395 [DOI] [Google Scholar]
- Kang CM, Koutrakis P, & Suh HH (2010). Hourly measurements of fine particulate sulfate and carbon aerosols at the Harvard - U.S. environmental protection agency supersite in Boston. Journal of the Air and Waste Management Association, 60(11), 1327–1334. 10.3155/1047-3289.60.11.1327 [DOI] [PMC free article] [PubMed] [Google Scholar]
- Karanasiou A, Diapouli E, Cavalli F, Eleftheriadis K, Viana M, Alastuey A, Querol X, & Reche C (2011). On the quantification of atmospheric carbonate carbon by thermal/optical analysis protocols. Atmospheric Measurement Techniques, 4(11), 2409–2419. 10.5194/amt-4-2409-2011 [DOI] [Google Scholar]
- Keet CA, Keller JP, & Peng RD (2018). Long-term coarse particulate matter exposure is associated with asthma among children in medicaid. American Journal of Respiratory and Critical Care Medicine, 197(6), 737–746. 10.1164/RCCM.201706-1267OC/SUPPL_FILE/DISCLOSURES.PDF [DOI] [PMC free article] [PubMed] [Google Scholar]
- Kim S, Jaques PA, Chang M, Barone T, Xiong C, Friedlander SK, & Sioutas C (2001a). Versatile aerosol concentration enrichment system (VACES) for simultaneous in vivo and in vitro evaluation of toxic effects of ultrafine, fine and coarse ambient particles Part II: Field evaluation. Journal of Aerosol Science, 32(11), 1299–1314. 10.1016/S0021-8502(01)00058-1 [DOI] [Google Scholar]
- Kim S, Jaques PA, Chang M, Froines JR, & Sioutas C (2001b). Versatile aerosol concentration enrichment system (VACES) for simultaneous in vivo and in vitro evaluation of toxic effects of ultrafine, fine and coarse ambient particles Part I: Development and laboratory characterization. Journal of Aerosol Science, 32(11), 1281–1297. 10.1016/S0021-8502(01)00057-X [DOI] [Google Scholar]
- Kirchstetter TW, Corrigan CE, & Novakov T (2001). Laboratory and field investigation of the adsorption of gaseous organic compounds onto quartz filters. Atmospheric Environment, 35(9), 1663–1671. 10.1016/S1352-2310(00)00448-9 [DOI] [Google Scholar]
- Kirchstetter TW, Novakov T, & Hobbs PV (2004). Evidence that the spectral dependence of light absorption by aerosols is affected by organic carbon. Journal of Geophysical Research D: Atmospheres, 109(21). 10.1029/2004JD004999 [DOI] [Google Scholar]
- Klompmaker JO, Laden F, Browning MHEM, Dominici F, Ogletree SS, Rigolon A, Hart JE, & James P (2022). Associations of parks, greenness, and blue space with cardiovascular and respiratory disease hospitalization in the US Medicare cohort. Environmental Pollution, 312(April), 120046. 10.1016/j.envpol.2022.120046 [DOI] [PMC free article] [PubMed] [Google Scholar]
- Kroll JH, & Seinfeld JH (2008). Chemistry of secondary organic aerosol: Formation and evolution of low-volatility organics in the atmosphere. Atmospheric Environment, 42(16), 3593–3624. 10.1016/j.atmosenv.2008.01.003 [DOI] [Google Scholar]
- Li HZ, Dallmann TR, Li X, Gu P, & Presto AA (2018). Urban Organic Aerosol Exposure: Spatial Variations in Composition and Source Impacts. Environmental Science and Technology, 52(2), 415–426. 10.1021/acs.est.7b03674 [DOI] [PubMed] [Google Scholar]
- Lim HJ, & Turpin BJ (2002). Origins of primary and secondary organic aerosol in Atlanta: Results of time-resolved measurements during the Atlanta Supersite Experiment. Environmental Science and Technology, 36(21), 4489–4496. 10.1021/es0206487 [DOI] [PubMed] [Google Scholar]
- Lim YB, & Turpin BJ (2015). Organic peroxide and OH formation in aerosol and cloud water: Laboratory evidence for this aqueous chemistry. Atmospheric Chemistry and Physics Discussions, 15(12), 17367–17396. 10.5194/acpd-15-17367-2015 [DOI] [Google Scholar]
- Lippmann M, & Chen LC (2009). Health effects of concentrated ambient air particulate matter (CAPs) and its components Health effects of ambient air CAPs M. Lippmann and L.-C. Chen. Critical Reviews in Toxicology, 39(10), 865–913. 10.3109/10408440903300080 [DOI] [PubMed] [Google Scholar]
- Liu YJ, & Harrison RM (2011). Properties of coarse particles in the atmosphere of the United Kingdom. Atmospheric Environment, 45(19), 3267–3276. 10.1016/j.atmosenv.2011.03.039 [DOI] [Google Scholar]
- Liu Z, Hu B, Wang L, Wu F, Gao W, & Wang Y (2015). Seasonal and diurnal variation in particulate matter (Pm10 and pm25) at an urban site of beijing: Analyses from a 9-year study. Environmental Science and Pollution Research, 22(1), 627–642. 10.1007/s11356-014-3347-0 [DOI] [PubMed] [Google Scholar]
- Mabahwi NAB, Leh OLH, & Omar D (2014). Human Health and Wellbeing: Human Health Effect of Air Pollution. Procedia - Social and Behavioral Sciences, 153, 221–229. 10.1016/j.sbspro.2014.10.056 [DOI] [Google Scholar]
- Michikawa T, Ueda K, Takeuchi A, Tamura K, Kinoshita M, Ichinose T, & Nitta H (2015). Coarse particulate matter and emergency ambulance dispatches in Fukuoka, Japan: a time-stratified case-crossover study. Environmental Health and Preventive Medicine, 20(2), 130–136. 10.1007/s12199-014-0439-x [DOI] [PMC free article] [PubMed] [Google Scholar]
- Minguillón MC, Arhami M, Schauer JJ, & Sioutas C (2008). Seasonal and spatial variations of sources of fine and quasi-ultrafine particulate matter in neighborhoods near the Los Angeles-Long Beach harbor. Atmospheric Environment, 42(32), 7317–7328. 10.1016/j.atmosenv.2008.07.036 [DOI] [Google Scholar]
- Misra C, Kim S, Shen S, & Sioutas C (2002). A high flow rate, very low pressure drop impactor for inertial separation of ultrafine from accumulation mode particles. Journal of Aerosol Science, 33(5), 735–752. 10.1016/S0021-8502(01)00210-5 [DOI] [Google Scholar]
- Miyazaki Y, Kondo Y, Han S, Koike M, Kodama D, Komazaki Y, Tanimoto H, & Matsueda H (2007). Chemical characteristics of water-soluble organic carbon in the Asian outflow. Journal of Geophysical Research Atmospheres, 112(22). 10.1029/2007JD009116 [DOI] [Google Scholar]
- Miyazaki Y, Kondo Y, Takegawa N, Komazaki Y, Fukuda M, Kawamura K, Mochida M, Okuzawa K, & Weber RJ (2006). Time-resolved measurements of water-soluble organic carbon in Tokyo. Journal of Geophysical Research Atmospheres, 111(23). 10.1029/2006JD007125 [DOI] [Google Scholar]
- Molina C, Toro A,R, Manzano CA, Canepari S, Massimi L, & Leiva-Guzmán MA (2020). Airborne aerosols and human health: Leapfrogging from mass concentration to oxidative potential. Atmosphere, 11(9), 1–19. 10.3390/atmos11090917 [DOI] [Google Scholar]
- Mousavi A, Sowlat MH, & Sioutas C (2018). Diurnal and seasonal trends and source apportionment of redox-active metals in Los Angeles using a novel online metal monitor and Positive Matrix Factorization (PMF). Atmospheric Environment, 174, 15–24. 10.1016/j.atmosenv.2017.11.034 [DOI] [Google Scholar]
- Orsini DA, Ma Y, Sullivan A, Sierau B, Baumann K, & Weber RJ (2003). Refinements to the particle-into-liquid sampler (PILS) for ground and airborne measurements of water soluble aerosol composition. Atmospheric Environment, 37(9–10), 1243–1259. 10.1016/S1352-2310(02)01015-4 [DOI] [Google Scholar]
- Park SS, Ko JM, & Cho SY (2011). Investigation of possible sources of water-soluble organic carbon particles observed with an online monitoring system. Atmospheric Environment, 45(19), 3257–3266. 10.1016/J.ATMOSENV.2011.03.038 [DOI] [Google Scholar]
- Patel K, Bhandari S, Gani S, Campmier MJ, Kumar P, Habib G, Apte J, & Hildebrandt Ruiz L (2021). Sources and Dynamics of Submicron Aerosol during the Autumn Onset of the Air Pollution Season in Delhi, India. ACS Earth and Space Chemistry, 5(1), 118–128. 10.1021/acsearthspacechem.0c00340 [DOI] [Google Scholar]
- Polidori A, Arhami M, Sioutas C, Delfino RJ, & Allen R (2007). Indoor/outdoor relationships, trends, and carbonaceous content of fine particulate matter in retirement homes of the Los Angeles basin. Journal of the Air and Waste Management Association, 57(3), 366–379. 10.1080/10473289.2007.10465339 [DOI] [PubMed] [Google Scholar]
- Radulovic LL, & Wojcinski ZW (2014). PTFE (Polytetrafluoroethylene; Teflon®). Encyclopedia of Toxicology: Third Edition, 1133–1136. 10.1016/B978-0-12-386454-3.00970-2 [DOI] [Google Scholar]
- Rastogi N, Patel A, Singh A, & Singh D (2015). Diurnal variability in secondary organic aerosol formation over the indo-gangetic plain during winter using online measurement of water-soluble organic carbon. Aerosol and Air Quality Research, 15(6), 2225–2231. 10.4209/aaqr.2015.02.0097 [DOI] [Google Scholar]
- Robinson AL, Donahue NM, Shrivastava MK, Weitkamp EA, Sage AM, Grieshop AP, Lane TE, Pierce JR, & Pandis SN (2007). Rethinking organic aerosols: Semivolatile emissions and photochemical aging. Science, 315(5816), 1259–1262. 10.1126/science.1133061 [DOI] [PubMed] [Google Scholar]
- Saarikoski S, Timonen H, Saarnio K, Aurela M, J̈rvi L, Keronen P, Kerminen VM, & Hillamo R (2008). Sources of organic carbon in fine particulate matter in northern European urban air. Atmospheric Chemistry and Physics, 8(20), 6281–6295. 10.5194/acp-8-6281-2008 [DOI] [Google Scholar]
- Saffari A, Daher N, Shafer MM, Schauer JJ, & Sioutas C (2014). Seasonal and spatial variation in dithiothreitol (DTT) activity of quasi-ultrafine particles in the Los Angeles Basin and its association with chemical species. Journal of Environmental Science and Health - Part A Toxic/Hazardous Substances and Environmental Engineering, 49(4), 441–451. 10.1080/10934529.2014.854677 [DOI] [PubMed] [Google Scholar]
- Saffari A, Hasheminassab S, Shafer MM, Schauer JJ, Chatila TA, & Sioutas C (2016). Nighttime aqueous-phase secondary organic aerosols in Los Angeles and its implication for fine particulate matter composition and oxidative potential. Atmospheric Environment, 133, 112–122. 10.1016/j.atmosenv.2016.03.022 [DOI] [Google Scholar]
- Sannigrahi P, Sullivan AP, Weber RJ, & Ingall ED (2006). Characterization of water-soluble organic carbon in urban atmospheric aerosols using solid-state13C NMR spectroscopy. Environmental Science and Technology, 40(3), 666–672. 10.1021/es051150i [DOI] [PubMed] [Google Scholar]
- Sathaye N, Harley R, & Madanat S (2010). Unintended environmental impacts of nighttime freight logistics activities. Transportation Research Part A: Policy and Practice, 44(8), 642–659. 10.1016/j.tra.2010.04.005 [DOI] [Google Scholar]
- Sciare J, D’Argouges O, Sarda-Estève R, Gaimoz C, Dolgorouky C, Bonnaire N, Favez O, Bonsang B, & Gros V (2011). Large contribution of water-insoluble secondary organic aerosols in the region of Paris (France) during wintertime. Journal of Geophysical Research: Atmospheres, 116(D22), 22203. 10.1029/2011JD015756 [DOI] [Google Scholar]
- Soleimanian E, Mousavi A, Taghvaee S, Shafer MM, & Sioutas C (2020). Impact of secondary and primary particulate matter (PM) sources on the enhanced light absorption by brown carbon (BrC) particles in central Los Angeles. Science of the Total Environment, 705, 135902. 10.1016/j.scitotenv.2019.135902 [DOI] [PubMed] [Google Scholar]
- Soleimanian E, Mousavi A, Taghvaee S, Sowlat MH, Hasheminassab S, Polidori A, & Sioutas C (2019). Spatial trends and sources of PM2.5 organic carbon volatility fractions (OCx) across the Los Angeles Basin. Atmospheric Environment, 209, 201–211. 10.1016/j.atmosenv.2019.04.027 [DOI] [Google Scholar]
- Sowlat MH, Wang D, Simonetti G, Shafer MM, Schauer JJ, & Sioutas C (2016). Development and field evaluation of an online monitor for near-continuous measurement of iron, manganese, and chromium in coarse airborne particulate matter (PM). Aerosol Science and Technology, 50(12), 1306–1319. 10.1080/02786826.2016.1221051 [DOI] [Google Scholar]
- Sullivan AP, Peltier RE, Brock CA, de Gouw JA, Holloway JS, Warneke C, Wollny AG, & Weber RJ (2006a). Airborne measurements of carbonaceous aerosol soluble in water over northeastern United States: Method development and an investigation into water-soluble organic carbon sources. Journal of Geophysical Research: Atmospheres, 111(D23). 10.1029/2006jd007072 [DOI] [Google Scholar]
- Sullivan AP, & Weber RJ (2006b). Chemical characterization of the ambient organic aerosol soluble in water: 2. Isolation of acid, neutral, and basic fractions by modified size-exclusion chromatography. Journal of Geophysical Research Atmospheres, 111(5), 1–19. 10.1029/2005JD00648620411040 [DOI] [Google Scholar]
- Sullivan AP, Weber RJ, Clements AL, Turner JR, Bae MS, & Schauer JJ (2004). A method for on-line measurement of water-soluble organic carbon in ambient aerosol particles: Results from an urban site. Geophysical Research Letters, 31(13). 10.1029/2004GL019681 [DOI] [Google Scholar]
- Sun YL, Wang ZF, Du W, Zhang Q, Wang QQ, Fu PQ, Pan XL, Li J, Jayne J, & Worsnop DR (2015). Long-term real-time measurements of aerosol particle composition in Beijing, China: Seasonal variations, meteorological effects, and source analysis. Atmospheric Chemistry and Physics, 15(17), 10149–10165. 10.5194/acp-15-10149-2015 [DOI] [Google Scholar]
- Tang X, Zhang X, Wang Z, & Ci Z (2016). Water-soluble organic carbon (WSOC) and its temperature-resolved carbon fractions in atmospheric aerosols in Beijing. Atmospheric Research, 181, 200–210. 10.1016/j.atmosres.2016.06.019 [DOI] [Google Scholar]
- Tao J, Zhang Z, Zhang L, Li J, Wu Y, Pei C, & Nie F (2022). Quantifying the relative contributions of aqueous phase and photochemical processes to water-soluble organic carbon formation in winter in a megacity of South China. Chemosphere, 300, 134598. 10.1016/J.CHEMOSPHERE.2022.134598 [DOI] [PubMed] [Google Scholar]
- Timonen H, Aurela M, Carbone S, Saarnio K, Saarikoski S, Mäkelä T, Kulmala M, Kerminen VM, Worsnop DR, & Hillamo R (2010). High time-resolution chemical characterization of the water-soluble fraction of ambient aerosols with PILS-TOC-IC and AMS. Atmospheric Measurement Techniques, 3(4), 1063–1074. 10.5194/amt-3-1063-2010 [DOI] [Google Scholar]
- Timonen H, Carbone S, Aurela M, Saarnio K, Saarikoski S, Ng NL, Canagaratna MR, Kulmala M, Kerminen V, Worsnop DR, & Hillamo R (2013). Characteristics, sources and water-solubility of ambient submicron organic aerosol in springtime in Helsinki, Finland. Journal of Aerosol Science, 56, 61–77. 10.1016/j.jaerosci.2012.06.005 [DOI] [Google Scholar]
- Tohidi R, Altuwayjiri A, & Sioutas C (2022). Investigation of organic carbon profiles and sources of coarse PM in Los Angeles. Environmental Pollution, 314, 120264. 10.1016/j.envpol.2022.120264 [DOI] [PubMed] [Google Scholar]
- Turpin BJ, & Huntzicker JJ (1995). Identification of secondary organic aerosol episodes and quantitation of primary and secondary organic aerosol concentrations during SCAQS. Atmospheric Environment, 29(23), 3527–3544. 10.1016/1352-2310(94)00276-Q [DOI] [Google Scholar]
- Turpin BJ, Saxena P, & Andrews E (2000). Measuring and simulating particulate organics in the atmosphere: Problems and prospects. Atmospheric Environment, 34(18), 2983–3013. 10.1016/S1352-2310(99)00501-4 [DOI] [Google Scholar]
- Urbansky ET (2001). Total organic carbon analyzers as tools for measuring carbonaceous matter in natural waters This is the work of a United States government employee engaged in his official duties. As such it is in the public domain and exempt from copyright. ©US government. Journal of Environmental Monitoring, 3(1), 102–112. 10.1039/B006564L [DOI] [PubMed] [Google Scholar]
- US EPA. (2022). Air Quality System (AQS) API. https://aqs.epa.gov/aqsweb/documents/data_api.html
- Van Pinxteren D, Brüggemann E, Gnauk T, Iinuma Y, Müller K, Nowak A, Achtert P, Wiedensohler A, & Herrmann H (2009). Size- and time-resolved chemical particle characterization during carebeijing-2006: Different pollution regimes and diurnal profiles. Journal of Geophysical Research Atmospheres, 114(9). 10.1029/2008JD010890 [DOI] [Google Scholar]
- Verma V, Rico-Martinez R, Kotra N, King L, Liu J, Snell TW, & Weber RJ (2012). Contribution of water-soluble and insoluble components and their hydrophobic/hydrophilic subfractions to the reactive oxygen species-generating potential of fine ambient aerosols. Environmental Science and Technology, 46(20), 11384–11392. 10.1021/es302484r [DOI] [PubMed] [Google Scholar]
- Wang D, Kam W, Cheung K, Pakbin P, & Sioutas C (2013a). Development of a two-stage virtual impactor system for high concentration enrichment of ultrafine, pm2.5, and coarse particulate matter. Aerosol Science and Technology, 47(3), 231–238. 10.1080/02786826.2012.744446 [DOI] [Google Scholar]
- Wang D, Pakbin P, Saffari A, Shafer MM, Schauer JJ, & Sioutas C (2013b). Development and evaluation of a high-volume aerosol-into-liquid collector for fine and ultrafine particulate matter. Aerosol Science and Technology, 47(11), 1226–1238. 10.1080/02786826.2013.830693 [DOI] [Google Scholar]
- Wang D, Shafer MM, Schauer JJ, & Sioutas C (2015). A new technique for online measurement of total and water-soluble copper (Cu) in coarse particulate matter (PM). Environmental Pollution, 199, 227–234. 10.1016/j.envpol.2015.02.006 [DOI] [PubMed] [Google Scholar]
- Ware J, Kort EA, DeCola P, & Duren R (2016). Aerosol lidar observations of atmospheric mixing in Los Angeles: Climatology and implications for greenhouse gas observations. Journal of Geophysical Research, 121(16), 9862–9878. 10.1002/2016JD024953 [DOI] [PMC free article] [PubMed] [Google Scholar]
- Weber RJ, Sullivan AP, Peltier RE, Russell A, Yan B, Zheng M, de Grouw J, Warneke C, Brock C, Holloway JS, Atlas EL, & Edgerton E (2007). A study of secondary organic aerosol formation in the anthropogenic-influenced southeastern United States. Journal of Geophysical Research: Atmospheres, 112(D13), 13302. 10.1029/2007JD008408 [DOI] [Google Scholar]
- Willers SM, Eriksson C, Gidhagen L, Nilsson ME, Pershagen G, & Bellander T (2013). Fine and coarse particulate air pollution in relation to respiratory health in Sweden. European Respiratory Journal, 42(4), 924–934. 10.1183/09031936.00088212 [DOI] [PubMed] [Google Scholar]
- Xiang P, Zhou X, Duan J, Tan J, He K, Yuan C, Ma Y, & Zhang Y (2017). Chemical characteristics of water-soluble organic compounds (WSOC) in PM2.5 in Beijing, China: 2011–2012. Atmospheric Research, 183, 104–112. 10.1016/j.atmosres.2016.08.020 [DOI] [Google Scholar]
- Xing YF, Xu YH, Shi MH, & Lian YX (2016). The impact of PM2.5 on the human respiratory system. Journal of Thoracic Disease, 8(1), E69–E74. 10.3978/j.issn.2072-1439.2016.01.19 [DOI] [PMC free article] [PubMed] [Google Scholar]
- Zhang X, Liu J, Parker ET, Hayes PL, Jimenez JL, De Gouw JA, Flynn JH, Grossberg N, Lefer BL, & Weber RJ (2012a). On the gas-particle partitioning of soluble organic aerosol in two urban atmospheres with contrasting emissions: 1. Bulk water-soluble organic carbon. Journal of Geophysical Research Atmospheres, 117(17). 10.1029/2012JD017908 [DOI] [Google Scholar]
- Zhang X, Liu Z, Hecobian A, Zheng M, Frank NH, Edgerton ES, & Weber RJ (2012b). Spatial and seasonal variations of fine particle water-soluble organic carbon (WSOC) over the southeastern United States: Implications for secondary organic aerosol formation. Atmospheric Chemistry and Physics, 12(14), 6593–6607. 10.5194/acp-12-6593-2012 [DOI] [Google Scholar]
- Zhang Y, Schauer JJ, Shafer MM, Hannigan MP, & Dutton SJ (2008). Source apportionment of in vitro reactive oxygen species bioassay activity from atmospheric particulate matter. Environmental Science and Technology, 42(19), 7502–7509. 10.1021/es800126y [DOI] [PubMed] [Google Scholar]