

Abstract
The present study investigated the localization and the adenosine 5′-triphosphate (ATP)-degrading function of the plasma membrane-bound ecto-nucleotidase, ectonucleoside triphosphate diphosphohydrolase 2 (NTPDase2), in the rat adrenal medulla. The effect of ATP degradation product, adenosine 5′-diphosphate (ADP), on carbachol (CCh)-induced intracellular Ca2+ ([Ca2+]i) responses in adrenal chromaffin cells was examined using calcium imaging. NTPDase2-immunoreactive cells were distributed between chromaffin cells. NTPDase2-immunoreactive cells were immunoreactive for glial fibrillary acidic protein and S100B, suggesting that they were sustentacular cells. NTPDase2-immunoreactive cells surrounded chromaffin cells immunoreactive for vesicular nucleotide transporter and P2Y12 ADP-selective purinoceptors. In ATP bioluminescence assays using adrenal medullary slices, ATP was rapidly degraded and its degradation was attenuated by the NTPDase inhibitors sodium polyoxotungstate (POM-1) and 6-N, N-diethyl-d-β,γ-dibromomethylene ATP (ARL67156). ADP inhibited CCh-induced [Ca2+]i increases of chromaffin cells in adrenal medullary slices. The inhibition of CCh-induced [Ca2+]i increases by ADP was blocked by the P2Y12 purinoceptor antagonist AZD1283. CCh-induced [Ca2+]i increases were also inhibited by the P2Y1, P2Y12, and P2Y13 purinoceptor agonist 2-methylthioadenosine diphosphate trisodium (2MeSADP), in combination with the P2Y1 purinoceptor antagonist MRS2179. These results suggest that sustentacular cells express NTPDase2 to degrade ATP released from adrenal chromaffin cells, and ADP modulates the excitability of chromaffin cells via P2Y12 purinoceptors to regulate catecholamine release during preganglionic sympathetic stimuli. (J Histochem Cytochem 72: 41–60, 2024)
Keywords: adrenal medulla, ATP, NTPDase2, P2Y12 purinoceptor, sustentacular cells
Introduction
The adrenal medulla is an endocrine organ that secretes catecholamines, such as adrenaline (A) and noradrenaline (NA), which mediate responses to physiological and emotional stressors. It is composed of catecholaminergic chromaffin cells, including A-synthesizing cells (A-cells) and NA-synthesizing cells (NA-cells), and sustentacular cells (support or satellite cells) located between chromaffin cells. 1 Immunohistochemically, sustentacular cells express glial cell markers such as glial fibrillary acidic protein (GFAP) and S100.2 –4 Acetylcholine (ACh) released from the preganglionic sympathetic nerve terminals of the splanchnic nerve activates nicotinic ACh receptors of chromaffin cells to trigger membrane depolarization and increase intracellular Ca2+ ([Ca2+]i), leading to an exocytosis of catecholamines into circulation.5 –7 Adenosine 5′-triphosphate (ATP) is released by exocytosis together with catecholamines from chromaffin cells, and may locally modulate the function of these cells. 8 However, the function of sustentacular cells in the adrenal medulla remains unknown.
In addition to ATP, extracellular adenosine 5′-diphosphate (ADP) has also been reported to modulate the function of endocrine and sympathetic nervous systems, such as pituitary lactotrophs, 9 pancreatic beta cells, 10 and postganglionic sympathetic neurons in the superior cervical ganglion. 11 These findings suggest that ADP also plays a local modulatory role in adrenal medulla function. Extracellular ADP is produced by the rapid degradation of ATP by ectonucleoside triphosphate diphosphohydrolases (NTPDases, EC 3.6.1.5). NTPDases consist of eight members, of which NTPDase1, 2, 3, and 8 are the plasma membrane-bound ectoenzymes that hydrolyze extracellular nucleotide tri- and/or di-phosphates.12,13 Of these four members, NTPDase2 (CD39L1 or ecto-ATPase) preferentially dephosphorylates extracellular ATP to ADP. Therefore, NTPDase2 may be expressed to hydrolyze ATP released from chromaffin cells to ADP in the adrenal medulla. On the other hand, ADP selectively binds to Gq/11 protein-coupled P2Y1 purinoceptors, and Gi protein-coupled P2Y12 and P2Y13 purinoceptors. 14 Reverse transcriptase-polymerase chain reaction (RT-PCR) has revealed the expression of mRNAs for P2Y purinoceptor subtypes including P2Y1, P2Y12, and P2Y13 in the rat adrenal medulla. 15 Electrophysiological studies have revealed that P2Y12 purinoceptors are involved in the inhibition of exocytosis in cultured bovine chromaffin cells.16,17 These findings suggest that the excitability of chromaffin cells induced by ACh receptor activation is modulated via P2Y purinoceptors by ADP, a breakdown product of ATP released from these cells in the adrenal medulla.
The present study investigated the localization and ATP-degrading function of NTPDase2 in the rat adrenal medulla using immunohistochemistry and ATP bioluminescence assay. Multilabeling immunofluorescence was also performed to elucidate the interrelationship between immunoreactivities for NTPDase2, P2Y12 purinoceptors, and vesicular nucleotide transporter (VNUT), a vesicle-loading protein for exocytosis of ATP. Furthermore, we examined [Ca2+]i changes in chromaffin cells following the application of the non-selective ACh receptor agonist carbachol (CCh) and agonists or antagonists of P2Y purinoceptors to determine the modulatory effects of ADP on these cells.
Materials and Methods
Animal Procedures
The present study used male Wistar rats (8–10 weeks old; total n=83) purchased from Japan SLC (Hamamatsu, Japan). Animal experimental procedures were approved by the Iwate Medical University Institutional Animal Care and Use Committee (accession number 30-026). All animal experiments were performed at the Department of Anatomy (Cell Biology) in Iwate Medical University. Rats were maintained under controlled environmental conditions (room temperature, 24 ± 0.5C; relative humidity, 50 ± 10%; light/dark cycle, 12/12 hr) and were fed ad libitum ultrafiltrated water and a pellet diet (MF; Oriental Yeast, Tokyo, Japan).
Immunohistochemistry
Details of the antibodies and their combinations are tabulated in Tables 1–3.
Table 1.
Primary Antibodies Used in the Present Study.
| No. | Antibody Against | Immunogen | Manufacturer; Host; Catalog Number; RRID | Dilution |
|---|---|---|---|---|
| 1 | NTPDase2 | 26-462 amino acid sequence of CHO-derived recombinant mouse CD39L1/NTPDase2 | R&D Systems (Minneapolis, MN); sheep polyclonal antibody; AF5797; AB_10572702 | 1:500 |
| 2 | DBH | Purified bovine adrenal DBH | Merck Millipore (Billerica, MA); mouse monoclonal antibody; MAB308; AB_2245740 | 1:5000 |
| 3 | VMAT2 | Synthetic peptide, 196-515 amino acid sequence of rat VMAT2 coupled to carrier protein | Immunostar (Hudson, WI); rabbit polyclonal antibody; 20042; AB_10013884 | 1:2000 |
| 4 | GFAP | GFAP isolated from cow spinal cord | DAKO Cytomation (Glostrup, Denmark); rabbit polyclonal antibody; Z0334; AB_10013382 | 1:100 |
| 5 | S100B | Purified bovine brain S100B | Sigma-Aldrich (Saint Louis, MO); mouse monoclonal antibody; S2532; AB_477499 | 1:1000 |
| 6 | VNUT | Synthetic peptide (SQKVQESERAFTY), 155-167 amino acid sequences of mouse VNUT | Merck Millipore; guinea pig polyclonal antibody; ABN83; AB_2868445 | 1:1000 |
| 7 | P2Y12 ATP receptor | Recombinant protein corresponding to 303-342 amino acid sequence of human P2Y12 | Novus Biologicals (Littleton, CO); rabbit polyclonal antibody; NBP2-33870; AB_2810254 | 1:200 |
The antibody numbers in this table are also used in Table 3.
Abbreviations: NTPDase2, ectonucleoside triphosphate diphosphohydrolase 2; CHO, Chinese hamster ovary cell line; DBH, dopamine beta-hydroxylase; VMAT2, vesicular monoamine transporter 2; GFAP, glial fibrillary acidic protein; VNUT, vesicular nucleotide transporter; ATP, adenosine 5′-triphosphate; RRID, research resource identifier.
Table 3.
Combinations of Antibodies for Immunofluorescence.
| Combination | Primary Antibody 1 | Secondary Antibody 1 | Primary Antibody 2 | Secondary Antibody 2 | Primary Antibody 3 | Secondary Antibody 3 | Figure |
|---|---|---|---|---|---|---|---|
| NTPDase2/DBH | 1 | a | 2 | b | — | — | Fig. 1A and B |
| NTPDase2/VMAT2/DBH | 1 | a | 3 | c | 2 | e | Fig. 1C and D |
| NTPDase2/GFAP | 1 | a | 4 | c | — | — | Fig. 2A–C |
| NTPDase2/S100B | 1 | a | 5 | b | — | — | Fig. 2D–F |
| NTPDase2/GFAP/S100B | 1 | a | 4 | c | 5 | e | Fig. 2G–I |
| NTPDase2/VNUT | 1 | a | 6 | d | — | — | Fig. 5A |
| NTPDase2/P2Y12 | 1 | a | 7 | c | — | — | Fig. 5B |
| NTPDase2/P2Y12/VNUT | 1 | a | 7 | c | 6 | f | Fig. 5C and D |
Table 2.
Secondary Antibodies Used in the Present Study.
| Letter | Antibody Against | Host | Catalog Number | RRID | Dilution |
|---|---|---|---|---|---|
| a | Alexa Fluor 488-labeled anti-sheep IgG | Donkey | 713-545-147 | AB_2340745 | 1:200 |
| b | Cy3-labeled anti-mouse IgG | Donkey | 715-165-151 | AB_2315777 | 1:200 |
| c | Cy3-labeled anti-rabbit IgG | Donkey | 711-165-152 | AB_2307443 | 1:200 |
| d | Cy3-labeled anti-guinea pig IgG | Donkey | 706-165-148 | AB_2340460 | 1:200 |
| e | Alexa Flour 647-labeled anti-mouse IgG | Donkey | 715-605-151 | AB_2340863 | 1:200 |
| f | Alexa Flour 647-labeled anti-guinea pig IgG | Donkey | 706-605-148 | AB_2340476 | 1:200 |
The antibody letters in this table are also used in Table 3. All antibodies are supplied by Jackson ImmunoResearch (West Grove, PA).
Abbreviation: RRID, research resource identifier; IgG, immunoglobulin G.
The procedure for preparing cryosections of adrenal glands was conducted as described in our previous study. 18 Briefly, rats (n=20) were transcardially perfused with Ringer’s solution (200 ml) followed by 4% paraformaldehyde in 0.1 M phosphate buffer (pH 7.4) under deep anesthesia by pentobarbital (150 mg/kg; intraperitoneal injection). The harvested bilateral adrenal glands were immersed in 30% sucrose diluted in phosphate-buffered saline (PBS; pH 7.4) and then cryoembedded. Frozen sections (10 µm thickness) were prepared by sectioning frozen tissues and mounted on chrome-alum/gelatin-coated glass slides.
Sections were labeled by indirect multilabeling immunofluorescence. Sections were incubated with non-immune donkey serum (1:50 dilution, S30; Merck Millipore, Billerica, MA) diluted with PBS containing 0.5% Triton X-100 (PBS-T, pH 7.4) at room temperature for 30 min. Subsequently, they were incubated with primary antibodies at 4C for 12 hr. PBS-T was used as a diluent to penetrate antibodies. The present study used the following antibodies: anti-NTPDase2 (R&D Systems, Minneapolis, MN, AB_10572702), anti-dopamine beta-hydroxylase (anti-DBH; Merck Millipore, AB_2245740), anti-vesicular monoamine transporter 2 (anti-VMAT2; Immunostar, Hudson, WI, AB_10013884), anti-GFAP (DAKO Cytomation, Glostrup, Denmark, AB_10013382), anti-S100B (Sigma-Aldrich, Saint Louis, MO, AB_477499), anti-VNUT (Merck Millipore, AB_2868445), and anti-P2Y12 purinoceptor (Novus Biologicals, Littleton, CO, AB_2810254). Anti-DBH antibody was used as a marker of adrenal chromaffin cells. Immunoreactivity for VMAT2 has been observed in adrenal chromaffin cells without immunoreactivity for the rate-limiting enzyme for A, phenylethanolamine N-methyltransferase, 19 and thus was used as a marker of NA-cells in the present study. Antibodies for GFAP and S100B have been used as markers of sustentacular cells in the rat adrenal medulla.2 –4 VNUT, which uptakes ATP into secretory vesicles for exocytosis, has been localized to adrenal chromaffin granule membranes. 20 After washing with PBS, sections were incubated at room temperature for 2 hr with secondary antibodies in 4′,6-diamidino-2-phenylindole (DAPI) solution (1 µg/ml; Dojindo Laboratories, Kumamoto, Japan) for the sake of nuclear labeling. Secondary antibodies were anti-sheep IgG, anti-mouse IgG, anti-rabbit IgG, or anti-guinea pig IgG labeled with Alexa488, Cy3, or Alexa647 (Jackson ImmunoResearch, West Grove, PA). Finally, sections were coverslipped with Fluoromount (Diagnostic Biosystems, Pleasanton, CA).
A preabsorption test of the anti-P2Y12 antibody was performed to characterize its specificity. The antibody for P2Y12 (1:200 dilution) was incubated with a recombinant protein antigen for P2Y12 (0.4 μg/μl; NBP2-33870PEP; Novus Biologicals) at 4C for 12 hr. Thereafter, sections were incubated with the preabsorbed P2Y12 antibody and processed for immunofluorescence as described above. We confirmed the complete abolishment of P2Y12 immunoreactivity in the adrenal medulla when a preabsorbed antibody was used (Appendix Fig. 1).
Figure 1.

Ectonucleoside triphosphate diphosphohydrolase 2 (NTPDase2) immunoreactivity in the rat adrenal glands. Double immunofluorescence for NTPDase2 (green) and dopamine beta-hydroxylase (DBH; red; Panels A and B). A lower magnification image shows immunoreactivity for NTPDase2 in the adrenal medulla containing DBH-immunoreactive chromaffin cells, but not in the adrenal cortex (Co; Panel A). A higher magnification image shows NTPDase2-immunoreactive cells (arrowheads) between DBH-immunoreactive adrenal chromaffin cells. NTPDase2-immunoreactive cells consist of perinuclear cytoplasm with several cytoplasmic processes (Panel B). Triple immunolabeling for NTPDase2 (green), vesicular monoamine transporter 2 (VMAT2; red), and DBH (magenta; Panels C and D). NTPDase2-immunoreactive cells are observed between VMAT2- and DBH-immunoreactive cells, but not between DBH-immunoreactive cells without VMAT2 immunoreactivity (asterisks). Nuclei are labeled by 4′,6-diamidino-2-phenylindole (blue). (“Bars A and B = 100 µm; bar C = 20 µm.”)
Z-stack image series of immunolabeled preparations were captured by a confocal scanning laser microscope (A1R; Nikon, Tokyo, Japan). Projection images were created from z-stacks of confocal images (1–3 series at 1 µm intervals) using computer software (NIS-Elements; Nikon). Images of Alexa488, Cy3, Alexa647, and DAPI were colored in green, red, magenta, and blue using the same software. All digital images were analyzed by Photoshop CC (Adobe Systems, San José, CA). NIS-Elements software was also used for the analyses of the morphology of NTPDase2-immunoreactive cells and their relationship to DBH- and/or VMAT2-immunoreactive cells.
ATP Bioluminescence Assay
The concentration of exogenously applied ATP remaining after incubation with adrenal medullary slices was measured using luciferin–luciferase assays to investigate the ATP-degrading activity of NTPDases. Rats (n=30) were euthanized by CO2 inhalation. Bilateral adrenal glands were harvested immediately and placed in ice-cold HEPES-buffered Ringer’s solution (HR). HR contained 118 mM NaCl, 4.7 mM KCl, 1.13 mM MgCl2, 1.25 mM CaCl2, 1 mM NaH2PO4, 5.5 mM glucose, 10 mM HEPES, and MEM amino acid solution (GIBCO, Tokyo, Japan), and was adjusted to pH 7.4 with NaOH. After removal of the adrenal cortex, the adrenal medulla was embedded in 4% low-melt agarose (number 161-3113; Bio-Rad, Hercules, CA) dissolved in HR. The whole adrenal medulla was serially sliced at 200 µm thickness using a vibrating microslicer (DTK-1000N; Dosaka EM, Kyoto, Japan) and slices were collected in 0.6 ml Eppendorf tubes containing HR. All slices (5.3 ± 1.1 slices per medulla) from a single adrenal medulla were used as one sample. After replacement with 100 µl of fresh HR, slices were incubated in 100 µl of HR containing the following three drug combinations: (1) 10 µM ATP alone as a substrate for NTPDase, (2) 10 µM ATP in combination with 10 µM sodium polyoxotungstate (POM-1), an NTPDase inhibitor with low selectivity for NTPDase1 and NTPDase2 and high selectivity for NTPDase3 and P2Y12 purinoceptors, and (3) 10 µM ATP in combination with 20 µM 6-N, N-diethyl-d-β,γ-dibromomethylene ATP (ARL67156 or FRL67156), a specific NTPDase inhibitor.21,22 Slices were incubated with each drug combination for 10, 20, 30, or 60 min (five samples per time point) at 37C on a rotary shaker (20 rpm, HB-S; Taitec, Koshigaya, Japan). After incubation, 100 µl of supernatant was collected, transferred to a 96-well plate, and the concentration of residual ATP was measured using a microplate reader (Infinite F500; Tecan, Männedorf, Switzerland) in combination with a CellTiter-Glo 2.0 Assay kit (G9242; Promega, Madison, WI). The concentration of residual ATP in the supernatant was calibrated using standard curves generated from serially diluted ATP products (A2383; Sigma-Aldrich). The concentration of residual ATP was measured in duplicate for all samples. The degraded ATP was expressed as a percentage of exogenous ATP (10 µM) minus the concentration of residual ATP. The drugs ATP disodium salt hydrate (A2383; Sigma-Aldrich), POM-1 (2689; Tocris Bioscience, Ellisville, MO), and ARL67156 trisodium salt (1283; Tocris Bioscience) were dissolved in distilled water. Each solution was diluted to the desired final concentration in HR.
Intracellular Calcium Imaging
Rats (n=30) were euthanized by CO2 inhalation and adrenal glands were immediately removed. After the removal of the adrenal cortex, the adrenal medulla was embedded in 4% low-melt agarose dissolved in HR. The adrenal medulla was serially sliced at 100 µm thickness using a vibrating microslicer. Slices were loaded for 60 min at 37C with a green-fluorescent Ca2+ indicator, 10 µM Fluo-4 AM (F311; Dojindo Laboratories), 100 U/ml highly purified collagenase (CL103; Elastin Products, Owensville, MO), and 0.02% Cremophor-EL (Nacalai Tesque, Kyoto, Japan) diluted in HR. Slices were then attached to 30-mm round coverslips coated with Cell-Tak (354241; Corning Life Sciences, Corning, NY) and placed in a Sykus-Moor perfusion chamber (1 ml volume) on the stage of a confocal scanning laser microscope (A1R, Nikon). Slices were continuously perfused with HR at a constant flow rate of 1 ml/min. Fluo-4 fluorescent confocal images (512 × 512 pixels) were captured every 3 sec with 40× objective lens (CFI apochromat Lambda S 40XC WI, Nikon) and analyzed with NIS-Elements software (Nikon). In some experiments, fluorescent intensities were displayed as pseudocolor images (Fig. 5A–C). In the present study, adrenal chromaffin cells were defined as spherical or oval cells responding to the non-selective ACh receptor agonist CCh and their time course of [Ca2+]i was analyzed by assigning a region of interest. The drugs CCh (036-09841; Wako, Osaka, Japan), ADP (V916A; Promega), ATP disodium salt hydrate (A2383; Sigma-Aldrich), 2-methylthioadenosine diphosphate trisodium salt (2MeSADP; 1624; R&D Systems), and MRS2179 (ab120414; Abcam, Cambridge, UK) were dissolved in distilled water. AZD1283 (SML2080; Sigma-Aldrich) was dissolved in dimethyl sulfoxide. Each solution was diluted to the desired final concentration in HR. The perfusion period of CCh and other drugs was 10 and 70 sec, respectively. We performed preliminary experiments to assess the dose-response relationship and selected the appropriate concentration for each drug.
The intensity of Fluo-4 fluorescence (F) was normalized to the fluorescent intensity of each chromaffin cell at the start of capture (F0). The time course of [Ca2+]i was expressed as the normalized fluorescent intensity (ΔF/F0) calculated as (F − F0)/F0. The [Ca2+]i responses were expressed as the peak ΔF/F0 (maximum response above the fluorescent intensity before response) and the integrated ΔF/F0 response (cumulative area above the fluorescent intensity before response) for each stimulus. Chromaffin cells without spontaneous [Ca2+]i increases at the start of capture and with ΔF/F0 increased >1 above F0 by the initial application of CCh (100 µM) were included in the analysis. Changes in the [Ca2+]i response were defined as a difference of ≥0.5 in peak ΔF/F0 values between the initial application of CCh (100 µM) and the combination of CCh and the drug.
Reverse Transcriptase-Polymerase Chain Reaction
RT-PCR analysis was performed to confirm the mRNA expression of P2Y1, P2Y12, and P2Y13 purinoceptors in the rat adrenal medulla. The procedure for RT-PCR was conducted as described in our previous study. 18 Briefly, rats (n=3) were euthanized by CO2 inhalation and adrenal glands were immediately removed. After the removal of the adrenal cortex, the adrenal medulla was frozen in liquid nitrogen. Total RNA from the tissue was extracted using a magnetic bead method (MagExtractor; TOYOBO, Osaka, Japan). RT-PCR was performed using a QIAGEN One Step RT-PCR Kit (Qiagen, Tokyo, Japan) with gene-specific primers for P2Y1, P2Y12, P2Y13, and β-actin as an internal control. Details of the primers used in this study are shown in Table 4. Reverse transcription was performed for 30 min at 50C, and the initial PCR activation was incubated for 15 min at 95C. Following reverse transcription, PCR amplification was performed 35 times as follows: 30 sec at 94C for denaturation, 30 sec at 60C for annealing, and 1 min at 72C for extension. After PCR amplification, a final extension was performed for 10 min at 72C. PCR end products were visualized on 2% agarose gels using ethidium bromide. The mRNA templates were omitted for negative controls.
Table 4.
Primers for RT-PCR.
| mRNA | Primer Sequences | Position | Product Length (bp) |
|---|---|---|---|
| (Accession Number) | |||
| P2Y1 | 5′-AGTTCAAGCAGAACGGAGACA-3′ (sense) | 1731-1751 | 433 |
| (NM_012800) | 5′-CTCAGTGGTCACATCACGGTT-3′ (antisense) | 2143-2163 | |
| P2Y12 | 5′-CAGCAATCTTTTGGGTGCGAA-3′ (sense) | 546-566 | 295 |
| (NM_022800) | 5′-CCTTTTCTTGGGAGCTTTGGC-3′ (antisense) | 820-840 | |
| P2Y13 | 5′-TCGTCGTACCGTTTAGGAAAACT-3′ (sense) | 383-405 | 260 |
| (NM_001002853) | 5′-GGCAATCACCGTGTAAAACAGAA-3′ (antisense) | 620-642 | |
| β-actin | 5′-TACAACCTTCTTGCAGCTCCTC-3′ (sense) | 25-46 | 276 |
| (NM_031144) | 5′-GCCGTGTTCAATGGGGTACT-3′ (antisense) | 281-300 |
Abbreviation: RT-PCR, reverse transcriptase-polymerase chain reaction.
Statistical Analysis
Data were presented as the average ± standard error. Statistical analyses were performed using EZR software (v3.6.3). For the ATP bioluminescence assay, the percentages of degraded ATP in three experimental groups at the same incubation time were statistically analyzed using the Mann–Whitney U test. For the intracellular calcium imaging, the peak and integrated ΔF/F0 were statistically analyzed by one-way ANOVA and the Kruskal–Wallis test, respectively. Bonferroni corrections were used as post hoc analyses. Results were considered to be significant at p<0.05.
Results
NTPDase2 Immunoreactivity in Rat Adrenal Glands
A lower magnification view of rat adrenal glands double-immunolabeled with NTPDase2 and DBH showed NTPDase2 immunoreactivity in the medullary area composing DBH-immunoreactive chromaffin cells, but not in the cortex area without DBH immunoreactivity (Fig. 1A). At a higher magnification, NTPDase2-immunoreactive cells were collocated with the cell bodies of DBH-immunoreactive chromaffin cells (Fig. 1B). NTPDase2-immunoreactive cells consisted of a perinuclear region with an oval nucleus (8.0 ± 0.2 µm in diameter, 44 cells) and 2-5 slender cytoplasmic processes. No NTPDase2 immunoreactivity was detected in DBH-immunoreactive chromaffin cells or vascular endothelial cells in the adrenal medulla. Triple immunolabeling for NTPDase2, VMAT2, and DBH showed that NTPDase2-immunoreactive cells appeared to surround VMAT2-immunopositive cells with DBH immunoreactivity more than VMAT2-immunonegative cells with DBH immunoreactivity (Fig. 1C and D). Among DBH-immunoreactive adrenal chromaffin cells, 71.8% (3135/4364 cells) were VMAT2-immunopositive and 28.2% (1229/4364 cells) were VMAT2-immunonegative (nine sections, n=3). The percentages of these cells were similar to that of NA-cells and A-cells reported in the rat adrenal medulla. 23 In addition, 98.1% (1206/1229 cells) of VMAT2-immunopositive cells and 81.5% (2566/3135 cells) of VMAT2-immunonegative cells were attached to NTPDase2-immunoreactive cells.
In sections stained by double immunofluorescence for NTPDase2 and GFAP, filamentous immunoreactivity for GFAP was localized in the perinuclear cytoplasm and their cytoplasmic processes in NTPDase2-immunoreactive cells (Fig. 2A–C). Double immunofluorescence for NTPDase2 and S100B showed S100B immunoreactivity in the perinuclear cytoplasm and their cytoplasmic processes in NTPDase2-immunoreactive cells (Fig. 2D–F). Triple immunolabeling for NTPDase2, GFAP, and S100B confirmed that NTPDase2-immunoreactive cells were immunoreactive for GFAP and S100B (Fig. 2G–I).
Figure 2.

Double or triple immunofluorescence for ectonucleoside triphosphate diphosphohydrolase 2 (NTPDase2) with glial fibrillary acidic protein (GFAP) and/or S100B. Double immunofluorescence for NTPDase2 (green) and GFAP (red; Panels A–C). Immunoreactivity for NTPDase2 in GFAP-immunoreactive sustentacular cells. Double immunofluorescence for NTPDase2 (green) and S100B (red; Panels D–F). Immunoreactivity for NTPDase2 in sustentacular cells immunoreactive for S100B. Triple immunolabeling for NTPDase2 (green), GFAP (red), and S100B (magenta; Panels G–I). NTPDase2-immunoreactive cells are immunoreactive for both GFAP and S100B. Nuclei are labeled by 4′,6-diamidino-2-phenylindole (blue). (“Bar A = 10 µm; bars D and G = 5 µm.”)
Double immunofluorescence for NTPDase2 and VNUT showed that NTPDase2-immunoreactive cells were associated with chromaffin cells immunoreactive for VNUT (Fig. 3A). The cell body and slender cytoplasmic processes of NTPDase2-immunoreactive cells were observed between clusters of VNUT-immunoreactive chromaffin cells. Almost all chromaffin cells exhibited VNUT immunoreactivity in their perinuclear cytoplasm, and the VNUT-immunoreactive pattern was consistent with mouse adrenal chromaffin cells. 24 No VNUT immunoreactivity was detected in the adrenal cortex. In sections double-immunolabeled by NTPDase2 and P2Y12, P2Y12 immunoreactivity was detected in the medullary area containing NTPDase2-immunoreactive cells, but not in the adrenal cortex area (Fig. 3B). In the adrenal medulla, P2Y12-immunoreactive punctate products were observed in NTPDase2-immunonegative medullary cells, but not in NTPDase2-immunopositive cells or vascular endothelial cells. P2Y12 immunoreactivity appeared to outline medullary cells, demonstrating the localization of the receptor in the plasma membrane. The outline of medullary cells lacking P2Y12 immunoreactivity faced vascular sinusoids or the cortical medullary border. Triple immunolabeling for NTPDase2, P2Y12, and VNUT showed that P2Y12-immunoreactive products were localized in the margin of VNUT-immunoreactive chromaffin cells, and that these cells were intimately surrounded by NTPDase2-immunoreactive cells at their cell body and cytoplasmic processes (Fig. 3C and D).
Figure 3.

Double or triple immunofluorescence for ectonucleoside triphosphate diphosphohydrolase 2 (NTPDase2) with vesicular nucleotide transporter (VNUT) and/or P2Y12. Double immunofluorescence for NTPDase2 (green) and VNUT (red; Panel A). NTPDase2-immunoreactive cells (arrowheads) are distributed between VNUT-immunoreactive adrenal chromaffin cells. No immunoreactivities for NTPDase2 and VNUT are detected in the adrenal cortex (Co). Double immunofluorescence for NTPDase2 (green) and P2Y12 (red; Panel B). Punctate immunoreactive products for P2Y12 are distributed in NTPDase2-immunonegative cells, but not in NTPDase2-immunopositive cells (arrowheads). P2Y12 immunoreactivity is not observed in the adrenal Co. Triple immunolabeling for NTPDase2 (green), P2Y12 (red), and VNUT (magenta; Panels C and D). P2Y12-immunoreactive dot-like products are localized in VNUT-immunoreactive chromaffin cells surrounded by NTPDase2-immunoreactive cells. Nuclei are labeled by 4′,6-diamidino-2-phenylindole (blue). (“Bar A = 20 µm; bars B and C = 5 µm.”)
ATP-degrading Activity of NTPDases in Adrenal Medullary Slices
The results of the ATP bioluminescence assay in the three experimental groups are shown in Fig. 4. In the 10 µM ATP alone group, the percentages of ATP degraded after 10, 20, 30, and 60 min of incubation were 70.4 ± 19.3%, 77.7 ± 9.8%, 90.5 ± 8.2%, and 95.2 ± 1.6%, respectively. In the group of 10 µM ATP combined with the NTPDase inhibitor with minor selectivity for NTPDase2, 10 µM POM-1, the percentages of ATP degraded after 10, 20, 30, and 60 min of incubation were 33.6 ± 9.9%, 59.7 ± 14.3%, 72.7 ± 17.0%, and 87.9 ± 5.8%, respectively. The percentage of ATP degradation after 10 and 20 min of incubation for 10 µM ATP plus 10 µM POM-1 was significantly lower than those after the corresponding incubation periods for the 10 µM ATP alone group (p<0.05 at 10 and 20 min). However, no significant differences were observed in the percentage of ATP degraded after 30 and 60 min of incubation between the 10 µM ATP alone group and the 10 µM ATP plus 10 µM POM-1 group (p>0.05). In the group of 10 µM ATP in combination with the specific NTPDase inhibitor, 20 µM ARL67156, the percentages of ATP degraded after each incubation period appeared to be more inhibited than those after the corresponding incubation period of the 10 µM ATP alone group. For the 10 µM ATP plus 20 µM ARL67156 group, the percentages of ATP degradation after 10, 20, 30, and 60 min of incubation were 23.1 ± 9.3%, 29.9 ± 9.1%, 38.9 ± 13.8%, and 57.1 ± 13.9%, respectively. The percentages of ATP degraded after 10, 20, 30, and 60 min of incubation for the 10 µM ATP plus 20 µM ARL67156 group were significantly lower than those after the corresponding incubation periods for the 10 µM ATP alone group (p<0.05 at 10, 20, 30, and 60 min). Although up to 100 µM ARL67156 was added to 10 µM ATP, no significant differences were observed between the percentages of ATP degraded after 30 min incubation between 10 µM ATP plus 20 and 100 µM ARL67156 (data not shown, p>0.05).
Figure 4.
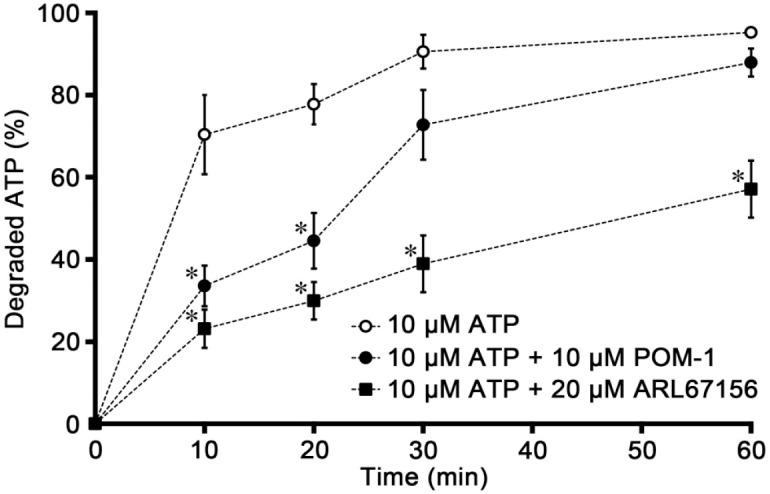
Percentage of adenosine 5′-triphosphate (ATP) degraded in adrenal medullary slices after incubation with ATP alone and combined with ectonucleoside triphosphate diphosphohydrolase 2 inhibitors. In the 10 µM ATP alone group (white circles), the percentage of ATP degraded is rapidly increased from 10 min of incubation. The percentage of ATP degraded is significantly attenuated in the presence of 10 µM sodium polyoxotungstate (POM-1; black circles) at 10 and 20 min of incubation, and in the presence of 20 µM 6-N, N-diethyl-d-β,γ-dibromomethylene ATP (ARL67156; black squares) at all incubation times, respectively. *Significantly different from the value at the same incubation time as when 10 µM ATP alone was applied (p<0.05, Mann–Whitney U test).
Effects of ADP and Agonists/Antagonists of P2Y Purinoceptors on [Ca2+]i Responses
The present study analyzed [Ca2+]i changes in spherical or oval chromaffin cells in adrenal medullary slices (Appendix Fig. 2). Figure 5 shows the representative time course of the CCh-induced [Ca2+]i response in chromaffin cells in the presence of ADP in adrenal medullary slices. The initial perfusion of CCh (100 µM) for 10 sec induced a transient ΔF/F0 increase in chromaffin cells (Fig. 5A, B, D, and E). CCh-induced ΔF/F0 increases appeared to vary in magnitude between individual cells. On the other hand, ADP (100 µM) for 30 sec did not cause any responses in the same cells (Fig. 5D and E). Although up to 1 mM ADP was applied, no ΔF/F0 changes were observed in chromaffin cells (data not shown). However, CCh-induced ΔF/F0 increases were partially or potently inhibited in the presence of ADP (100 µM) in some cells (Fig. 5B–D), but not in others (Fig. 5B, C, and E). A reduction in the peak ΔF/F0 value induced by CCh in the presence of ADP was observed in 67 (43.8%) of 153 cells (n=9). The peak value of the CCh-induced ΔF/F0 response was partially recovered by the last perfusion of CCh (100 µM, Fig. 5D). In rare cases, an enhancement of the peak ΔF/F0 value induced by CCh in the presence of ADP was observed in 4 (2.5%) of 153 cells (data not shown). The peak ΔF/F0 values induced by the first CCh perfusion, CCh in the presence of ADP, and the last CCh perfusion were 3.73 ± 0.13, 2.52 ± 0.14, and 3.24 ± 0.15, respectively (Fig. 5F). The peak ΔF/F0 value induced by CCh combined with ADP was significantly lower than that of the first and last perfusions of CCh (p<0.05). The integrated ΔF/F0 responses induced by the first CCh perfusion, CCh in the presence of ADP, and the last CCh perfusion were 159.57 ± 9.42, 85.42 ± 7.71, and 130.82 ± 8.31, respectively (Fig. 5G). The integrated ΔF/F0 response induced by CCh combined with ADP was significantly lower than that of the first and last perfusions of CCh (p<0.05).
Figure 5.

Effects of adenosine 5′-diphosphate (ADP) on the carbachol (CCh)-induced [Ca2+]i response in chromaffin cells of adrenal medullary slices. Pseudocolor images of the fluorescent change in chromaffin cells at the start of capture (Panel A), during the first CCh perfusion (Panel B), and during the combination of CCh and ADP (Panel C). A scale bar of the fluorescent intensity is shown on the upper right in Panel A. Time courses of the normalized fluorescent intensities (ΔF/F0) of the chromaffin cell response to CCh in the presence of ADP (Panels D and E). The horizontal lines above the recordings indicate the period of drug perfusion. The perfusion periods of CCh and ADP are indicated as red and blue regions, respectively. CCh increases ΔF/F0 in chromaffin cells, and these responses are partially or potently inhibited by ADP in some cells (Panel D) indicated by red-, blue-, and green-colored arrowheads in Panels A–C, but not in others (Panel E) indicated by black-, gray-, and light green-colored arrowheads in Panels A–C. Bar graphs summarize the peak ΔF/F0 values (Panel F) and the integrated ΔF/F0 responses (Panel G) induced by the first CCh perfusion, CCh in the presence of ADP, and the last CCh perfusion. *Significantly different from the first and last perfusions of CCh (p<0.05, one-way ANOVA in Panel F and Kruskal–Wallis test in Panel G). (“Bar A = 20 µm.”)
Figure 6 shows the representative time course of the CCh-induced [Ca2+]i response in chromaffin cells in the presence of ATP. ATP (100 µM) for 30 sec did not cause any responses in chromaffin cells; however, CCh-induced ΔF/F0 increases were partially inhibited in the presence of ATP (100 µM) in some cells (Fig. 6A). On the other hand, other slices showed that CCh-induced ΔF/F0 responses were partially enhanced in some cells, but not in others (Fig. 6B). The reduction or enhancement of the peak ΔF/F0 value induced by CCh in the presence of ATP was observed in 13 (11.6%) or 13 (11.6%) of 112 cells, respectively (n=4). The peak ΔF/F0 values induced by the first CCh perfusion, CCh in the presence of ATP, and the last CCh perfusion were 3.77 ± 0.15, 3.39 ± 0.15, and 3.18 ± 0.16, respectively (Fig. 6C). No significant differences were observed between peak ΔF/F0 values induced by the first CCh perfusion, CCh combined with ATP, and the last CCh perfusion (p>0.05). The integrated ΔF/F0 responses induced by the first CCh perfusion, CCh in the presence of ATP, and the last CCh perfusion were 172.66 ± 12.15, 168.55 ± 17.48, and 152.13 ± 13.46, respectively (Fig. 6D). No significant differences were observed between integrated ΔF/F0 values induced by the first CCh perfusion, CCh combined with ATP, and the last CCh perfusion (p>0.05).
Figure 6.

The carbachol (CCh)-induced [Ca2+]i response in chromaffin cells in the presence of adenosine 5′-triphosphate (ATP). Time courses of ΔF/F0 for the chromaffin cell response to CCh in the presence of ATP in different adrenal medullary slices (Panels A and B). The perfusion periods of CCh and ATP are shown in red and blue regions, respectively. The increase in ΔF/F0 induced by CCh is inhibited by ATP in the cell indicated by a red-colored trace in Panel A, enhanced in the cell indicated by a black-colored trace in Panel B, and unchanged in cells indicated by other color traces in Panels A and B. Bar graphs summarize the peak ΔF/F0 values (Panel C) and the integrated ΔF/F0 responses (Panel D) induced by the first CCh perfusion of the first CCh, CCh in the presence of ATP, and the last CCh perfusion.
The effects of ADP and the selective P2Y12 purinoceptor antagonist AZD1283 on the CCh-induced [Ca2+]i response in chromaffin cells are shown in Fig. 7. ΔF/F0 increases in chromaffin cells induced by the initial perfusion of CCh (100 µM) for 10 sec were slightly inhibited in the presence of ADP (100 µM) combined with AZD1283 (50 µM) in some cells, but not in others (Fig. 7A). On the other hand, CCh-induced ΔF/F0 responses were partially enhanced in some chromaffin cells in other slices (Fig. 7B). The reduction or enhancement of the peak ΔF/F0 value induced by CCh in the presence of ADP and AZD1283 was observed in 12 (9.9%) or 19 (15.7%) of 121 cells, respectively (n=4). The peak ΔF/F0 values induced by the first CCh perfusion, CCh in the presence of ADP and AZD1283, and the last CCh perfusion were 3.79 ± 0.13, 3.84 ± 0.15, and 3.78 ± 0.14, respectively (Fig. 7C). No significant differences were observed between the peak ΔF/F0 values induced by the first CCh perfusion, CCh combined with ADP and AZD1283, and the last CCh perfusion (p>0.05). The integrated ΔF/F0 responses induced by the first CCh perfusion, CCh in the presence of ADP and AZD1283, and the last CCh perfusion were 150.43 ± 8.48, 139.04 ± 8.06, and 137.09 ± 7.86, respectively (Fig. 7D). No significant differences were observed between the integrated ΔF/F0 values induced by the first CCh perfusion, CCh combined with ADP and AZD1283, and the last CCh perfusion (p>0.05). Dimethyl sulfoxide, the vehicle for AZD1283, did not evoke any responses (data not shown).
Figure 7.

The carbachol (CCh)-induced [Ca2+]i response in chromaffin cells in the presence of adenosine 5′-diphosphate (ADP) and AZD1283. Time courses of ΔF/F0 for the chromaffin cell response to CCh in the presence of ADP and the P2Y12 purinoceptor antagonist AZD1283 in different adrenal medullary slices (Panels A and B). The perfusion periods of CCh and ADP together with AZD1283 are shown in red and blue regions, respectively. The increase in ΔF/F0 induced by CCh is inhibited by ADP together with AZD1283 in the cell indicated by a red-colored trace in Panel A, enhanced in the cells indicated by black- and gray-colored traces in Panel B, and unchanged in cells indicated by other color traces in Panels A and B. Bar graphs summarize the peak ΔF/F0 values (Panel C) and the integrated ΔF/F0 responses (Panel D) induced by the first CCh perfusion, CCh in the presence of ADP together with AZD1283, and the last CCh perfusion.
The increased proportion of chromaffin cells in which the CCh-induced [Ca2+]i response is enhanced by ADP and AZD1283 suggests that ADP also enhances cell excitability via other P2Y purinoceptors. We therefore examined the CCh-induced [Ca2+]i responses in chromaffin cells when all ADP-selective purinoceptors were activated using the potent agonist at P2Y1, P2Y12, and P2Y13 purinoceptors, 2MeSADP (Fig. 8). The ΔF/F0 response induced by CCh (100 µM) was partially inhibited in some cells, but not in others (Fig. 8A). On the other hand, the CCh-induced ΔF/F0 response was partially enhanced in some chromaffin cells in the same slices (Fig. 8B). The peak value of the CCh-induced ΔF/F0 response was partially recovered by the last perfusion of CCh (Fig. 8A and B). The reduction or enhancement of the peak ΔF/F0 value induced by CCh in the presence of 2MeSADP was observed in 11 (10.6%) or 4 (3.8%) of 104 cells, respectively (n=5). The peak ΔF/F0 values induced by the first CCh perfusion, CCh in the presence of 2MeSADP, and the last CCh perfusion were 3.55 ± 0.16, 3.48 ± 0.18, and 3.57 ± 0.20, respectively (Fig. 8C). No significant differences were observed between the peak ΔF/F0 values induced by the first CCh perfusion, CCh combined with 2MeSADP, and the last CCh perfusion (p>0.05). The integrated ΔF/F0 responses induced by the first CCh perfusion, CCh in the presence of 2MeSADP, and the last CCh perfusion were 160.26 ± 12.12, 165.11 ± 10.95, and 161.52 ± 11.92, respectively (Fig. 8D). No significant differences were observed between integrated ΔF/F0 values induced by first perfusion of CCh, CCh combined with 2MeSADP, and the last perfusion of CCh (p>0.05).
Figure 8.

The carbachol (CCh)-induced [Ca2+]i response recorded from chromaffin cells in the presence of 2-methylthioadenosine diphosphate trisodium (2MeSADP). Time courses of ΔF/F0 for the chromaffin cell response to CCh in the presence of the P2Y1, P2Y12, and P2Y13 purinoceptor agonist 2MeSADP in different adrenal medullary slices (Panels A and B). The perfusion periods of CCh and 2MeSADP are shown in red and blue regions, respectively. The increase in ΔF/F0 induced by CCh is inhibited by 2MeSADP in the cell indicated by a red-colored trace in Panel A, enhanced in the cell indicated by a black-colored trace in Panel B, and unchanged in cells indicated by other color traces in Panels A and B. Bar graphs summarize the peak ΔF/F0 values (Panel C) and the integrated ΔF/F0 responses (Panel D) induced by the first CCh perfusion, CCh in the presence of 2MeSADP, and the last CCh perfusion.
Finally, we examined whether P2Y1 purinoceptors are involved in the modulation of CCh-induced [Ca2+]i response in chromaffin cells using 2MeSADP and the selective P2Y1 purinoceptor antagonist MRS2179 (Fig. 9). The initial perfusion of CCh (100 µM) for 10 sec induced a transient ΔF/F0 increase in chromaffin cells, and CCh-induced responses were partially or almost completely inhibited in the presence of 2MeSADP (10 µM) combined with MRS2179 (10 µM) in some cells (Fig. 9A), but not in others (Fig. 9B). In the presence of 2MeSADP (100 µM) and MRS2179 (100 µM), CCh-induced responses in chromaffin cells were more suppressed than those at 10 µM (data not shown). The peak value of the CCh-induced ΔF/F0 response was partially recovered by the last single perfusion of CCh (Fig. 9A and B). A reduction in the peak ΔF/F0 value induced by CCh in the presence of 2MeSADP and MRS2179 was observed in 32 (29.4%) of 109 cells (Fig. 9C; n=4). However, an enhancement in the CCh-induced peak ΔF/F0 value in the presence of 2MeSADP and MRS2179 was not observed. The peak ΔF/F0 values induced by the first CCh perfusion, CCh in the presence of 2MeSADP and MRS2179, and the last CCh perfusion were 3.82 ± 0.18, 2.92 ± 0.19, and 3.60 ± 0.20, respectively (Fig. 9C). The peak ΔF/F0 value induced by CCh combined with 2MeSADP and MRS2179 was significantly lower than that of the first and last perfusions of CCh (p<0.05). However, no significant differences were observed between peak ΔF/F0 values induced by the first and last perfusions of CCh (p>0.05). The integrated ΔF/F0 responses induced by the first CCh perfusion, CCh in the presence of 2MeSADP and MRS2179, and the last CCh perfusion were 180.29 ± 13.78, 121.54 ± 13.93, and 160.73 ± 14.68, respectively (Fig. 9D). The integrated ΔF/F0 response induced by CCh combined with ADP was significantly lower than that of the first and last perfusions of CCh (p<0.05). No significant differences were observed between integrated ΔF/F0 responses induced by the first and last perfusion of CCh (p>0.05).
Figure 9.

The carbachol (CCh)-induced [Ca2+]i response recorded from chromaffin cells in the presence of 2-methylthioadenosine diphosphate trisodium salt (2MeSADP) and MRS2179. Time courses of ΔF/F0 for the chromaffin cell response to CCh in the presence of 2MeSADP and the P2Y1 purinoceptor antagonist MRS2179 (Panels A and B). The perfusion periods of CCh and 2MeSADP together with MRS2179 are shown in red and blue regions, respectively. The increase in ΔF/F0 induced by CCh is potently or almost completely inhibited by 2MeSADP together with MRS2179 in some cells (Panel A), but not in others (Panel B). Bar graphs summarize the peak ΔF/F0 values (Panel C) and the integrated ΔF/F0 responses (Panel D) induced by the first CCh perfusion, CCh in the presence of 2MeSADP with MRS2179, and the last CCh perfusion. *Significantly different from the first and last perfusions of CCh (p<0.05, one-way ANOVA in Panel C and Kruskal–Wallis test in Panel D).
Expression of mRNAs for ADP-selective Purinoceptors in the Adrenal Medulla
RT-PCR detected mRNA amplification products for P2Y1, P2Y12, and P2Y13 purinoceptors in extracts of the adrenal medulla (Fig. 10). PCR-amplified products for β-actin as an internal control were also detected. No PCR products were detected in samples without mRNA.
Figure 10.
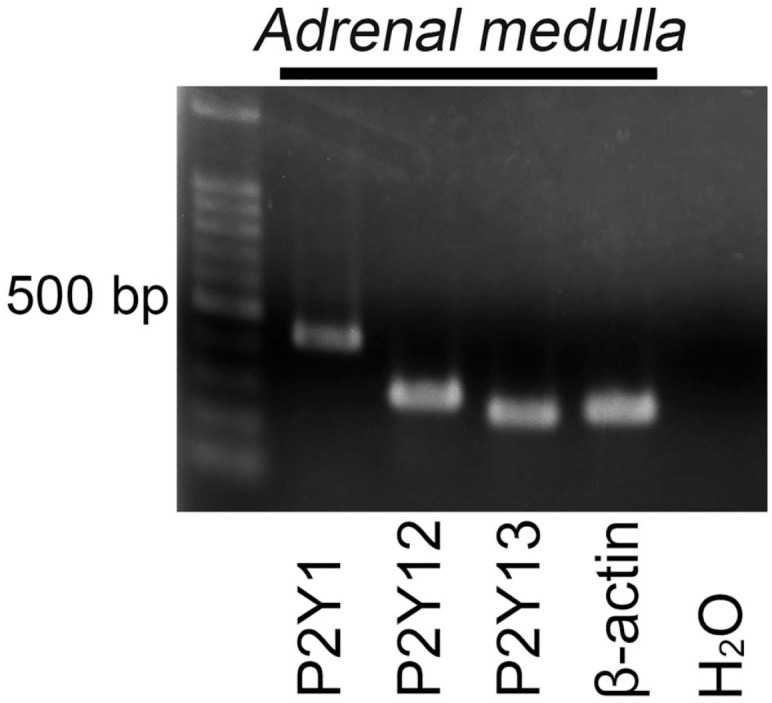
Reverse transcriptase-polymerase chain reaction (RT-PCR) analysis of mRNAs for adenosine 5′-diphosphate-selective purinoceptors in the adrenal medulla. PCR-amplified products for P2Y1, P2Y12, and P2Y13 purinoceptors are detected in the extracts of the adrenal medulla. PCR-amplified products are not detected in the negative control. The expected band sizes (bp) of the PCR products are as follows: P2Y1 (433), P2Y12 (295), P2Y13 (260), and β-actin (276).
Discussion
NTPDase2-immunoreactive Cells in the Rat Adrenal Medulla
The present results demonstrated that NTPDase2-immunoreactive cells surrounded VMAT2-immunopositive chromaffin cells more densely than VMAT2-immunonegative chromaffin cells. Because VMAT2-immunopositive chromaffin cells have been reported as NA-cells, 19 NTPDase2-immunoreactive cells appear to densely surround NA-cells, and their distribution pattern was consistent with previous histological observations of sustentacular cells in the rat adrenal medulla. 4 Furthermore, NTPDase2-immunoreactive cells were immunoreactive for GFAP and S100B, markers of sustentacular cells.2,4 These results indicate that NTPDase2-immunoreactive cells are sustentacular cells. Sustentacular cells may express NTPDase2 in their cell membrane to degrade extracellular ATP in the rat adrenal medulla. On the other hand, chromaffin cells without NTPDase2 immunoreactivity indicate that these cells do not express NTPDase2 in the rat adrenal medulla, and that the present results are not consistent with previous reports of NTPDase expression in pig adrenal chromaffin cells 25 and ecto-ATPase activity in cultured bovine chromaffin cells. 26 The expression of NTPDase2 in adrenal chromaffin cells may be different between animal species.
NTPDase2-immunoreactive cells surrounding VNUT-immunoreactive chromaffin cells suggest that NTPDase2 in sustentacular cells degrades ATP released by exocytosis from chromaffin cells. The denser distribution of NTPDase2-immunoreactive cells to VMAT2-immmunopositive cells than to VMAT2-immunonegative cells suggests that NTPDase2 breaks down ATP released from NA-cells more than from A-cells. Moreover, P2Y12 immunoreactivity was localized in VNUT-immunoreactive chromaffin cells surrounded by NTPDase2-immunoreactive cells. Thus, sustentacular cells may hydrolyze extracellular ATP to ADP by NTPDase2 and simultaneously facilitate ADP-mediated activation of P2Y12 purinoceptors expressed in chromaffin cells. The localization of P2Y12 immunoreactivity to the adrenal medulla suggests that ADP activating these receptors derived from parenchymal cells rather than the blood stream. Therefore, ADP metabolized from ATP by NTPDase2 in sustentacular cells may play a local modulatory role in the function of chromaffin cells via P2Y12 purinoceptors. Adrenal chromaffin cells may also release ADP to activate P2Y12 purinoceptors in an autocrine–paracrine manner, as VNUT preferentially recognized ADP and ATP as transport substrates. 24 However, chromaffin granules purified from the cow adrenal medulla have been reported to contain ADP at approximately less than one tenth concentration of ATP. 27 P2Y12 purinoceptors may be activated by ADP degraded from ATP by NTPDase2 in sustentacular cells, rather than ADP released from chromaffin cells.
The results of ATP bioluminescence assays suggest that functional NTPDases are expressed in the adrenal medulla. NTPDase2 immunoreactivity in sustentacular cells indicates that these cells contribute at least to the degradation of ATP in tissue. POM-1 shows minor selectivity for NTPDase2, 28 whereas ARL67156 selectively inhibits NTPDases.21,22 The greater inhibition of extracellular ATP degradation by ARL67156 than POM-1 may be attributed to differences in the selectivity for NTPDase2 expressed in sustentacular cells. The breakdown of extracellular ATP was not completely inhibited by NTPDase inhibitors, suggesting that the adrenal medulla also contains other extracellular ATP-degrading enzymes, such as ecto-alkaline phosphatase and ectonucleotide pyrophosphatase/phosphodiesterase.29,30
P2Y Purinoceptor-mediated Modulation of [Ca2+]i Responses in Chromaffin Cells
The present results revealed that ADP decreased the CCh-induced [Ca2+]i response in a part of chromaffin cells. Because ACh released from preganglionic sympathetic nerve terminals activates nicotinic ACh receptors on chromaffin cells,31,32 ADP metabolized from ATP by NTPDase2 in sustentacular cells may mainly inhibit the excitability of these cells stimulated by sympathetic nerve terminals. Furthermore, the results with ADP and AZD1283 suggest that P2Y12 purinoceptors mediate the inhibitory effect of ADP on chromaffin cell excitation. Electrophysiological studies have reported that the activation of P2Y12 purinoceptors inhibits voltage-gated Ca2+ channels and subsequent exocytosis in cultured bovine chromaffin cells.16,17 The activation of P2Y12 purinoceptors has also been shown to inhibit quantal catecholamine release through the direct interaction of G protein Giβγ subunits with exocytosis fusion proteins in adrenal chromaffin cells. 15 These findings suggest that ADP binds to P2Y12 purinoceptors to decrease catecholamine release from chromaffin cells via the inhibition of Ca2+ currents and activation of the Giβγ signaling pathway. However, ATP had a smaller effect on CCh-induced [Ca2+]i responses in chromaffin cells than ADP, suggesting that their excitability is less modulated by ATP released from them. Because ADP is shown to be 10-fold more potent than ATP at the rat P2Y12 purinoceptors, 33 the activation of these receptors in chromaffin cells may be mainly mediated by ADP degraded from ATP by NTPDase2 in sustentacular cells.
The results of CCh-induced [Ca2+]i responses in chromaffin cells following 2MeSADP with or without MRS2179 suggest that P2Y purinoceptors other than P2Y12 also contribute to the ADP-mediated inhibition of their excitability. Because P2Y13 is a Gi protein-coupled receptor with a high affinity for ADP that shares a high sequence homology with P2Y12, 34 the ADP-induced inhibition of chromaffin cell excitation may be mediated via the activation of P2Y12 as well as P2Y13 purinoceptors. It is speculated that P2Y12 and P2Y13 purinoceptors mediate the inhibitory regulation of ADP on the catecholamine release from chromaffin cells. The results of 2MeSADP with MRS2179 also suggest that the activation of P2Y1 purinoceptors is involved in the enhancement of the excitability of chromaffin cells. RT-PCR confirmed mRNA expression of P2Y1, P2Y12, and P2Y13 purinoceptors in the adrenal medulla. Therefore, the excitability of chromaffin cells may be fine-tuned by a balance between P2Y1-mediated excitatory and P2Y12/P2Y13-mediated inhibitory modulations, which are activated by ADP. Because P2Y1 and P2Y12/P2Y13 purinoceptors are coupled to different G proteins, it is speculated that there is crosstalk between the intracellular signaling pathways of P2Y1 and P2Y12/P2Y13 purinoceptors in chromaffin cells. Further studies of P2Y1 and P2Y13 purinoceptors are needed to clarify the purinergic modulation of chromaffin cells.
The possible ADP-mediated functional relationship between NTPDase2-expressing sustentacular cells and chromaffin cells in the rat adrenal medulla is shown in a schematic representation (Fig. 11). Sustentacular cells may break down ATP released from chromaffin cells into ADP by NTPDase2. The ADP may be involved in the local feedback regulation of catecholamine release from chromaffin cells via P2Y12 as well as P2Y1 and P2Y13 purinoceptors during preganglionic sympathetic stimuli.
Figure 11.

A schematic representation of the possible adenosine 5′-diphosphate (ADP)-mediated functional relationship between ectonucleoside triphosphate diphosphohydrolase 2 (NTPDase2)-expressing sustentacular cells and chromaffin cells in the rat adrenal medulla. Preganglionic sympathetic nerve terminals release acetylcholine (Ach) to increase [Ca2+]i and subsequent exocytosis of catecholamine and adenosine 5′-triphosphate (ATP) from chromaffin cells. ATP is degraded into ADP by NTPDase2 in sustentacular cells. ADP locally modulates exocytosis from chromaffin cells by the inhibition of [Ca2+]i increase via P2Y12 and P2Y13 purinoceptors and/or the enhancement of it via P2Y1 purinoceptors.
Appendix Figure 1.

A preabsorption test of the anti-P2Y12 antibody in the adrenal medulla. Sections immunolabeled by a preabsorbed antibody for P2Y12 (red; Panels A and B). No immunoreactivity for P2Y12 is observed in any region of adrenal chromaffin cells in the preabsorption control (Panel A). Differential interference contrast (DIC) image of the same section as in Panel A (Panel B). Nuclei are labeled by 4′,6-diamidino-2-phenylindole (blue). (“Bar A and B = 10 µm.”)
Appendix Figure 2.

Adrenal medullary slices used in intracellular calcium imaging. Stereomicroscopic image of adrenal medullary slices (Panel A). Parts of the adrenal cortex (Co) are associated with the medulla. Bright-field microscopic image of the medulla in Panel A (Panel B). Cell clusters consisting of spherical or oval adrenal chromaffin cells are clearly identified. (“Bar A = 500 µm; bar B = 50 µm.”)
Footnotes
The author(s) declared no potential conflicts of interest with respect to the research, authorship, and/or publication of this article.
Author Contributions: All authors have contributed to this article as follows: planning (TY), immunohistochemistry (SM, TY, YY, MH), ATP bioluminescence assay (SM, TY, MH, HS), intracellular calcium imaging (SM, TY, WS), RT-PCR (SM, TY), data analysis (SM, TY), interpretation of the data (SM, TY, YY, KS, TS), drafting the manuscript (SM), review and editing of the manuscript (TY, YY, TS). All authors have read and approved the final manuscript.
Funding: The author(s) disclosed receipt of the following financial support for the research, authorship, and/or publication of this article: This work was partially supported by grant JP22K06813 from the Japan Society for the Promotion of Science to Takuya Yokoyama.
ORCID iDs: Takuya Yokoyama  https://orcid.org/0000-0003-3384-0623
Tomoyuki Saino
https://orcid.org/0000-0001-6360-9516
Data Availability: The data that support the findings of this study are available from the corresponding author upon reasonable request.
Contributor Information
Satsuki Maesawa, Division of Dental Anesthesiology, Department of Reconstructive Oral and Maxillofacial Surgery, School of Dentistry, Iwate Medical University, Yahaba, Japan.
Takuya Yokoyama, Laboratory of Veterinary Anatomy and Cell Biology, Faculty of Agriculture, Iwate University, Morioka, Japan.
Wakana Sakanoue, Division of Dental Anesthesiology, Department of Reconstructive Oral and Maxillofacial Surgery, School of Dentistry, Iwate Medical University, Yahaba, Japan.
Yoshio Yamamoto, Laboratory of Veterinary Anatomy and Cell Biology, Faculty of Agriculture, Iwate University, Morioka, Japan.
Masato Hirakawa, Department of Anatomy (Cell Biology), Iwate Medical University, Yahaba, Japan.
Hirohisa Shiraishi, Division of Pharmaceutical Education, Department of Clinical Pharmacy, School of Pharmacy, Iwate Medical University, Yahaba, Japan.
Kenichi Sato, Division of Dental Anesthesiology, Department of Reconstructive Oral and Maxillofacial Surgery, School of Dentistry, Iwate Medical University, Yahaba, Japan.
Tomoyuki Saino, Department of Anatomy (Cell Biology), Iwate Medical University, Yahaba, Japan.
Literature Cited
- 1. Díaz-Flores L, Gutiérrez R, Varela H, Valladares F, Alvarez-Argüelles H, Borges R. Histogenesis and morphofunctional characteristics of chromaffin cells. Acta Physiol (Oxf). 2008;192(2):145–63. [DOI] [PubMed] [Google Scholar]
- 2. Ahmed AM. Immunohistochemical study of sustentacular cells in adrenal medulla of neonatal and adult rats using an antibody against S-100 protein. Folia Morphol (Warsz). 2017;76(2):246–51. [DOI] [PubMed] [Google Scholar]
- 3. Cocchia D, Michetti F. S-100 antigen in satellite cells of the adrenal medulla and the superior cervical ganglion of the rat. An immunochemical and immunocytochemical study. Cell Tissue Res. 1981;215:103–12. [DOI] [PubMed] [Google Scholar]
- 4. Suzuki T, Kachi T. Immunohistochemical studies on supporting cells in the adrenal medulla and pineal gland of adult rat, especially on S-100 protein, glial fibrillary acidic protein and vimentin. Kaibogaku Zasshi. 1995;70(2):130–9. [PubMed] [Google Scholar]
- 5. Aunis D. Exocytosis in chromaffin cells of the adrenal medulla. Int Rev Cytol. 1998;181:213–320. [DOI] [PubMed] [Google Scholar]
- 6. García AG, García-De-Diego AM, Gandía L, Borges R, García-Sancho J. Calcium signaling and exocytosis in adrenal chromaffin cells. Physiol Rev. 2006;86(4):1093–131. [DOI] [PubMed] [Google Scholar]
- 7. Livett BG. Chromaffin cells: roles for vesicle proteins and Ca2+ in hormone secretion and exocytosis. Trends Pharmacol Sci. 1993;14:345–48. [DOI] [PubMed] [Google Scholar]
- 8. Zhang Q, Liu B, Wu Q, Liu B, Li Y, Sun S, Wang Y, Wu X, Chai Z, Jiang X, Liu X, Hu M, Wang Y, Yang Y, Wang L, Kang X, Xiong Y, Zhou Y, Chen X, Zheng L, Zhang B, Wang C, Zhu F, Zhou Z. Differential co-release of two neurotransmitters from a vesicle fusion pore in mammalian adrenal chromaffin cells. Neuron. 2019;102:173–83.e4. [DOI] [PubMed] [Google Scholar]
- 9. He M-L, Gonzalez-Iglesias AE, Stojilkovic SS. Role of nucleotide P2 receptors in calcium signaling and prolactin release in pituitary lactotrophs. J Biol Chem. 2003;278:46270–77. [DOI] [PubMed] [Google Scholar]
- 10. Amisten S, Meidute-Abaraviciene S, Tan C, Olde B, Lundquist I, Salehi A, Erlinge D. ADP mediates inhibition of insulin secretion by activation of P2Y13 receptors in mice. Diabetologia. 2010;53(9):1927–34. [DOI] [PubMed] [Google Scholar]
- 11. Lechner SG, Dorostkar MM, Mayer M, Edelbauer H, Pankevych H, Boehm S. Autoinhibition of transmitter release from PC12 cells and sympathetic neurons through a P2Y12 receptor-mediated inhibition of voltage-gated Ca2+ channels. Eur J Neurosci. 2004;20:2917–28. [DOI] [PubMed] [Google Scholar]
- 12. Robson SC, Sévigny J, Zimmermann H. The E-NTPDase family of ectonucleotidases: structure function relationships and pathophysiological significance. Purinergic Sign. 2006;2(2):409–30. [DOI] [PMC free article] [PubMed] [Google Scholar]
- 13. Zimmermann H, Zebisch M, Sträter N. Cellular function and molecular structure of ecto-nucleotidases. Purinergic Signal. 2012;8(3):437–502. [DOI] [PMC free article] [PubMed] [Google Scholar]
- 14. Jacobson KA, Delicado EG, Gachet C, Kennedy C, von Kügelgen I, Li B, Miras-Portugal MT, Novak I, Schöneberg T, Perez-Sen R, Thor D, Wu B, Yang Z, Müller CE. Update of P2Y receptor pharmacology: IUPHAR review 27. Br J Pharmacol. 2020;177(11):2413–33. [DOI] [PMC free article] [PubMed] [Google Scholar]
- 15. Zhang Q, Liu B, Li Y, Yin L, Younus M, Jiang X, Lin Z, Sun X, Huang R, Liu B, Wu Q, Zhu F, Zhou Z. Regulating quantal size of neurotransmitter release through a GPCR voltage sensor. Proc Natl Acad Sci USA. 2020;117:26985–95. [DOI] [PMC free article] [PubMed] [Google Scholar]
- 16. Ennion SJ, Powell AD, Seward EP. Identification of the P2Y12 receptor in nucleotide inhibition of exocytosis from bovine chromaffin cells. Mol Pharmacol. 2004;66(3):601–11. [DOI] [PubMed] [Google Scholar]
- 17. Powell AD, Teschemacher AG, Seward EP. P2Y purinoceptors inhibit exocytosis in adrenal chromaffin cells via modulation of voltage-operated calcium channels. J Neurosci. 2000;20:606–16. [DOI] [PMC free article] [PubMed] [Google Scholar]
- 18. Yokoyama T, Yamamoto Y, Saino T. Serotonin-mediated modulation of acetylcholine-induced intracellular calcium responses in chromaffin cells isolated from the rat adrenal medulla. Neurosci Lett. 2017;644:114–20. [DOI] [PubMed] [Google Scholar]
- 19. Tillinger A, Sollas A, Serova LI, Kvetnansky R, Sabban EL. Vesicular monoamine transporters (VMATs) in adrenal chromaffin cells: stress-triggered induction of VMAT2 and expression in epinephrine synthesizing cells. Cell Mol Neurobiol. 2010;30(8):1459–65. [DOI] [PMC free article] [PubMed] [Google Scholar]
- 20. Moriyama Y, Hiasa M, Sakamoto S, Omote H, Nomura M. Vesicular nucleotide transporter (VNUT): appearance of an actress on the stage of purinergic signaling. Purinergic Signal. 2017;13(3):387–404. [DOI] [PMC free article] [PubMed] [Google Scholar]
- 21. Burnstock G. Purinergic signalling in endocrine organs. Purinergic Signal. 2014;10(1):189–231. [DOI] [PMC free article] [PubMed] [Google Scholar]
- 22. Crack BE, Pollard CE, Beukers MW, Roberts SM, Hunt SF, Ingall AH, McKechnie KC, IJzerman AP, Leff P. Pharmacological and biochemical analysis of FPL 67156, a novel, selective inhibitor of ecto-ATPase. Br J Pharmacol. 1995;114(2):475–81. [DOI] [PMC free article] [PubMed] [Google Scholar]
- 23. Verhofstad AA, Coupland RE, Parker TR, Goldstein M. Immunohistochemical and biochemical study on the development of the noradrenaline- and adrenaline-storing cells of the adrenal medulla of the rat. Cell Tissue Res. 1985;242(2):233–43. [DOI] [PubMed] [Google Scholar]
- 24. Sawada K, Echigo N, Juge N, Miyaji T, Otsuka M, Omote H, Yamamoto A, Moriyama Y. Identification of a vesicular nucleotide transporter. Proc Natl Acad Sci USA. 2008;105:5683–5686. [DOI] [PMC free article] [PubMed] [Google Scholar]
- 25. Benrezzak O, Grondin G, Proulx J, Rousseau E, D’Orléans-Juste P, Beaudoin AR. Characterization and immunohistochemical localization of nucleoside triphosphate diphosphohydrolase (NTPDase) in pig adrenal glands (presence of a non-sedimentable isoform). Biochim Biophys Acta. 2000;1524:94–101. [DOI] [PubMed] [Google Scholar]
- 26. Drakulich DA, Spellmon C, Hexum TD. Effect of the ecto-ATPase inhibitor, ARL 67156, on the bovine chromaffin cell response to ATP. Eur J Pharmacol. 2004;485:137–40. [DOI] [PubMed] [Google Scholar]
- 27. Hillarp NA. Adenosinephosphates and inorganic phosphate in the adrenaline and noradrenaline containing granules of the adrenal medulla. Acta Physiol Scand. 1958;42:321–32. [DOI] [PubMed] [Google Scholar]
- 28. Wall MJ, Wigmore G, Lopatár J, Frenguelli BG, Dale N. The novel NTPDase inhibitor sodium polyoxotungstate (POM-1) inhibits ATP breakdown but also blocks central synaptic transmission, an action independent of NTPDase inhibition. Neuropharmacology. 2008;55(7):1251–8. [DOI] [PubMed] [Google Scholar]
- 29. Borza R, Salgado-Polo F, Moolenaar WH, Perrakis A. Structure and function of the ecto-nucleotide pyrophosphatase/phosphodiesterase (ENPP) family: tidying up diversity. J Biol Chem. 2022;298(2):101526. [DOI] [PMC free article] [PubMed] [Google Scholar]
- 30. Matsuoka I, Ohkubo S. ATP- and adenosine-mediated signaling in the central nervous system: adenosine receptor activation by ATP through rapid and localized generation of adenosine by ecto-nucleotidases. J Pharmacol Sci. 2004;94(2):95–9. [DOI] [PubMed] [Google Scholar]
- 31. Appel NM, Elde RP. The intermediolateral cell column of the thoracic spinal cord is comprised of target-specific subnuclei: evidence from retrograde transport studies and immunohistochemistry. J Neurosci. 1988;8:1767–1775. [DOI] [PMC free article] [PubMed] [Google Scholar]
- 32. de Diego AM, Gandía L, García AG. A physiological view of the central and peripheral mechanisms that regulate the release of catecholamines at the adrenal medulla. Acta Physiol. 2008;192(2):287–301. [DOI] [PubMed] [Google Scholar]
- 33. Simon J, Filippov AK, Goransson S, Wong YH, Frelin C, Michel AD, Brown DA, Barnard EA. Characterization and channel coupling of the P2Y12 nucleotide receptor of brain capillary endothelial cells. J Biol Chem. 2002;277:31390–400. [DOI] [PubMed] [Google Scholar]
- 34. Marteau F, Le Poul E, Communi D, Communi D, Labouret C, Savi P, Boeynaems JM, Gonzalez NS. Pharmacological characterization of the human P2Y13 receptor. Mol Pharmacol. 2003;64(1):104–12. [DOI] [PubMed] [Google Scholar]